Article

Study on the Coupling Development of Industry, City and Population in the Yellow River Basin from the Perspective of Green Economy

College of Economics, Shandong Normal University, Jinan 250358, China
*
Author to whom correspondence should be addressed.
Sustainability 2023, 15(13), 10029; https://doi.org/10.3390/su151310029
Submission received: 31 May 2023 / Revised: 19 June 2023 / Accepted: 23 June 2023 / Published: 25 June 2023

Abstract

:
Based on the perspective of green economy, we established an index system to evaluate industry, city and population, and obtained data from 78 cities in the Yellow River Basin from 2011 to 2020. The entropy weight method, coupling model, kernel density analysis and exploratory data analysis methods were used to analyze the coupling coordination degree and spatio-temporal differentiation characteristics of industry, city and population in the Yellow River Basin. We constructed a Tobit model to analyze the influencing factors. The results show that from the perspective of green economy, the coupling coordination degree of industry, city and population in the Yellow River Basin has improved continuously. Among them, the coupling coordination degree of Shandong Peninsula and provincial capital cities is high, but the coupling coordination degree of some areas in the middle and upper reaches of the Yellow River is low due to human capital factors. The Yellow River Basin should strengthen environmental control, optimize government regulation, guide the inflow of foreign capital and develop green finance to promote the coupling development of industry, city and population.

1. Introduction

The Twenty Tenth Report identified high-quality development as the primary task of building a modern socialist country in a comprehensive manner, highlighted that the quality of development has a more important strategic position than the speed of development. The Implementation Plan for Ecological Protection and High-Quality Development Innovation in the Yellow River Basin points out that the Yellow River Basin has been facing serious water shortage and fragile ecological environment for a long time, and there is an urgent need to promote green economic transformation in the Yellow River Basin. Compared with the traditional economy, the green economy emphasizes more on environmental benefits, takes environmental protection and effective use of resources as important criteria to measure its effectiveness, contains features such as reasonable consumption, green innovation, energy saving, emission reduction, and increasing ecological capital [1]. The Yellow River Basin plays a pivotal role in China’s economic development and ecological protection [2], General Secretary Xi Jinping has repeatedly emphasized the need to promote ecological protection and high-quality development in the Yellow River Basin, which requires the Yellow River Basin to accumulate human capital, develop ecological industries, optimize urban environment and achieve continuous improvement of green development level with population as the basis, city as the carrier and industry as the grasp.
In the context of green economy, many scholars have researched industrial greening, urban greening and human capital optimization, and have achieved fruitful results. Financial innovation can promote green innovation and facilitate the development of green industries [3], an index system can be established to evaluate the level of industrial greening in terms of economic growth, environmental friendliness and social stability [4]. There is a coupling relationship between smart city and green city, green city and smart city can become a framework for urban development [5], an index system can be established in terms of economic development, social welfare and resource consumption to evaluate green cities [6]. High levels of human capital can promote regional green economic development, while low levels of human capital can inhibit regional green economic development, local governments should introduce policies to optimize the human capital structure to promote regional green development [7], the level of human capital can be evaluated using indicators such as the number of people with higher education [8]. In fact, there is a reinforcing and constraining relationship between human capital, green industries and green cities. Human capital is an important driver of green economy [9], improving human capital structure helps to improve green production efficiency [10], form a social culture of protecting ecological environment, which in turn stimulates green consumption and green production, green human capital has a positive impact on energy saving, emission reduction and urban environment [11]. Optimizing industrial structure and developing green industries help green city development, green transformation requires a large number of innovative talents, which can promote employment and enhance human capital [12]. The improvement of the ecological environment is conducive to population migration to cities, especially the migration of high-quality talents. Urban environmental pollution causes serious harm to residents’ health [13], increased urban pollution and deteriorating air quality can lead to human capital loss [14,15].
By combing through the relevant literature, it can be found that the research on the relationship between industry, city and population is mostly focused on the integration of industry and city [16,17], although a few scholars focus on the interaction between industry, city and population [18], but there was still a lack of empirical research from the perspective of green economy. Therefore, what is the coupling of industry, city and population from the perspective of green economy? What is the degree of coupling and coordination in the Yellow River Basin? What spatiotemporal characteristics do they exhibit? What is the driving mechanism? To answer these questions, the structure of this article is as follows. The first part is an introduction, introducing relevant research results, coupling relationships, and the significance of this study. The second part is the indicator system and research methods, introducing the evaluation indicator system of industry, city and population under the background of green economy and the research methods used in this article. The third part is the evaluation of coupled development, analyzing the level of coupled development between industry, city and population in the Yellow River Basin. The fourth part is the analysis of spatiotemporal characteristics, analyzing the spatiotemporal changes in the coupled development of industry, city and population in the Yellow River Basin. The fifth part is the analysis of influencing factors, exploring the driving mechanism of the coupled development of industry, city and population in the Yellow River Basin from the perspective of green economy. The sixth part is the conclusion and suggestions, describing the research conclusions and countermeasures of the article. This study aims to provide theoretical reference for the high-quality development of the Yellow River Basin.

2. Indicator System and Research Methodology

2.1. Indicator System

The theory of integrated development of industry, city and population comes from the theory of integrated development of industrialization and urbanization, which puts more emphasis on humanistic thinking in the development process and forms a development mode of integrated development of industry, city and population [18]. Under the background of green economy, industry should realize green transformation development, mainly through the advanced industrial structure, energy saving and emission reduction [4]. Urban development includes the upgrading of urban economic structure, the optimization of ecological environment and the enhancement of social bearing capacity, the improvement of urban ecological environment and air quality is more pursued in the background of green economy [6]. Population development not only includes the increase in population quantity, but also emphasizes the improvement of population quality [8]. In the perspective of green development, we should emphasize the accumulation of green population, which mainly refers to the population and supporting factors that can contribute to the development of green economy.
In this paper, based on the existing research [4,6,8], the evaluation index system of industry, city and population in the context of green economy is reorganized (Table 1). The evaluation indicators of green industry include the proportion of tertiary industry, energy consumption intensity, etc. Using the proportion of tertiary industry to evaluate the level of industrial upgrading, using the per capita gross regional product to evaluate the economic benefits of the industry, using energy consumption intensity, industrial wastewater discharge intensity and other indicators to evaluate the ecological benefits of the industry, the comprehensive utilization rate of general industrial solid waste was used to evaluate the development level of circular economy. Green city evaluation indicators include green coverage rate of built-up areas, sewage treatment rate, etc. Green coverage rate of built-up areas, per capita public green space and number of buses per 10,000 people mainly evaluate the level of green infrastructure construction of a city, the harmless treatment rate of domestic garbage and sewage treatment rate mainly measure the ability of a city to treat pollutants. Per capita domestic electricity consumption and per capita domestic water consumption mainly evaluate the energy efficiency of a city, and the average annual pm 2.5 concentration measures the air quality of a city. The evaluation indicators of green population include per capita expenditure on science and technology, urbanization rate, etc. Per capita expenditure on science and technology, per capita expenditure on education, the number of scientific and technological personnel per 10,000 people, the number of books collected by 100 people in public libraries mainly measure the input structure of a city. The proportion of students in ordinary primary and secondary schools, the urbanization rate, and the proportion of college students in school mainly measure the population structure of a city. The number of 10,000 patent grants mainly measures the innovation benefits of urban high-quality population. The original data were obtained from the China Urban Statistical Yearbook, the statistical yearbooks of each city and the data published by the Bureau of Statistics, the CO2 emissions were calculated by referring to the methods of related studies [19]. The energy consumption intensity is calculated by dividing the energy consumption of the industrial sector by the gross domestic product of the industrial sector, and other intensity indicators are calculated using a similar method. The Yellow River Basin is one of the two major river basin economic zones in China. In view of the rationality of the research scope of the Yellow River Basin and the availability of data, this paper excluded the cities under the jurisdiction of Sichuan Province, the cities in the eastern part of Inner Mongolia Autonomous Region and the cities in the western part with serious data shortage, and finally selected the statistical data from 78 cities in the Yellow River Basin from 2011 to 2020 for research. Some missing data were completed by interpolation.

2.2. Research Methodology

2.2.1. Comprehensive Evaluation Method

Since the indicators have different sizes and units, the polar difference method was used to standardize the indicators without dimension, and the entropy value method was applied to determine the weights of the indicators to ensure the objectivity of the indicator weights [20]. The comprehensive development indexes of industries, cities and population were calculated using the multi-objective linear weighting method with the following formula:
u i   = a = 1 n W a X i a
where u i is the development level score of industry, city or population,   W a is the weight of each indicator, and X i a is the value of each indicator after standardization.

2.2.2. Coupling Model

The coupling model is used to calculate the coupling coordination degree of industry, city and population in the Yellow River Basin to reflect the coupling coordination level of industry, city and population, and the specific formula is
C i = 3 u 1 u 2 u 3 3   / ( u 1   + u 2 + u 3 )
T i = α u 1   + β u 2 + δ u 3
D i = C i × T i
C i is the coupling degree of industry, city and population, which u 1 indicates the evaluation score of industry,   u 2 indicates the evaluation score of city, and u 3 indicates the evaluation score of population, T i indicates the comprehensive coordination index of industry, city and population. α = β = δ = 1/3 since industry, city and population are of equal importance.   D i is the level of coupled and coordinated development of industry, city and population, taking values from 0 to 1. The larger the value, the higher the degree of coupling and coordination. Drawing on related studies [21], the types of coupled coordination of industry, city and population in the Yellow River Basin are classified into five categories: extreme coordination (0.8 < D ≤ 1),high coordination (0.6 < D ≤ 0.8), moderate coordination (0.4 < D ≤ 0.6), low coordination (0.2 < D ≤ 0.4) and extreme dissonance (0 < D ≤ 0.2).

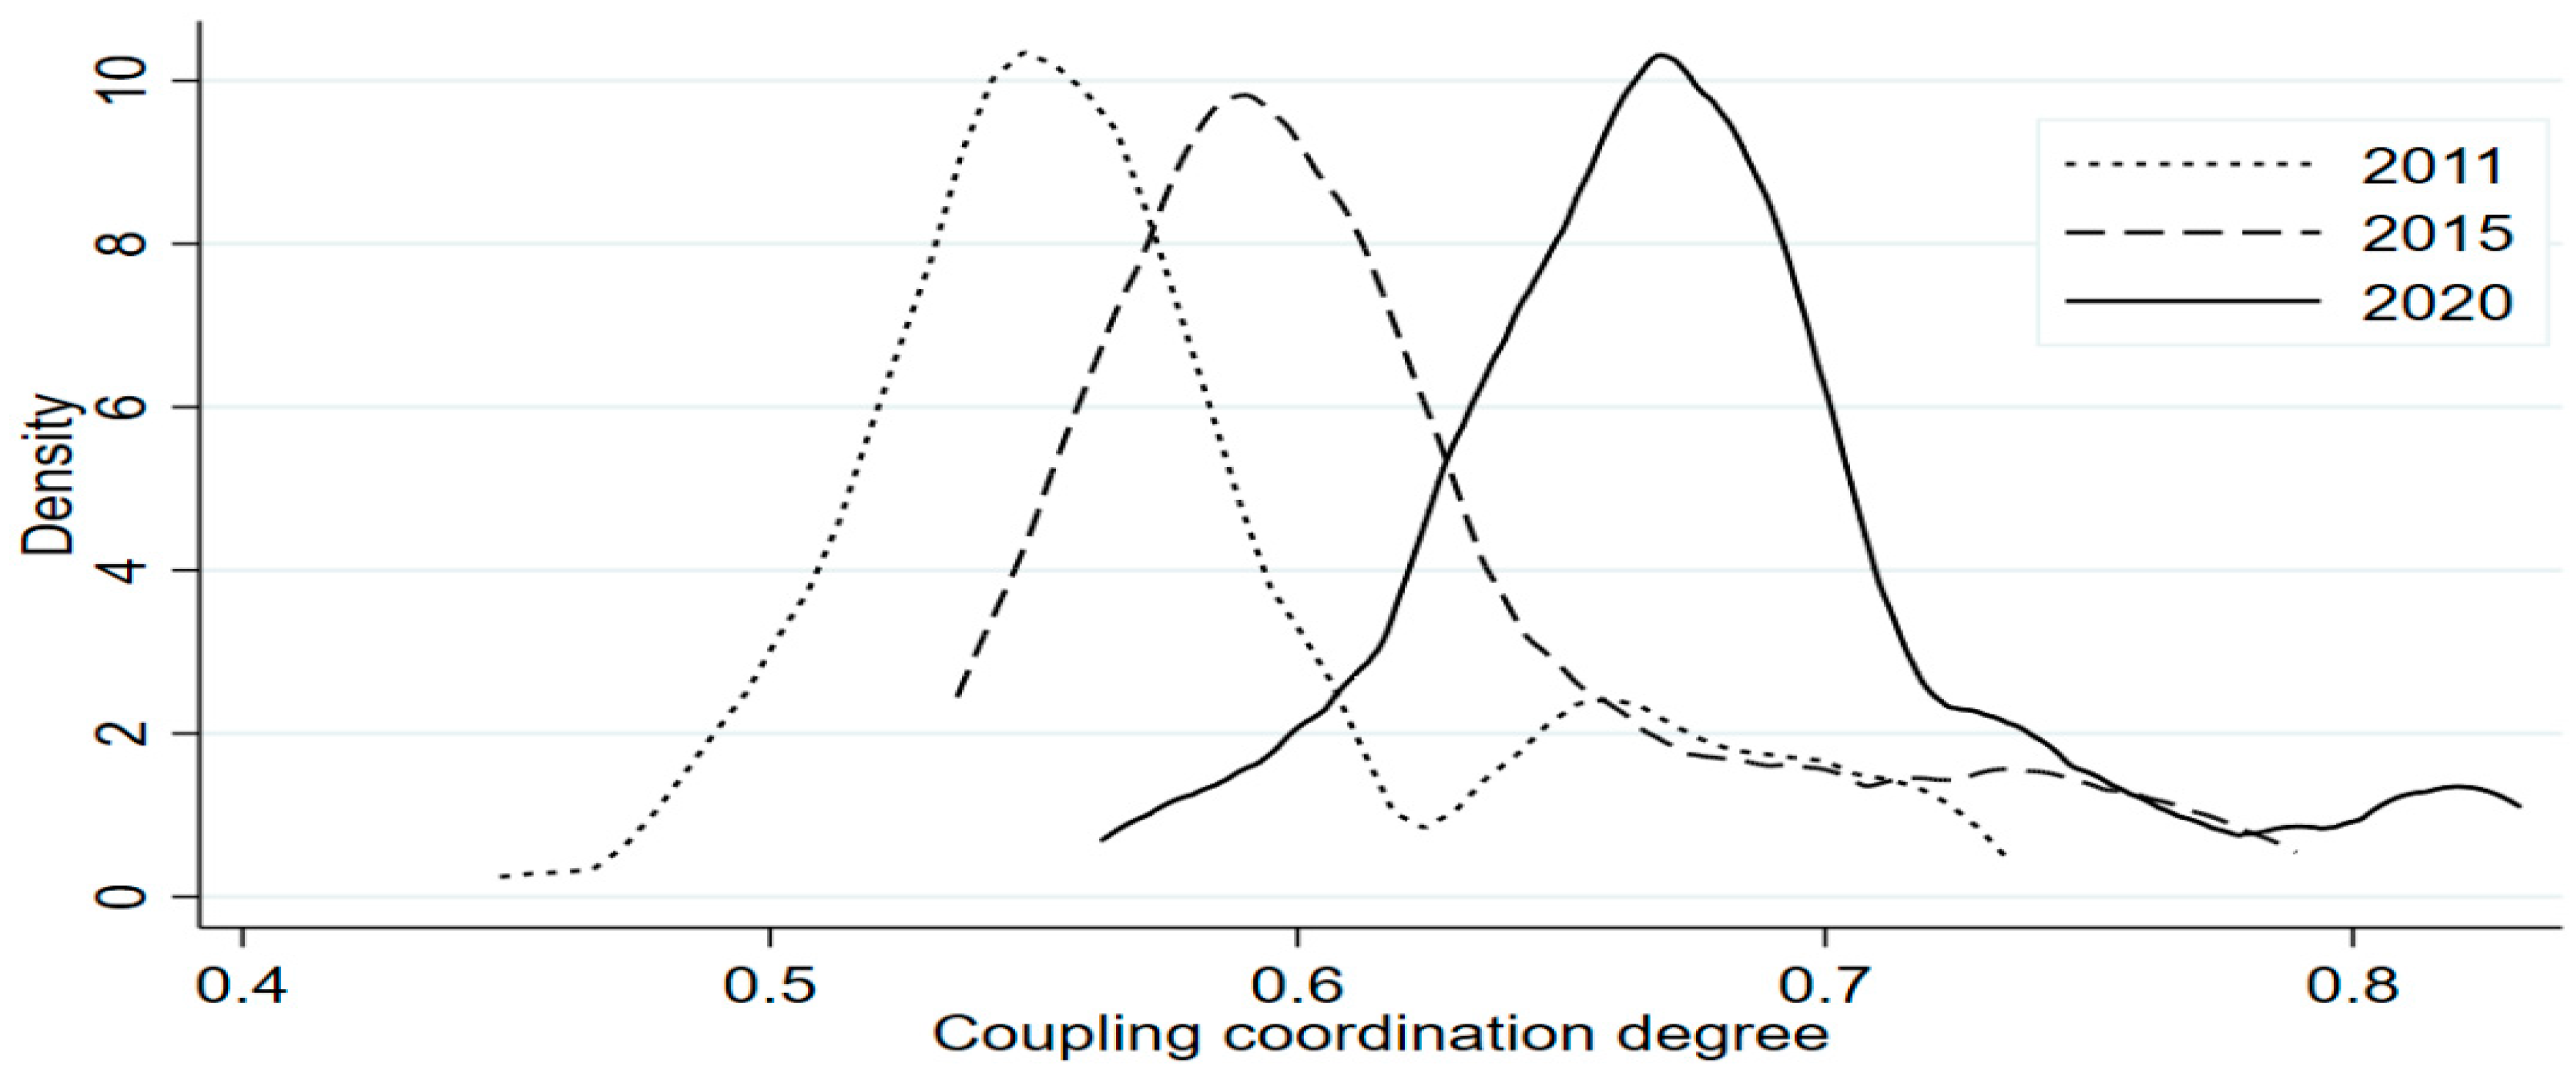
2.2.3. Kernel Density Estimation

Kernel density estimation is a nonparametric estimation method that can describe the distribution of random variables through continuous density curves, and has important applications in the study of spatial distribution disequilibrium. The kernel density estimation is used to demonstrate the degree of development and dynamic evolution of the integration of production, city and population in the Yellow River Basin, to analyze the spatial and temporal changes in the level of coupling coordination based on the location, kurtosis, and shape of the kernel density curve [22].
f ( x ) = 1 N H i = 1 N K ( x i x h )
N represents the number of observations; H represents the bandwidth, which directly affects the accuracy of the kernel density and the smoothness of the kernel density estimation plot; choose a smaller bandwidth generally, but not too small; x i   represents independent and uniformly distributed observations; x represents the mean of the observations. In this paper, we used Gaussian kernel function estimation with the following expression:
K ( x ) = 1 2 π e x p ( x 2 2 )

2.2.4. Exploratory Spatial Data Analysis

The Moran Index is used to analyze the spatial correlation characteristics of industry, city and population coupling development in the Yellow River Basin [23], and the global Moran Index is used to study the spatial correlation degree of the whole Yellow River Basin. The value range of the global Moran index is −1~1, and the zero Moran index indicates that there is no spatial correlation. If the value is positive, it indicates that the coupling development level is positively correlated in space, and the larger the value is, the stronger the positive correlation; if the value is negative, it indicates that there is a negative spatial correlation, and the smaller the negative value is, the more obvious the spatial differentiation characteristics are. Local Moreland index is used to analyze the correlation characteristics between the coupling development level of the city and the coupling development level of the adjacent city.
I = i = 1 n j = 1 n w i j ( D i u ) ( D i u ) s 2 i = 1 n j = 1 n w i j
I i = D i u s 2 j = 1 n w i j ( D j u )
Formula (7) is the calculation formula of the global Moran index, Formula (8) is the calculation formula of the local Moran index, D j is the coupling coordination degree of industry, city and population, u and s 2 is the mean and variance of the coupling coordination degree, respectively, w i j are the elements of the spatial weight matrix, representing the spatial weight between city i and city j .

3. Evaluation of the Coupled Development of Industry, City and Population in the Yellow River Basin

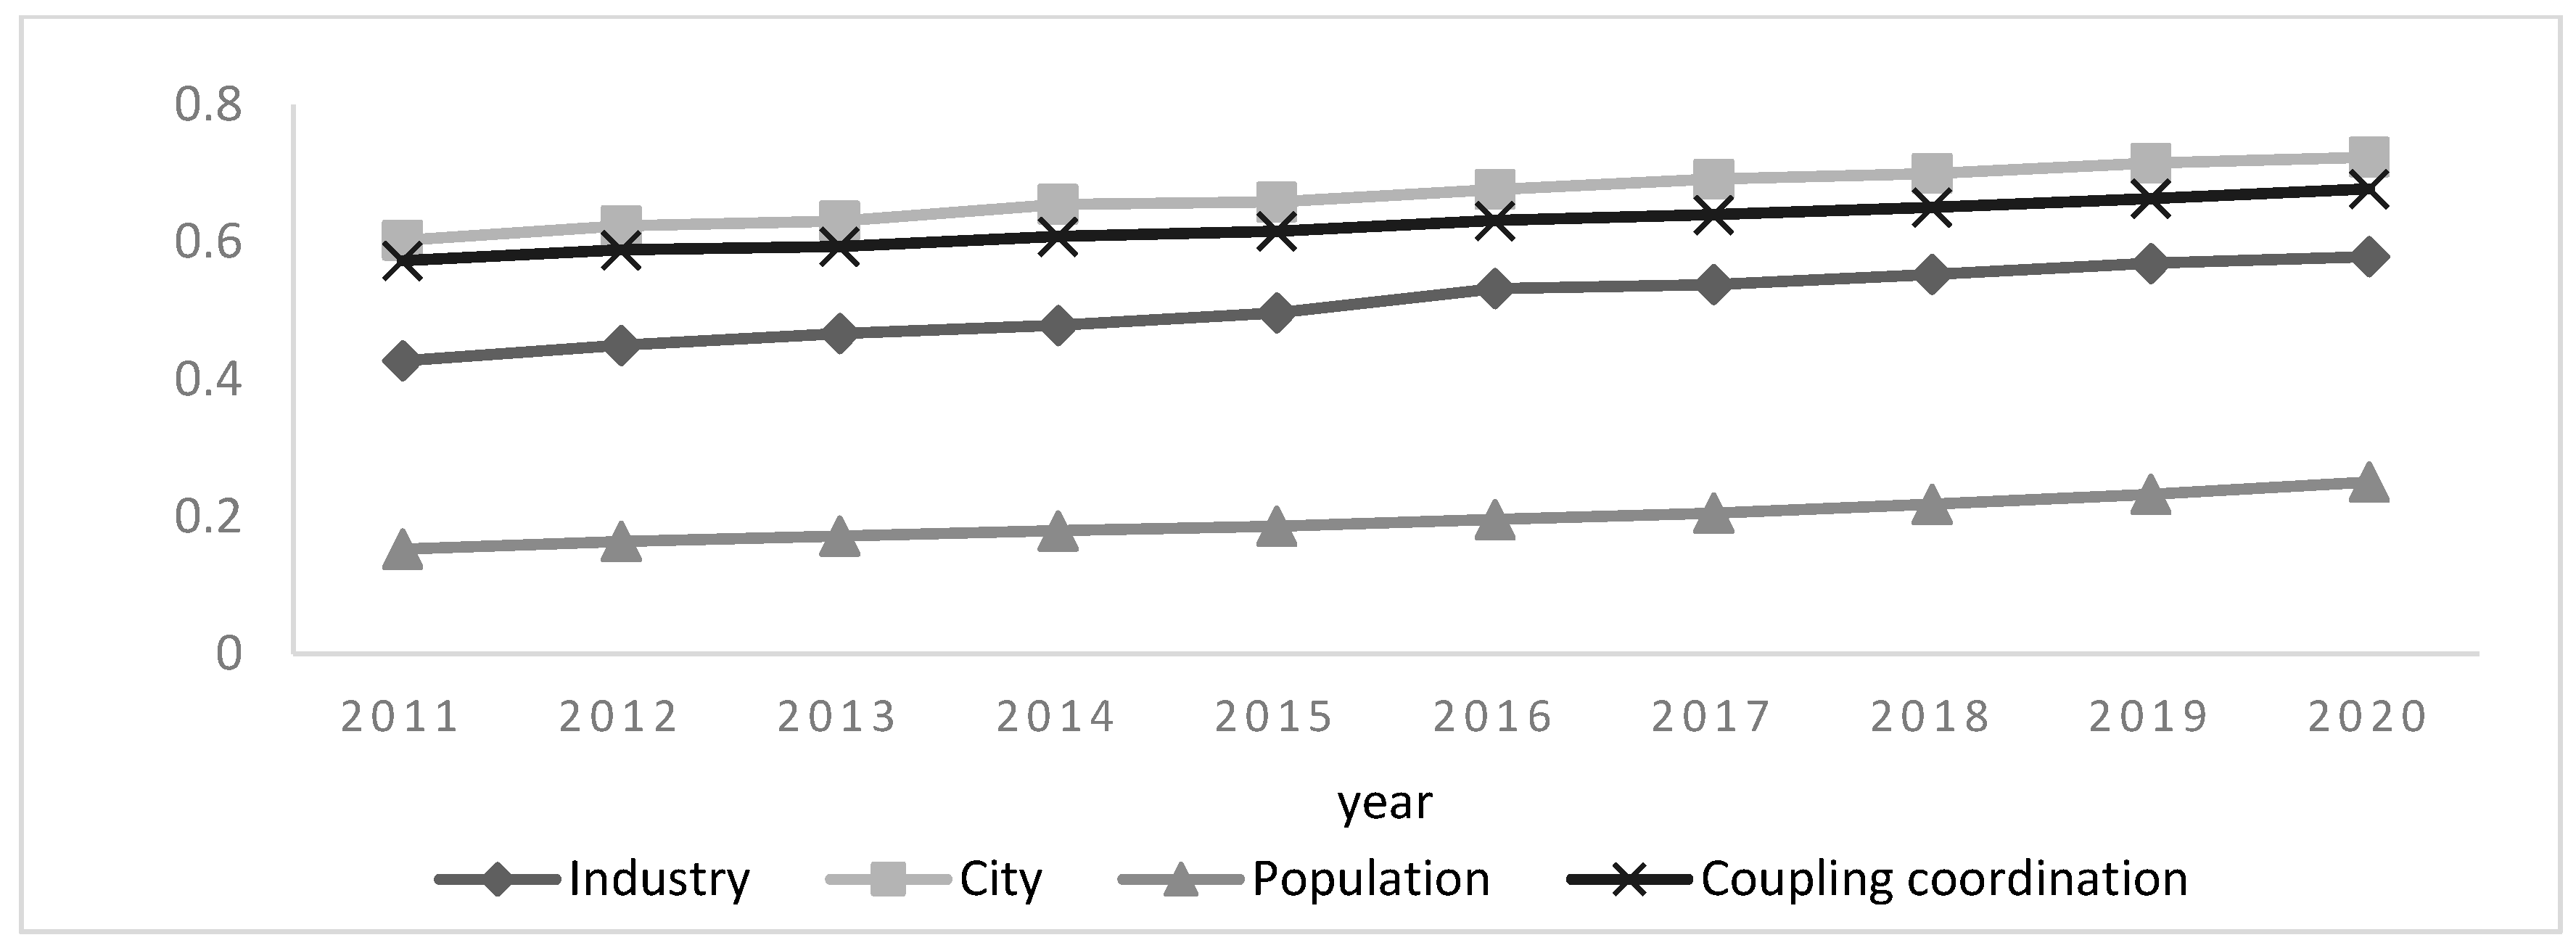
3.1. Evaluation of Industry, City and Population System in the Yellow River Basin

From the perspective of green economy, the industrial development level of the Yellow River Basin continues to improve, with the average score rising from 0.43 in 2011 to 0.58 in 2020, indicating that the green industry development of the Yellow River Basin has achieved certain results. In 2011, the top five cities in terms of industrial development level were Qingdao, Jinan, Weihai, Yantai and Xi’an, with an average score of 0.59; Jinchang, Wuzhong, Zhongwei, Jiayuguan and Pingliang have the lowest scores, with an average score of 0.26. In 2020, the cities with the highest industrial development levels were Qingdao, Xi’an, Zhengzhou, Jinan and Luohe, with an average score of 0.79, whereas Shizuishan, Jiayuguan, Zhongwei, Wuzhong and Jinchang had the lowest industrial development levels, with an average score of 0.36.The change in evaluation scores shows that the industrial development level of different cities has been improved, but there is still a large gap between cities; the cities with higher development level are mostly in the middle and lower reaches of the Yellow River, whereas the cities in the upper reaches of the Yellow River tend to be at a lower industrial development level.
The green level of cities in the Yellow River Basin has been improving, the average score has increased from 0.60 in 2011 to 0.72 in 2020, indicating that the construction of green cities in the Yellow River Basin has been promoted continuously. In 2011, cities with high scores included Weihai, Yantai, Rizhao, Erdos, Shuozhou. The average evaluation score of the top five cities is 0.72; Dingxi, Xianyang, Xinzhou, Baiyin and Lvliang have the lowest evaluation scores, with an average score of 0.48, and there is a gap with the cities with the highest scores. In 2020, the top-ranked cities included Guyuan, Erdos, Weihai, Jiayuguan and Baotou, with an average score of 0.81, whereas Xining, Anyang, Zhoukou, Xi’an and Xinxiang had the lowest scores, with an average value of 0.66. All cities in the Yellow River Basin have improved their greening levels, and the gap between cities has narrowed; however, cities such as Xi’an and Xining are slower to improve their greening levels due to factors such as urban land area and population size.
The level of human capital in the Yellow River Basin has been continuously improved, the average score of comprehensive evaluation has increased from 0.15 in 2011 to 0.25 in 2020, but it is still at a low level. Twenty-four cities scored above average in 2011, accounting for only 30.8% of the number of sample cities. The cities with the lowest evaluation scores are Longnan, Ulanqab, Dingxi, Weinan and Dezhou, and the average score of five cities is only 0.07; Taiyuan, Xi’an, Jinan, Lanzhou and Hohhot have the highest evaluation scores, with an average score of 0.38. Human capital shows the characteristics of concentration in provincial capital cities. In 2020, cities with the lowest evaluation score rankings included Linfen, Longnan, Zhoukou, Dingxi and Xinzhou, with an average score of 0.125; while Jinan, Zhengzhou, Taiyuan, Qingdao and Xi’an had the highest scores. The average score of the top five cities is 0.57, but human capital is still concentrated in developed cities.

3.2. Evaluation of the Coupled Development of Industry, City and Population in the Yellow River Basin

Under the perspective of green economy, the degree of coupling coordination of the Huanghe River Basin’s industry, city and population has been increasing, the coupling coordination degree has increased from 0.57 in 2011 to 0.68 in 2020. From the graph of the evaluation scores of each subsystem and the change trend of coupling coordination degree (Figure 1), we can see that the degree of integrated development of industries, cities and population in the Yellow River Basin has been increasing, but the development of population has been at a low level, which has become an important factor limiting the coupling and coordinated development of industry, city and population in the Yellow River Basin.
Visualize the degree of coupling coordination of 2011 and 2020 (Figure 2). In 2011, sixty-three cities were at the moderate coordination level, fifteen cities were at the high coordination level, and no city has reached extreme coordination. Jinan, Qingdao, Taiyuan, Hohhot and Xi‘an have the highest coupling coordination level (the average score was 0.71), while Longnan, Baiyin, Pingliang, Dingxi and Xinzhou have the lowest coupling coordination level (the average score was 0.49). In 2020, Linfen, Yuncheng, Lvliang and Xinzhou were at the medium coordination level (average score of 0.58), while Qingdao, Jinan, Zhengzhou, Xi’an and Taiyuan have reached extreme coordination (average score of 0.82). The rest of the cities are at the high coordination level.

4. Analysis of the Spatial and Temporal Characteristics

4.1. Spatio-Temporal Evolution Analysis

The year 2011 is the first year of the 12th Five-Year Plan, 2015 is its last year, and 2020 is the last year of the 13th Five-Year Plan. The years 2011, 2015 and 2020 are very important in China’s economic development; therefore, the coupling coordination degree data of these three years were selected to draw the nuclear density curve (Figure 3). It can be seen from the change in the curve position that the curve shows a trend of moving to the right with the passage of time, indicating that the level of industry, city and population coupling coordination in the Yellow River Basin has been increasing. The height and width of the main peak of the kernel density curve do not show an obvious trend of change, indicating that the variability of the degree of industry, city and population coupling coordination in different regions does not show a large change. From the shape of the curve, the skewed distribution was more obvious in 2011, showing a right trailing feature, and there was an evolution to “double peaks”, indicating that some cities had a higher level of coupling coordination and took the lead compared with most cities. In 2015, the trend of “twin peaks” slowed down somewhat, but there was still an obvious right-trailing phenomenon as the leading developing regions still had a high level of coupling development. In 2020, the curve basically shows a normal distribution, indicating that cities with higher and lower coupling levels exist at the same time, and it is necessary to promote the integrated development of industry, city and population in areas with low coupling levels.

4.2. Spatial Correlation Analysis

4.2.1. Global Spatial Correlation

The spatial adjacency matrix was selected and standardized to calculate the weights to obtain the global Moran index of the coupling coordination degree of industry, city and population in the Yellow River Basin (Table 2). It can be seen that the global Moran index from 2011 to 2020 are all positive and all of them pass the significance test, indicating that there is a strong positive spatial correlation between the coupling coordination degree of industry, city and population, the cities with high level of industry, city and population coupling are adjacent to each other, while the cities with low level of industry, city and population coupling development are also adjacent to each other. From the change trend, the Moran index shows a fluctuating change, with a higher Moran index in 2011 and 2016, and a lower Moran index in 2014 and 2018. The Moran index in 2020 decreased compared with 2011, indicating that the spatial positive correlation of the coupling coordination degree of industry, city and population in the Yellow River Basin weakened in 2020.

4.2.2. Local Spatial Correlation

To investigate the local spatial characteristics of the industry, city and population coupling coordination development in the Yellow River Basin, the local spatial correlation between 2011 and 2020 is expressed visually with the help of ArcGis 10.8 software (Figure 4). It can be found that there are four characteristics of local spatial correlation of industry, city and population coupling coordination degree in the Yellow River Basin, which are high–high agglomeration, high–low agglomeration, low–high agglomeration and low–low agglomeration, respectively. In 2011, the high–high agglomeration areas were mainly concentrated in Weihai, Yantai, Qingdao and Weifang in Shandong Peninsula, while Tianshui and Guyuan show low–low agglomeration. Ulanqab and Dezhou show low–high agglomeration, and Lanzhou shows high–low clustering characteristics. In 2020, cities with high–high clustering were still concentrated in areas such as Weifang, Zibo and Qingdao, while Dezhou and Linyi show low–high clustering characteristics, and high–low clustering are concentrated in areas such as Lanzhou, Hohhot and Taiyuan, while Yan’an shows low–low clustering characteristics. From the local correlations in different years, the high–high agglomeration areas do not show obvious changes, indicating that the level of coupling coordination of the industry, city and population in Shandong Peninsula is generally high, but there are still cities with low coupling level such as Dezhou and Linyi in the periphery. The coupling level of cities in the middle and upper reaches of the Yellow River is generally low, while the coupling development level of provincial capital cities is relatively high, but they have not played an obvious driving role in the surrounding cities. Moreover, the number of cities showing high–low clustering characteristics has increased, which is an important reason for the decrease in the Global Moran index in the Yellow River Basin.

5. Analysis of the Influence Factors

5.1. Model Construction

The integrated development of industry, city and population in the Yellow River Basin is influenced by various factors. Environmental regulation makes the industrial structure adjust continuously, which forms constraints on polluting enterprises and promotes them to improve green production efficiency, so that the ecological environment of the city can be improved and the green population can be increased; government regulation shows the direction for the development of the city, and the improvement of regulations and infrastructure helps improve human capital and high-quality development level of the city; foreign investment brings advanced production process and technology, and the demand for high-quality talents increases, but at the same time, effective environmental protection policies are needed so as to achieve ecological protection effect and prevent the formation of “pollution refuge”; the green finance can stimulate the energy saving, emission reduction, technological innovation of enterprises, improve the level of social security and industrial coordination, and finally achieve high-quality development [5,16,24,25].
Hypothesis 1 (H1).
Environmental regulation, government regulation, external opening and green finance can promote the coupling development of industry-city- population.
Therefore, an econometric model was constructed to analyze the dynamic mechanism of the coupled development of industry, city and population in the Yellow River Basin. This paper mainly discusses the impact of environmental regulation, government regulation, external opening and green finance on the coupling level of industry, city and population. The four indicators are expressed by the frequency share of environmental words in the government work report, the share of government fiscal expenditure in GDP, the amount of actual foreign capital utilization (taking logarithm), the green financial index was calculated by using data from green credit, green investment and green insurance with reference to the method of scholars [23], the data comes from the China Finance Yearbook. The word frequency ratio of environmental words in the government work report was calculated by manually searching the number of environment-related words in the government work report of each year by dividing the total number of reported words, and other data were calculated by relevant data in the Statistical Yearbook of Chinese cities. Due to the value of the coupling coordination degree being between 0 and 1, which is a restricted dependent variable, choosing the Tobit model for regression analysis is more scientific. The Tobit model is as follows:
Y i t = c o n s + α 1   E R i t + α 2 G R i t + α 3   F D I i t + α 4   G F i t + ε i t
where i is time, t is region, cons is a constant term, ε is a random disturbance term and Yit in the regression indicates the degree of coupling coordination of the industry, city and population and the evaluation score of each subsystem, respectively.

5.2. Analysis of Influencing Factors

Stata15 software was used for Tobit regression analysis. From the effects of various factors on the coupling development of industry, city and population in the Yellow River Basin (Table 3), it can be seen that environmental regulation, government regulation, external opening and green finance all have significant positive impacts on the coupling coordination degree, and Hypothesis 1 was verified. During the study period, the regression coefficients of the four factors were green finance (0.574) > government regulation (0.301) > environmental regulation (0.017) > external opening (0.016). It can be seen that different factors have different effects on the coupling development, and government regulation and green finance have a greater impact, environmental regulation and external opening have less impact. This shows that the coupled development of industry, city and population in the Yellow River Basin requires a large amount of financial support, and the government needs to control the direction of urban development [26]. Environmental regulations may affect the allocation of factors among enterprises and thus weaken the impact on coupled development [27]. In the future, high-level openings to the outside world should be promoted to promote high-quality development in the Yellow River Basin.
The four factors have different effects on the three systems of industry, city and population. Environmental regulation has a positive effect on the industrial system and urban system, but not on the human system, which indicates that environmental regulation helps industry to save energy, reduce emissions and improve urban green development. Government regulation, external opening and green finance have significant positive effects on industry, city and population subsystems, indicating that government regulation plays a guiding role in low-carbon industrial transformation, urban environmental improvement and human capital optimization; external opening contributes to the green development of city and industry, and can improve the level of green human capital; green finance provides financial support for green development and contributes to sustainable economic development [28].

6. Conclusions and Recommendations

In this paper, we measured the development levels of industries, cities and populations in the Yellow River Basin from the perspective of green economy using the comprehensive evaluation method, calculated the coupling coordination degree of industry, city and population using the coupling model, explored the spatial and temporal variability of the coupling coordination degree with the help of kernel density estimation and exploratory spatial data analysis methods, analyzed the influencing factors of the coupling development of industries, cities and population in the Yellow River Basin using the econometric model. The following conclusions have been drawn:
First, under the green economy perspective, industries, cities and populations in the Yellow River Basin have achieved different degrees of development, but there is obvious regional heterogeneity. The level of coupled development of industry, city and population in the Yellow River Basin has been increasing, and most cities have achieved a leap from the moderate coordination stage to the high coordination stage. There are differences in the coupling development status of different cities, some developed cities have a higher level of coupling development and reach the extreme coupling development stage, but some cities are still in the moderate coupling development stage due to the limitation of the human capital level.
Secondly, the regions with high and low coupling coordination degree exist at the same time, and the positive spatial correlation has weakened, which is mainly due to some provincial capitals taking the lead in development, while the coupling development of other cities is slower, showing the state of high–low clustering, which means that the high-level development areas have not played an obvious driving role to the surrounding low-development areas. High–high agglomeration is mainly concentrated in Shandong Peninsula, whereas some areas have low–high agglomeration and low–low agglomeration, showing a certain path dependence.
Thirdly, four factors, namely environmental regulation, government regulation, openness to the outside world and green finance, contribute to the coupling development of the Yellow River Basin, among which government regulation and green finance play a greater role in the coupling development of the Yellow River Basin, while environmental regulation and openness to the outside world play a smaller role. Government regulation, openness to the outside world and green finance have positive effects on industry, city and population, while environmental regulation mainly affects industry and city subsystems.
Based on the findings of this paper, the following countermeasures are proposed:
First, optimize industrial structure, promote industrial integration from the perspective of circular economy, realize green industrial development through energy saving and emission reduction, and strengthen the recycling level of industrial waste; optimize urban habitat, improve the carbon neutral capacity and pollutant treatment capacity of cities continuously, and at the same time guide residents to participate in green city construction; introduce policies to attract innovative talents to flow to cities, play the role of education in human capital accumulation; introduce policies to attract innovative talents to cities, give full play to the role of education in human capital accumulation and promote the coupling degree of industry, city and population.
Second, we should pay attention to the regional differences in the integrated development of industries, cities and population, improve the level of integrated development of industries, cities and population in the middle and upper reaches of the Yellow River, form a situation of coordinated development in the Yellow River Basin. The provincial capital cities and other high level development areas should play a leading role to enhance the level of integrated development of industries, cities and population in the neighboring cities through industrial transfer and counterpart assistance, while low level areas should strengthen infrastructure construction and formulate development plans, explore their comparative advantages and attract talent to the cities through industrial development and urban construction.
Third, local governments should continue to strengthen macro control and environmental regulation, apply more fiscal expenditures to talent training, green innovation and low-carbon development, strengthen investment in environmental protection projects, build a scientific environmental regulation system, give full play to the green innovation advantages of human capital, guide the transformation of enterprises and supervise energy conservation and emission reduction, give full play to the role of green credit and green insurance in low-carbon industries and green cities, focus more foreign investment on ecological industries and venous industries, and promote high-quality development in the Yellow River Basin.

Author Contributions

Conceptualization, X.C.; methodology, X.C.; software, X.C.; Writing—original draft, X.C.; formal analysis, F.C.; supervision, F.C. All authors have read and agreed to the published version of the manuscript.

Funding

This research was funded by Shandong Provincial Social Science Planning Research Key Project, grant number 20BJJJ06.

Institutional Review Board Statement

Not applicable.

Informed Consent Statement

Not applicable.

Data Availability Statement

No applicable.

Conflicts of Interest

The authors declare no conflict of interest.

References

  1. Wen, H.; Lee, C.C.; Zhou, F. Green credit policy, credit allocation efficiency and upgrade of energy-intensive enterprises. Energy Econ. 2021, 94, 105099. [Google Scholar] [CrossRef]
  2. Yuan, X.; Chen, L.; Sheng, X.; Li, Y.; Liu, M.; Zhang, Y.; Jia, Y.; Qiu, D.; Wang, Q.; Ma, Q.; et al. Evaluation of regional sustainability through emergy analysis: A case study of nine cities in the Yellow River Basin of China. Environ. Sci. Pollut. Res. Int. 2022, 29, 40213–40225. [Google Scholar] [CrossRef]
  3. Yuan, G.C.; Ye, Q.; Sun, Y.P. Financial Innovation. Information Screening and Industries’ Green Innovation—Industry-Level Evidence from the OECD. Technol. Forecast. Soc. Chang. 2021, 17, 120998. [Google Scholar] [CrossRef]
  4. Yuan, Q.Q.; Yang, D.W.; Yang, F.; Luken, R.; Saieed, A.; Wang, K. Green Industry Development in China:An Index Based Assessment from Perspectives of both Current Performance and Historical Effort. J. Clean. Prod. 2020, 250, 119457. [Google Scholar] [CrossRef]
  5. Artmann, M.; Kohler, M.; Meinel, G.; Gan, J.; Ioja, I.C. How Smart Growth and Green Infrastructure can Mutually Support each Other—A Conceptual Framework for Compact and Green Cities. Ecol. Indic. 2019, 96, 10–22. [Google Scholar] [CrossRef]
  6. Feng, Y.J.; Dong, X.; Zhao, X.M.; Zhu, A. Evaluation of Urban Green Development Transformation Process for Chinese Cities during 2005–2016. J. Clean. Prod. 2020, 266, 121707. [Google Scholar] [CrossRef]
  7. Wang, M.; Xu, M.; Ma, S.J. The Effect of the Spatial Heterogeneity of Human Capital Structure on Regional Green Total Factor Productivity. Struct. Chang. Econ. Dyn. 2021, 59, 427–441. [Google Scholar] [CrossRef]
  8. Sun, X.L.; Li, H.Z.; Ghosal, V. Firm-Level Human Capital and Innovation: Evidence from China. China Econ. Rev. 2020, 59, 101388. [Google Scholar] [CrossRef]
  9. Yao, Y.; Ivanovski, K.; Inekwe, J.; Smyth, R. Human Capital and Energy Consumption: Evidence from OECD Countries. Energy Econ. 2019, 84, 104534. [Google Scholar] [CrossRef]
  10. Khan, Z.; Hossain, M.R.; Badeeb, R.A.; Zhang, C. Aggregate and Disaggregate Impact of Natural Resources on Economic Performance: Role of Green Growth and Human Capital. Resour. Policy 2023, 80, 103103. [Google Scholar] [CrossRef]
  11. Zhang, L.; Godil, D.I.; Bibi, M.; Khan, M.K.; Sarwat, S.; Anser, M.K. Caring for the Environment: How Human Capital, Natural Resources, and Economic Growth Interact with Environmental Degradation in Pakistan? A Dynamic ARDL Approach. Sci. Total Environ. 2021, 774, 145553. [Google Scholar] [CrossRef]
  12. Bernardo, G.; D’Alessandro, S. Systems-Dynamic Analysis of Employment and Inequality Impacts of Low-Carbon Investments. Environ. Innov. Soc. Transit. 2016, 21, 123–144. [Google Scholar] [CrossRef]
  13. Yuan, K.F.; Zhang, X.X. Analysis on the Influence of Urban Living Environment on Healthy Human Capital Based on Health Production Function. In Proceedings of the 2020 Management Science Informatization and Economic Innovation Development Conference (MSIEID), Guangzhou, China, 18–20 December 2020; pp. 142–149. [Google Scholar]
  14. Heblich, S.; Trew, A.; Zylberberg, Y. East-Side Story: Historical Pollution and Persistent Neighborhood Sorting. J. Political Econ. 2021, 129, 1508–1552. [Google Scholar] [CrossRef]
  15. Song, Y.; Yue, Q.; Zhu, J.; Zhang, M. Air Pollution, Human Capital, and Urban Innovation in China. Environ. Sci. Pollut. Res. Int. 2023, 30, 38031–38051. [Google Scholar] [CrossRef]
  16. Gan, L.; Shi, H.; Hu, Y.; Lev, B.; Lan, H. Coupling Coordination Degree for Urbanization City-Industry Integration Level: Sichuan Case. Sustain. Cities Soc. 2020, 58, 102136. [Google Scholar] [CrossRef]
  17. Luo, D.; Xiao, J. The Urban City-Industry Integration Degree Evaluation Based on Ordinal Logistic Regression. In Proceedings of the 2021 7th Annual International Conference on Network and Information Systems for Computers (ICNISC), Guiyang, China, 23–25 July 2021; pp. 582–588. [Google Scholar]
  18. Zhang, H.L. Research on the Planning and Design of Sports Characteristic Town Based on the Integration of “Human Culture in Industry City”, IOP Conference Series. Earth Environ. Sci. 2020, 525, 12120. [Google Scholar]
  19. Xu, L.; Fan, M.; Yang, L.; Shao, S. Heterogeneous Green Innovations and Carbon Emission Performance: Evidence at China’s City Level. Energy Econ. 2021, 99, 105269. [Google Scholar] [CrossRef]
  20. Li, Y.J.; Zhang, Q.; Wang, L.Z.; Liang, L. Regional Environmental Efficiency in China: An Empirical Analysis Based on Entropy Weight Method and Non-Parametric Models. J. Clean. Prod. 2020, 276, 124147. [Google Scholar] [CrossRef]
  21. Li, C.Y. China’s Multi-Dimensional Ecological Well-being Performance Evaluation: A New Method Based on Coupling Coordination Model. Ecol. Indic. 2022, 143, 109321. [Google Scholar] [CrossRef]
  22. Parzen, E. On Estimation of a Probability Density Function and Mode. Ann. Math. Stat. 1962, 33, 1065–1076. [Google Scholar] [CrossRef]
  23. Wang, H.T.; Yang, J. Total-Factor Industrial Eco-Efficiency and its Influencing Factors in China: A Spatial Panel Data Approach. J. Clean. Prod. 2019, 227, 263–271. [Google Scholar] [CrossRef]
  24. Wang, X.Y.; Wang, Q. Research on the Impact of Green Finance on the Upgrading of China’s Regional Industrial Structure from the Perspective of Sustainable Development. Resour. Policy 2021, 74, 102436. [Google Scholar] [CrossRef]
  25. He, L.; Liu, R.; Zhong, Z.; Wang, D.; Xia, Y. Can Green Financial Development Promote Renewable Energy Investment Efficiency? A Consideration of Bank Credit. Renew. Energy 2019, 143, 974–984. [Google Scholar] [CrossRef]
  26. Tecklin, D.R.; Sepulveda, C. The Diverse Properties of Private Land Conservation in Chile: Growth and Barriers to Private Protected Areas in a Market-friendly Context. Conserv. Soc. 2014, 12, 203–217. [Google Scholar] [CrossRef]
  27. Andersen, D.C. Accounting for Loss of Variety and Factor Reallocations in the Welfare Cost of Regulations. J. Environ. Econ. Manag. 2018, 88, 69–94. [Google Scholar] [CrossRef]
  28. Falcone, P.M. Environmental regulation and green investments: The role of green finance. Int. J. Green Econ. 2020, 14, 159. [Google Scholar] [CrossRef]
Figure 1. Average change in industry, city, population evaluation and coupling coordination degree.
Sustainability 15 10029 g001
Figure 2. Spatial characteristics of the coupling coordination.
Sustainability 15 10029 g002
Figure 3. Nuclear density curve.
Sustainability 15 10029 g003
Figure 4. Spatial pattern of coupling development in 2011 and 2020.
Sustainability 15 10029 g004
Table 1. Comprehensive evaluation index system of industry, city and population in the perspective of green economy.
IndustryCityPopulation
Tertiary sector shareGreening coverage rate of built-up areasPer capita expenditure on science and technology
Energy consumption intensity *Public green space per capitaPer capita expenditure on education
Per capita gross regional productHarmless treatment rate of domestic wastePercentage of students in general primary and secondary schools
Comprehensive utilization rate of general industrial solid wasteSewage treatment rateNumber of science and technology personnel per 10,000 people
Industrial wastewater emission intensity *Per capita domestic electricity consumption *Urbanization rate
Industrial SO2 emission intensity *Number of buses per 10,000 peopleNumber of books in public libraries per 100 people
Industrial smoke (dust) emission intensity *Per capita domestic water consumption *Percentage of college students in school
Industrial CO2 emission intensity *Annual average concentration of pm 2.5 *Number of patents granted to 10,000 people
Note: Indicator attributes with * are negative indicators.
Table 2. Moran index for the Yellow River Basin from 2011 to 2020.
IndexYear
2011201220132014201520162017201820192020
I0.3780.2560.2390.2060.2140.4230.2930.2020.2930.284
Z5.6854.1463.8813.0773.1926.3424.3153.0314.1274.043
P0.0000.0000.0000.0010.0010.0000.0000.0010.0000.000
Table 3. Tobit regression results.
Influencing FactorsIndustryCityPopulationCoupling Coordination
Environmental Regulation0.028 *0.045 ***−0.0090.017 **
(0.015)(0.012)(0.011)(0.008)
Government Regulation0.305 ***0.442 ***0.217 ***0.301 ***
(0.052)(0.047)(0.044)(0.035)
External Opening0.046 ***0.016 ***0.013 ***0.016 ***
(0.006)(0.004)(0.004)(0.003)
Green
Finance
0.871 ***0.614 ***0.534 ***0.574 ***
(0.052)(0.045)(0.04)(0.032)
_cons−0.010.309 ***−0.057 **0.319 ***
(0.03)(0.026)(0.025)(0.019)
Note: *, **, ***, indicate significant at the 10%, 5%, and 1% levels, respectively, with robust standard errors in parentheses.
Disclaimer/Publisher’s Note: The statements, opinions and data contained in all publications are solely those of the individual author(s) and contributor(s) and not of MDPI and/or the editor(s). MDPI and/or the editor(s) disclaim responsibility for any injury to people or property resulting from any ideas, methods, instructions or products referred to in the content.

