Abstract
The ‘safety in numbers’ phenomenon is very intriguing to many walking advocates. Some studies have examined the phenomenon for walkers, but they mostly focused on the relationship between pedestrian volume and the likelihood of vehicle–pedestrian crash occurrences. This study evaluated the effects of the ‘safety in numbers’ phenomenon not only on the risk of crash occurrences, but also on the probability of severe or fatal injuries. Pedestrian volume and crash data obtained from the six districts in Seoul Metropolitan City and Jeju Island were jointly analyzed to examine the expected pedestrian crash rate and the probability of severe or fatal injury as a function of pedestrian volume. The analysis confirmed that the expected pedestrian crash rate and the probability of severe or fatal injuries decline as pedestrian volume increases, although the absolute number of crashes and injuries increases. The increase in the number of pedestrian crashes is less than the increase in pedestrian volume. In addition, the probability of severe or fatal injuries tends to diminish with a larger pedestrian volume. These findings can be used as logical evidence to support future policies promoting walking trips, and they suggest that policy measures encouraging walking trips can deliver additional benefits beyond the well-known economic, health, and environmental benefits.
1. Introduction
Walking is the most common non-motorized mode of transport and has been promoted as a mode of sustainable transport that could yield various environmental, health, and economic benefits [1]. Despite such potential, however, walking advocates face a variety of skepticism, because pedestrian safety has emerged as a global concern due to the combination of an increasing number of crashes and pedestrians’ intrinsic vulnerability to collisions involving automobiles [2]. In South Korea, pedestrian safety has been taken more seriously than ever because the country’s share of pedestrian fatalities is very high (37.6% of total traffic fatalities, compared to the global average of 22%) [3]. Furthermore, many Korean cities have recently initiated new policies for the pedestrian-oriented traffic environment as part of an effort to encourage more walking trips [4]. To assess the effectiveness of such policies, understanding the relationship between the number of walking trips and pedestrian safety is critical.
In this context, the concept of ‘safety in numbers’ in transport policy and planning is of particular relevance [5,6,7,8]. This theory asserts that the crash risk per pedestrian declines as pedestrian or cyclist volume (exposure) increases. Although the correlations between the number of non-motorized travelers and car-involving crashes per capita have been confirmed in various global cases [9,10], the mechanism behind this phenomenon remains largely unknown [11,12]. In general, the mechanism can be understood in context with the effect of road environment changes on driving. To avoid an increased number of moving pedestrians (or cyclists), a driver alters their behavior by slowing down and paying extra attention. This sensorial and neurological reaction could be an innate ability given by evolutionary adaptation. Drivers’ behavioral changes can also be explained by ‘target risk’, which is the level of risk that ‘people are willing to accept’ [13]. To meet one’s daily mobility, each individual tries to maintain a certain level of safety margin, which in this case can be measured by the distance between a pedestrian (or cyclist) and a passing vehicle [14]. An increased number of pedestrians increases the driver’s perceived risk on the street, which results in more attentive and safer driving. A similar but opposite situation occurs when safer road environments result in reckless driving for ‘motivational satisfaction’ [14]. For example, installing fences between a road and a sidewalk encourages drivers to speed up and, thus, increases the possibility of fatal crashes. In traffic safety, this paradox has been explained by the concept of risk homeostasis and risk compensation [13], which has also been supported by urban designers promoting traffic calming [15]. Drivers’ behavioral changes associated with the ‘safety in numbers’ phenomenon may be explained as a cognitive learning process, which occurs when an aversive experience, such as trauma from near-collision, influences the driver’s future behavior. To explain the mechanism behind ‘safety in numbers’, Thompson et al. (2016) [16] assumed that ‘drivers who are increasingly exposed to cyclists on the road may become conditioned’. Summala (1988) [14] mentioned an ‘avoidance conditioning paradigm in driving’, in which experienced risk may function as an aversive stimulus. The presence of pedestrians in numbers may work later as a cue for drivers to anticipate such experiences. As such, the causal inference of this phenomenon seems to be a subject of debate [11,12], and at this point, our assumption is that one or more of the mechanisms mentioned above collectively cause the ‘safety in numbers’ phenomenon. The phenomenon itself is still very intriguing to many walking advocates, whose efforts can be more strongly supported if encouraging more people to walk does not result in a proportionate increase in pedestrian crashes.
With the increasing number of transport measures to promote walking in Korean cities, it will be important to test the existence of this ‘safety in numbers’ phenomenon. As the government policy measure on walking trips is expected to yield a city-wide effect [17], the relationship between pedestrian volume and crashes should also be tested at the regional level. However, most previous studies have examined this relationship mostly at the junction level [6,8,9,18,19,20,21,22,23,24,25,26,27]. Moreover, instead of pedestrian volumes, they relied on proxy measures, such as ‘trips per day’, ‘journey to walk share’, or ‘distance per day for walking trips at the city-scale’, mainly due to the difficulties in measuring pedestrian volume at the regional level [7]. Large-scale pedestrian volume data measured at the regional level are necessary to effectively validate the phenomenon of ‘safety in numbers’.
In general, pedestrian safety can be decomposed into three components: (i) pedestrian volume (exposure), (ii) likelihood of crash occurrence for a given pedestrian volume, and (iii) probability of injuries in case of crashes [28,29,30,31]. Since previous studies on the ‘safety in numbers’ phenomenon have focused mostly on the first two components, an additional research effort to investigate the last component is needed to reveal the underlying effect of pedestrian volume on the probability of severe or fatal injuries. The hypothesis for this analysis is that the probability of severe or fatal injury is likely to diminish as pedestrian volume increases. This can happen if the presence of a large number of pedestrians moderates driver behavior, as postulated by previous studies [6,7,12].
The objective of this study was to evaluate how pedestrian volume influences pedestrian crash occurrences and the risk of severe or fatal injury. The analysis was performed with large-scale pedestrian volume and crash data measured in two South Korean regions (Seoul Metropolitan City and Jeju Island). Seoul is the capital city of South Korea, where lots of walking trips are generated by virtue of mixed land uses and a well-established public transit system. Jeju Island is one of the major tourist cities in South Korea and, therefore, attracts a substantial number of tourists and residents who engage in walking trips. The data were spatially joined using a geographic information system (GIS) (Section 2) and analyzed by constructing bivariate distributions—the expected number of crashes and the probability of severe or fatal injuries over pedestrian volume (Section 3). The findings from the relations among the variables were documented, and the related policy implications are discussed in Section 4.
2. Methodology
2.1. Data Description
In this study, two sets of data were analyzed to examine the relationship between the number of pedestrians, the expected number of pedestrian crashes, and the probability of severe or fatal injuries. Based on telecommunication records between mobile towers and individual mobile phones, measured in 2013 for Seoul and in 2014 for Jeju, pedestrian volumes (average daily pedestrians) were estimated for rectangular cells with dimensions of 300 m by 300 m. The pedestrian volume data for six districts in Seoul were acquired from the Seoul Institute; the pedestrian volume for the entirety of Jeju Island was provided by the Open Data Portal, managed by the Korean government [32]. The source of the pedestrian crash records was the Traffic Accident Analysis System (TAAS) [33], which is a database storing police officers’ records filled out at the scenes of traffic collisions. Pedestrian crash data recorded between 2012 and 2014 and between 2010 and 2012 are available for Seoul and Jeju, respectively. More recent crash data from Jeju Island cannot be used, because the data are released without location information. Crash data and information on pedestrian volume are provided in Table 1.

Table 1.
Data description of Seoul Metropolitan City and Jeju Island.
The geographic distributions of pedestrian volumes and crashes are presented in Figure 1. For pedestrian volume in Figure 1a,c, the rectangular grid is color-coded in accordance with the pedestrian volumes for the corresponding cells and for pedestrian crashes in Figure 1b,d, kernel density estimation (KDE) is used; the red color indicates high pedestrian volume, while the blue color represents low pedestrian volume.
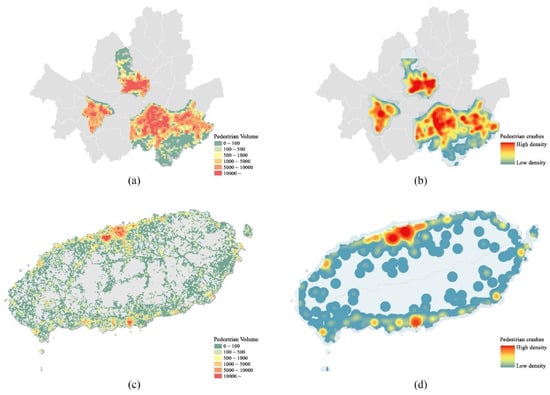
Figure 1.
Geographic distribution of pedestrian volume and pedestrian crashes: (a) pedestrian volume in (a) six districts of Seoul Metropolitan City and (c) Jeju Island; pedestrian crashes in (b) six districts of Seoul Metropolitan City; (d) Jeju Island.
For pedestrian crashes, however, an extra step is needed, as such incidents are recorded geographically as points. Figure 2 displays pedestrian volume and crash data in a sub-region of Jeju Island. The triangles denote the locations of pedestrian crashes, and the grids indicate the spatial unit to estimate pedestrian volumes (i.e., the average number of daily pedestrians). Using the same rectangular grids as a spatial unit of the analyses, the numbers of pedestrian crashes and severe or fatal injuries were counted and recorded for each cell.
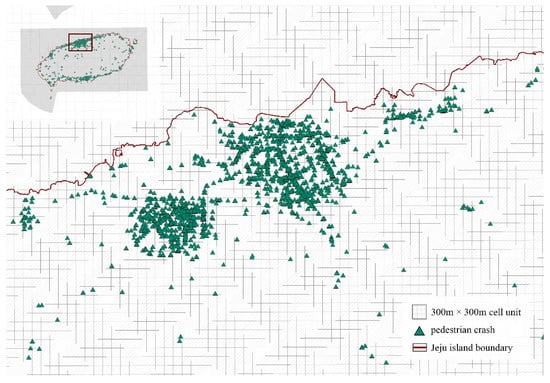
Figure 2.
Locations of pedestrian crashes and grid cells for pedestrian volume data in a sub-region of Jeju Island.
The rectangular grids were then color-coded according to the recorded numbers of pedestrian crashes and severe or fatal injuries, as shown in Figure 3. Figure 1 and Figure 3 show where pedestrians and crashes are clustered. Visual inspection of the figures indicates that the clustered patterns and locations of pedestrians and crashes seem to be overlapped. In Jeju Island, pedestrians and crashes were more concentrated in central business districts (CBDs)—Jeju and Seogwipo cities—while they were scarce in rural areas outside of the CBDs. Meanwhile, pedestrians and crashes in Seoul were quite uniformly distributed over the region.
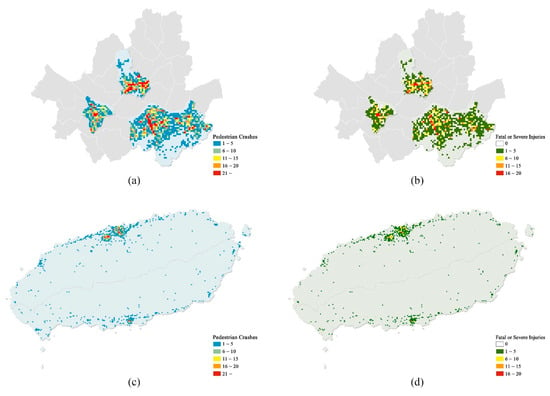
Figure 3.
Cell-based geographic distribution of pedestrian crashes and severe or fatal injuries: pedestrian crashes in (a) six districts of Seoul Metropolitan City and (c) Jeju Island; severe or fatal injuries in (b) six districts of Seoul Metropolitan City and (d) Jeju Island.
The joined data of pedestrian volume and the number of crashes are plotted in Figure 4a,b. Although the plots show increasing trends of both numbers of crashes and severe or fatal injuries as the pedestrian volume increases, the data are so widely scattered that it is difficult to observe well-defined regular patterns from the plot, suggesting that further data processing is needed [34]. As a first step, based on the scatterplots shown in Figure 4a,b, bivariate histograms were constructed, as presented in Figure 4c,d, respectively. To construct the histogram figures, the numbers of pedestrians and crashes were partitioned into cells with a predetermined size (1000 pedestrians by one crash and 400 pedestrians by one crash for Seoul and Jeju Island, respectively), and the numbers of data points corresponding to each cell were counted and presented in color—the blue denotes the smaller number of data points that belong to each cell. According to the histogram, many data points have zero crashes and low pedestrian volume; the number of data points diminishes as the pedestrian volume and crashes diminish. Because these statistics do not represent the expected number of pedestrian crashes and the probability of severe or fatal injury, these measures were estimated using the equations described in the following subchapter.
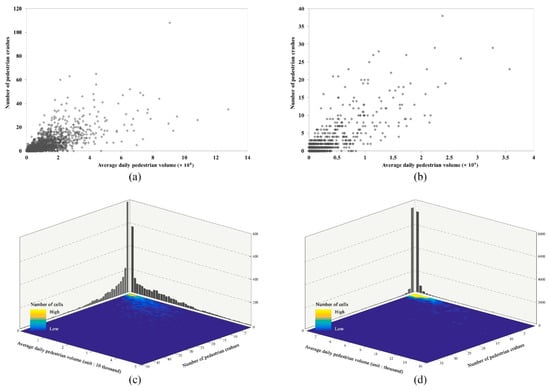
Figure 4.
Scatterplots of pedestrian volume versus pedestrian crashes and bivariate distributions of pedestrian volume: scatterplots for (a) six districts of Seoul Metropolitan City and (b) Jeju Island; bivariate distribution for (c) six districts of Seoul Metropolitan City and (d) Jeju Island.
2.2. Analyses
To examine pedestrian safety at different levels of pedestrian volume, the expected pedestrian crash rates and probability of severe or fatal injuries were estimated as follows:
2.2.1. Expected Number of Pedestrian Crashes
Let the number of pedestrian crashes and pedestrian volume for the cell be and , respectively. The probability that pedestrian crashes occur when the pedestrian volume is in the interval between and is as follows:
The expected number of pedestrian crashes when the pedestrian volume is in the interval between and is .
2.2.2. Expected Pedestrian Crash Rate (Expected Number of Pedestrian Crashes per Pedestrian)
Let the number of pedestrian crashes and pedestrian volume for the cell be and , respectively. The crash rate for the cell, , is calculated as . The expected pedestrian crash rate, , can then be estimated as the arithmetic mean of Ri of all the cells, where pedestrian volume, , is in the interval between and .
2.2.3. Probability of Severe or Fatal Injury
The probability of severe or fatal injuries in cases of crashes can be computed as the ratio of the number of severe or fatal injuries to the number of pedestrian crashes. Let the number of severe or fatal injuries in the cell be . Then, the probability of severe or fatal injuries for the cell, , is . The probability of severe or fatal injury, , when the pedestrian volume Vi is in the interval between and , is then estimated as the arithmetic mean of of the cells where the pedestrian volume Vi is in the interval between and .
3. Results
The expected number of pedestrian crashes, expected pedestrian crash rate, and probability of severe or fatal injury were computed for different levels of pedestrian volumes and presented as a function of pedestrian volume. For the plotting of these measures, estimates produced using fewer than five data points were excluded, because such estimates might be substantially affected by outliers. The results are provided in subsections.
3.1. Evaluation of Likelihood of Pedestrian Crash Occurrences
The expected number of pedestrian crashes for three years was estimated using the data from Seoul and Jeju Island, and then plotted against the average daily pedestrian volume (×104). The plots indicate that the number of crashes increases with the number of pedestrians. However, it is difficult to observe whether the increase rate is declining due to widely scattered plots in the range of high pedestrian volume (see Figure 5). Therefore, the existence of the ‘safety in numbers’ phenomenon for pedestrians could not be validated with this measure.
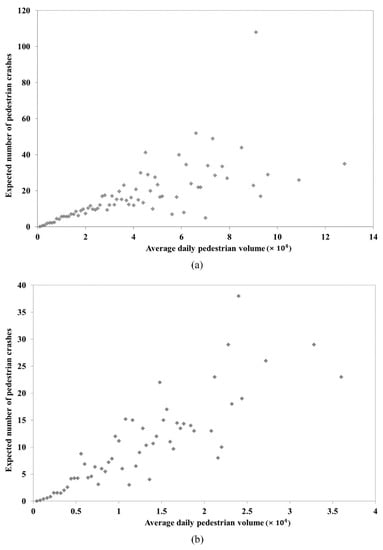
Figure 5.
Expected number of pedestrian crashes by the average number of pedestrians: (a) six districts of Seoul Metropolitan City and (b) Jeju Island.
To further investigate the existence of the ‘safety in numbers’ phenomenon for pedestrians, the expected pedestrian crash rate (i.e., the number of pedestrian crashes per pedestrian) was estimated by a power function of the average daily pedestrian volume (×104). The plots exhibit a diminishing trend with a decreasing rate, confirming the existence of the ‘safety in numbers’ phenomenon at the regional scale (see Figure 6). A best-fit curve was estimated as a power function for each dataset, as shown in Figure 6a,b. The curves reveal relationships between the pedestrian volume and pedestrian crash rate, although the R2 values are at a moderate level: 0.3716 in Figure 6a and 0.3154 in Figure 6b. The estimated coefficients for pedestrian volume are −0.420 and −0.336 for Seoul and Jeju Island, respectively. These coefficients mean that the per-pedestrian crash risk declines by factors of 2−0.420 (=0.75) in Seoul and 2−0.336 (=0.79) in Jeju Island if the pedestrian volumes double. This finding implies that the policy encouraging walking trips should have a positive impact on pedestrian safety, as a larger mass of pedestrians will diminish the per-pedestrian crash risk.
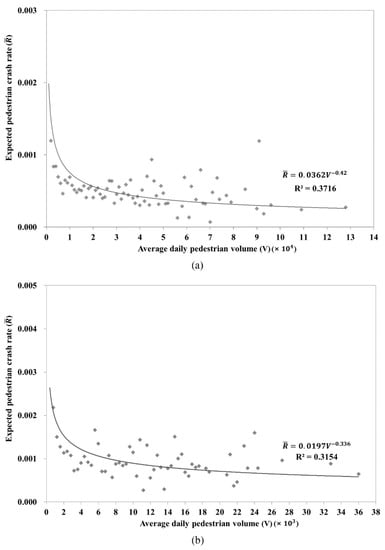
Figure 6.
Expected rate of pedestrian crashes (number per pedestrian) by the average number of pedestrians: (a) six districts of Seoul Metropolitan City; (b) Jeju Island.
The estimated coefficients are comparable to those obtained in previous studies, in which the coefficients estimated at the regional level ranged from 0.13 to 0.41 [5]. Although both coefficients estimated in this study are within the range estimated by previous studies, they are not identical. The difference between them may be explained by the different travel characteristics in the two regions. Famous as an international tourist attraction, a large portion of travelers in Jeju Island are expected to be tourists, while those in Seoul are mostly normal travelers.
3.2. Evaluation of the Probability of Severe or Fatal Injury
Previous studies have used behavior modification to explain the causal mechanism of the ‘safety in numbers’ phenomenon: when drivers expect to encounter a larger mass of pedestrians, they tend to reduce their driving speed and yield more frequently [5,6,7,8,23]. Although previous studies have used this rationale to explain the reduced number of crash occurrences, this mechanism may also diminish the probability of severe or fatal injuries when crashes occur, as the slower speed at the impact of collision or more yielding would result in a reduced risk of severe or fatal injuries [35,36,37].
In Figure 7a,b, the probability of severe or fatal injuries is estimated and plotted against the average daily pedestrian volume. Again, the curves were fitted using a power function. As can be seen in the figures, the probability of severe or fatal injuries diminishes as the pedestrian volume diminishes. The fitted curves exhibit systematic relations between pedestrian volume and the probability of injury. The coefficients for pedestrian volume are −0.181 and −0.275 for Seoul and Jeju Island, respectively. These coefficients mean that, if the pedestrian volume doubles, the probability of severe or fatal injury diminishes by 12% (2−0.181 (=0.88)) and 17% (2−0.275 (=0.83)), respectively. This favorable reduction is often overlooked when the ‘safety in numbers’ phenomenon is discussed, but it can be used as logical evidence to support future policies promoting walking trips.
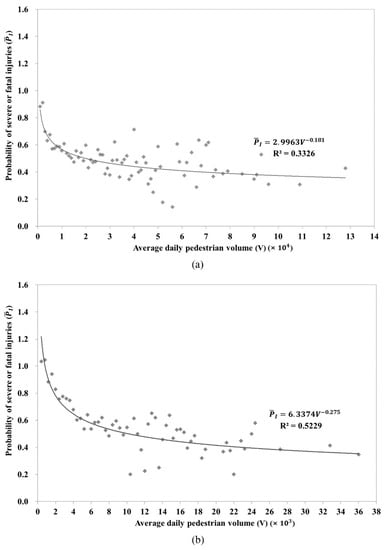
Figure 7.
Probability of severe or fatal injuries when pedestrian crashes occurred by the average number of pedestrians: (a) six districts of Seoul Metropolitan City; (b) Jeju Island.
4. Discussion and Conclusions
Many studies testing the existence of ‘safety in numbers’ at the regional level have used proxy measures for the number of pedestrians due in large part to the difficulties in measuring pedestrian volumes [38,39,40,41,42]. In order to analyze this phenomenon with large-scale pedestrian volume data, the present study utilized pedestrian volumes estimated from cell phone communication data in Seoul and Jeju Island; the data were analyzed together with vehicle–pedestrian crash data. Because previous studies have mostly only explored the relationship between crash occurrences and pedestrian volume, the present study additionally focuses on the severity of pedestrian injuries from car collisions. Consistent with previous studies, this analysis confirms that the pedestrian crash rate (i.e., the number of crashes per pedestrian) declines as pedestrian volume increases. Furthermore, the results prove our hypothesis that the probability of severe or fatal injury when crashes occur diminishes as pedestrian volume increases. This means that the ‘safety in numbers’ phenomenon also favorably affects the severity of injury. This phenomenon may be attributed to the fact that drivers are likely to drive more carefully when they are exposed to a larger number of pedestrians [43]. Our finding of a positive effect on pedestrian safety helps expand the body of research evidence for future discussion of the ‘safety in numbers’ phenomenon. The results of our analysis suggest that policy measures that aim to encourage walking trips can also deliver an additional benefit beyond the well-known economic, health, and environmental benefits.
To interpret the findings more quantitatively, the safety performance of future policy measures can be evaluated by adopting the concept of risk decomposition, which can be expressed as follows: roadway safety = exposure × number of crashes per exposure × number of victims per crash [28,29]. In a similar manner, pedestrian safety, measured by the number of severe or fatal injuries, can be formulated with the terms derived in the present study: pedestrian safety = pedestrian volume × likelihood of crash occurrences (per pedestrian crash rate) × probability of severe and fatal injuries. We applied this to evaluate a real policy case. Recently, the Seoul Metropolitan Government enacted a policy that aims to increase the mode share of walking trips by 20%, from 16% of all trips in 2018 [4]. If the mode share of walking trips increases as targeted, a 20% increase in pedestrian volume would result in a 7.4% reduction in the likelihood of crash occurrences and a 3.2% reduction in the probability of severe or fatal injuries. In the end, the 20% increase in pedestrian volume is expected to result in a disproportionately smaller 7.5% increase in the number of severe or fatal pedestrian injuries. Compared with the amount of increase in walking trips, the increase in severe and fatal pedestrian injuries is significantly minimized by the ‘safety in numbers’ phenomenon.
On the other hand, the outcome of this estimation raises an issue to be considered for future research. The calculations show that increasing pedestrian volume leads to an increased absolute number of crashes and injuries, mainly due to higher exposure. Although the risk to individual pedestrians declines as the number of pedestrians increases, the policymakers and planners trying to implement the policy encouraging walking trips may face opposition from those worrying about the increase in the absolute number of crashes and injuries. However, such a policy would also reduce the number of motorized trips and, thus, would reduce the absolute number of vehicle-to-vehicle or vehicle-to-pedestrian crashes. Therefore, a trade-off is anticipated between pedestrian safety and automobile safety. To shed light on the practical policy evaluation for traffic safety as a whole, this trade-off should be explored further. Future research should be designed to fully understand the effects of pedestrian policies on other transportation modes, as well as the trade-off between pedestrian and automobile safety.
This study has several limitations. First, this study simply evaluated the ‘safety in numbers’ phenomenon by observing the distribution between pedestrian volume and crashes. Future studies should take into account the complexities of pedestrian safety by incorporating additional data pertaining to road design, traffic volume, and sociodemographic characteristics of pedestrians. By considering such complexities, a more comprehensive understanding of pedestrian safety can be achieved. Second, we used data collected from 2010 to 2013, due to limitations of data availability. It is important to note that there would be potential changes in the researched areas and the population residing there since that time; thus, the comparison between past and recent phenomena using historical data can enhance our understanding of ‘safety in numbers’ for pedestrians.
Author Contributions
Conceptualization, K.J. and S.P.; methodology, S.K. and K.J.; validation, K.J. and S.P.; formal analysis, S.K.; data curation, S.K. and K.J.; writing—original draft preparation, S.K. and K.J.; writing—review and editing, S.K., K.J. and S.P.; visualization, S.K.; supervision, K.J. and S.P. All authors have read and agreed to the published version of the manuscript.
Funding
This work was supported by the Ministry of Education of the Republic of Korea and the National Research Foundation of Korea (NRF-2018S1A5A8027809).
Institutional Review Board Statement
Not applicable.
Informed Consent Statement
Not applicable.
Data Availability Statement
Data sharing not applicable.
Conflicts of Interest
The authors declare no conflict of interest.
References
- Park, S.; Deakin, E.; Jang, K. Can Good Walkability Expand the Size of Transit-Oriented Developments? Transp. Res. Rec. J. Transp. Res. Board 2015, 2519, 157–164. [Google Scholar] [CrossRef]
- World Health Organization. Pedestrian Safety: A Road Safety Manual for Decision-Makers and Practitioners; World Health Organization: Geneva, Switzerland, 2023. [Google Scholar]
- KoROAD. Road Traffic Accidents in Korea. 2021. Available online: http://taas.koroad.or.kr/index.jsp (accessed on 10 September 2021).
- Seoul Metropolitan Government. Seoul Masterplan for the Safety and Convenience of Pedestrians; Seoul Metropolitan Government: Seoul, Republic of Korea, 2018.
- Elvik, R. The non-linearity of risk and the promotion of environmentally sustainable transport. Accid. Anal. Prev. 2009, 41, 849–855. [Google Scholar] [CrossRef] [PubMed]
- Geyer, J.; Raford, N.; Pham, T.; Ragland, D.R. Safety in Numbers. Transp. Res. Rec. J. Transp. Res. Board 2006, 1982, 150–154. [Google Scholar] [CrossRef]
- Jacobsen, P.L. Safety in numbers: More walkers and bicyclists, safer walking and bicycling. Inj. Prev. 2003, 21, 271–275. [Google Scholar] [CrossRef]
- Robinson, D.L. Safety in numbers in Australia: More walkers and bicyclists, safer walking and bicycling. Health Promot. J. Aust. 2005, 16, 47–51. [Google Scholar] [CrossRef]
- Elvik, R.; Bjørnskau, T. Safety-in-numbers: A systematic review and meta-analysis of evidence. Saf. Sci. 2017, 92, 274–282. [Google Scholar] [CrossRef]
- Elvik, R.; Goel, R. Safety-in-numbers: An updated meta-analysis of estimates. Accid. Anal. Prev. 2019, 129, 136–147. [Google Scholar] [CrossRef] [PubMed]
- Bhatia, R.; Wier, M. “Safety in Numbers” re-examined: Can we make valid or practical inferences from available evidence? Accid. Anal. Prev. 2011, 43, 235–240. [Google Scholar] [CrossRef]
- Jacobsen, P.L.; Ragland, D.R.; Komanoff, C. Safety in Numbers for walkers and bicyclists: Exploring the mechanisms. Inj. Prev. 2015, 21, 217–220. [Google Scholar] [CrossRef] [PubMed]
- Wilde, G.J.S. Risk homeostasis theory: An overview. Inj. Prev. 1998, 4, 89–91. [Google Scholar] [CrossRef] [PubMed]
- Summala, H. Risk control is not risk adjustment: The zero-risk theory of driver behaviour and its implications. Ergonomics 1988, 31, 491–506. [Google Scholar] [CrossRef]
- Hamilton-Baillie, B. Shared Space: Reconciling People, Places and Traffic. Built Environ. 2008, 34, 161–181. [Google Scholar] [CrossRef]
- Thompson, J.; Savino, G.; Stevenson, M. A model of behavioural adaptation as a contributor to the safety-in-numbers effect for cyclists. Transp. Res. Part A Policy Pract. 2016, 85, 65–75. [Google Scholar] [CrossRef]
- Pushkarev, B.S.; Zupan, J.M. Public Transportation and Land Use Policy; Indiana University Press: Bloomington, IN, USA, 1977. [Google Scholar]
- Brüde, U.; Larsson, J. Models for predicting accidents at junctions where pedestrians and cyclists are involved. How well do they fit? Accid. Anal. Prev. 1993, 25, 499–509. [Google Scholar] [CrossRef]
- Elvik, R. Safety-in-numbers: Estimates based on a sample of pedestrian crossings in Norway. Accid. Anal. Prev. 2016, 91, 175–182. [Google Scholar] [CrossRef]
- Elvik, R.; Sørensen, M.W.J.; Nævestad, T.O. Factors influencing safety in a sample of marked pedestrian crossings selected for safety inspections in the city of Oslo. Accid. Anal. Prev. 2013, 59, 64–70. [Google Scholar] [CrossRef] [PubMed]
- Harwood, D.W.; Torbic, D.J.; Gilmore, D.K.; Bokenkoger, C.D.; Dunn, J.M.; Zegeer, C.V.; Srinivasan, S.; Carter, D.; Raborn, C.; Lyon, C.; et al. Pedestrian Safety Prediction Methodology. NCHRP 2008, 129, 76. [Google Scholar]
- Kröyer, H.R.G. Pedestrian and bicyclist flows in accident modelling at intersections. Influence of the length of observational period. Saf. Sci. 2016, 82, 315–324. [Google Scholar] [CrossRef]
- Leden, L. Pedestrian risk decrease with pedestrian flow. A case study based on data from signalized intersections in Hamilton, Ontario. Accid. Anal. Prev. 2002, 34, 457–464. [Google Scholar] [CrossRef]
- Lyon, C.; Persaud, B. Pedestrian Collision Prediction Models for Urban Intersections. Transp. Res. Rec. J. Transp. Res. Board 2002, 1818, 102–107. [Google Scholar] [CrossRef]
- Miranda-Moreno, L.F.; Morency, P.; El-Geneidy, A.M. The link between built environment, pedestrian activity and pedestrian–vehicle collision occurrence at signalized intersections. Accid. Anal. Prev. 2011, 43, 1624–1634. [Google Scholar] [CrossRef] [PubMed]
- Tulu, G.S.; Haque, M.M.; Washington, S.; King, M.J. Investigating Pedestrian Injury Crashes on Modern Roundabouts in Addis Ababa, Ethiopia. Transp. Res. Rec. J. Transp. Res. Board 2015, 2512, 1–10. [Google Scholar] [CrossRef]
- Xu, P.; Xie, S.; Dong, N.; Wong, S.C.; Huang, H. Rethinking safety in numbers: Are intersections with more crossing pedestrians really safer? Inj. Prev. 2019, 25, 20–25. [Google Scholar] [CrossRef]
- European Commission. Models for Traffic and Safety Development and Interventions: Final Report; EU Publications Office: Bruxelles, Brussels, 2004. [Google Scholar]
- Hermans, E.; Wets, G.; Van den Bossche, F. Describing the Evolution in the Number of Highway Deaths by Decomposition in Exposure, Accident Risk, and Fatality Risk. Transp. Res. Rec. J. Transp. Res. Board 2006, 1950, 1–8. [Google Scholar] [CrossRef]
- Jang, K.; Park, S.H.; Kang, S.; Song, K.H.; Kang, S.; Chung, S. Evaluation of Pedestrian Safety. Transp. Res. Rec. J. Transp. Res. Board 2013, 2393, 104–116. [Google Scholar] [CrossRef]
- Jung, S.; Jang, K.; Yoon, Y.; Kang, S. Contributing factors to vehicle to vehicle crash frequency and severity under rainfall. J. Saf. Res. 2014, 50, 1–10. [Google Scholar] [CrossRef]
- Open Data Portal. Available online: https://www.data.go.kr/ (accessed on 27 May 2023).
- Traffic Accident Analysis System. Available online: https://taas.koroad.or.kr/ (accessed on 27 May 2023).
- Jang, K.; Oum, S.; Chan, C.Y. Traffic Characteristics of High-Occupancy Vehicle Facilities. Transp. Res. Rec. J. Transp. Res. Board 2012, 2278, 180–193. [Google Scholar] [CrossRef]
- Davis, G.A. Relating Severity of Pedestrian Injury to Impact Speed in Vehicle-Pedestrian Crashes: Simple Threshold Model. Transp. Res. Rec. J. Transp. Res. Board 2001, 1773, 108–113. [Google Scholar] [CrossRef]
- Eluru, N.; Bhat, C.R.; Hensher, D.A. A mixed generalized ordered response model for examining pedestrian and bicyclist injury severity level in traffic crashes. Accid. Anal. Prev. 2008, 40, 1033–1054. [Google Scholar] [CrossRef]
- Jang, K.; Park, S.H.; Chung, S.; Song, K.H. Influential Factors on Level of Injury in Pedestrian Crashes: Applications of Ordered Probit Model with Robust Standard Errors; Berkeley SafeTREC: Berkeley, CA, USA, 2010. [Google Scholar]
- Greene-Roesel, R.; Diogenes, M.C.; Ragland, D.R.; Lindau, L.A. Effectiveness of a Commercially Available Automated Pedestrian Counting Device in Urban Environments: Comparison with Manual Counts; Berkeley SafeTREC: Berkeley, CA, USA, 2008. [Google Scholar]
- Liu, X.; Griswold, J. Pedestrian Volume Modeling: A Case Study of San Francisco. In Yearbook of the Association of Pacific Coast Geographers; University of Hawai’i Press: Honolulu, HI, USA, 2009; Volume 71, Available online: https://www.jstor.org/stable/24043772 (accessed on 27 May 2023).
- Pulugurtha, S.S.; Repaka, S.R. Assessment of Models to Measure Pedestrian Activity at Signalized Intersections. Transp. Res. Rec. J. Transp. Res. Board 2008, 2073, 39–48. [Google Scholar] [CrossRef]
- Ryan, S.; Lindsey, G. Counting Bicyclists and Pedestrians to Inform Transportation Planning; Robert Wood Johnson Foundation: Princeton, NJ, USA, 2013. [Google Scholar]
- Schneider, R.J.; Henry, T.; Mitman, M.F.; Stonehill, L.; Koehler, J. Development and Application of the San Francisco Pedestrian Intersection Volume Model; Berkeley SafeTREC: Berkeley, CA, USA, 2013. [Google Scholar]
- Kaparias, I.; Bell, M.G.; Miri, A.; Chan, C.; Mount, B. Analysing the perceptions of pedestrians and drivers to shared space. Transp. Res. Part F Traffic Psychol. Behav. 2012, 15, 297–310. [Google Scholar] [CrossRef]
Disclaimer/Publisher’s Note: The statements, opinions and data contained in all publications are solely those of the individual author(s) and contributor(s) and not of MDPI and/or the editor(s). MDPI and/or the editor(s) disclaim responsibility for any injury to people or property resulting from any ideas, methods, instructions or products referred to in the content. |
© 2023 by the authors. Licensee MDPI, Basel, Switzerland. This article is an open access article distributed under the terms and conditions of the Creative Commons Attribution (CC BY) license (https://creativecommons.org/licenses/by/4.0/).