Abstract
As an important part of road transportation, bridge engineering plays a pivotal role in infrastructure construction. The wind field characteristics of the bridge site area have an essential influence on both the construction and operation period of the bridge, especially in mountainous canyon terrain. In this paper, a numerical simulation using computational fluid dynamics software was conducted to examine the intricate wind field characteristics in mountainous regions. The study focused on ideal V-shaped and U-shaped canyons, aiming to investigate the influence of various parameters. These parameters included three distinct heights, seven angles, and seven widths of the canyon. The findings indicate that in both ideal V-shaped and U-shaped canyons, the canyon acceleration effect weakens as the angles or widths of the canyon increase. The wind speed amplification effect gradually disappears when the V-shaped canyon angle exceeds 160° or when the U-shaped canyon has a width-to-height ratio of approximately 5:1. The wind speed amplification effect strengthens as the canyon height increases. The wind speed acceleration effect exhibits a linear relationship with the angle of the V-shaped canyon, while it demonstrates a logarithmic relationship with the width of the U-shaped canyon. Additionally, the wind speed amplification factor follows a logarithmic distribution along the canyon height. The wind field characteristics observed in this study offer valuable insights for future bridge designs in mountainous regions featuring V-shaped and U-shaped canyons.
1. Introduction
Road traffic engineering is a critical component of infrastructure development, with bridge engineering occupying a prominent position in this field, and sustainable design of bridges gaining more attention. Mountain canyon bridges, characterized by large spans and high elevations above the canyon floor, exhibit low structural stiffness. The impact of wind load on bridge sustainability is significant and can induce structural vibration [1,2]. In the past two decades, the construction of bridges in mountainous regions has witnessed a substantial increase [3]. Compared to flat areas, the characteristics of the wind field in complex mountainous regions exhibit distinct variations [4]. Most prevailing design specifications for highway bridges are currently focused on plain areas [5]. The description of wind characteristics in the mountainous canyons remains imprecise, failing to meet the design requirements for bridges situated in such rugged terrain [6]. Based on this, this paper explores the wind characteristics of two typical types of ideal U-shaped and V-shaped canyons in mountainous regions, aiming to propose a generalized distribution feature of the wind field in mountainous gorges.
When wind flows over mountainous regions, its course is influenced by the presence of mountains, causing it to either accelerate or decelerate as it navigates through the canyons. These wind field characteristics play a crucial role during the construction and operation phases of bridge engineering, and influence the sustainable design of bridges [7]. Currently, researchers have extensively studied these phenomena, making many significant contributions based on their field measurements [8,9,10,11], wind tunnel tests [12,13,14,15], and numerical simulations [16,17,18,19].
Field measurements provide the most direct data for studying wind field characteristics, and they serve as the most authoritative basis for modifying existing testing methods and theoretical models [20]. The effect induced by terrain plays a significant role in variations in wind direction, with regular changes in characteristics depending on the direction [21]. The collected wind data from the deep-cutting gorge exhibit strong non-stationary characteristics, that are likely due to the influence of the terrain [22]. The probabilistic turbulence wind spectrum models were constructed by the measured data, and the non-stationarity of the wind field in the V-shaped canyon is evaluated [23]. Although many achievements have been made under different terrains through field measurements, it is usually impossible to obtain the distribution of wind characteristics in the entire space, which means that wind field data are difficult to use during the sustainable bridge design process.
Compared to field measurements, wind tunnel tests, with their ability to artificially control test conditions, allow for a more comprehensive study of how variable parameters influence the characteristics of the entire spatial wind field. To address the spatially variable or inhomogeneous wind field characteristics at the bridge site, a large terrain model surrounding the bridge location was installed in the wind tunnel [24]. Utilizing a terrain wind tunnel test of a trumpet-shaped mountain, the researchers analyzed the impact of non-uniform wind characteristics on the buffeting response of the main girder. The test results in wind tunnels show that the mean wind speed profile in canyons changes along the bridge span, and it cannot be simulated as a uniform wind speed profile [25]. Wind tunnel tests in mountainous canyons require the production of huge site models, the geographical range expressed by the terrain model and the scale adopted are generally small [26]. Some studies have found that as the scale decreases, modeling of complex terrain tends to have greater deviation [27]. The detailed model for the wind tunnel test of the terrain is cumbersome to construct, and conducting wind tunnel tests on different terrains can be very expensive.
In addition, unlike field measurements and wind tunnel tests, numerical simulation can quantitatively determine the wind field structure. It is easy to operate, convenient for parameter analysis, and low in cost. A computational fluid dynamics method was applied to investigate the variation in spatial characteristics of the wind field at bridge sites in complex terrains. It found that the complex terrain still has an impact on the wind field at 400 m above the peak of the terrain near the bridge site. The suddenly widened gorge results in a part of a limited distributary of the wind field and the wind speeds decrease slightly in the widening area [28]. A numerical model was established to investigate the shielding effects of mountains on the wind field in front of the bridge. The calculation results indicate that the characteristics of the wind field near the mountain at the bridge site are influenced by both the mountain and the direction of the incoming flow [29]. The simulation of the canyon terrain reveals the spatial distribution characteristics of the wind field and proposes a formula for calculating the wind speed amplification coefficient [30]. The researcher developed an overall efficient and accurate method for predicting unsteady three-dimensional airflow over complex terrain with characteristic length scales on the order of kilometers, and successfully simulated wind field changes due to terrain effects [31].
As aforementioned, the mountainous terrain is complex with different surface environments, and most studies focus on the wind field characteristics under a specific terrain condition, making it is hard to reach a unified conclusion. Considering that, the mountainous terrain can be simply divided into V-shaped and U-shaped canyons from the section perspective. Therefore, this paper focuses on the ideal V-shaped and U-shaped canyons to study the distribution of wind field characteristics in river channels, the influence of different cross-section parameters on the wind field, with numerical analysis using the finite volume method in computational fluid dynamics. The parameters to be investigated include the angle and height of the V-shaped canyon and the width and height of the U-shaped canyon.
2. Numerical Model
2.1. Canyons Section
In an effort to simplify the complex canyons section, it is essential to take the consistent nature of their outlines into account. Given the limited impact on the overall outline of the canyon, the relative height of protruding rocks or vegetation within the valley is deemed inconsequential [32]. Consequently, factors that do not significantly influence the characteristics of the canyons within this specific section are excluded. In this study, two types of canyon sections, V-shaped canyons and U-shaped canyons, were studied, as shown in Figure 1. The calculation model was obtained by establishing a simplified stretched cross-section. The parameters of the canyon encompassed the height β, angle α for V-shaped canyons, and width γ for U-shaped canyons.
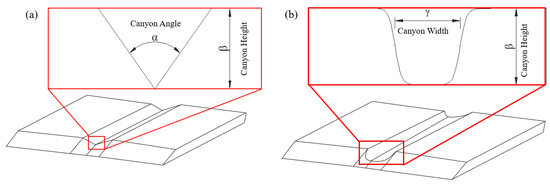
Figure 1.
Canyon parameters: (a) V-shaped canyon detail (b) U-shaped canyon detail.
2.2. Set of Cases
Eighteen cases were set for investigating different ideal canyons wind field characteristics along the river, as listed in Table 1. The height of the canyon (β) ranged from 500 m, 1000 m, to 1500 m. To enable a straightforward comparison of the two ideal canyon parameters, the half-height width of each canyon type was utilized as a standardized measure for evaluating canyon characteristics. Consequently, the angle (α) for V-shaped canyons varied from 60° to 160°, while the width (γ) for U-shaped canyons spanned from 577 m to 5671 m.

Table 1.
Parameters for V-shaped canyons and U-shaped canyons.
2.3. Numerical Simulation
The software Integrated Computer Engineering and Manufacturing code for Computational Fluid Dynamics (ICEM-CFD 19.0) was used for computational domain grid meshing, as presented in Figure 2. The computational domain measured 15,000 m in height, 16,000 m in length, and 15,000 m in width. The V-shaped canyon shown used straight lines as the canyon walls, and the canyon parameters were transformed by adjusting the inclination angle and height. The U-shaped canyon was closer to the real canyon shape by using hyperbolic tangent curves for simulation, and the height and width of the canyon were controlled by controlling the function definition domain and value domain. The model grid utilized a tetrahedral grid, which exhibited excellent adaptability and enabled the generation of high-quality grids for a wide range of complex structures. In order to better simulate the characteristics of the wind field in the canyon, the grid near the canyon surface was encrypted. It used a prism mesh to divide the wall of the mesh. The height of the first layer of the grid was 5 m, and the grid growth rate was 1.2. The total number of meshed cells exceeded 5 million, as shown in Figure 2.
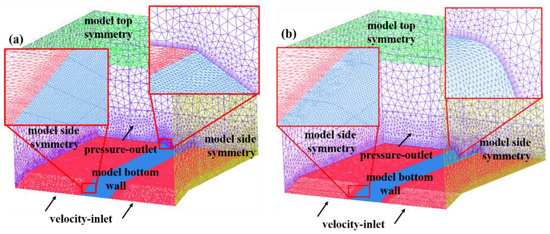
Figure 2.
Numerical simulation model: (a) V-shaped canyon grid (b) U-shaped canyon grid.
The commercial software Fluent 19.0 was used to compute the wind field characteristics of the canyons. The SST k-ω model [33] was selected as the turbulence model due to its suitability for accurately simulating reverse pressure gradient flow and separation flow. The pressure and velocity coupling scheme utilized the SIMPLEC algorithm. The discrete format used the second-order precision format. The simulation medium is defined as the incompressible air. The residual reduction for the governing equations was set at 10−6, ensuring the accuracy of the numerical results. The bottom boundary of the model was the wall boundary. The top and side boundaries were set as symmetrical boundaries. The front boundary employed a velocity inlet, whereas the back boundary functioned as a pressure outlet.
The velocity inlet boundary adopted a wind speed profile with the surface friction coefficient of the B-type surface [5,29], as shown in Figure 3. The height of gradient wind speed was 1000 m, and the gradient wind speed was assumed to be 50 m/s. The wind speed varied in an exponential law when the height was lower than 1000 m. Above 1000 m, the wind speed remained unchanged. The wind speed profile can be expressed as follows:
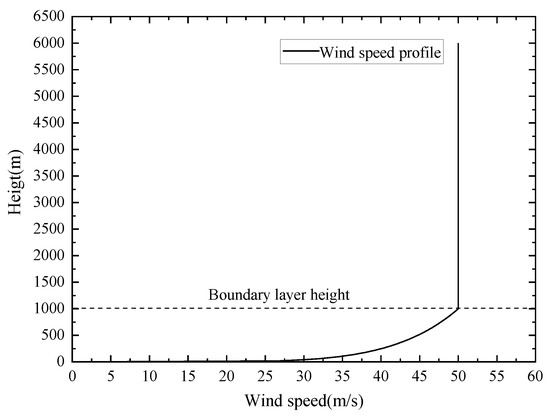
Figure 3.
Wind speed profile at the inlet boundary.
2.4. Monitoring Point Setting
To investigate the wind field distribution in the canyon, a series of wind speed monitoring points were set up in the simulative terrain. In this paper, the wind speed monitoring points were arranged in the height and horizontal direction of different sections. As shown in Figure 4, the monitoring section was arranged every 1000 m from 0 L to 14 L along the canyon section direction. In each section, twenty monitoring points which grew exponentially were arranged along the height direction at the center of the canyon, and the highest was at 5000 m. The layout of monitoring points in the canyon were set at the height of 0.2β, 0.4β, 0.6β, 0.8β, respectively, and nine monitoring points were arranged in each height layer.
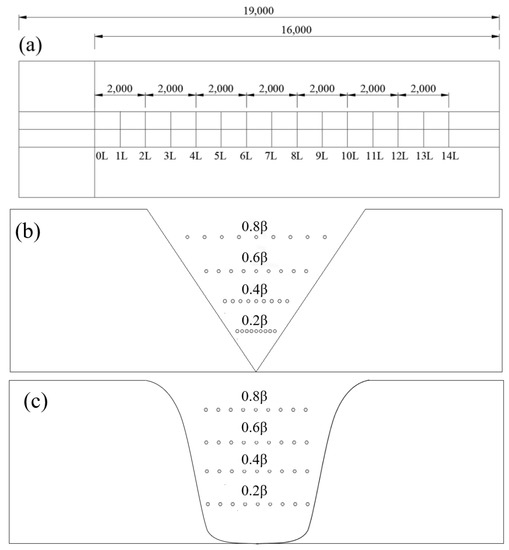
Figure 4.
Monitoring points setting: (a) Layout of monitoring sections along the river (b) Layout of section monitoring points in V-shaped canyon (c) Layout of section monitoring points in U-shaped canyon.
3. Results and Analysis
3.1. Wind Profile Characteristics along the River
The wind profiles and wind speed amplification factor at different locations of the V-shaped canyons are shown in Figure 5 and Figure 6. Compared with the inlet wind speed profile shown in Figure 3, the wind speed profiles in the V-shaped canyons differ significantly due to the influence of the canyon. For V-shaped canyon at α = 60°, it can be seen that the wind speed initially increases and then decreases with the increase in height, and it also gradually decreases along the river. The acceleration effects appear obviously within the range of the canyon height and gradually weaken outside the canyon. Meanwhile, the wind speed amplification factors follow an exponential function distribution with height along the same section, and decreases as the canyon height increases. Additionally, they decrease along the river within the range of the canyon height.
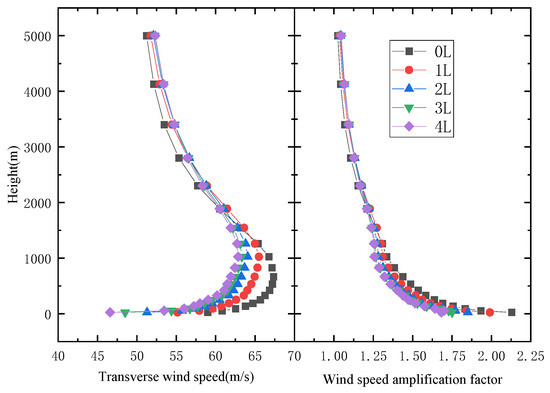
Figure 5.
V-shaped canyon wind speed profiles at different locations (α = 60°).
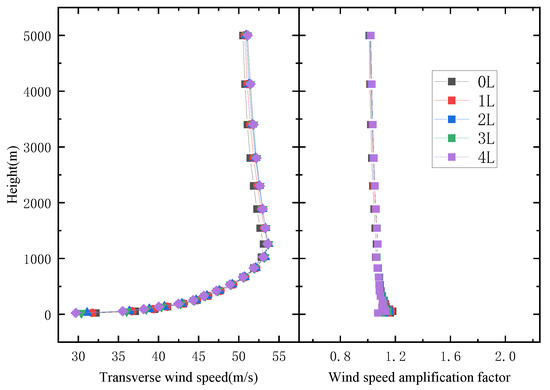
Figure 6.
V-shaped canyon wind speed profiles at different locations (α = 160°).
For V-shaped canyon at α = 160°, it can be seen that the wind speed gradually increases and eventually remains almost steady, and the wind speed amplification factors maintain stability as the height increases. Both tend to stabilize along the river, indicating that the influence of river position on the wind fields has almost disappeared.
From Figure 5 and Figure 6, it becomes evident that the wind speed decreases to the gradient wind speed when the height of the canyon is surpassed, and the wind speed gap gradually narrows across various positions. Furthermore, the wind speed inside the canyon is higher than the wind speed at the canyon mouth. As the angle of the canyon increases, the difference in wind speed between the canyon mouth and the interior diminishes. For instance, when the canyon angle is 60°, the wind speed difference between 0 L and 4 L positions exceeds 5 m/s, whereas the wind speed difference between these positions vanishes when the canyon angle reaches 160°. These observations reveal that the V-shaped canyon angle can significantly affect the wind profile characteristics along the river.
The wind profiles and wind speed amplification factor at different locations of the U-shaped canyons are shown in Figure 7 and Figure 8. Figure 7 displays the wind speed profiles for the U-shaped canyon with a width of γ = 577 m. It can be seen that the wind field distribution of the U-shaped canyon is fundamentally the same as that of the V-shaped canyon. The wind speed climbs up and then declines with the increasing height of the canyon. The acceleration effect at the bottom of the canyon is the most obvious, and the wind speed in the U-shaped canyon increase as the canyon deepens. Additionally, wind speed amplification factors decrease along the river and there is typical exponential function relation between wind speed and canyon height.
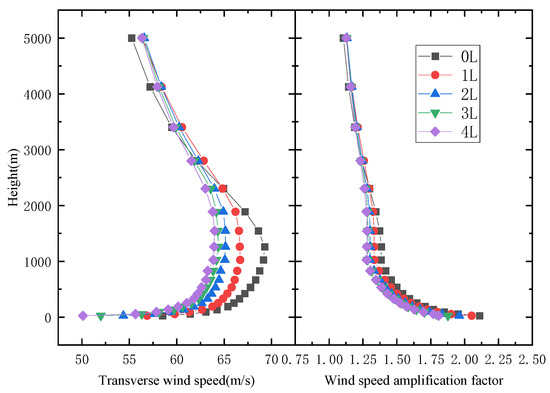
Figure 7.
U-shaped canyon wind speed profiles at different locations (γ = 577 m).
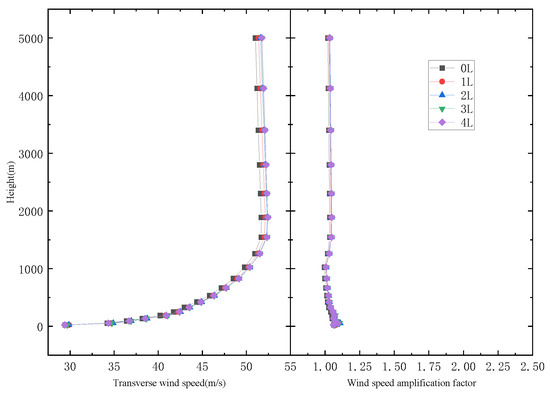
Figure 8.
U-shaped canyon wind speed profiles at different locations (γ = 5671 m).
For a U-shaped canyon with γ = 5671 m as it is shown in Figure 8, the wind speed increases with the increasing canyon height and finally tends to stabilize. The wind speed amplification factors vary slightly along the height. Neither of them are affected by the deepening of the river.
Compared to two U-shaped canyons with different widths, the U-shaped canyon also causes an obvious acceleration effect on the wind speed. However, with the increase in the width of the U-shaped canyon, the acceleration effect is noticeably weakened. It can be observed that when the wind speed amplification factor is 1.375, the height at the mouth of the canyon is about 500 m, and when the position is at 4 L, the height of the influence on the wind field is 1000 m. It indicates that the U-shaped canyon can achieve the same wind speed amplification factor despite different wind field heights. The impact of the canyon width on the wind field gradually decreases and eventually stabilizes.
3.2. Influence of Canyon Width and Angle on Wind Field
The wind profiles and wind speed amplification factor at different locations of the V-shaped canyon’s central section are shown in Figure 9 and Figure 10. The results reveal that V-shaped canyons with differing angles exert a significant influence on wind speeds, and the wind speed increases with canyon angle resulting in higher maximum wind speeds as higher altitudes. Wind speeds decrease gradually to the gradient wind speed beyond an altitude of 1000 m. The flow field exhibits greater turbulence for smaller canyon angles, signifying an inverse relationship between canyon angle and the degree of impact on the flow field. The changing law remains consistent at different locations. With the increase in distance from the mouth of the valley, the envelope range of the wind profile at different canyon angles gradually narrows and eventually stabilizes. When located at 0 L, the wind speed difference between 60° and 160° below 1000 m is approximately 15 m/s, whereas the wind speed difference at 4 L is about 10 m/s. At the same time, it can be found that the canyon angle has an effect on the overall influence height of the wind field. It shows that the smaller the canyon angle, the greater the impact on the wind field. When the angle is reduced to 160°, the influence height of the canyon reduces slightly to approximately 3000 m.
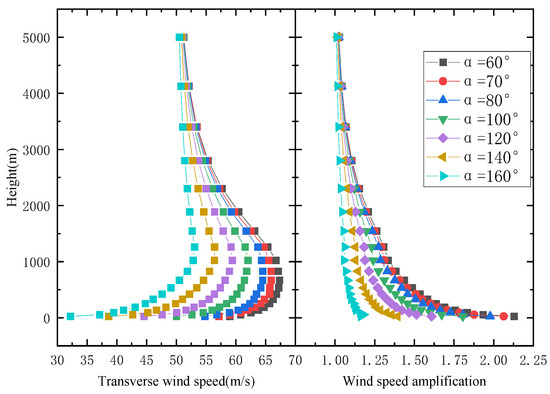
Figure 9.
V-shaped canyon central wind speed profile (position at 0 L).
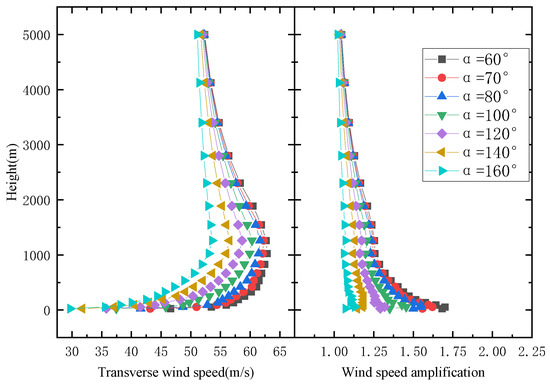
Figure 10.
V-shaped canyon central wind speed profile (position at 4 L).
The wind speed amplification coefficient decreases with the increase in canyon angle, and the gap of wind speed amplification coefficient is the most obvious at the valley bottom. With the increase in altitude, the difference of wind speed amplification coefficient between canyons at different angles gradually decreases, and the farther the distance from the canyon mouth, the narrower the envelope range of the profile curve. It can be seen from the figure that when the wind speed magnification factor is 1000 m, the magnitude of the step-like change decreases with the increase in canyon angle. It can be seen that when the canyon angle increases to 160°, the canyon wind speed amplification factor profile curve steps have basically disappeared.
The wind profiles and wind speed amplification factor at different locations of the U-shaped canyon section center are shown in Figure 11 and Figure 12. From the wind profile at a single location in the central section, as the width of the canyon increases, the wind speed gradually decreases and approaches the wind speed profile at the inlet. When the height of the canyon is lower than 1000 m, the wind speed profiles of canyons with different widths are significantly different, indicating that the canyon width has a significant impact on the wind speed within the canyon. When the height exceeds 1000 m, the wind speed profile at the mid-span gradually decreases towards the inlet gradient wind speed. Additionally, the difference in wind speed between U-shaped canyons with different widths gradually decreases with increasing height. The range of reduction in wind speed difference also decreases with increasing height. From the points of view of different positions, the distance from the mouth of the valley increases, while the envelope range of the wind speed profiles for U-shaped canyons with different widths gradually narrows. When the monitoring position is 4 L away from the mouth of the canyon, the maximum difference in wind speed between canyons of different widths is 13 m/s, and the envelope range is reduced.
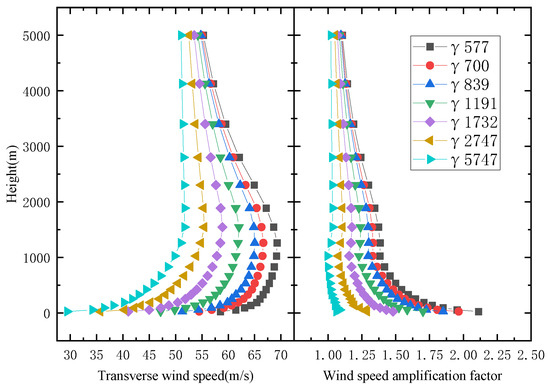
Figure 11.
U-shaped canyon central wind speed profile (position at 0 L).
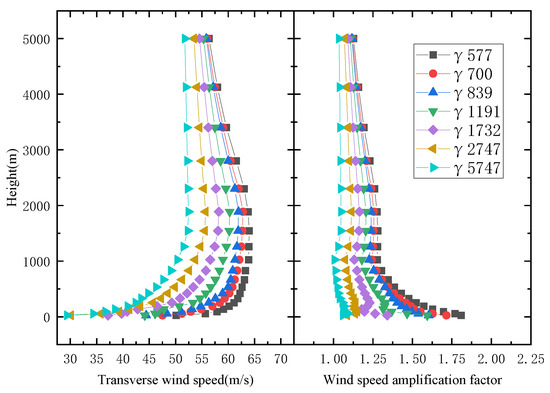
Figure 12.
U-shaped canyon central wind speed profile (position at 4 L).
From the perspective of the wind speed amplification factor, it can be observed that the factor decreases as the canyon width increases. When the height is higher than the canyon height of 1000 m, the range of variation in the wind speed amplification factor remains basically unchanged with the increase in canyon width. This means that the wind speed amplification coefficient profiles are essentially parallel above 1000 m. When the height exceeds 1000 m, the wind speed amplification coefficient gradually decreases, and finally returns to a state where the wind speed amplification coefficient is 1.0. When the height is lower than the canyon height, the wind speed amplification factor varies greatly. Additionally, as the distance from the valley mouth increases, the envelope range of the amplification factor profile line gradually narrows.
For the V-shaped canyon, it can be seen from Figure 13 that the wind speed in the same section decreases almost linearly as the canyon angle increases. When the height increases, the relationship between the wind speed and the canyon angle becomes less pronounced or less significant.
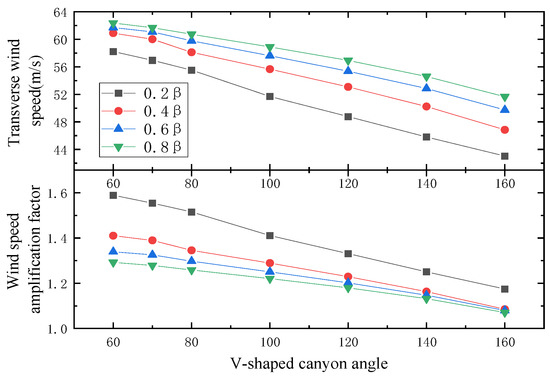
Figure 13.
Transverse wind speed comparison of V-shaped canyon.
For the U-shaped canyon, it can be seen from Figure 14 that the wind speed change law is manifestly different from that of the V-shaped canyon. The wind speed and the wind speed amplification factor decrease logarithmically as the canyon width increases. The variational amplitude of wind speed about the canyon width gradually decreases when height becomes higher. Eventually, the difference in wind speed caused by the canyon angle or width disappears when the height is sufficiently high.
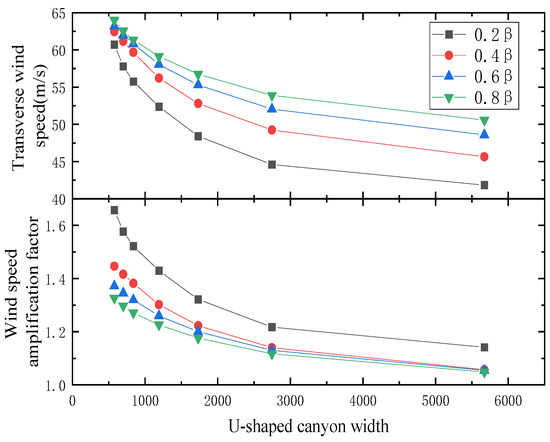
Figure 14.
Transverse wind speed comparison of U-shaped canyon.
3.3. Horizontal Wind Speed Distribution
In order to study the horizontal wind speed distribution of V-shaped and U-shaped canyons, the following is a comparative example of the largest wind speed acceleration effect at the height of 0.2β.
For the V-shaped canyon, as shown in Figure 15, the wind speed at the same height gradually decreases as the canyon angle increases, and the extent of the decrease is positively correlated with the angle. When approaching the center of the canyon, the wind speed changes at different angles are essentially the same, exhibiting higher wind speeds on both sides and lower wind speeds in the middle. When the canyon angle reaches 160°, the wind speed in the middle of the V-shaped canyon remained nearly unchanged.
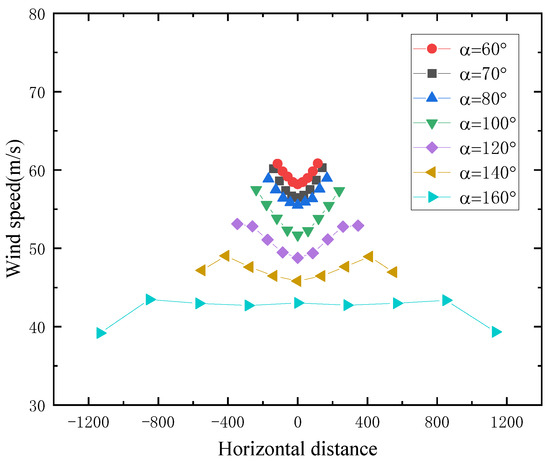
Figure 15.
V-shaped canyon horizontal wind speed distribution.
It can be seen from the Figure 16 that when the canyon angle is large enough, for example, α = 160°, the wind speed in the canyon away from the walls on both sides is practically the same as the incoming wind speed, which indicates that the influence of the canyon on the wind field has basically disappeared. Judging from the distribution along the river, the airflow will produce a significant wind speed increase when entering the canyon, which gradually decreases along the river and finally forms a stable wind speed profile. From the perspective of the length of change in wind speed along the river, it can be seen that as the canyon angle increases, the length of change required for the wind speed to reach the same magnitude in the canyon gradually decreases. This shows that when the canyon angle increases, the wind speed acceleration effect at the mouth of canyon gradually disappears.
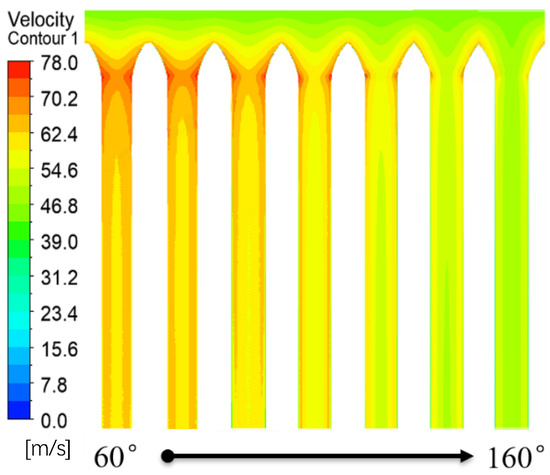
Figure 16.
Horizontal wind speed contour of V-shaped canyon.
For the U-shaped canyon, as shown in Figure 17 and Figure 18. When the canyon width increases, the wind speed at the same height gradually declines. The wind speed presents a U-shaped distribution. When the canyon width reaches 5671 m, the wind speed in the middle of the canyon exhibits a uniform distribution, indicating that the airflow in the middle of the canyon is minimally influenced by the canyon boundaries. The variation pattern of wind speed is roughly the same as that of the V-shaped canyon. Additionally, the distribution of wind speed contours is similar.
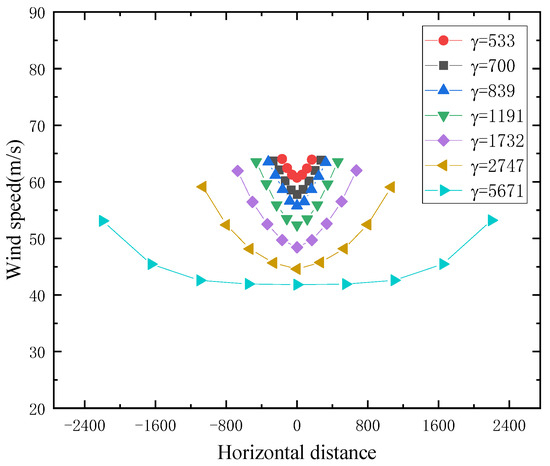
Figure 17.
U-shaped canyon horizontal wind speed distribution.
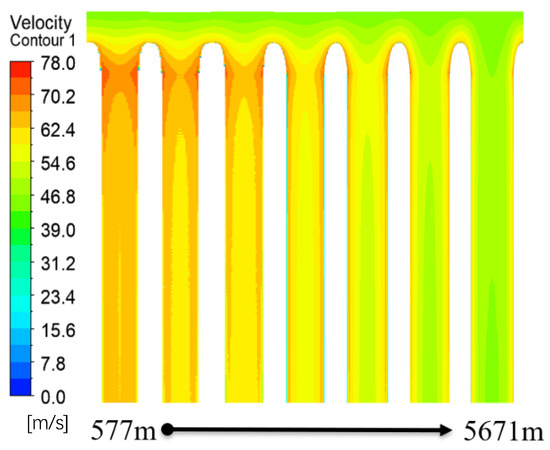
Figure 18.
Horizontal wind speed contour of U-shaped canyon.
3.4. Effect of Canyon Height on Wind Profile
In order to study the influence of different canyon heights on the wind field in the canyon, the wind speed distribution within the V-shaped canyon with an angle of α = 70° and the U-shaped canyon with a width of γ = 700 m at the height of 500 m, 1000 m, 1500 m were studied.
Figure 19 and Figure 20 are wind speed profiles of canyons at different heights. The wind speed profiles of canyons with different heights exhibit noticeable differences. The wind speed in the middle of the canyon section increases significantly as the canyon height increases, and there is a slight decrease in the height at which the maximum wind speed occurs with increasing canyon height. The distribution law of the wind speed amplification factor along the height still follows a logarithmic variation. In terms of the height of the influence on the wind field, it gradually increases with increasing canyon height.
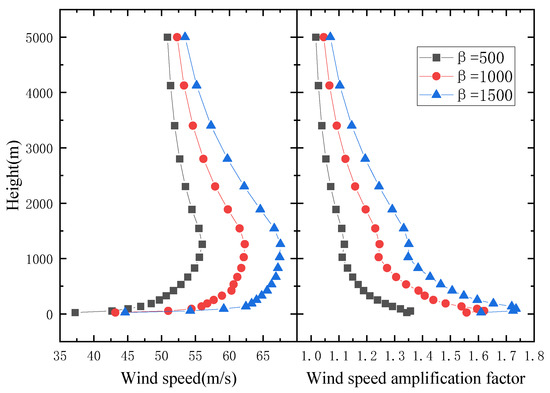
Figure 19.
Wind speed profiles at different canyon heights of V-shaped canyon.
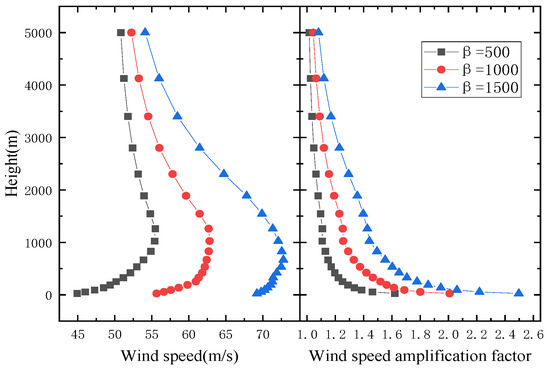
Figure 20.
Wind speed profiles at different canyon heights of U-shaped canyon.
3.5. Wind Speed Amplification Factor
This section investigates the distribution patterns of the wind speed amplification coefficient across varying heights. Figure 21 depicts the fitting of the wind speed amplification coefficient profile for V-shaped canyons of various angles, while Figure 22 illustrates the fitting of the wind speed amplification coefficient profile for U-shaped canyons of different width. In both figures, the height of monitoring points within the canyon is denoted as H, the canyon height as β, the wind speed within the canyon as V, and the inlet wind speed at the same height as V0. The fitting formula is given as follows:
where y = V/V0 is the wind speed amplification coefficient; x = H/β denote the dimensionless height; a, b, and c are curve-fitting parameters, which are listed in Table 2.
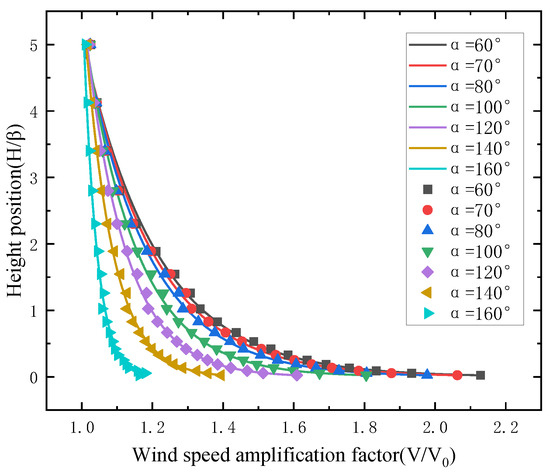
Figure 21.
Fitting curves of wind speed amplification factor in V-shaped canyons.
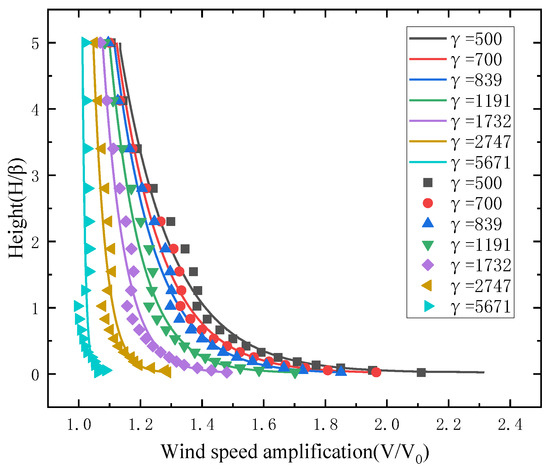
Figure 22.
Fitting curves of wind speed amplification factor in U-shaped canyons.

Table 2.
Fitting parameters of wind speed amplification factor.
The results demonstrate that the wind speed amplification coefficient profiles of both the ideal V-shaped canyon and U-shaped canyon exhibit a favorable adherence to the logarithmic law. As the width and angle of the canyon increase, there is a gradual decrease observed in the fitting parameters a and b. Due to the significant wind speed amplification effect, relying solely on the current wind code, such as Equation (1), for designing wind speeds may result in underestimating the actual wind speed in practical engineering scenarios. Therefore, to multiply the design wind speed specified in the wind code by Equation (2) can achieve greater accuracy and safety in constructing bridges in mountainous areas. The parameters in Equation (2) can be determined by taking into account the characteristics of the canyon and referring to Table 2.
4. Conclusions
This paper has presented a numerical simulation of ideal V-shaped and U-shaped canyons to investigate their wind field characteristics. Factors such as varying heights, angles, and widths were considered in this study, which aimed to comprehend the influence of these parameters on the wind field characteristics within the canyons. The findings of this research can serve as a valuable reference for establishing wind speed standards for bridge wind resistance design. The main conclusions are listed as follows:
- The ideal canyon wind speed amplification coefficient in the profile along the height corresponds to a logarithmic evolution pattern, and the acceleration effect of the wind field increases with the increase in canyon height.
- The V-shaped canyon’s angle is linearly related to the wind speed amplification coefficient, while the U-shaped canyon’s width has a logarithmical relationship with the coefficient.
- The wind speed amplification effect curves conform to the logarithmic law and increases as the V-shaped canyon angle or U-shaped canyon width decreases. Incorporating the amplification effect of wind speed variation along height is highly beneficial for establishing more accurate design standards for wind speeds in bridge engineering.
Author Contributions
Conceptualization, J.Y.; methodology, J.Y.; validation, M.L.; investigation, M.L.; writing—Original draft preparation, Z.Z. and X.X.; writing—Review and editing, Z.Z. and X.X.; supervision, J.Y. and M.L. All authors have read and agreed to the published version of the manuscript.
Funding
This research received no external funding.
Institutional Review Board Statement
Not applicable.
Informed Consent Statement
Not applicable.
Data Availability Statement
The data presented in this study are available on request from the corresponding author.
Conflicts of Interest
The authors declare no conflict of interest.
References
- Wu, L.; Ju, J.; Zhang, J.; Zhang, M.; Li, Y. Vibration Phase Difference Analysis of Long-Span Suspension Bridge during Flutter. Eng. Struct. 2023, 276, 115351. [Google Scholar] [CrossRef]
- Wu, L.; Zhou, Z.; Zhang, J.; Zhang, M. A Numerical Method for Conformal Mapping of Closed Box Girder Bridges and Its Application. Sustainability 2023, 15, 6291. [Google Scholar] [CrossRef]
- Zhang, Y.; Zhou, M. Field Investigation and Wind-Environment Numerical Simulation of Cable-Stayed Bridge Site in the West Midlands Region. Adv. Mater. Res. 2011, 255–260, 4202–4206. [Google Scholar] [CrossRef]
- Li, Y.; Hu, P.; Xu, X.; Qiu, J. Wind Characteristics at Bridge Site in a Deep-Cutting Gorge by Wind Tunnel Test. J. Wind Eng. Ind. Aerodyn. 2017, 160, 30–46. [Google Scholar] [CrossRef]
- Wind-Resistent Design Specification for Highway Bridges; Ministry of Transport of the People’s Republic of China: Beijing, China, 2018.
- Xu, F.Y.; Zhou, J. Review on the Characteristics of Wind Fields at Bridge Site in Mountainous Areas. J. Disaster Prev. Mitig. Eng. 2017, 37, 502–510. [Google Scholar] [CrossRef]
- Wu, F.; Cui, W.; Zhao, L.; Guo, Z.; Li, Q.; Ge, Y. Field Measurements of Wind Microclimate at the Vehicle Level on a Bridge Deck under Typical Canyon Terrain. J. Bridge Eng. 2023, 28, 04023013. [Google Scholar] [CrossRef]
- Huang, G.; Jiang, Y.; Peng, L.; Solari, G. Characteristics of Intense Winds in Mountain Area Based on Field Measurement: Focusing on Thunderstorm Winds. J. Wind Eng. Ind. Aerodyn. 2019, 190, 166–182. [Google Scholar] [CrossRef]
- Zhang, J.; Zhang, M.; Li, Y.; Jiang, F. Comparison of Wind Characteristics in Different Directions of Deep-Cut Gorges Based on Field Measurements. J. Wind Eng. Ind. Aerodyn. 2021, 212, 104595. [Google Scholar] [CrossRef]
- Jiang, F.; Zhang, M.; Li, Y.; Zhang, J. Field Measurement Study of Wind Characteristics in Mountain Terrain: Focusing on Sudden Intense Winds. J. Wind Eng. Ind. Aerodyn. 2021, 218, 104781. [Google Scholar] [CrossRef]
- Liao, H.; Jing, H.; Ma, C.; Tao, Q. Field Measurement Study on Turbulence Field by Wind Tower and Windcube Lidar in Mountain Valley. J. Wind Eng. Ind. Aerodyn. 2020, 197, 104090. [Google Scholar] [CrossRef]
- Zhou, Z.; Mao, W.; Ding, Q. Experimental and Numerical Studies on Flutter Stability of a Closed Box Girder Accounting for Ground Effects. J. Fluids Struct. 2019, 84, 1–17. [Google Scholar] [CrossRef]
- Guo, W.; Wang, Y.; Xia, H.; Lu, S. Wind Tunnel Test on Aerodynamic Effect of Wind Barriers on Train-Bridge System. Sci. China Technol. Sci. 2015, 58, 219–225. [Google Scholar] [CrossRef]
- He, W.; Guo, X.; Zou, Y.; He, X. Wind Tunnel Test on the Effect of Wind Barrier Porosity on Train-Bridge System. J. Vib. Shock 2015, 34, 93–97. [Google Scholar] [CrossRef]
- Zhang, J.; Zhang, M.; Li, Y.; Qian, Y. Local Wind Characteristics on Bridge Deck of Twin-Box Girder Considering Wind Barriers by Large-Scale Wind Tunnel Tests. Nat. Hazards 2020, 103, 751–766. [Google Scholar] [CrossRef]
- Wang, Z.; Zhang, W.; Tian, G.; Liu, Z. Joint Values Determination of Wind and Temperature Actions on Long-Span Bridges: Copula-Based Analysis Using Long-Term Meteorological Data. Eng. Struct. 2020, 219, 110866. [Google Scholar] [CrossRef]
- Xing, L.; Zhang, M.; Li, Y.; Zhang, Z. Large Eddy Simulation of the Fluctuating Wind Environment at a Bridge Site in the Mountainous Area. Adv. Bridge Eng. 2021, 2, 1–23. [Google Scholar] [CrossRef]
- Han, Y.; Shen, L.; Xu, G.; Cai, C.S. Multiscale Simulation of Wind Field on a Long-Span Bridge Site in Mountainous Area. J. Wind Eng. Ind. Aerodyn. 2018, 177, 260–274. [Google Scholar] [CrossRef]
- Tang, H.; Li, Y.; Shum, K.M.; Xu, X. Non-Uniform Wind Characteristics in Mountainous Areas and Effects on Flutter Performance of a Long-Span Suspension Bridge. J. Wind Eng. Ind. Aerodyn. 2020, 201, 104177. [Google Scholar] [CrossRef]
- Lystad, T.M.; Fenerci, A.; Oiseth, O. Evaluation of Mast Measurements and Wind Tunnel Terrain Models to Describe Spatially Variable Wind Field Characteristics for Long-Span Bridge Design. J. Wind Eng. Ind. Aerodyn. 2018, 179, 558–573. [Google Scholar] [CrossRef]
- Song, J.; Li, J.; Flay, R.G.J. Field Measurements and Wind Tunnel Investigation of Wind Characteristics at a Bridge Site in a Y-Shaped Valley. J. Wind Eng. Ind. Aerodyn. 2020, 202, 104199. [Google Scholar] [CrossRef]
- Yu, C.; Li, Y.; Zhang, M.; Zhang, Y.; Zhai, G. Wind Characteristics along a Bridge Catwalk in a Deep-Cutting Gorge from Field Measurements. J. Wind Eng. Ind. Aerodyn. 2019, 186, 94–104. [Google Scholar] [CrossRef]
- Zhang, M.; Zhang, J.; Chen, H.; Xin, X.; Li, Y.; Jiang, F. Probabilistic Wind Spectrum Model Based on Correlation of Wind Parameters in Mountainous Areas: Focusing on von Karman Spectrum. J. Wind Eng. Ind. Aerodyn. 2023, 234, 105337. [Google Scholar] [CrossRef]
- Hu, P.; Han, Y.; Cai, C.S.; Cheng, W. Wind Characteristics and Flutter Performance of a Long-Span Suspension Bridge Located in a Deep-Cutting Gorge. Eng. Struct. 2021, 233, 111841. [Google Scholar] [CrossRef]
- Shen, Z.; Li, J.; Li, R.; Gao, G. Nonuniform Wind Characteristics and Buffeting Response of a Composite Cable-Stayed Bridge in a Trumpet-Shaped Mountain Pass. J. Wind Eng. Ind. Aerodyn. 2021, 217, 104730. [Google Scholar] [CrossRef]
- Wang, F.; Chen, X.; He, R.; Liu, Y.; Hao, J.; Li, J. Wind Characteristics in Mountainous Valleys Obtained through Field Measurement. Appl. Sci. 2021, 11, 7717. [Google Scholar] [CrossRef]
- Bowen, A. Modelling of Strong Wind Flows over Complex Terrain at Small Geometric Scales. J. Wind Eng. Ind. Aerodyn. 2003, 91, 1859–1871. [Google Scholar] [CrossRef]
- Wu, L.; Zhang, M.; Li, Y.; Wei, K. Numerical Simulation of Wind Characteristics at Bridge Sites in Complex Mountainous Terrains. J. Southwest Jiaotong Univ. 2019, 54, 915–922. [Google Scholar] [CrossRef]
- Zhang, M.; Yu, J.; Zhang, J.; Wu, L. Study on the Wind-Field Characteristics over a Bridge Site Due to the Shielding Effects of Mountains in a Deep Gorge via Numerical Simulation. Adv. Struct. Eng. 2019, 22, 3055–3065. [Google Scholar] [CrossRef]
- Hong, X.; Guo, W.; Xiong, A. Numerical Simulation of Distribution Characteristic of Wind Fields and Terrain’s Influence in Mountain Canyon. J. Chang. Univ. 2017, 37, 56–64. [Google Scholar] [CrossRef]
- Uchida, T.; Ohya, Y. Large-Eddy Simulation of Turbulent Airflow over Complex Terrain. J. Wind Eng. Ind. Aerodyn. 2003, 91, 219–229. [Google Scholar] [CrossRef]
- Wang, J. Wind Spatial Distribution Characteristics in the U-Shaped Valley and Its Effect on Buffeting Response of Long-Span Bridges; Chang’an University: Xi’an, China, 2022. [Google Scholar]
- Menter, F.R. Two-Equation Eddy-Viscosity Turbulence Models for Engineering Applications. AIAA J. 1994, 32, 1598–1605. [Google Scholar] [CrossRef]
Disclaimer/Publisher’s Note: The statements, opinions and data contained in all publications are solely those of the individual author(s) and contributor(s) and not of MDPI and/or the editor(s). MDPI and/or the editor(s) disclaim responsibility for any injury to people or property resulting from any ideas, methods, instructions or products referred to in the content. |
© 2023 by the authors. Licensee MDPI, Basel, Switzerland. This article is an open access article distributed under the terms and conditions of the Creative Commons Attribution (CC BY) license (https://creativecommons.org/licenses/by/4.0/).