
Integrating “Neoliberal-Turn” and “Social-Turn” Constructs in Examining Sustainable Development and Happiness and Life Satisfaction: A Global-, Country Cluster-, and Country-Level Study


Abstract
1. Introduction
2. Literature Review and Hypotheses Development
2.1. Briefing on National Development Models
2.2. Global Competitiveness
2.3. Sustainable Development
2.3.1. Economic Dimension
- Prosperity
2.3.2. Social Dimension
- People
- Peace
2.3.3. Environmental Dimension
- Planet
- Resources
2.4. Happiness and Life Satisfaction
2.5. Foreign Direct Investment
2.5.1. FDII
2.5.2. FDIO
2.5.3. FDII–FDIO Relationship
2.6. Hypotheses
3. Method
3.1. Measures Selection and Data Sources
3.2. Country Cluster Determination

| Country Cluster | Countries |
|---|---|
|
Advanced Economies | Australia, Belgium, Canada, Cyprus, Czech Republic, Denmark, Estonia, Finland, France, Germany, Greece, Hong Kong SAR, Iceland, Ireland, Israel, Italy, Japan, Korea, Rep., Latvia, Lithuania, Luxembourg, Malta, Netherlands, New Zealand, Norway, Portugal, Singapore, Slovak Republic, Slovenia, Spain, Sweden, Switzerland, United Kingdom, United States. |
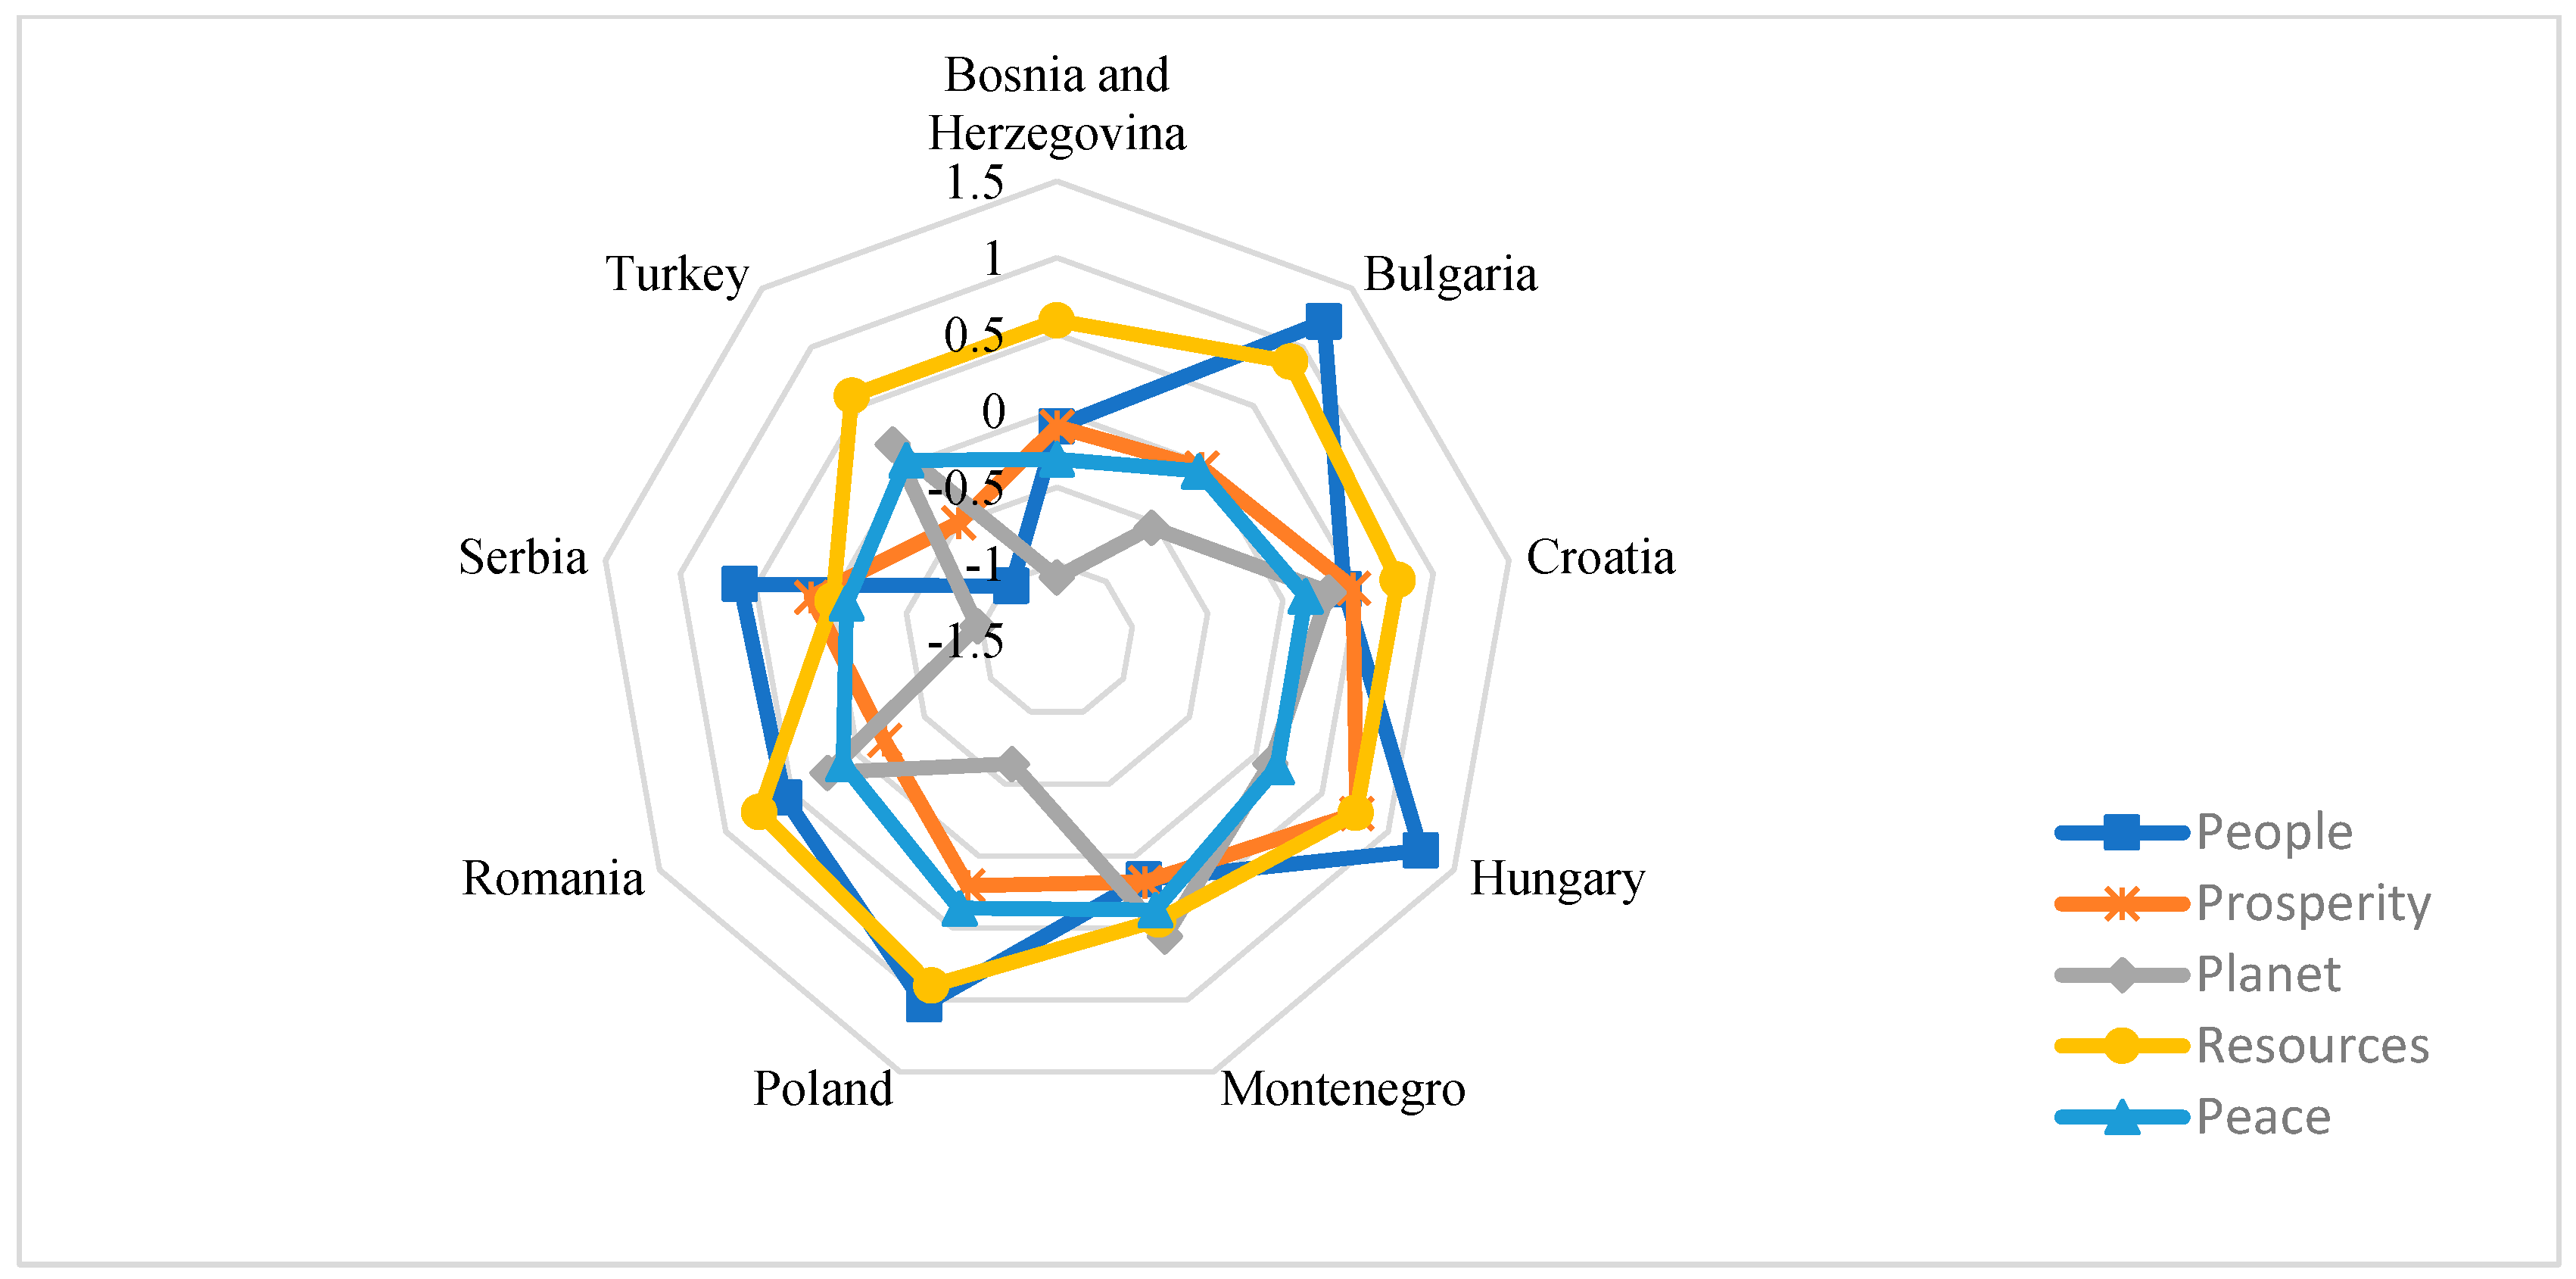
| Emerging and Developing Europe | Bosnia and Herzegovina, Bulgaria, Croatia, Hungary, Montenegro, Poland, Romania, Serbia, Turkey. |
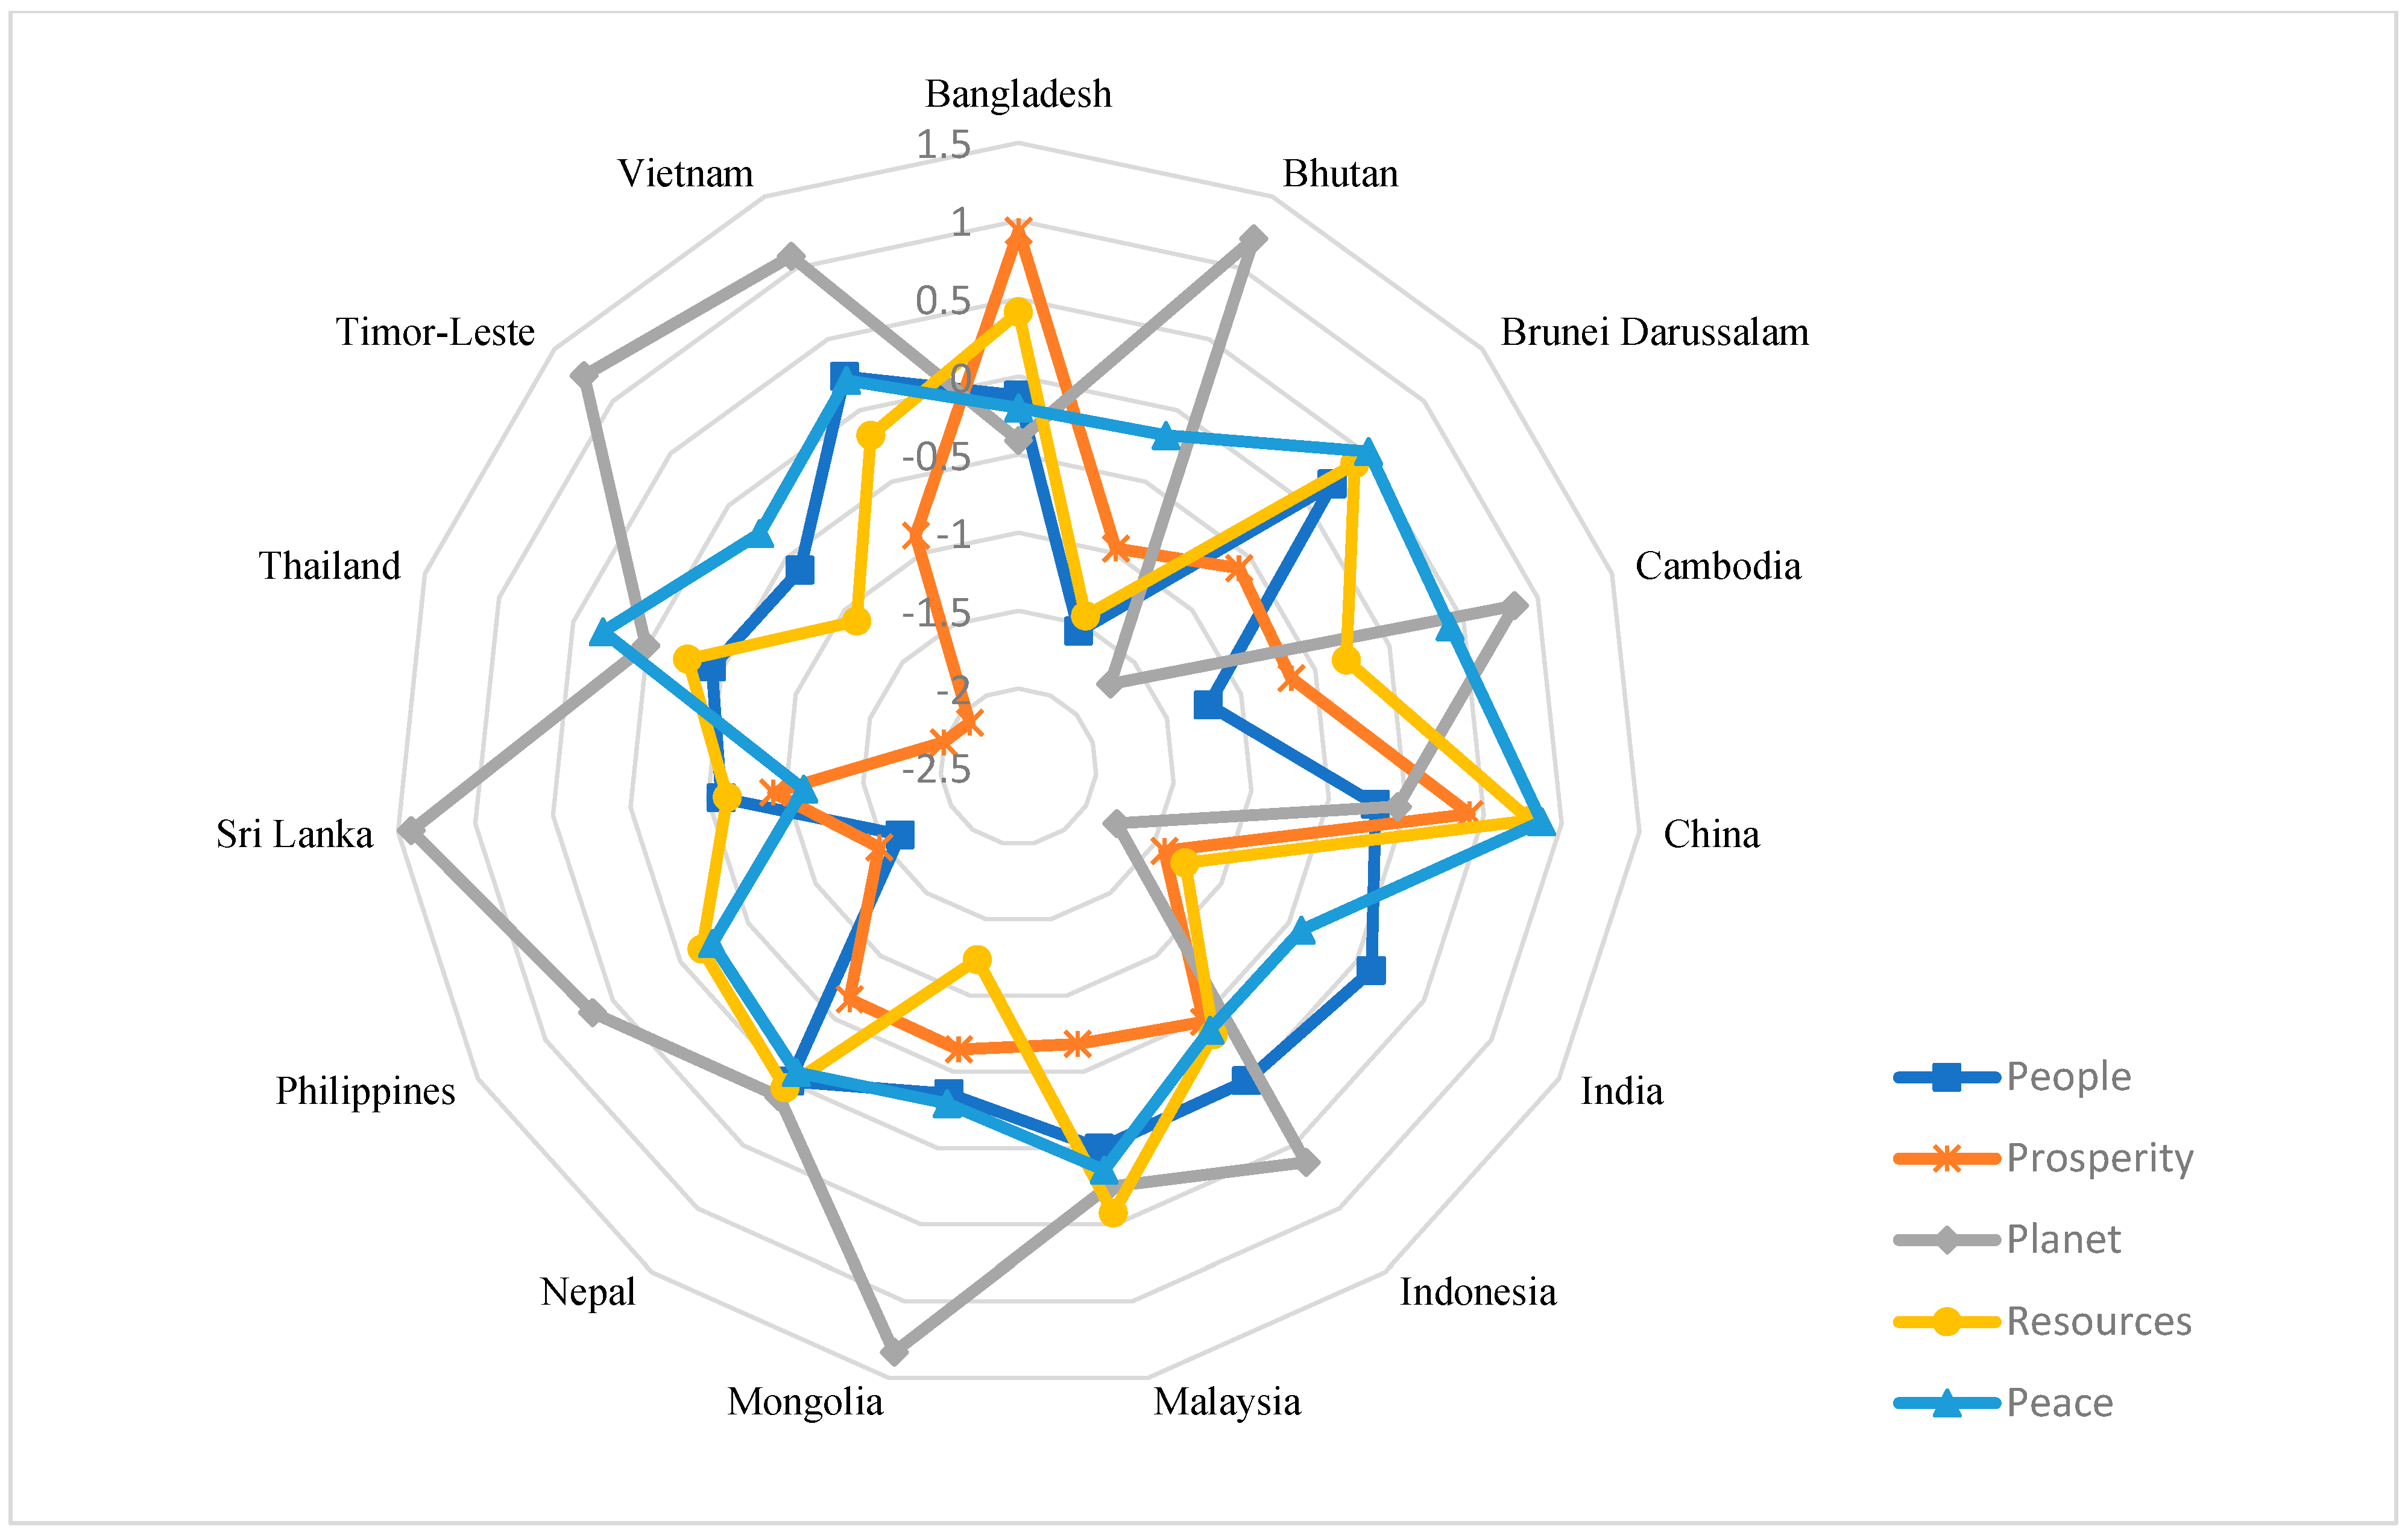
| Emerging and Developing Asia | Bangladesh, Bhutan, Brunei Darussalam, Cambodia, China, India, Indonesia, Malaysia, Mongolia, Nepal, Philippines, Sri Lanka, Thailand, Timor-Leste, Vietnam. |
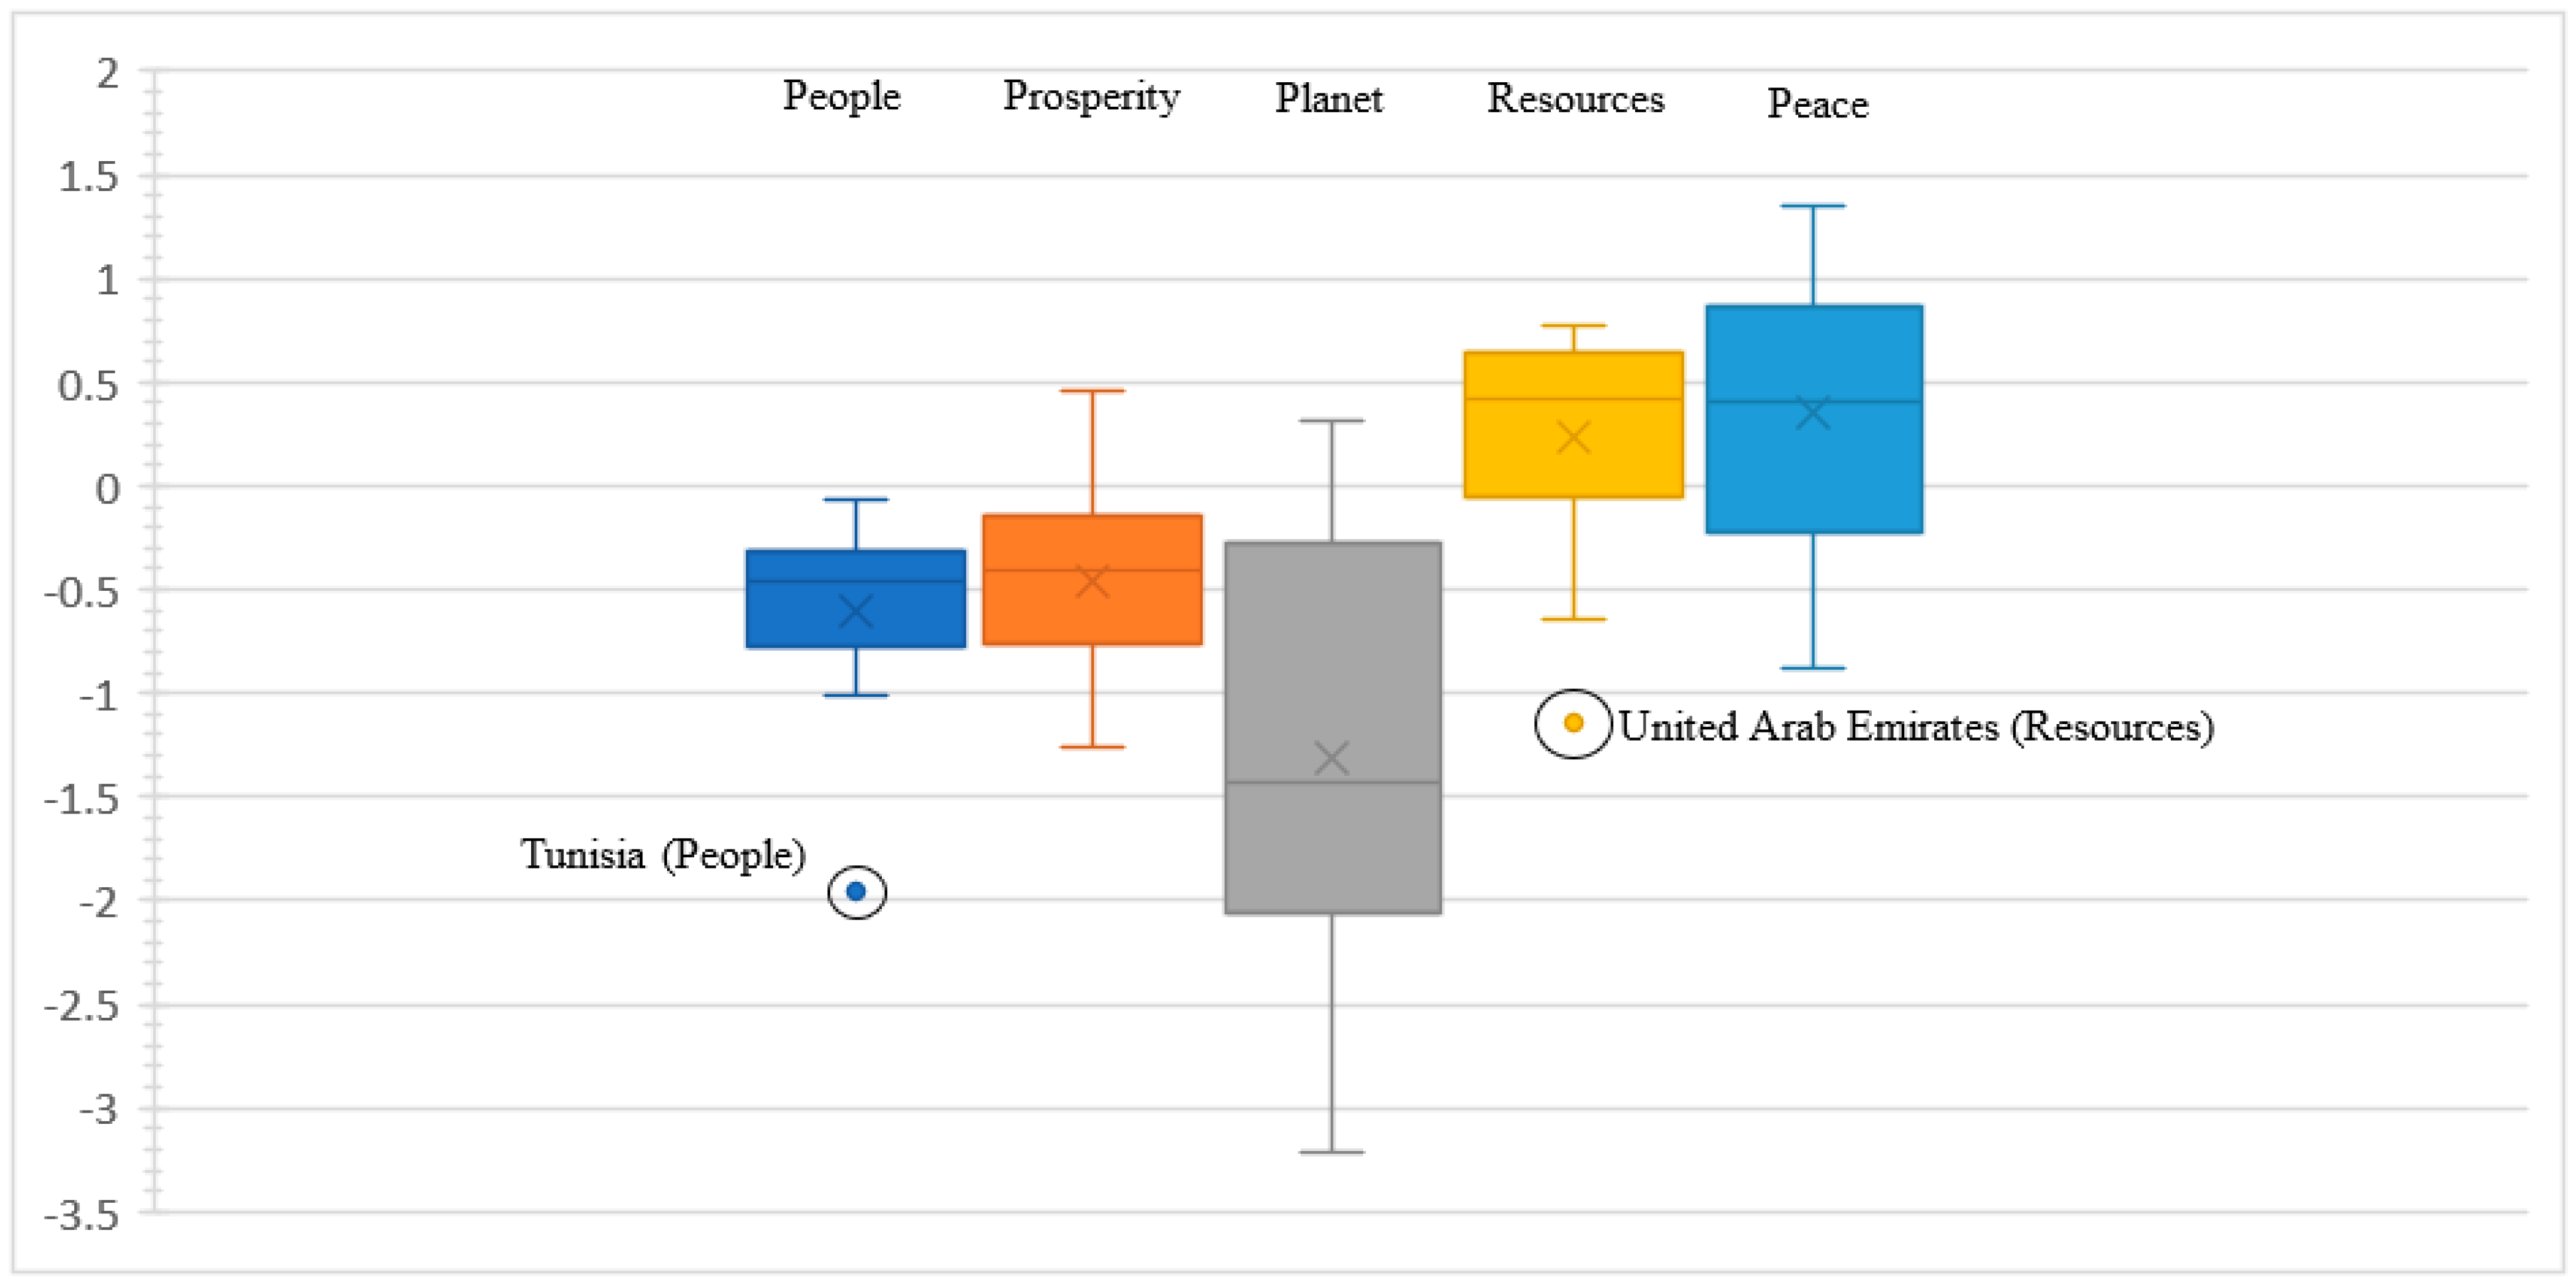
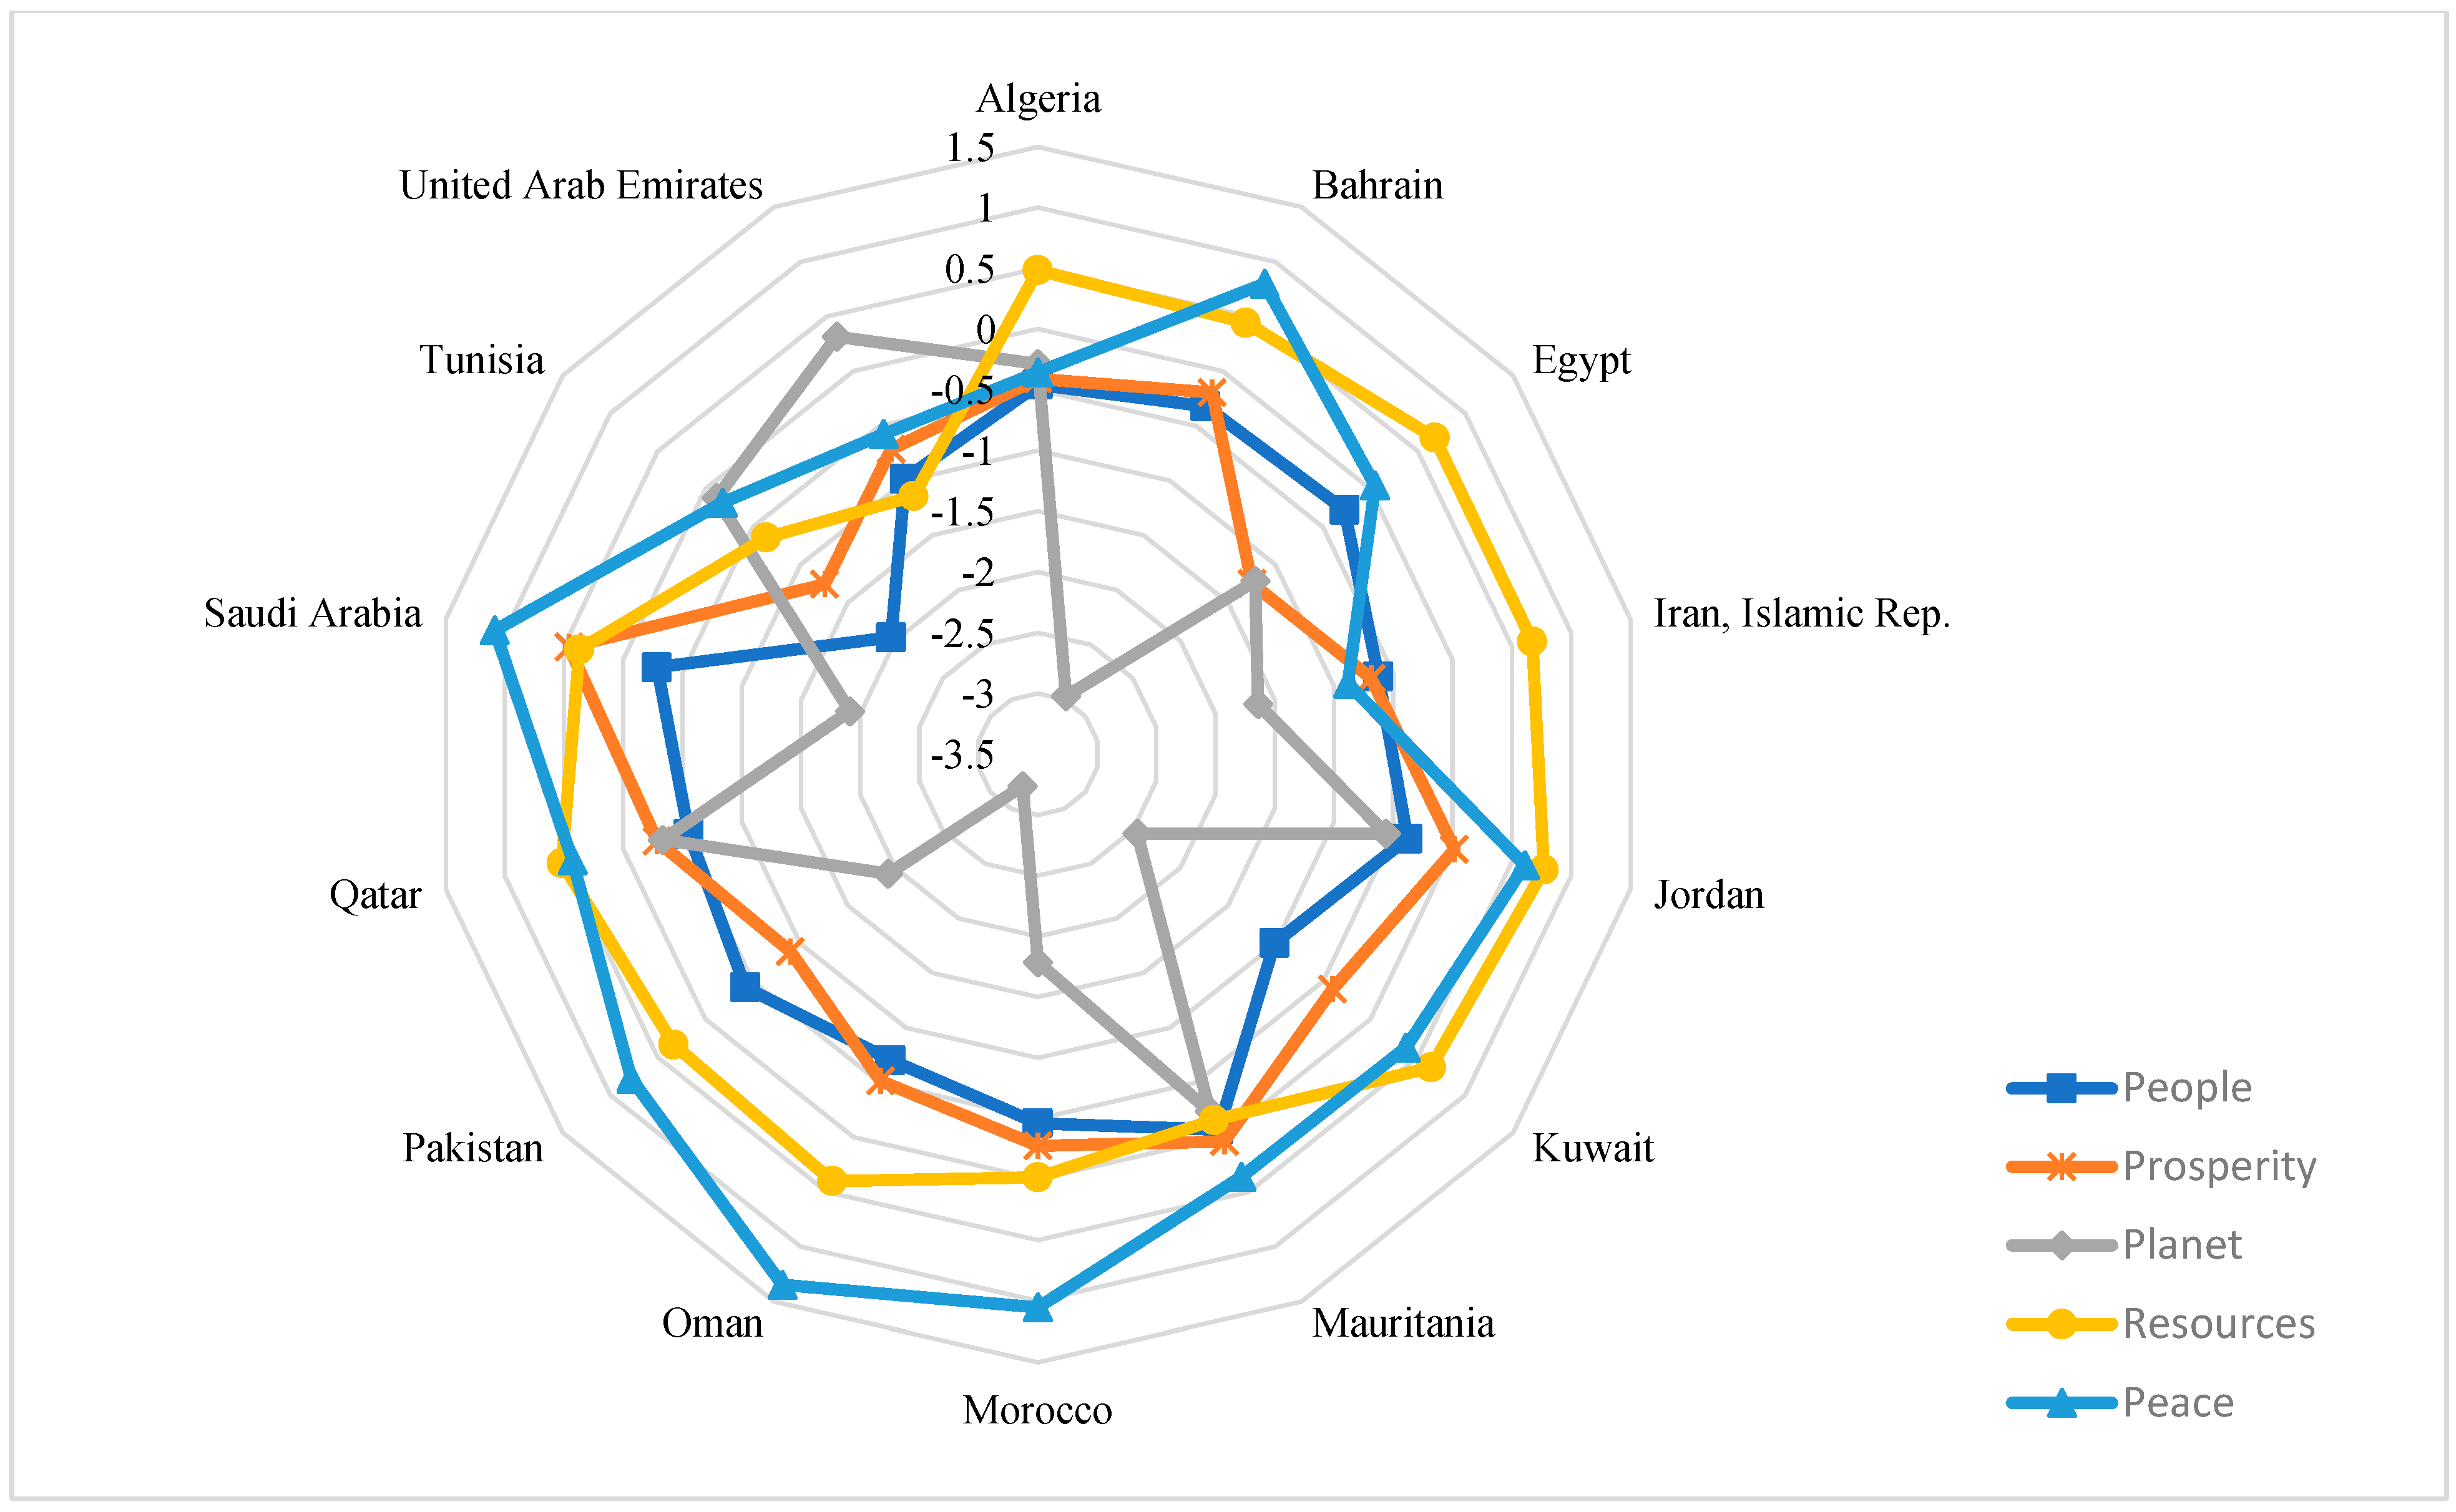
| Middle East, North Africa, and Pakistan | Algeria, Bahrain, Egypt, Iran Islamic Rep., Jordan, Kuwait, Mauritania, Morocco, Oman, Pakistan, Qatar, Saudi Arabia, Tunisia, United Arab Emirates. |
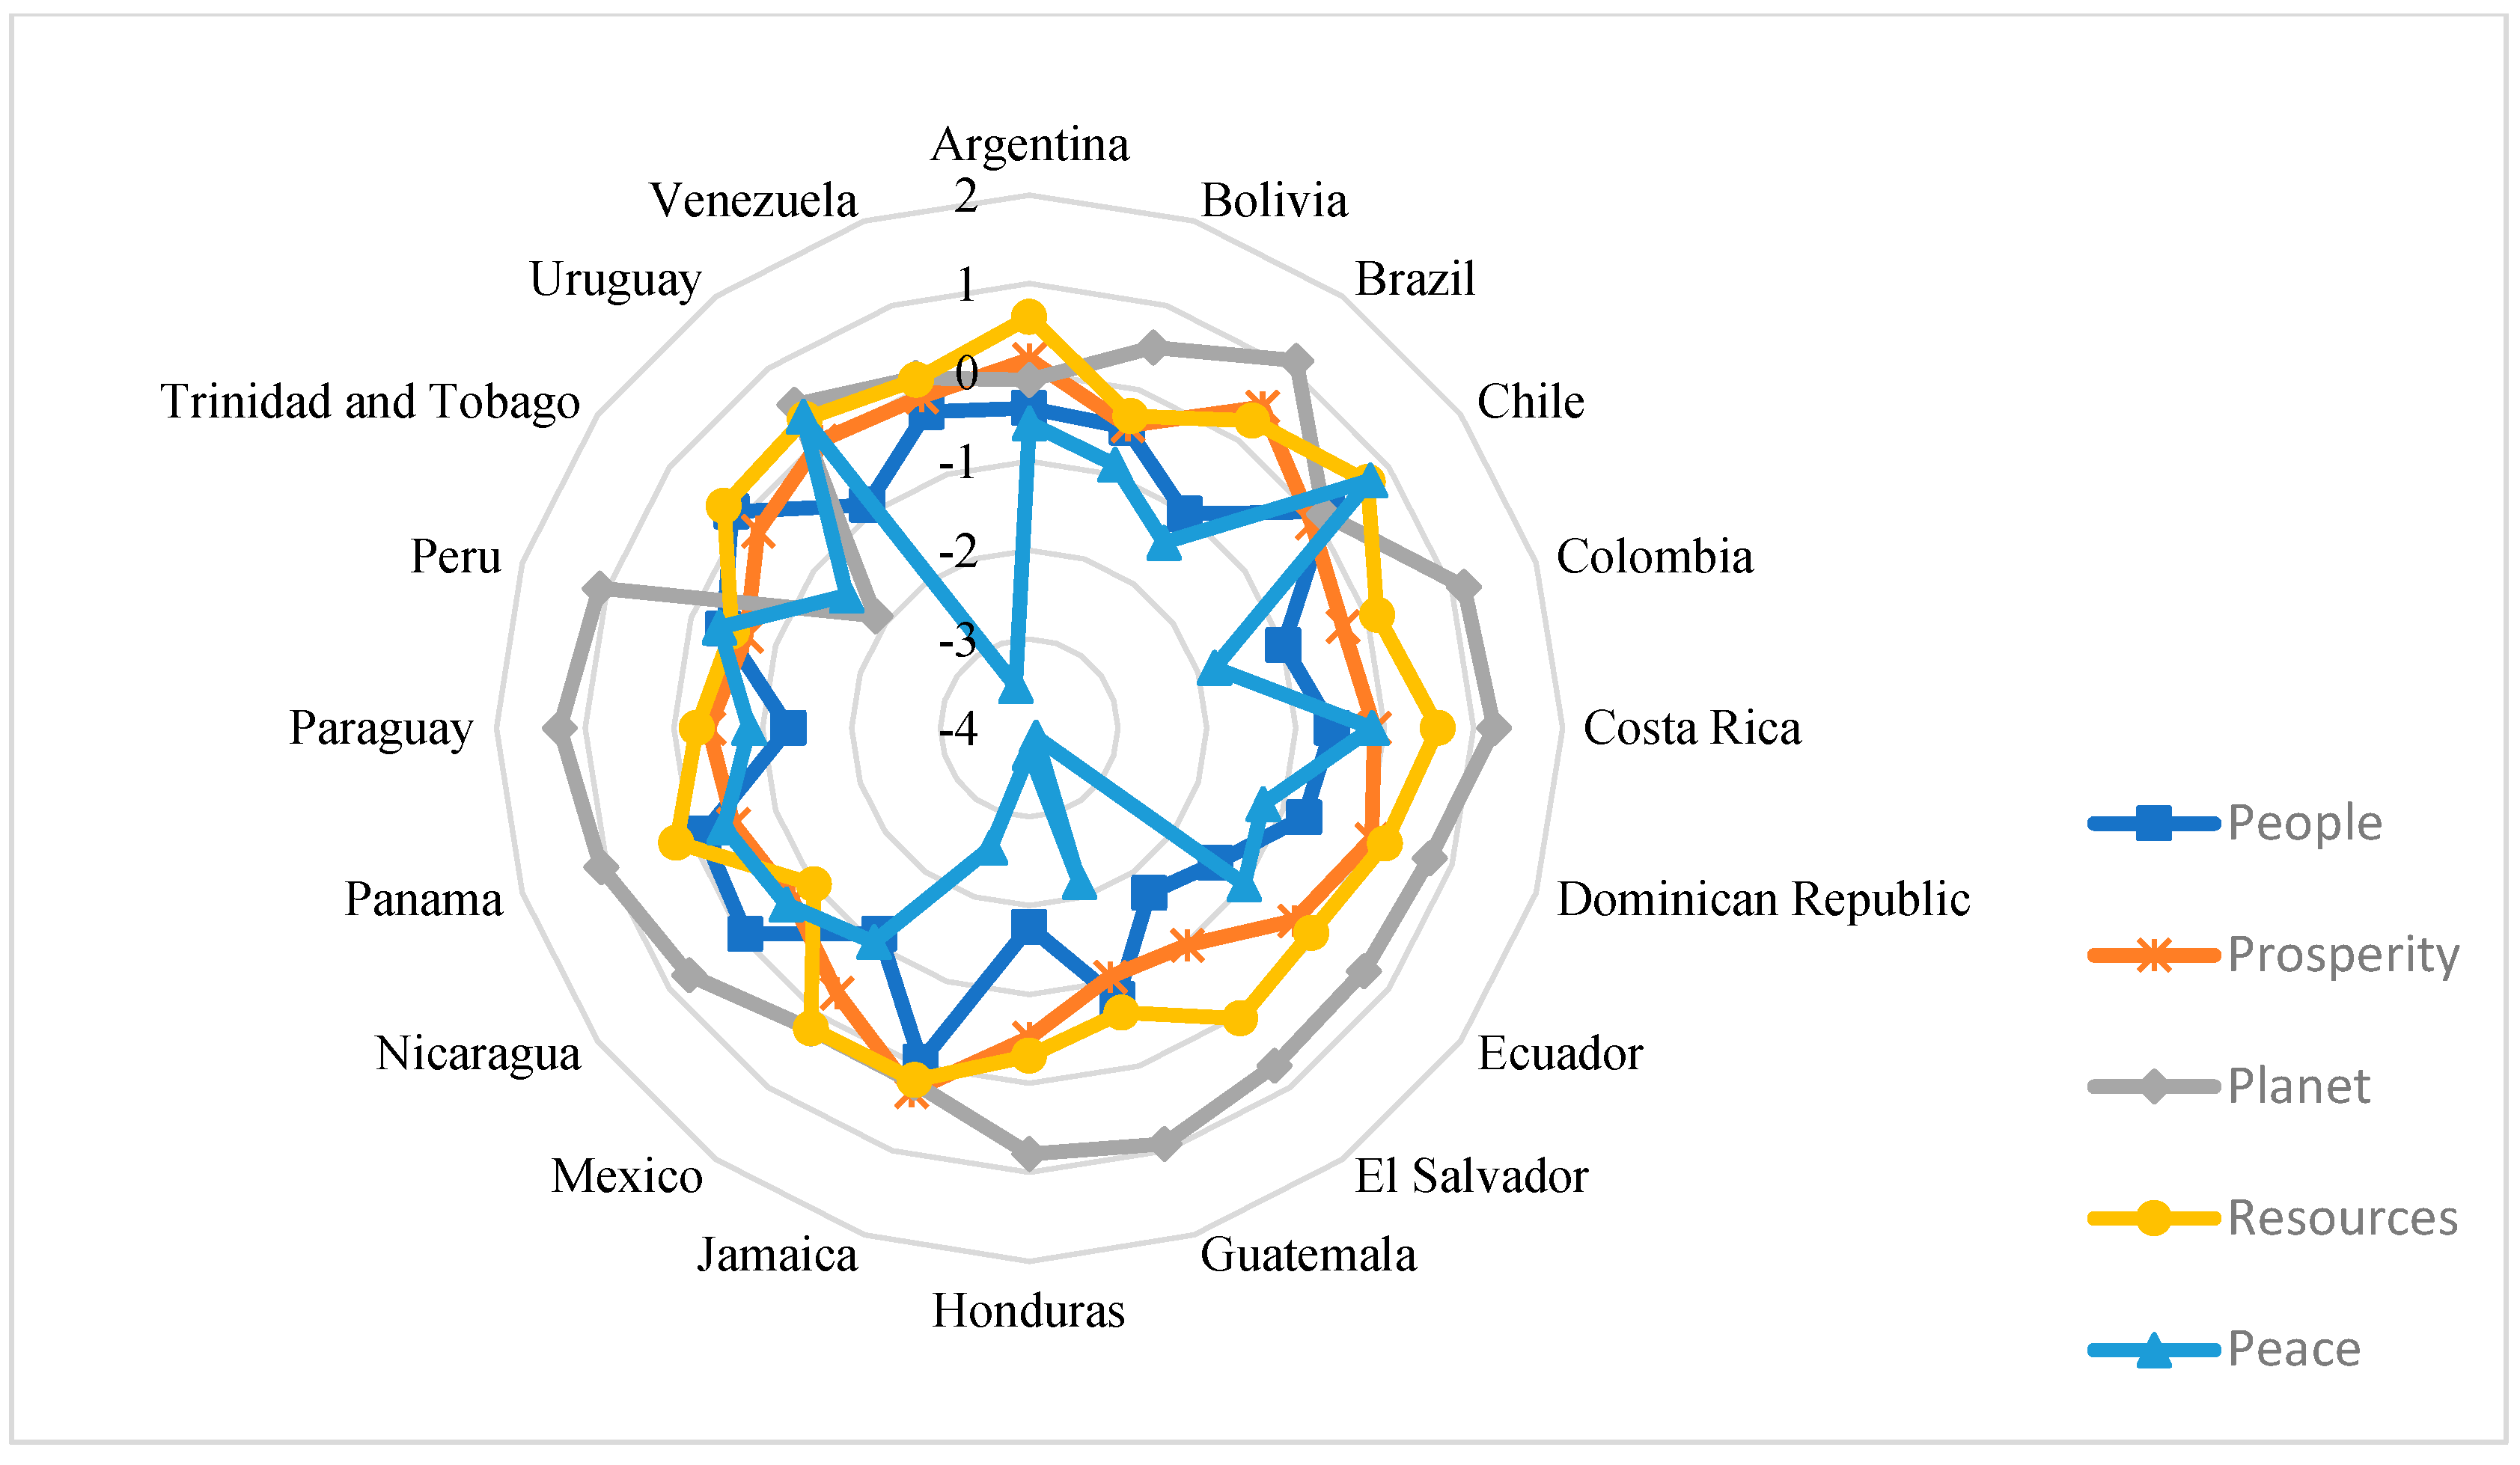
| Latin America and the Caribbean | Argentina, Bolivia, Brazil, Chile, Colombia, Costa Rica, Dominican Republic, Ecuador, El Salvador, Guatemala, Honduras, Jamaica, Mexico, Nicaragua, Panama, Paraguay, Peru, Trinidad and Tobago, Uruguay, Venezuela. |
| Sub-Saharan Africa | Benin, Botswana, Burkina Faso, Burundi, Cameroon, Chad, Côte d’Ivoire, Ethiopia, Ghana, Kenya, Lesotho, Madagascar, Malawi, Mali, Mauritius, Mozambique, Namibia, Nigeria, Senegal, South Africa, Tanzania, Uganda, Zambia, Zimbabwe. |
| Commonwealth | Armenia, Azerbaijan, Georgia, Kazakhstan, Kyrgyz Republic, Moldova, Russian Federation, Tajikistan, Ukraine. |
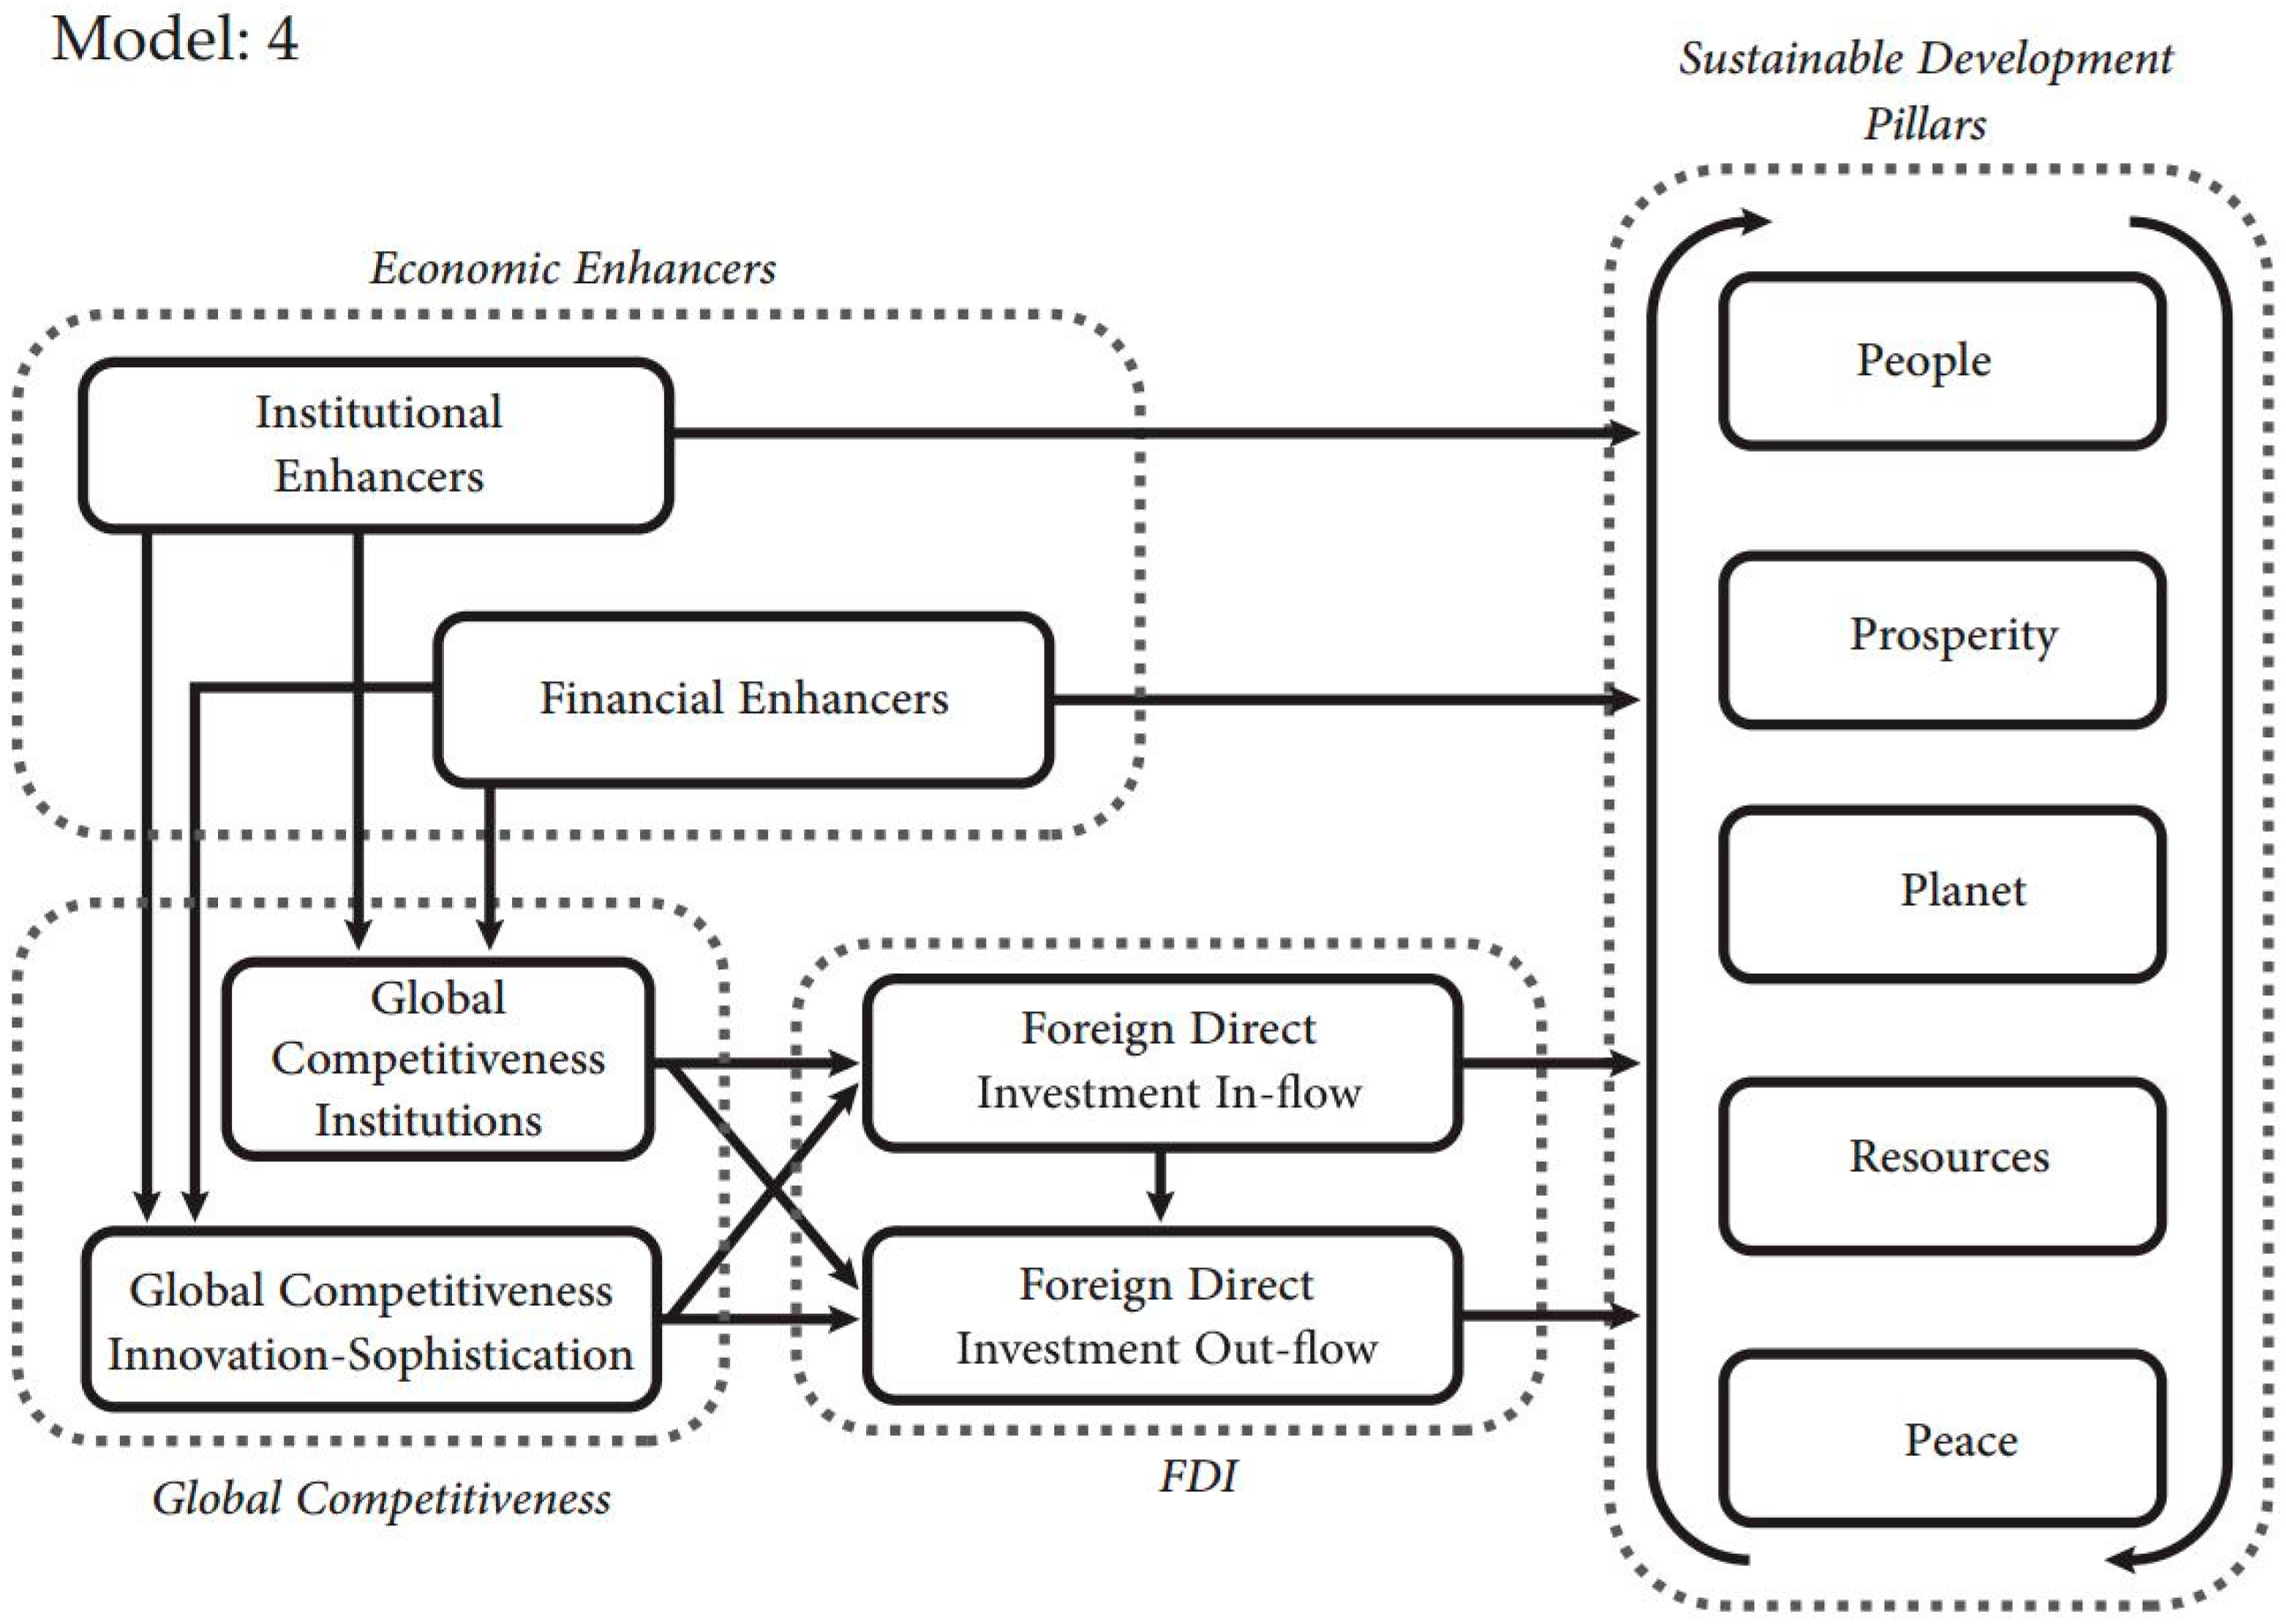
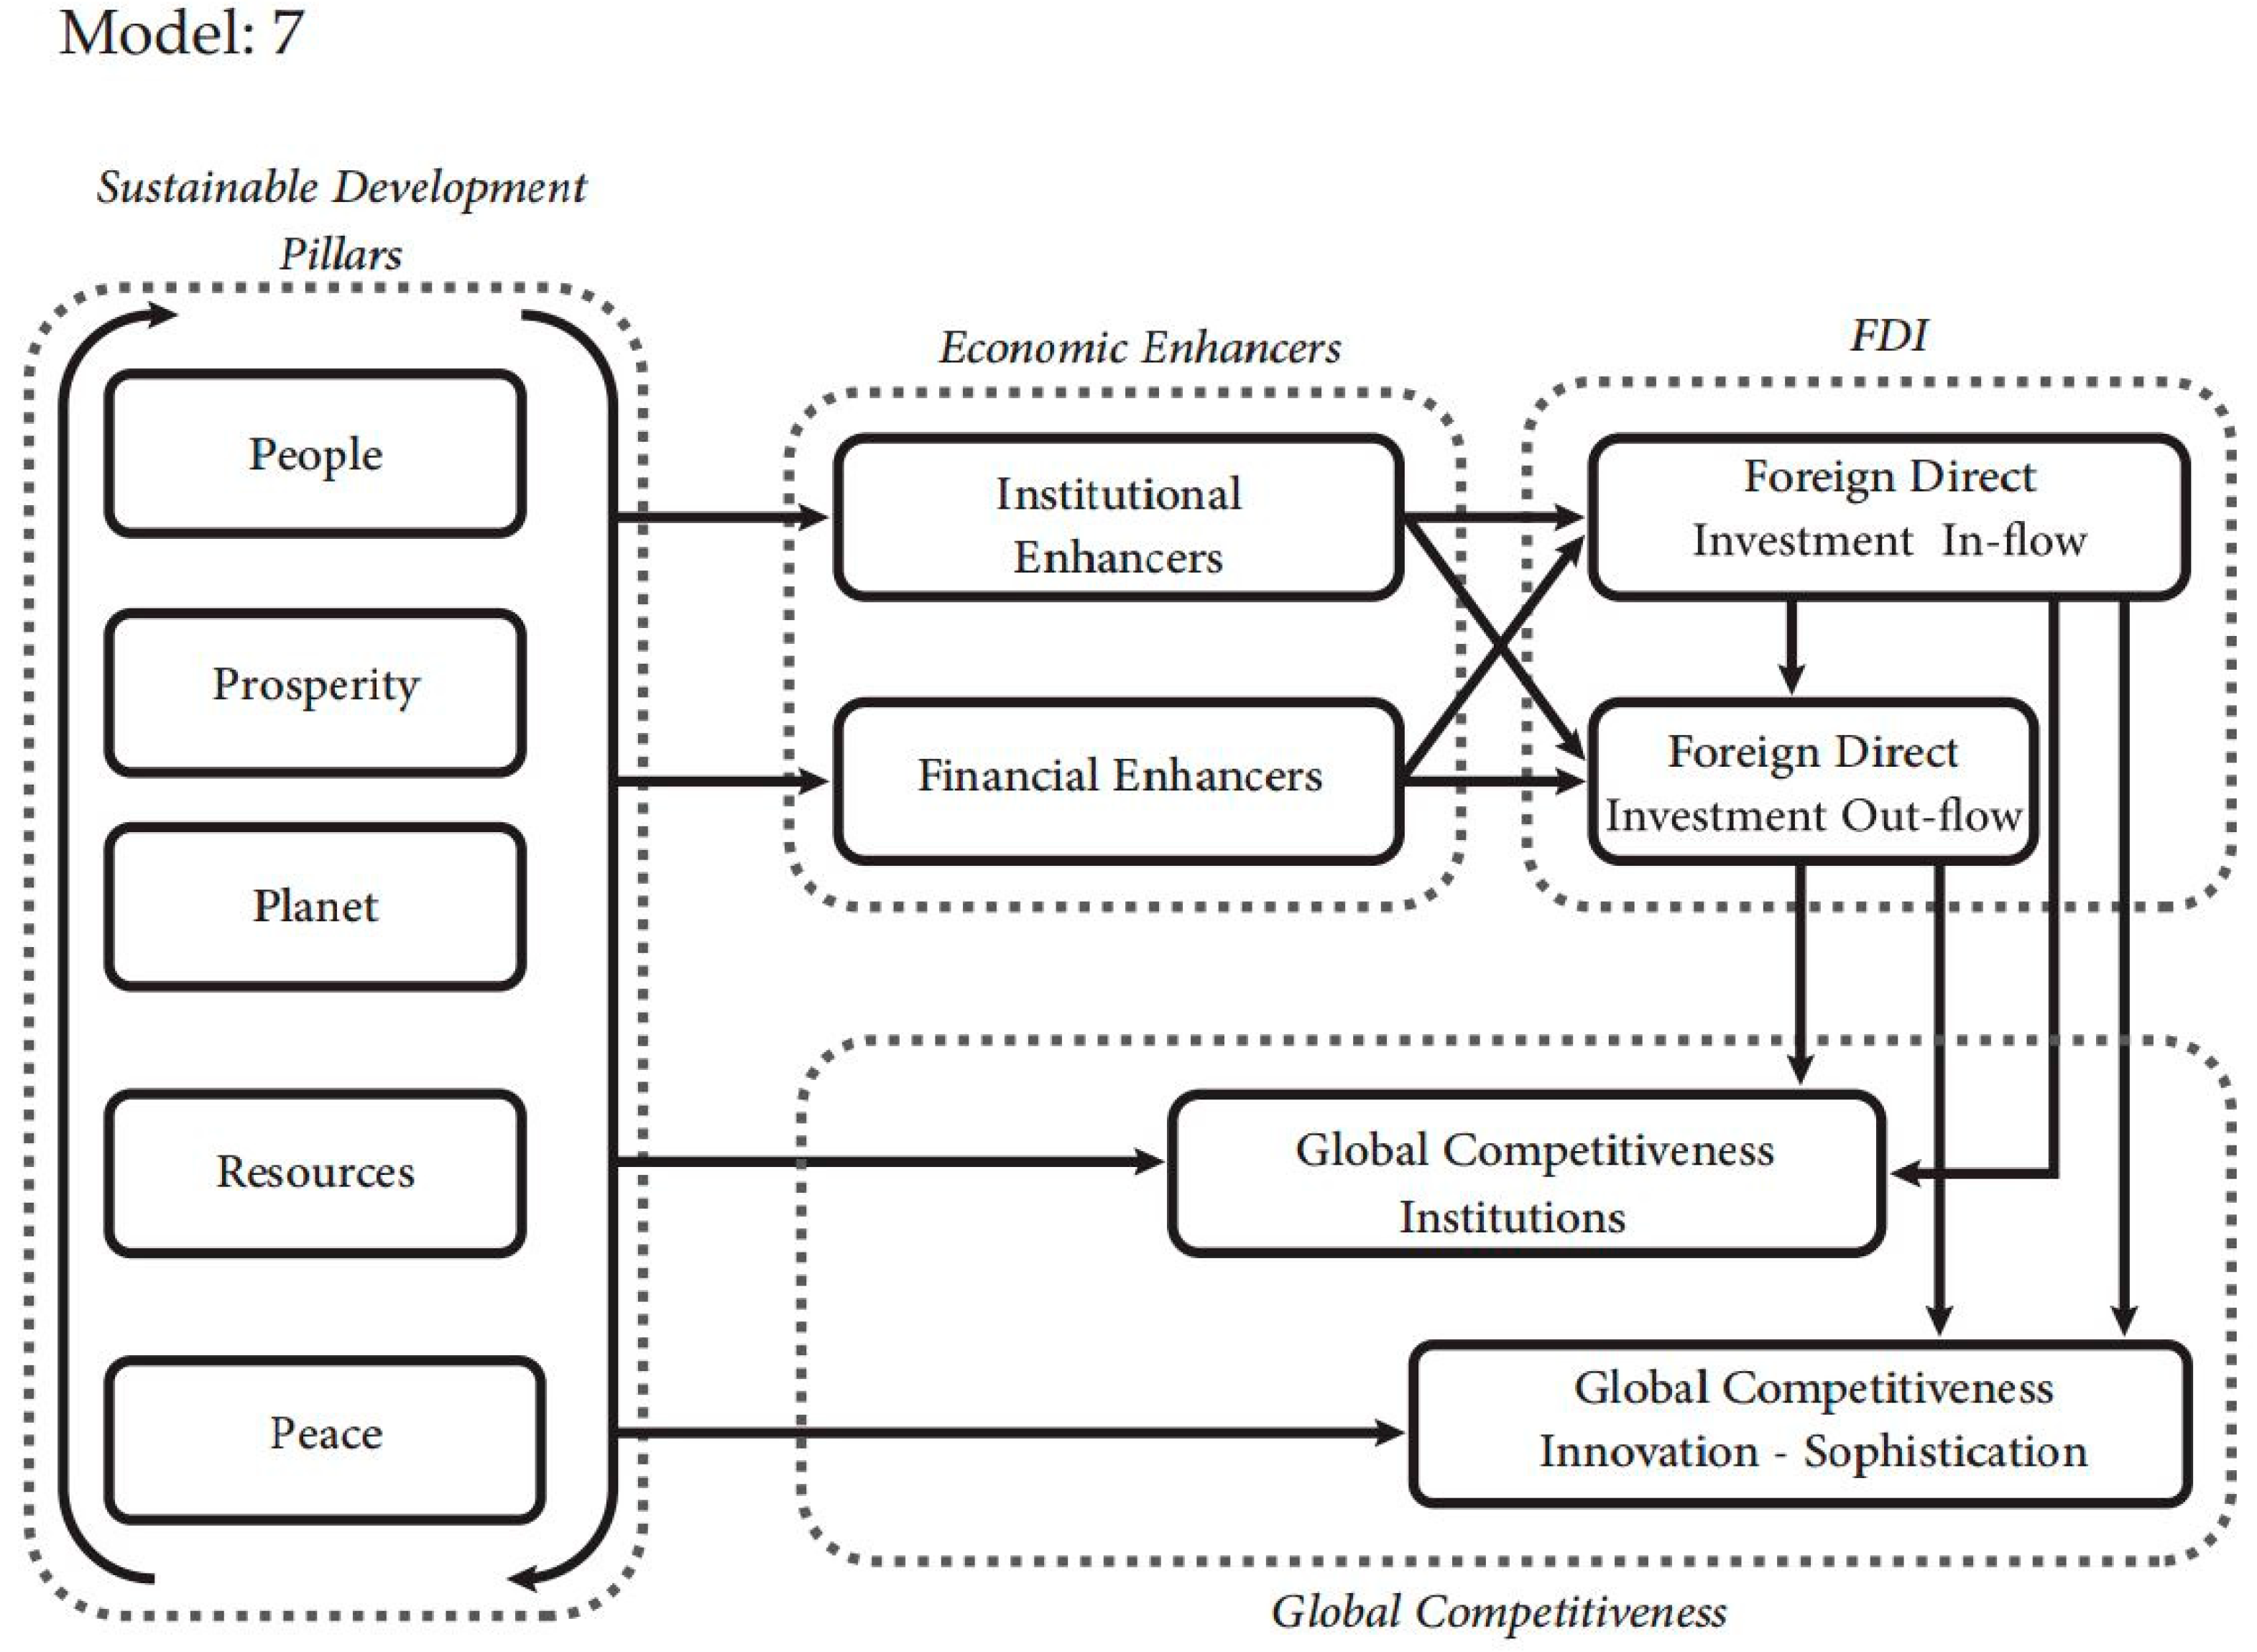
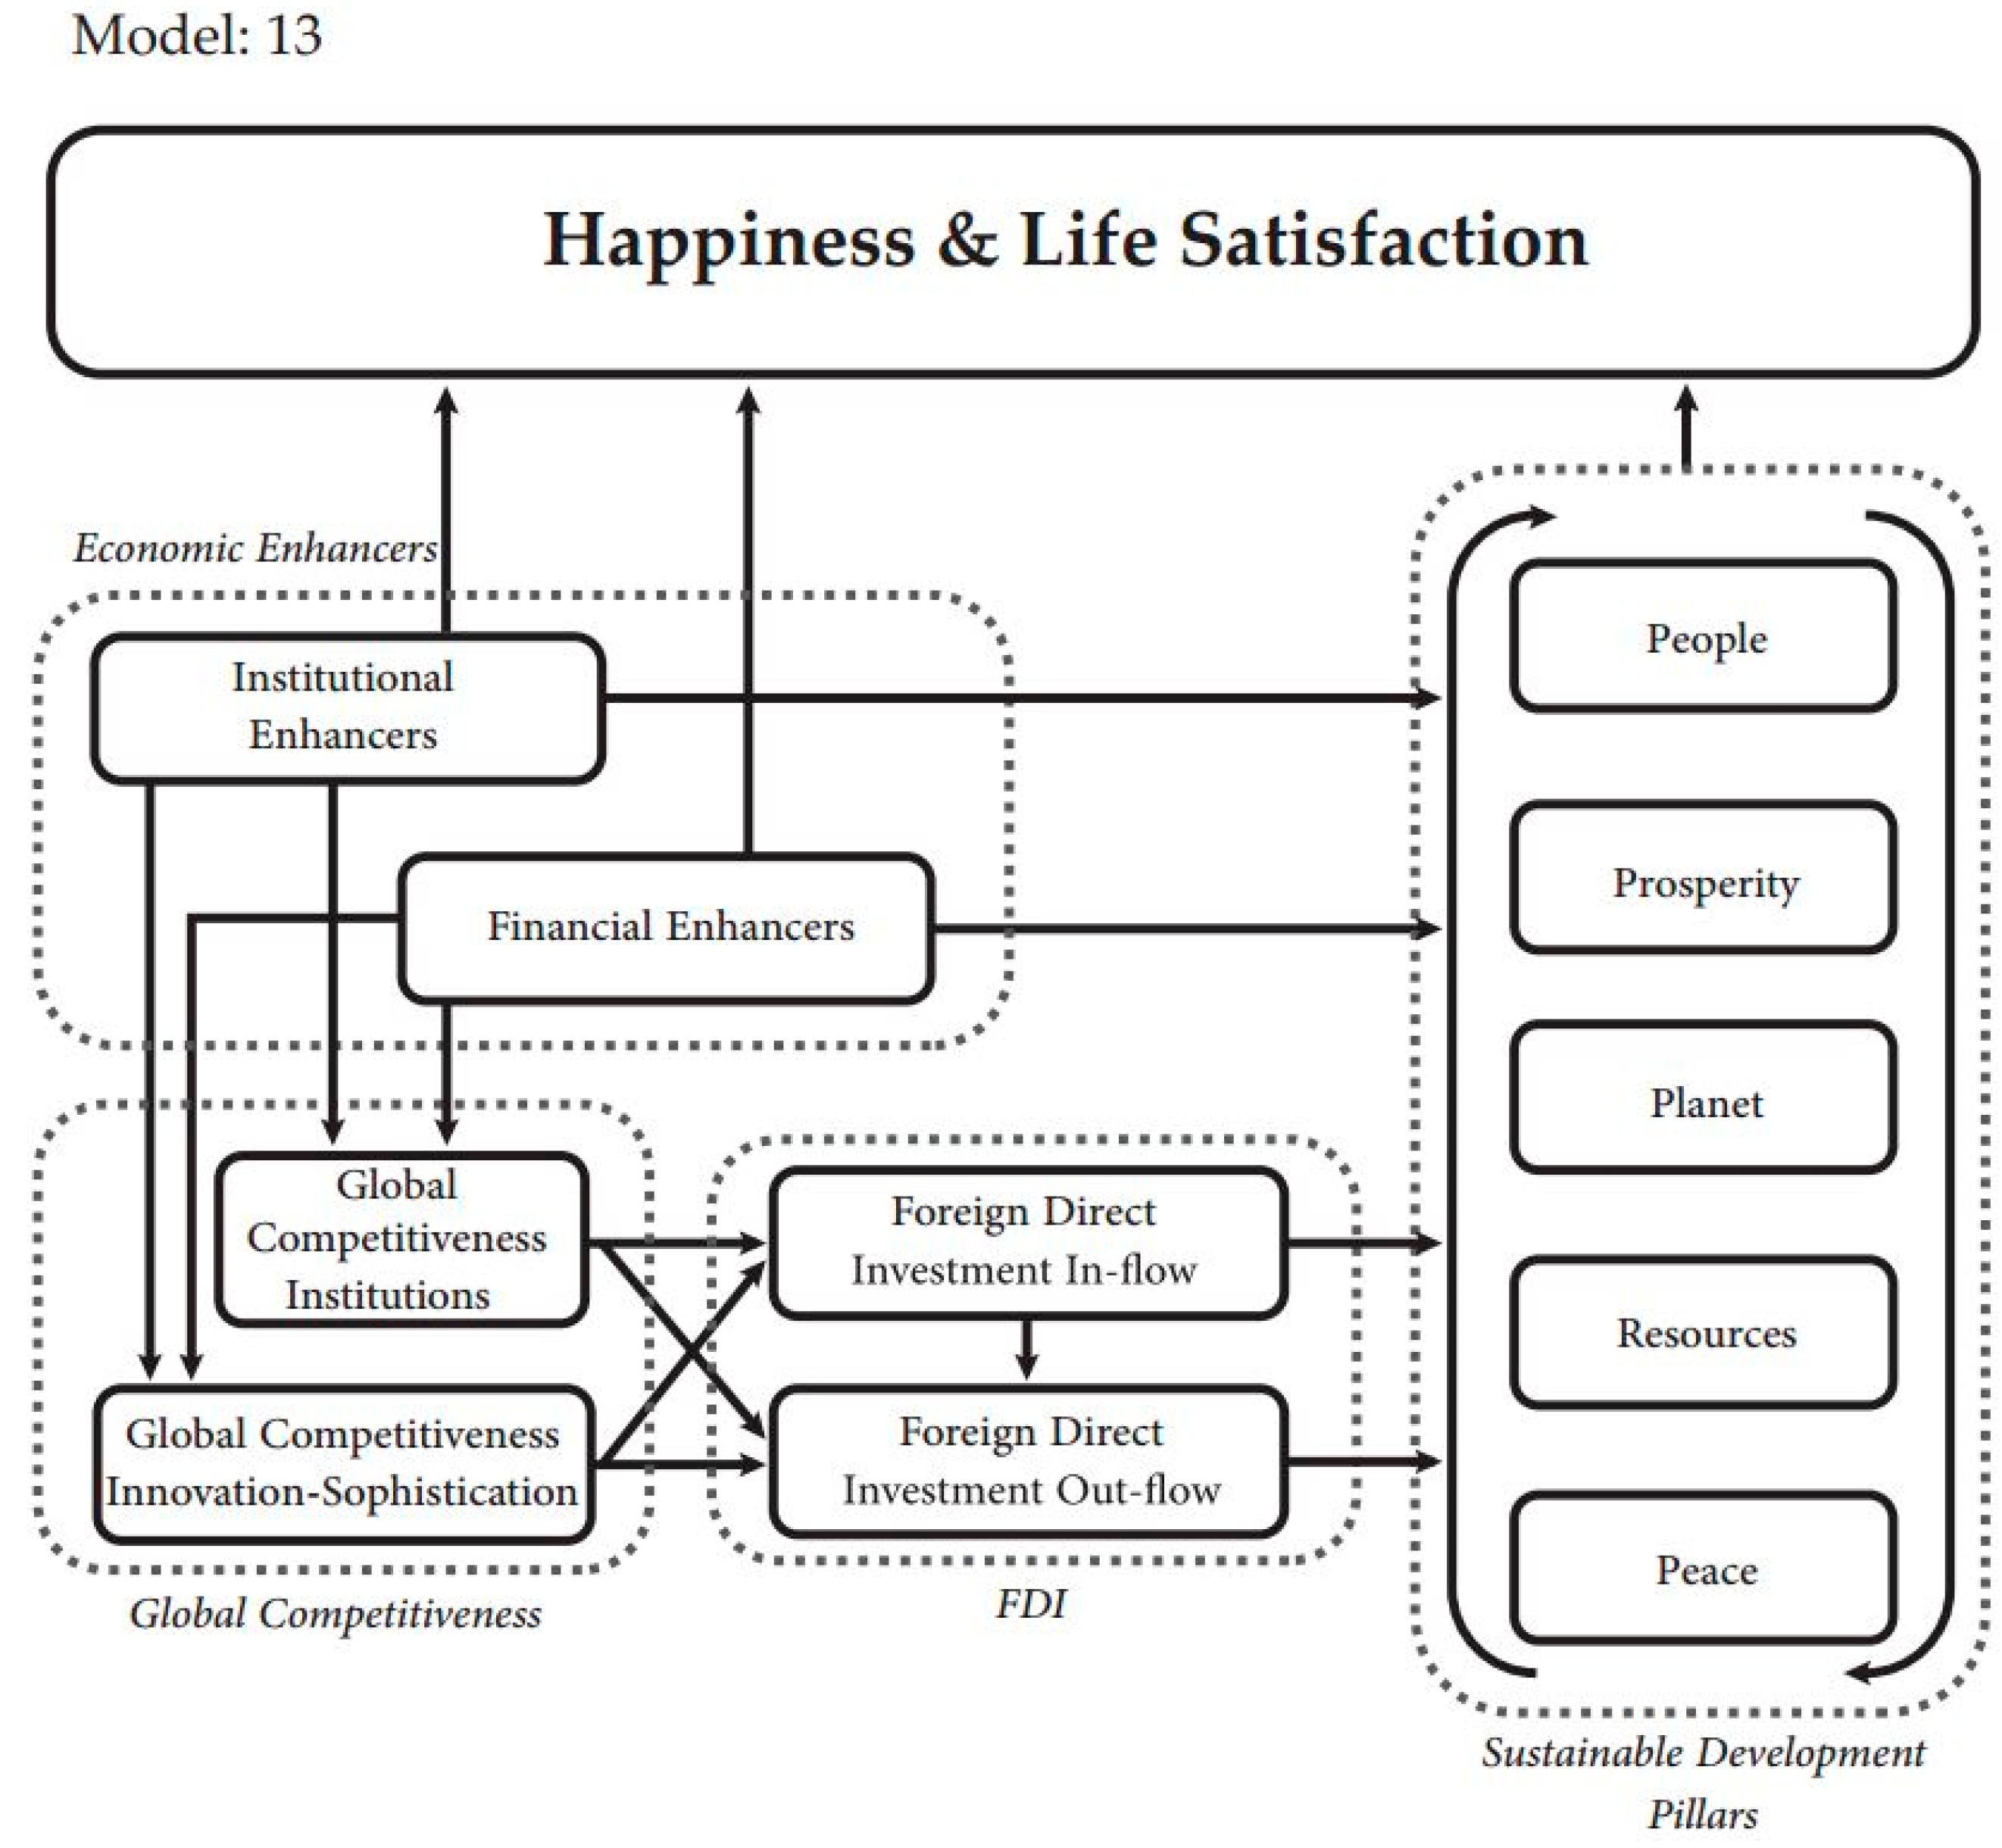
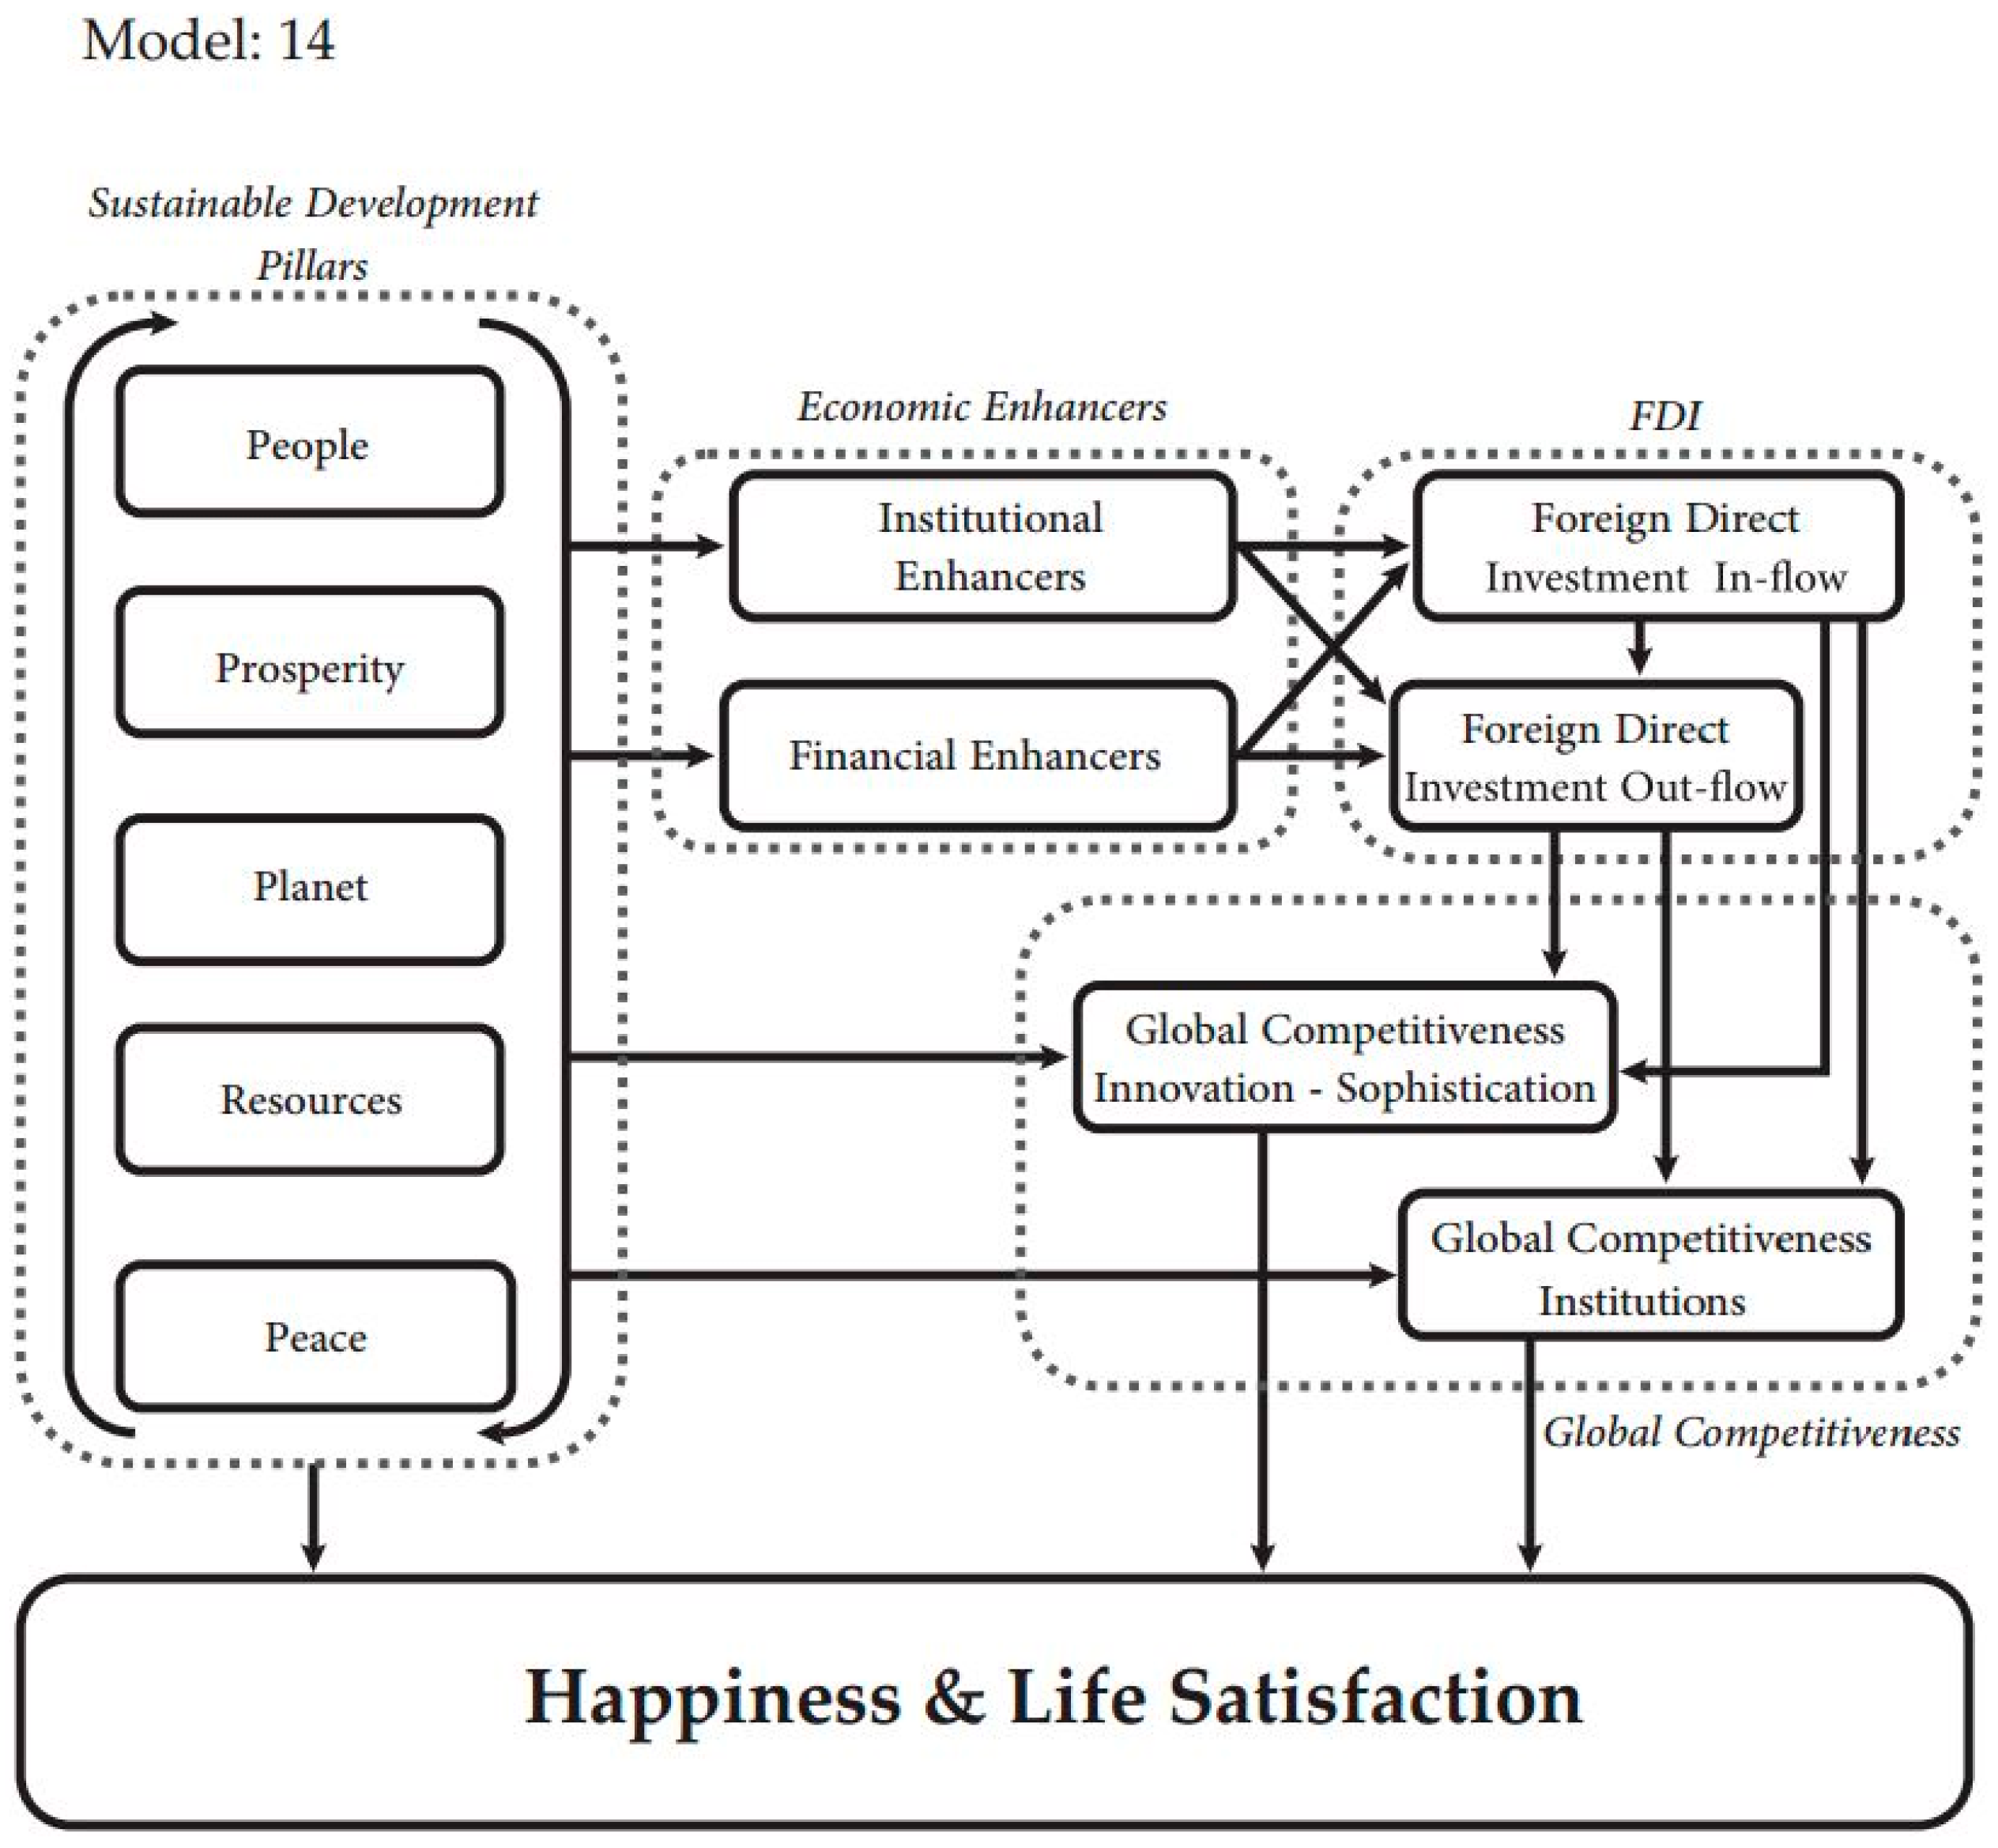
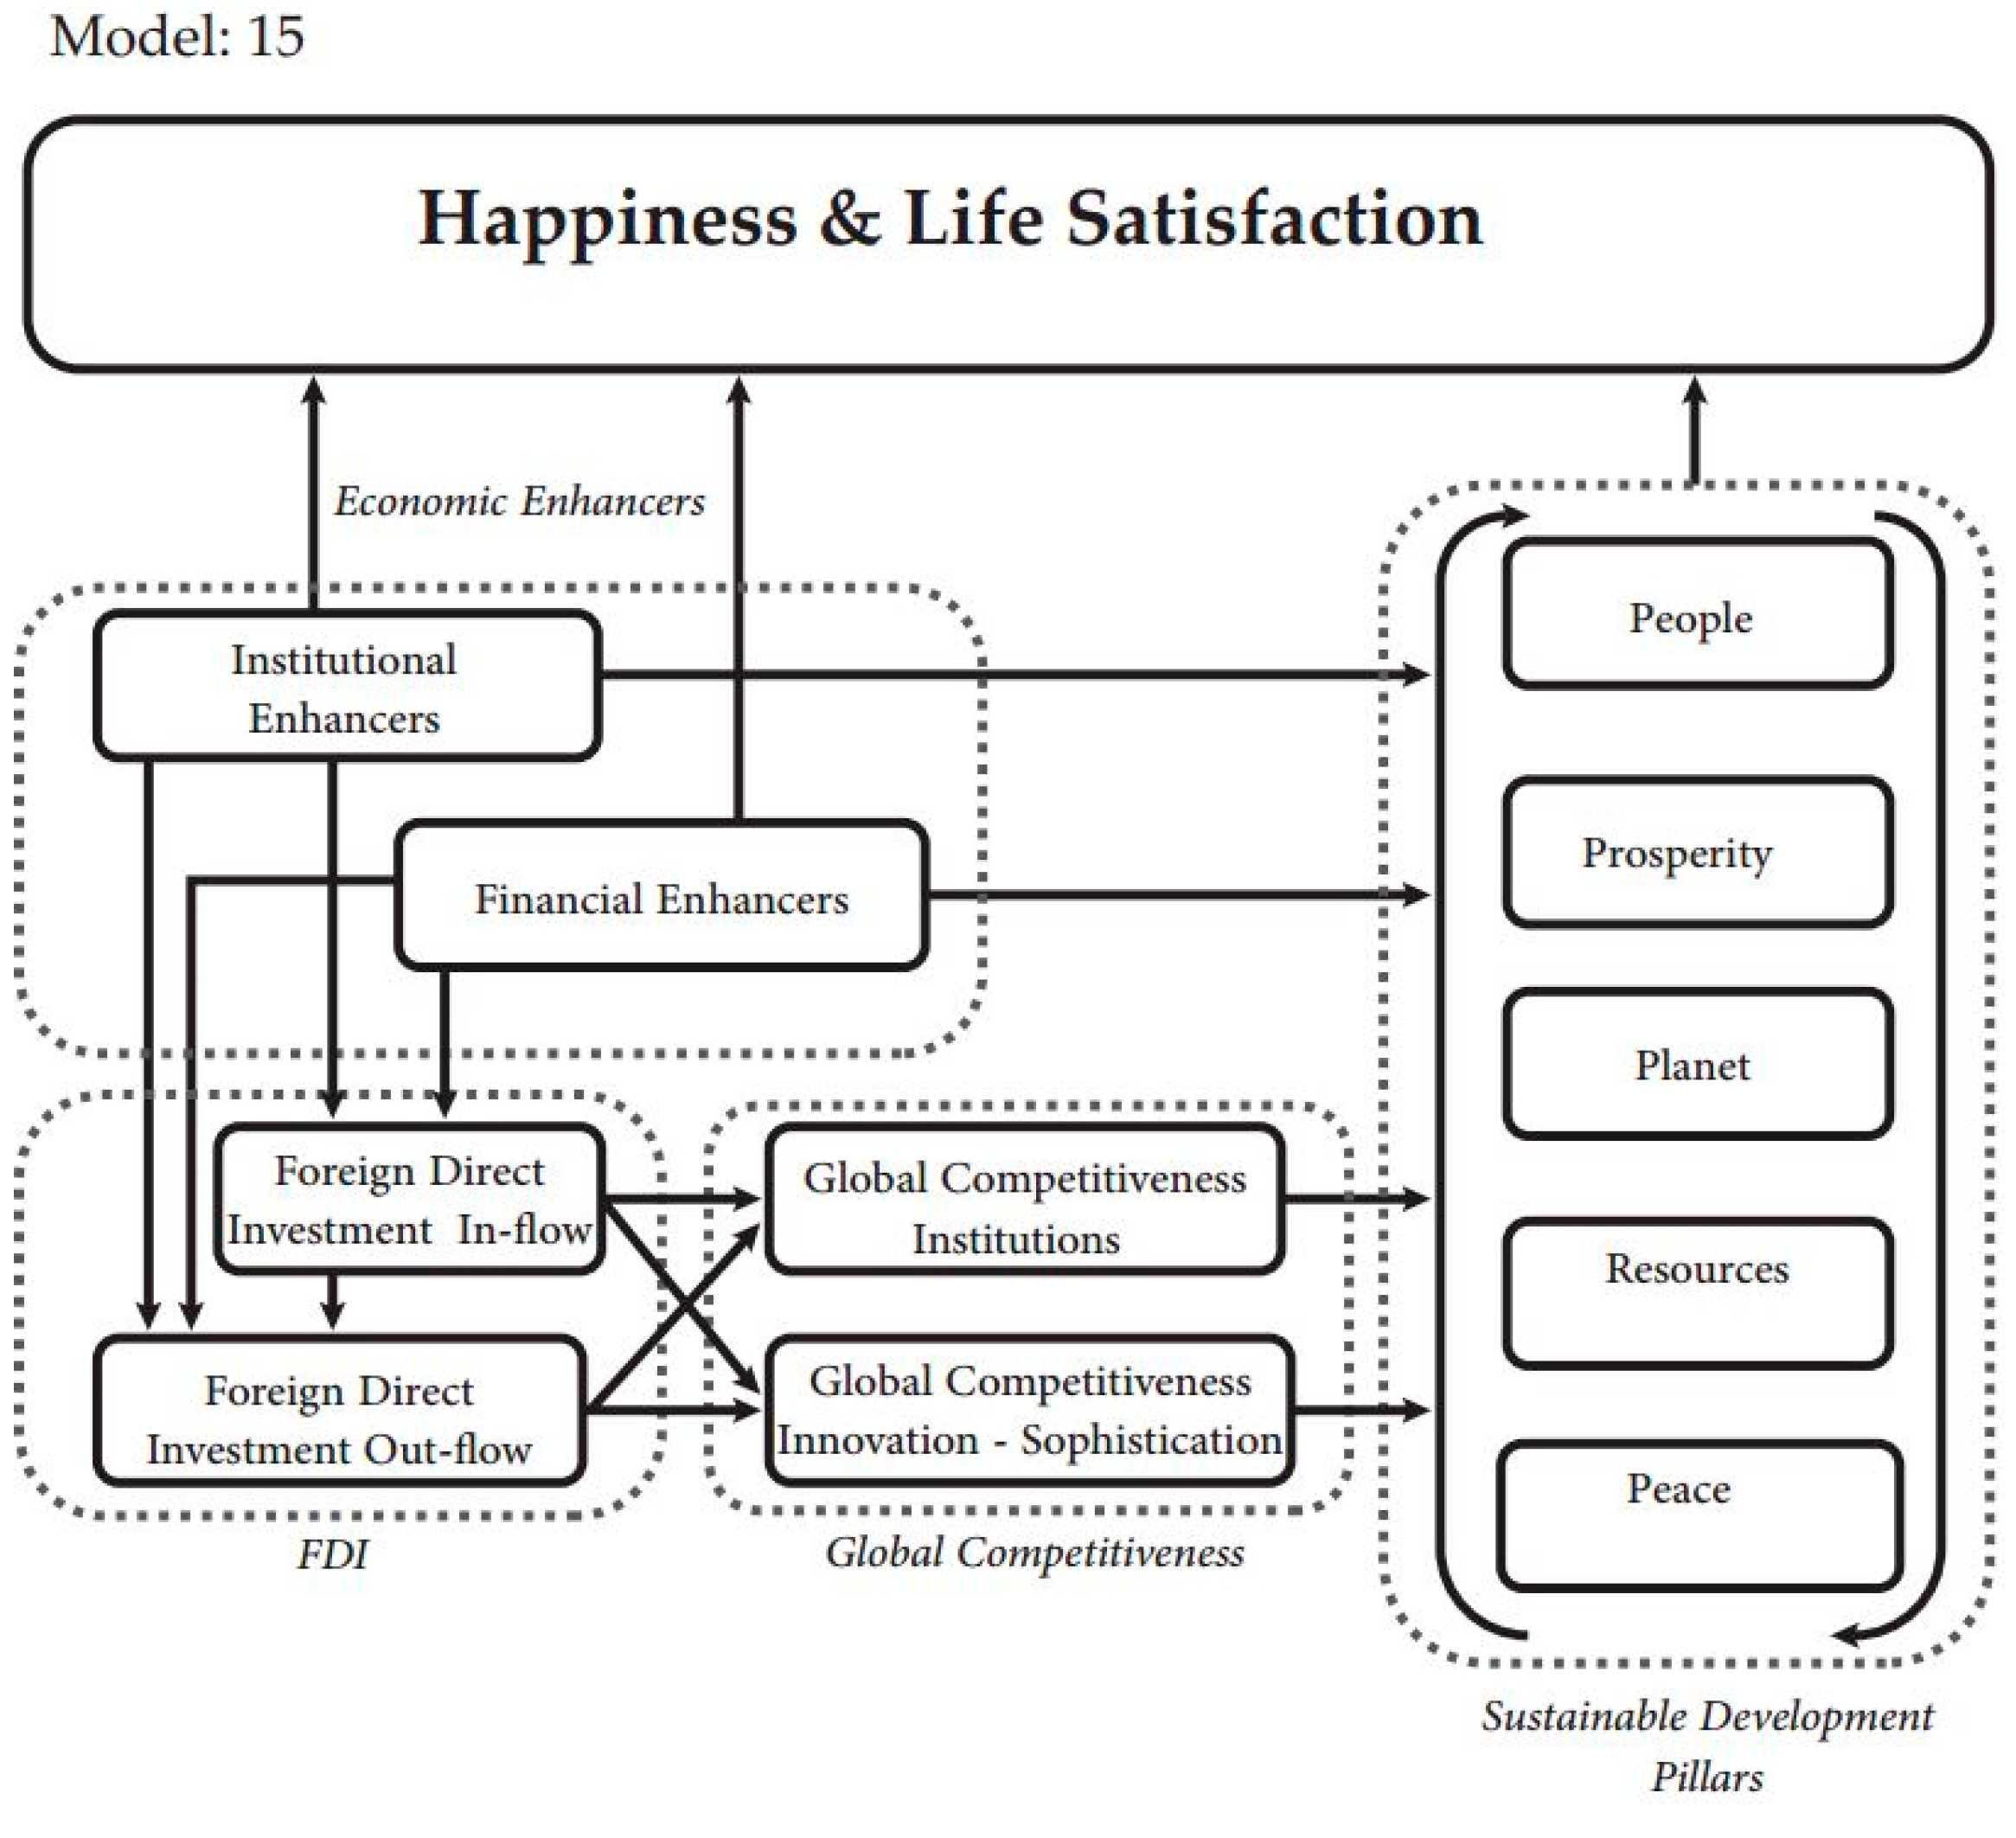
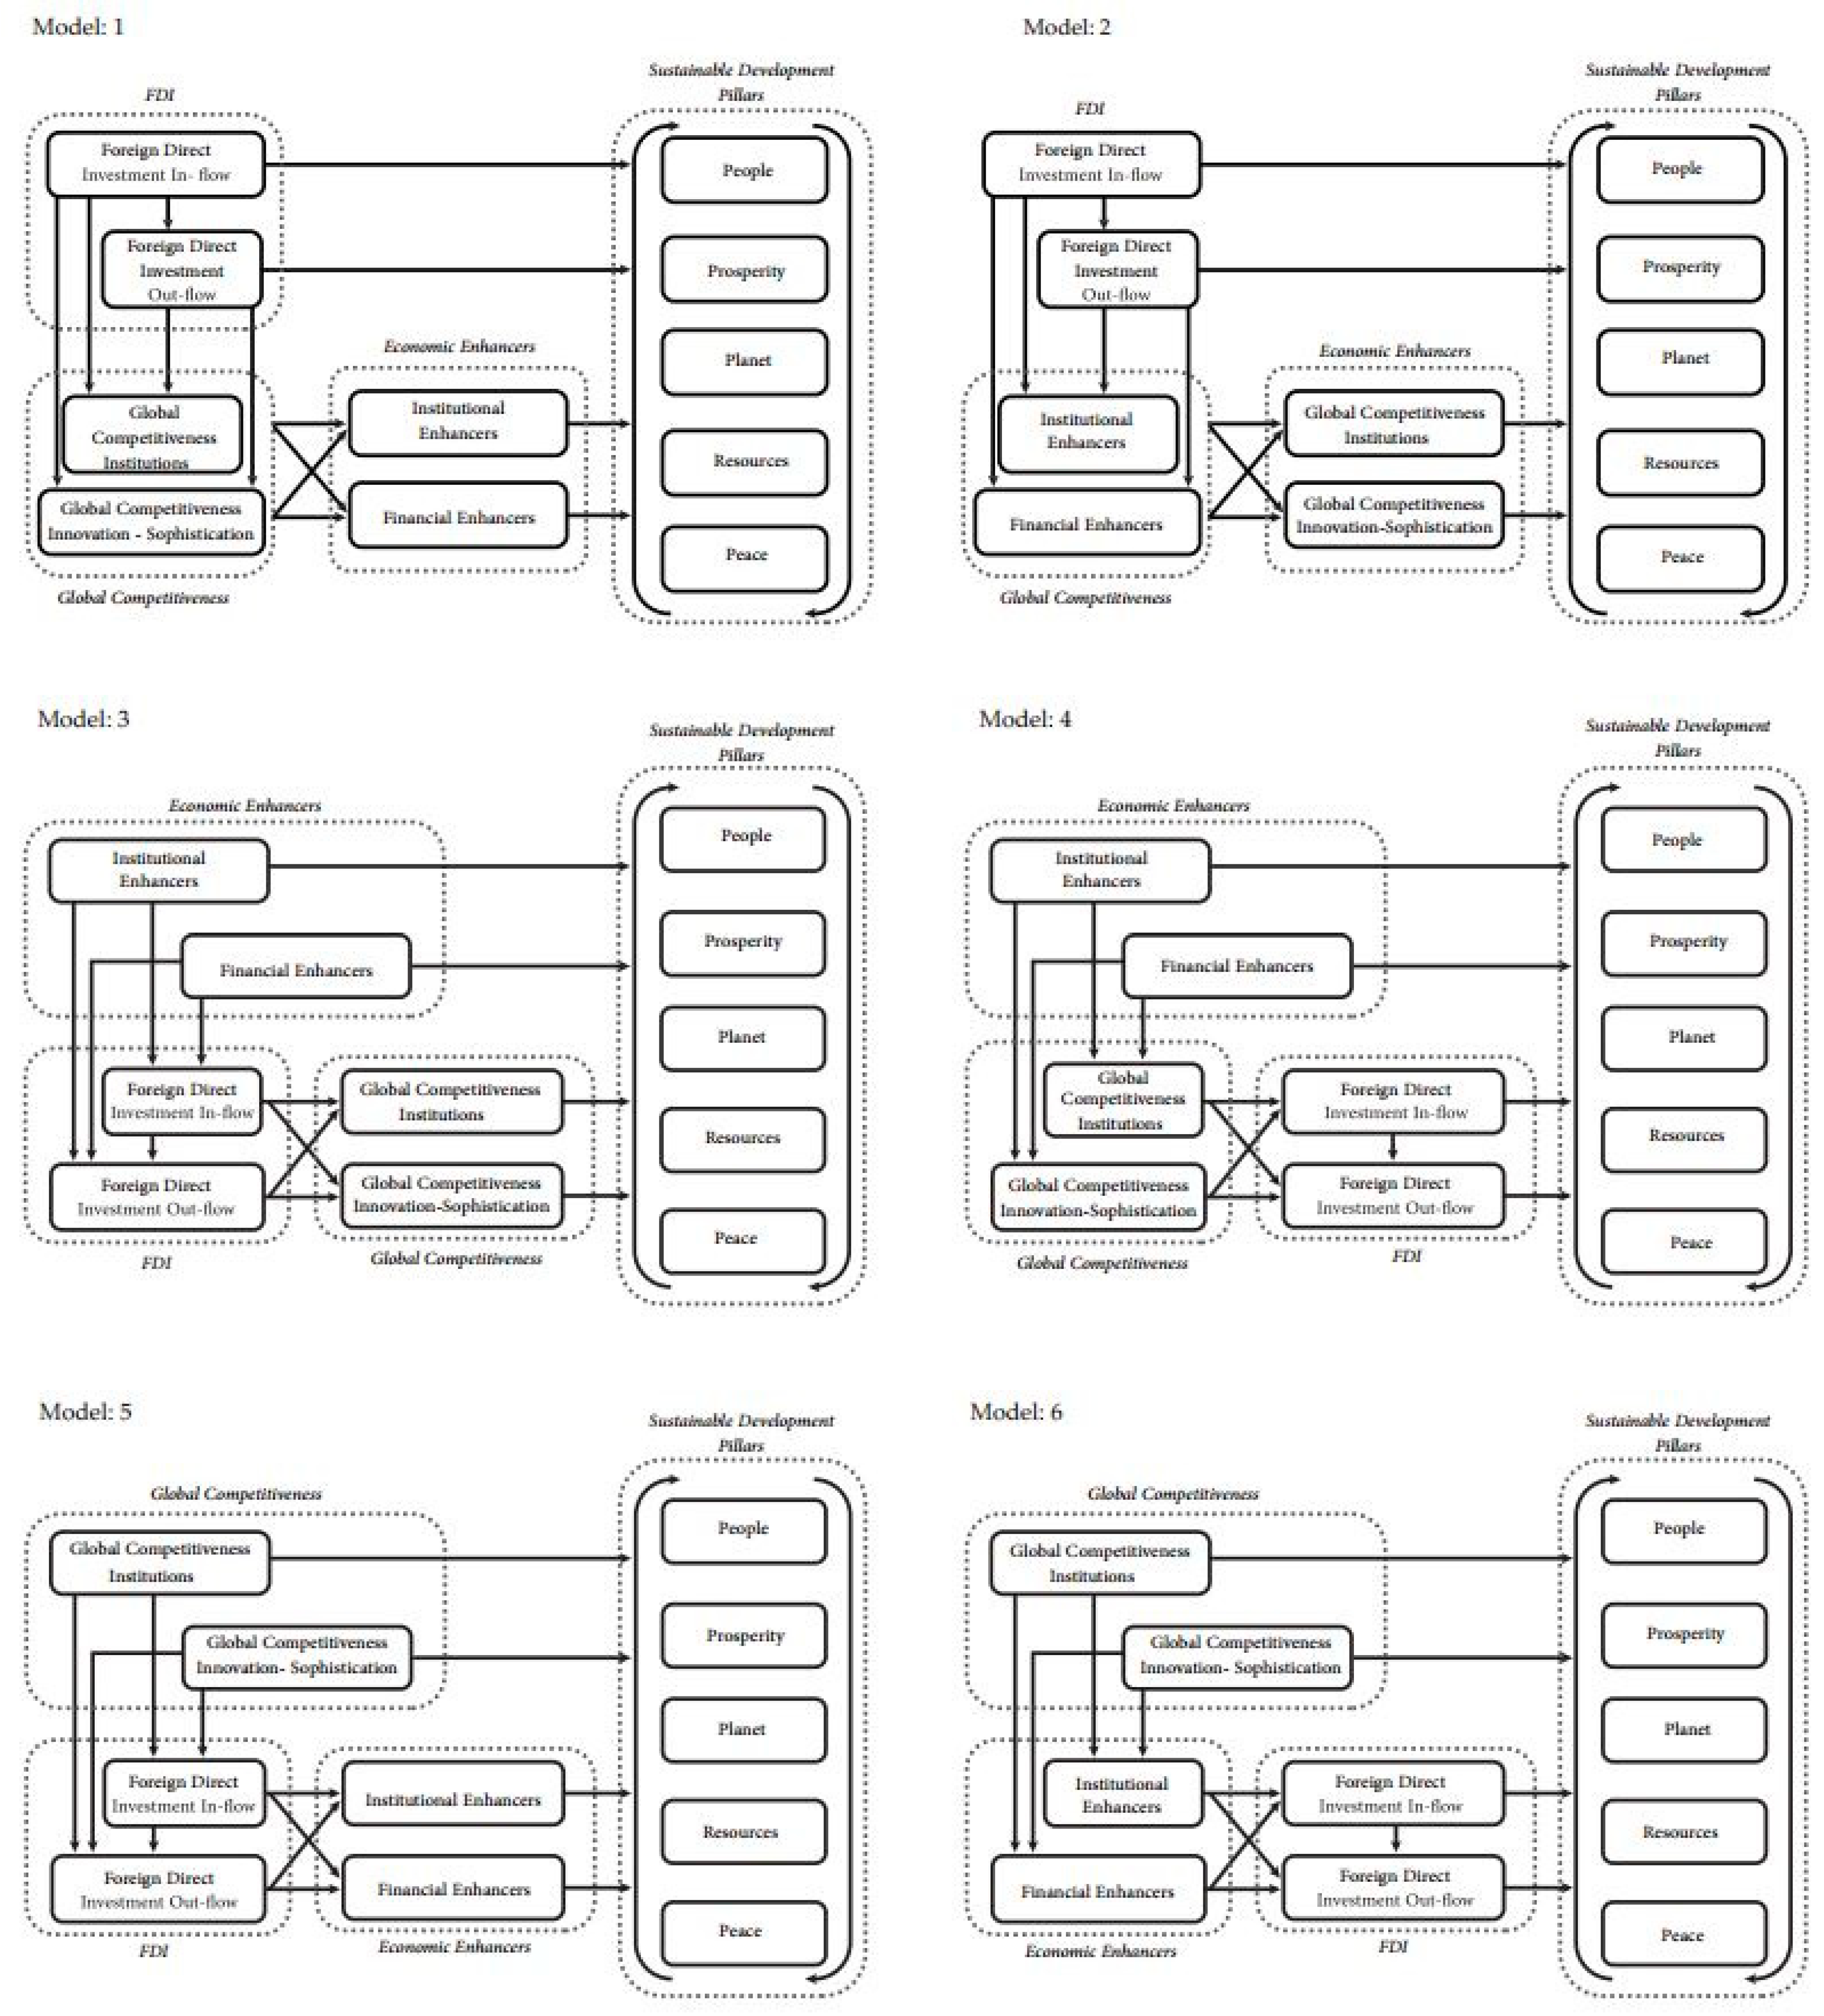
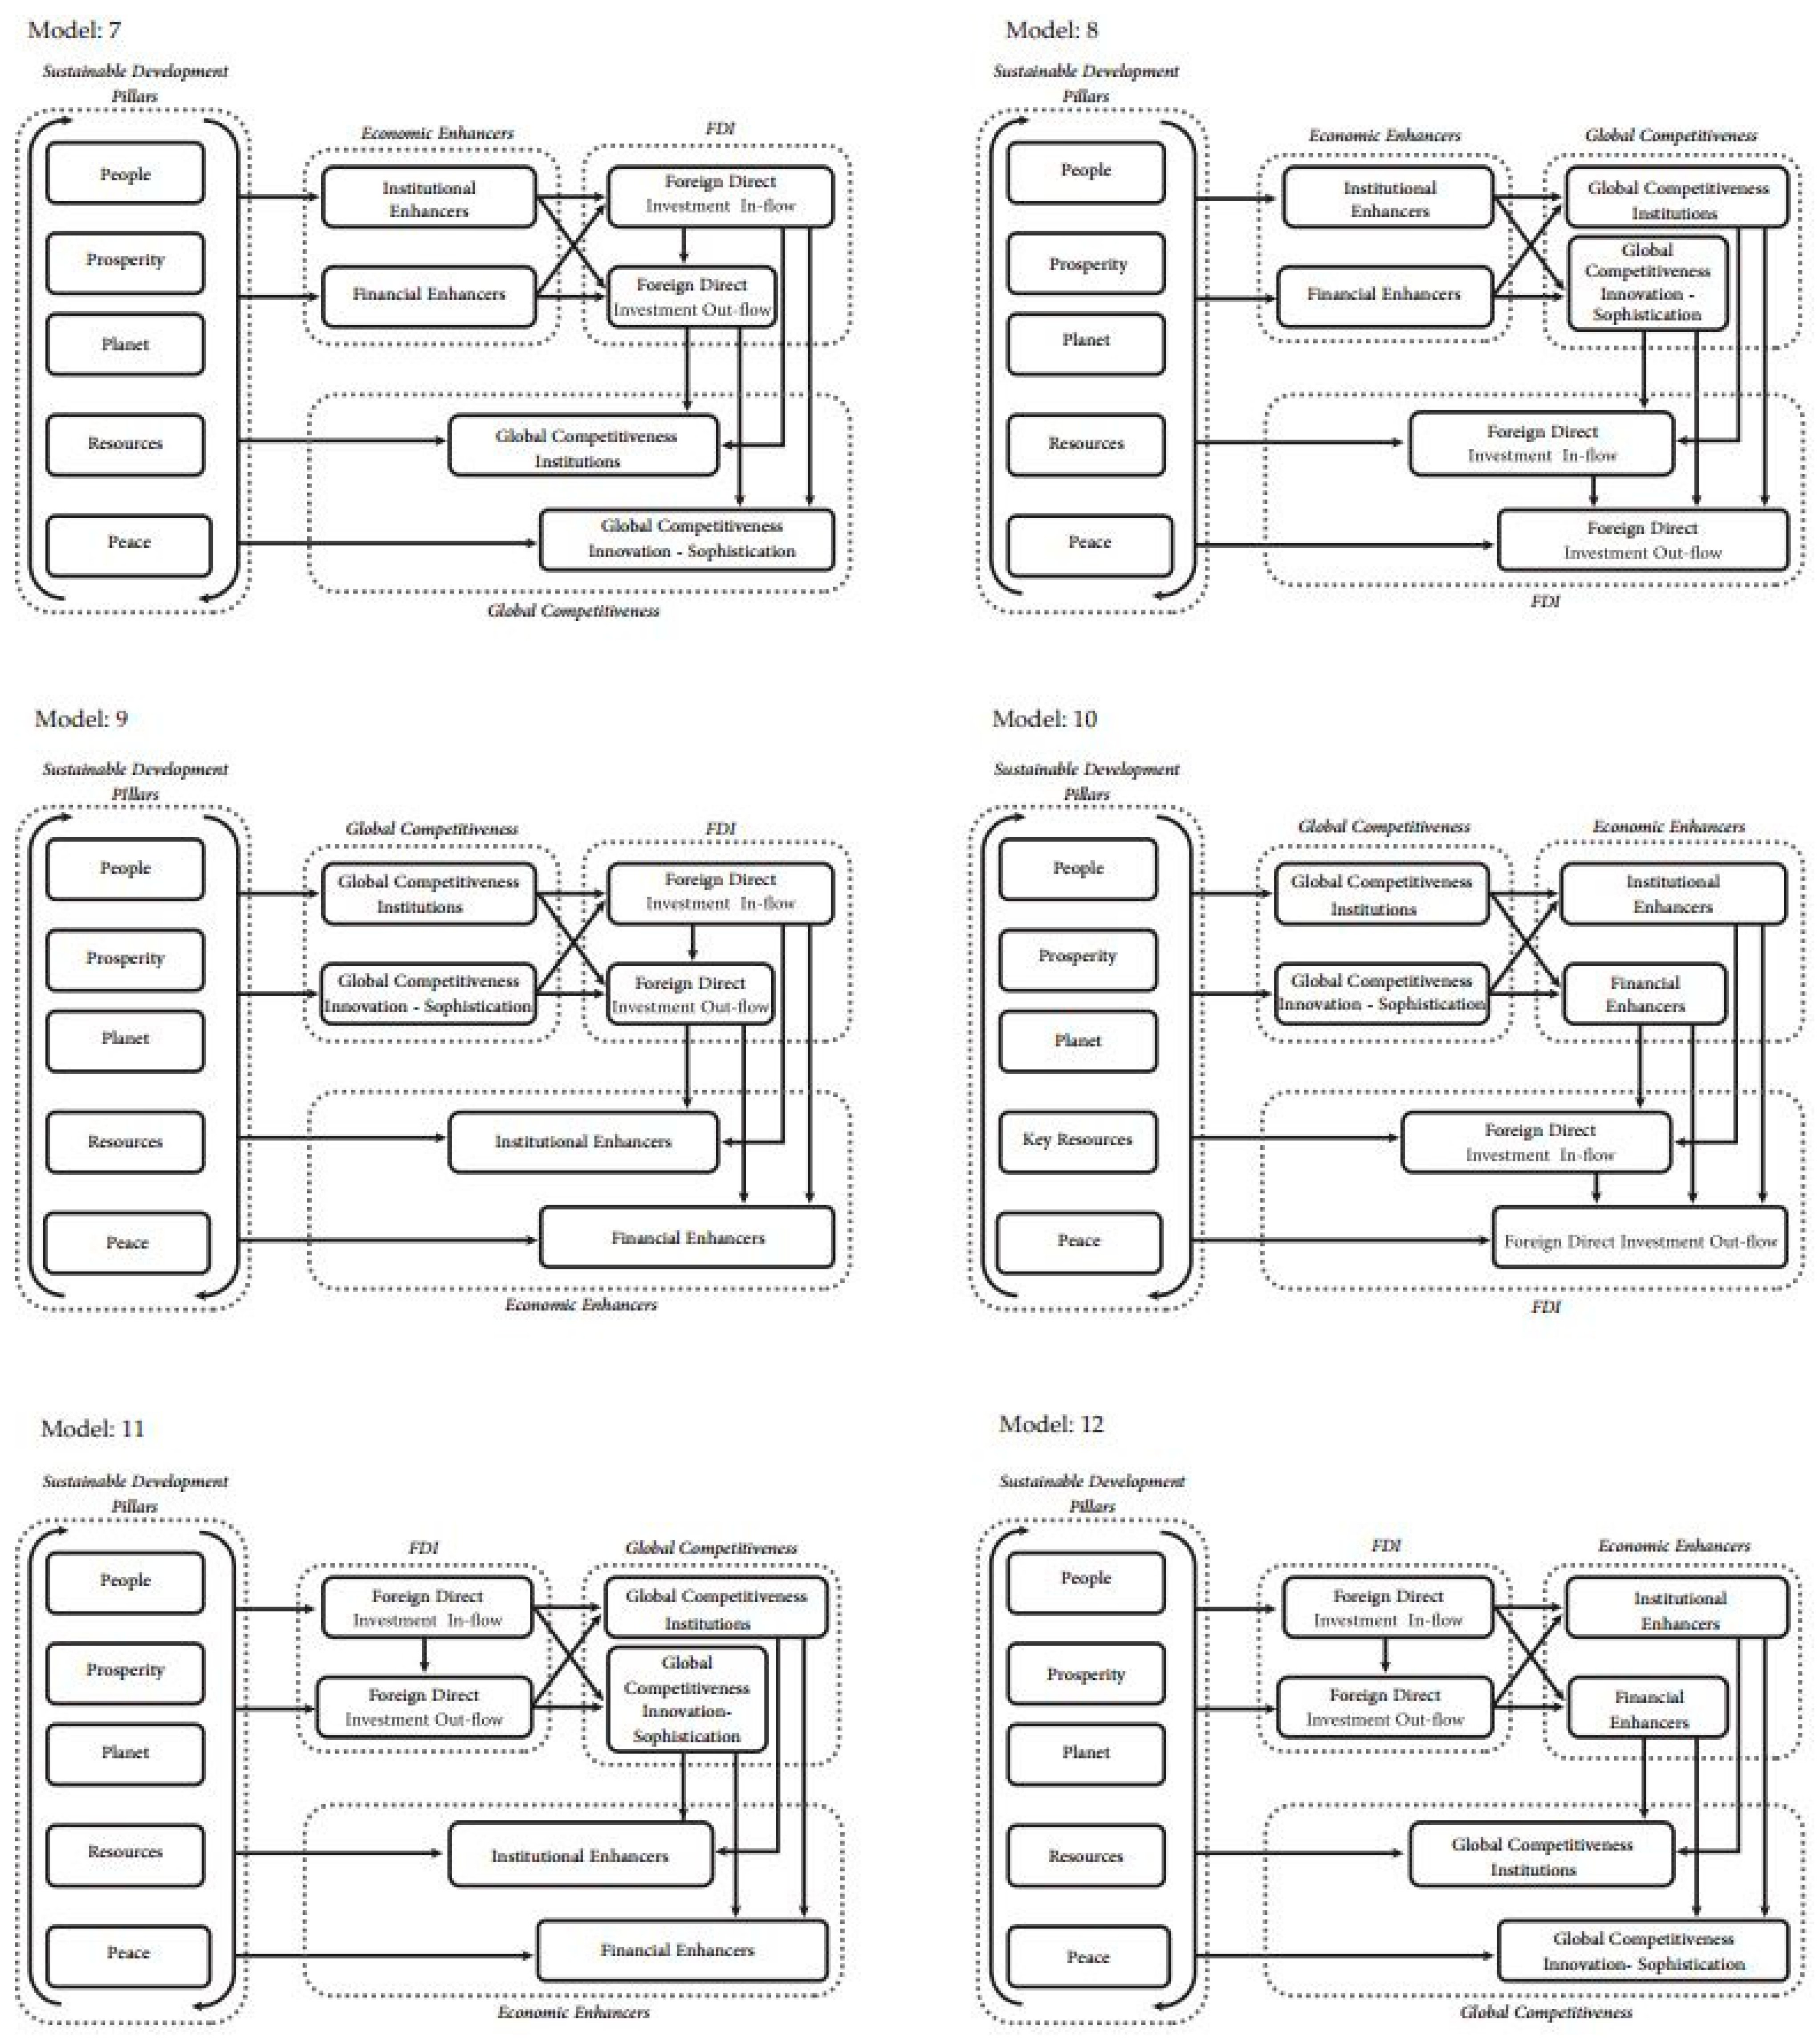
3.3. Model Selection
3.4. Creating Scores for 125 Countries for the Relationships among SD Pillars and H&LS and Country Outlier Determination
3.5. Assessment of Selected Models
4. Results and Discussion
4.1. Global-Level Results and Discussion
4.1.1. Global-Level Results and Discussion for “Social-turn 1” Models (Models 4 and 13)
4.1.2. Global-Level Results and Discussion for “Social-turn 2” (Models 7 and 14)
4.2. Comparison of Country Clusters (“Social-turn 1.2” (Model 15) and “Social-turn 2” (Model 14))
4.3. Country Cluster-Level Comparison of SD Pillars’ Relationships with H&LS for “Social-turn 1” (Model 13), “Social-turn 1.2” (Model 15), and “Social-turn 2” (Model 14)
4.4. Country-Level Results Per Cluster (“Social-turn 2” Model)
4.4.1. Advanced Economies
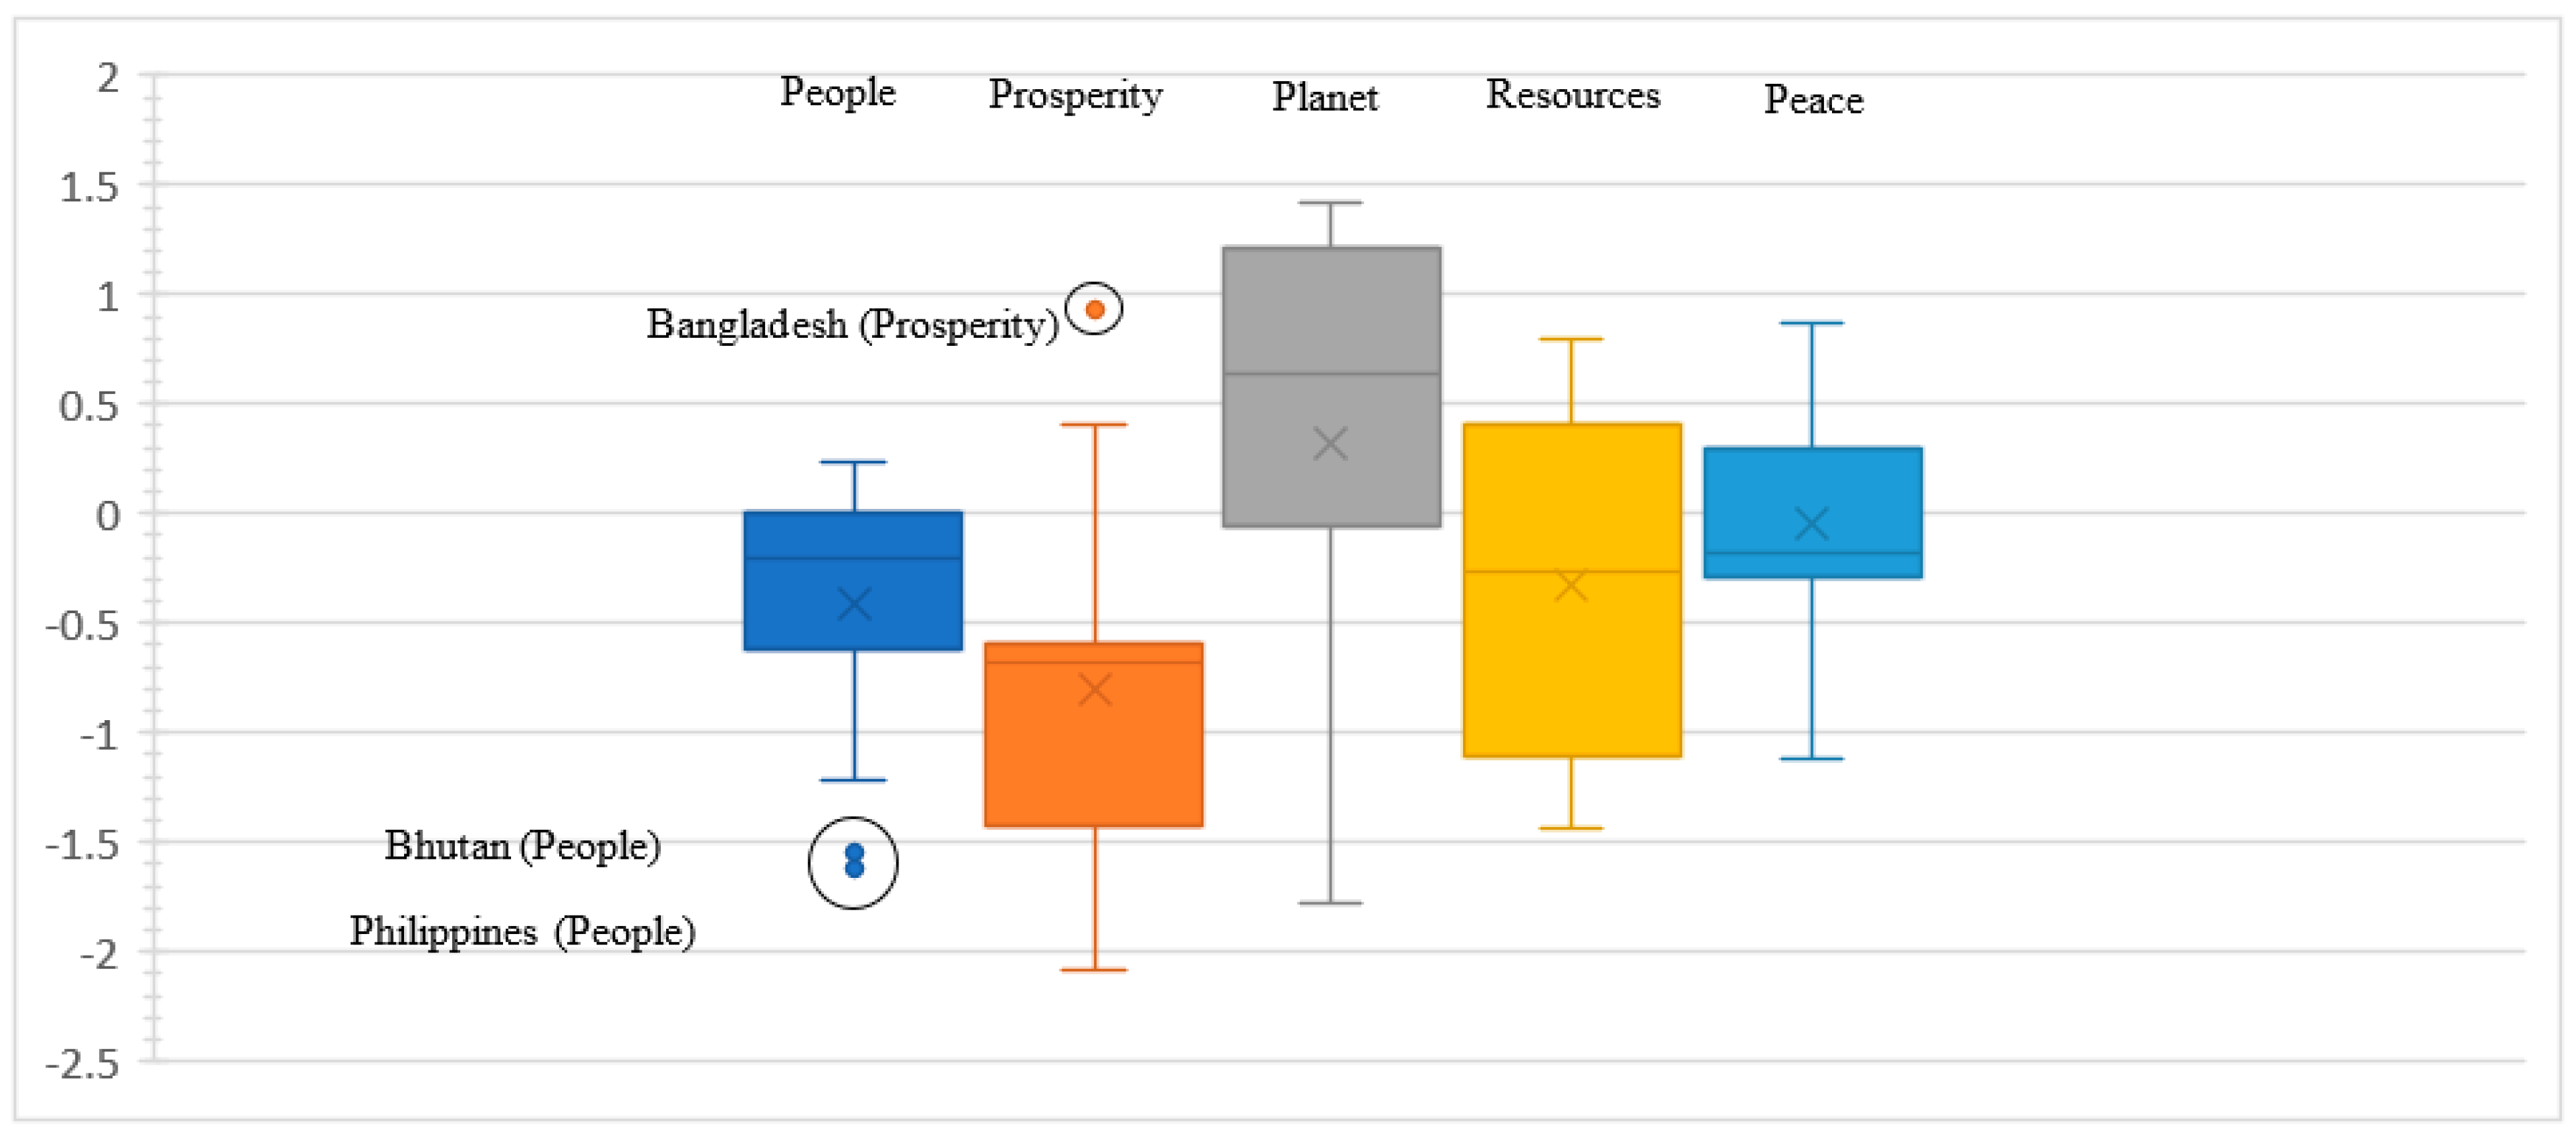
4.4.2. Emerging and Developing Europe
4.4.3. Emerging and Developing Asia
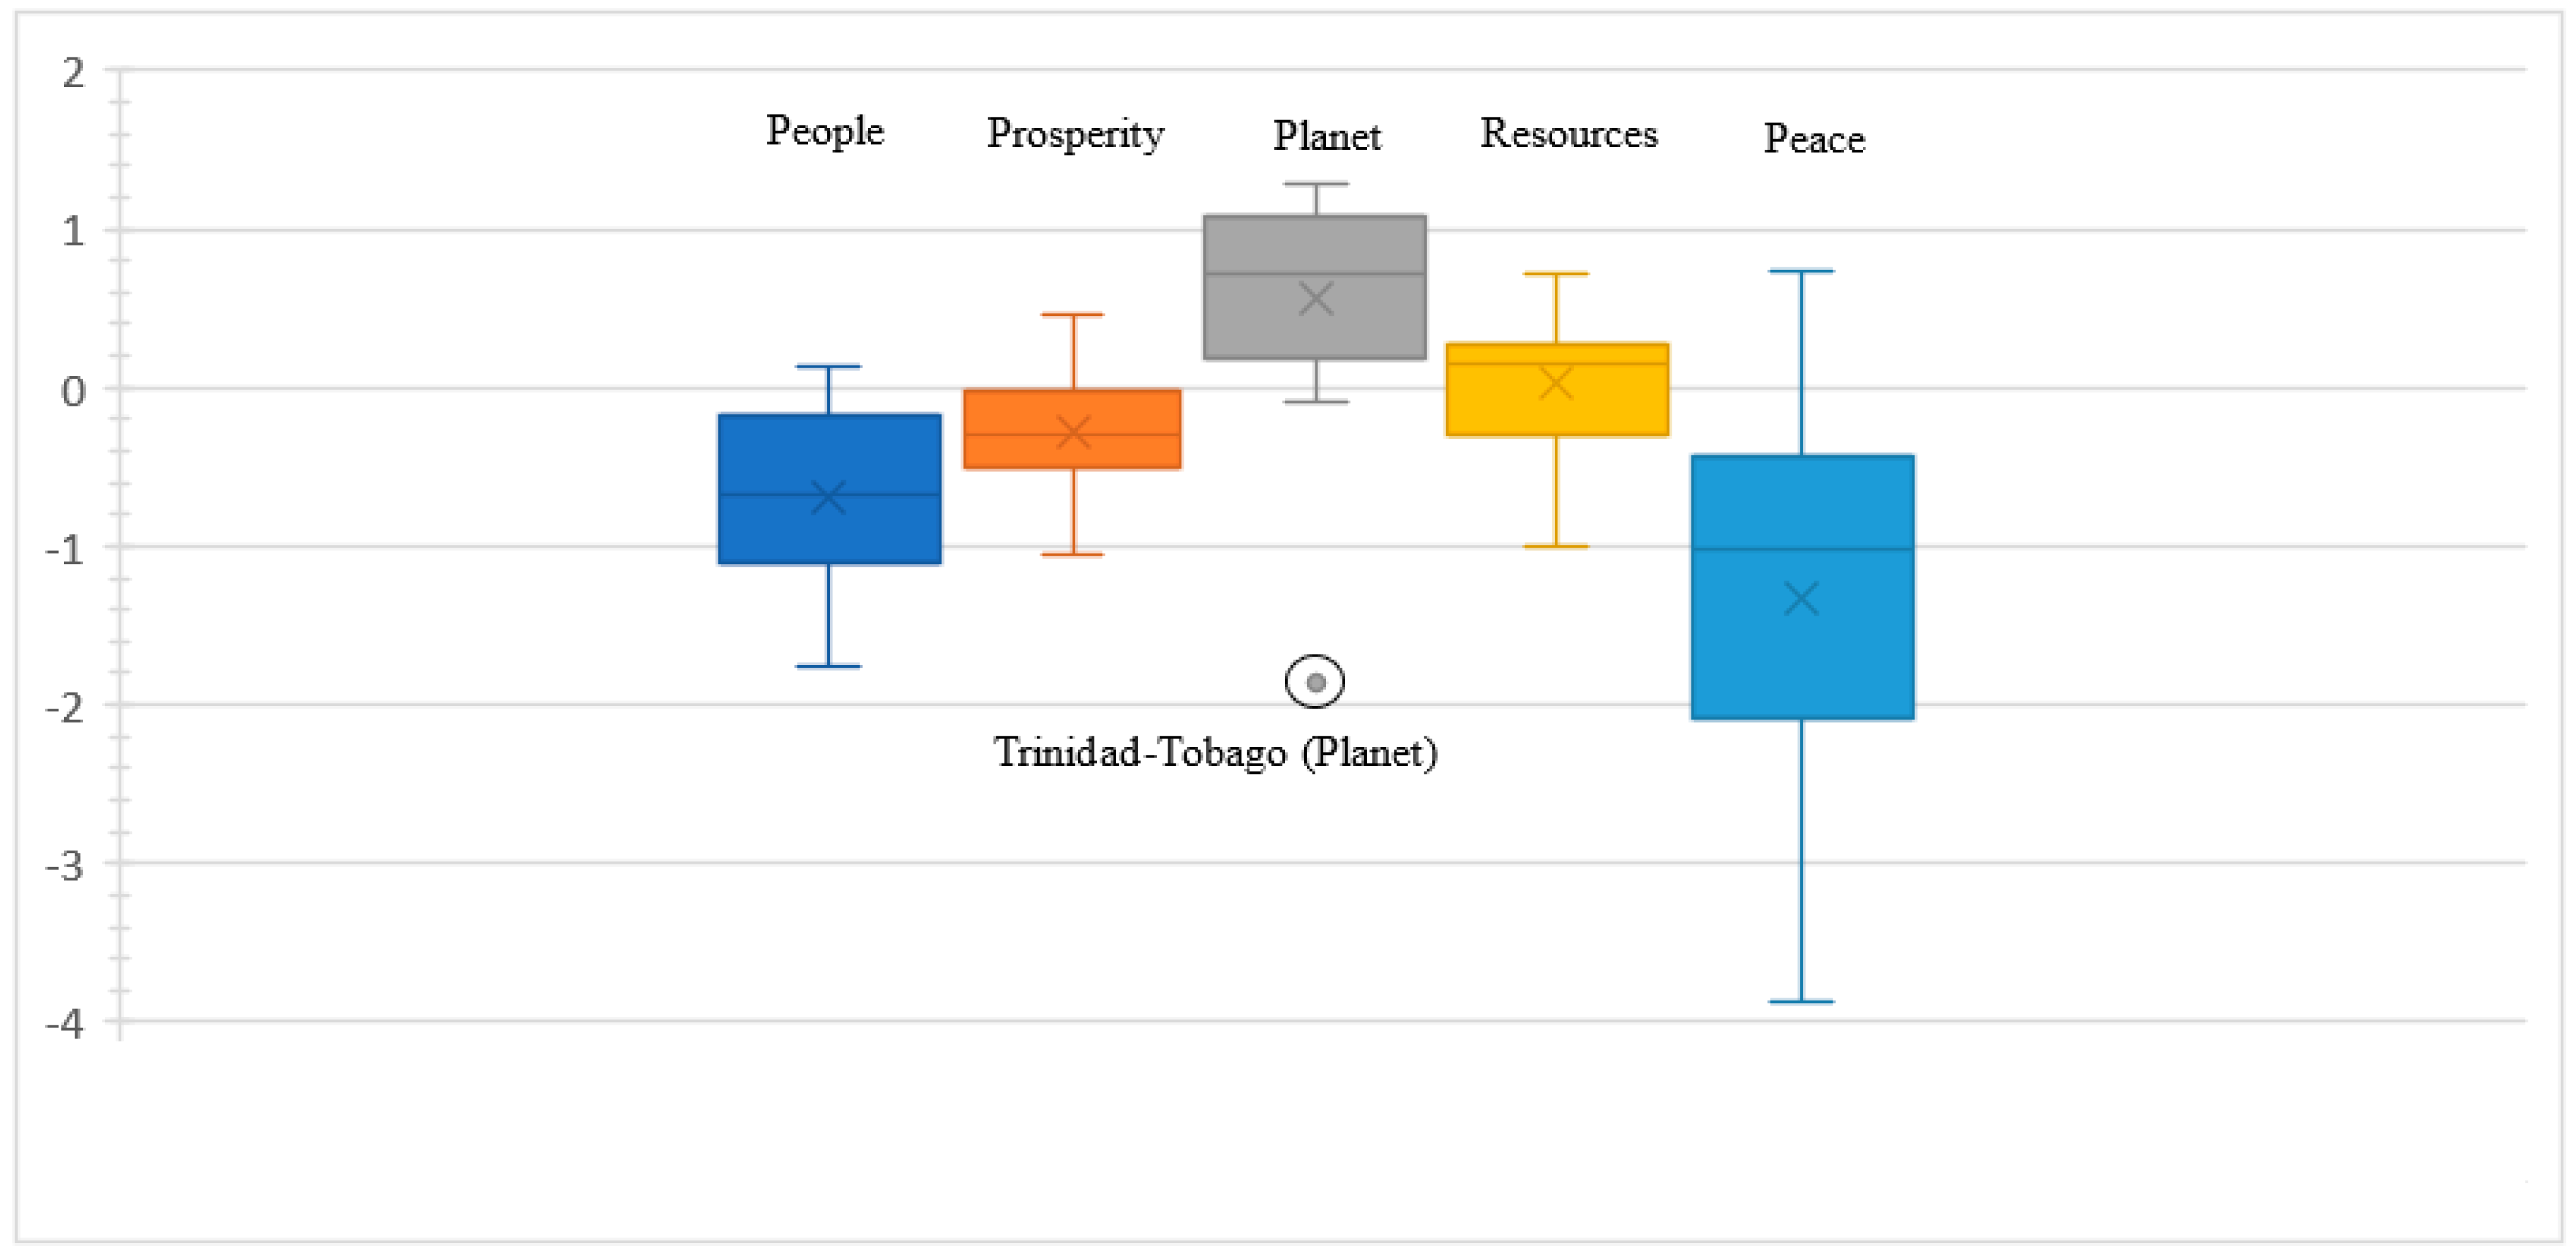
4.4.4. Middle East, North Africa, and Pakistan
4.4.5. Latin America and the Caribbean
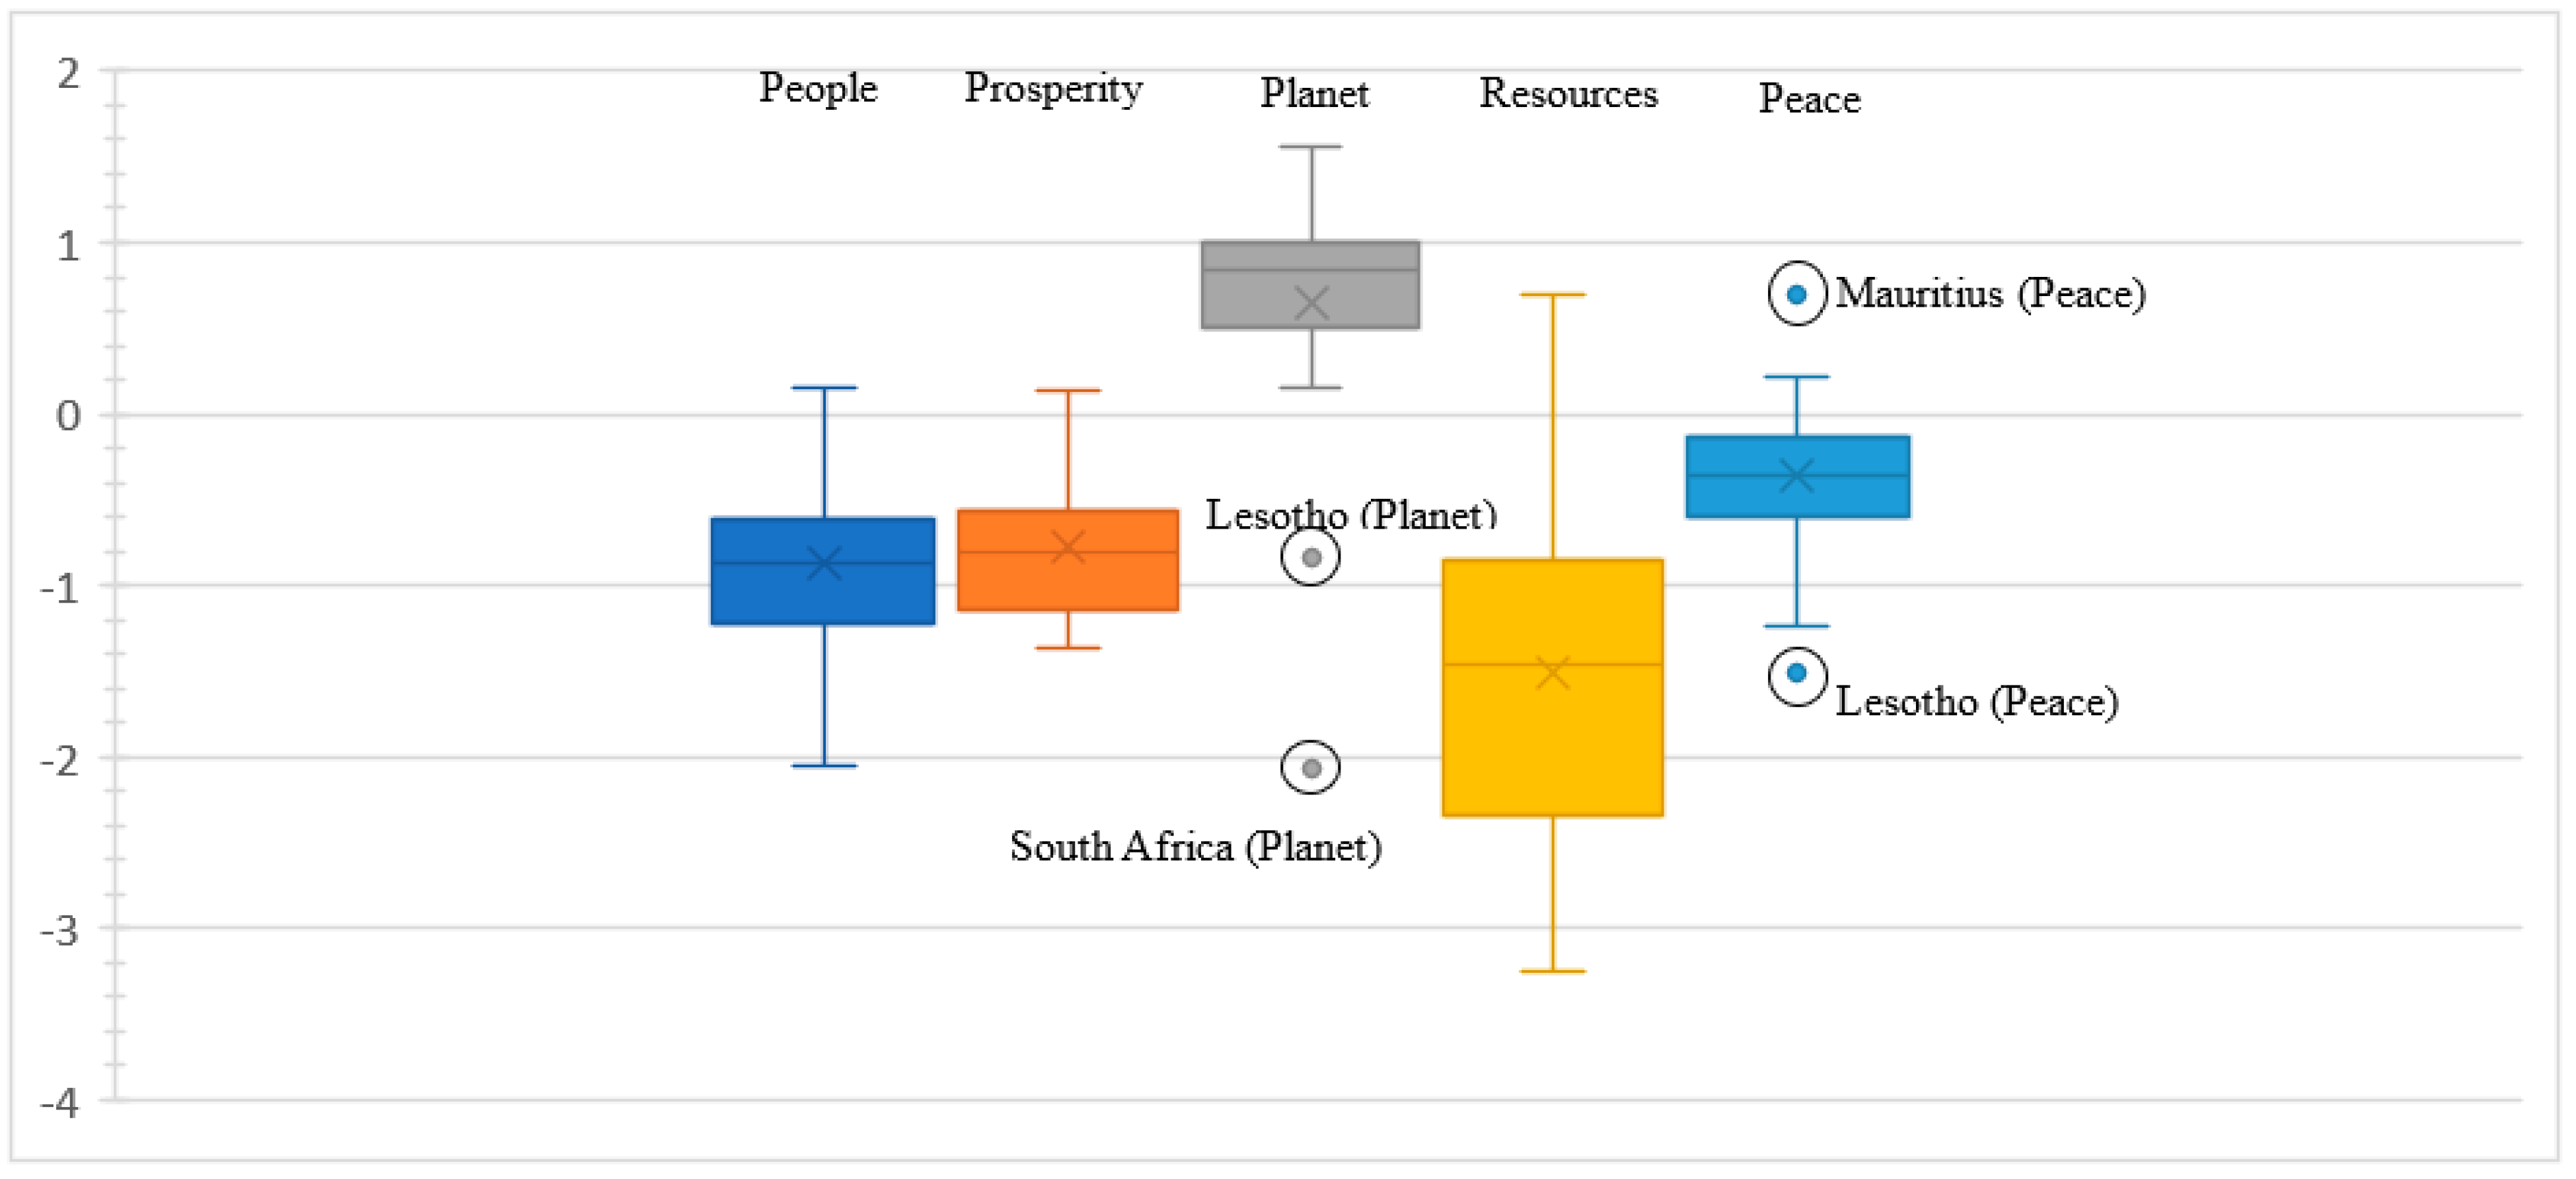
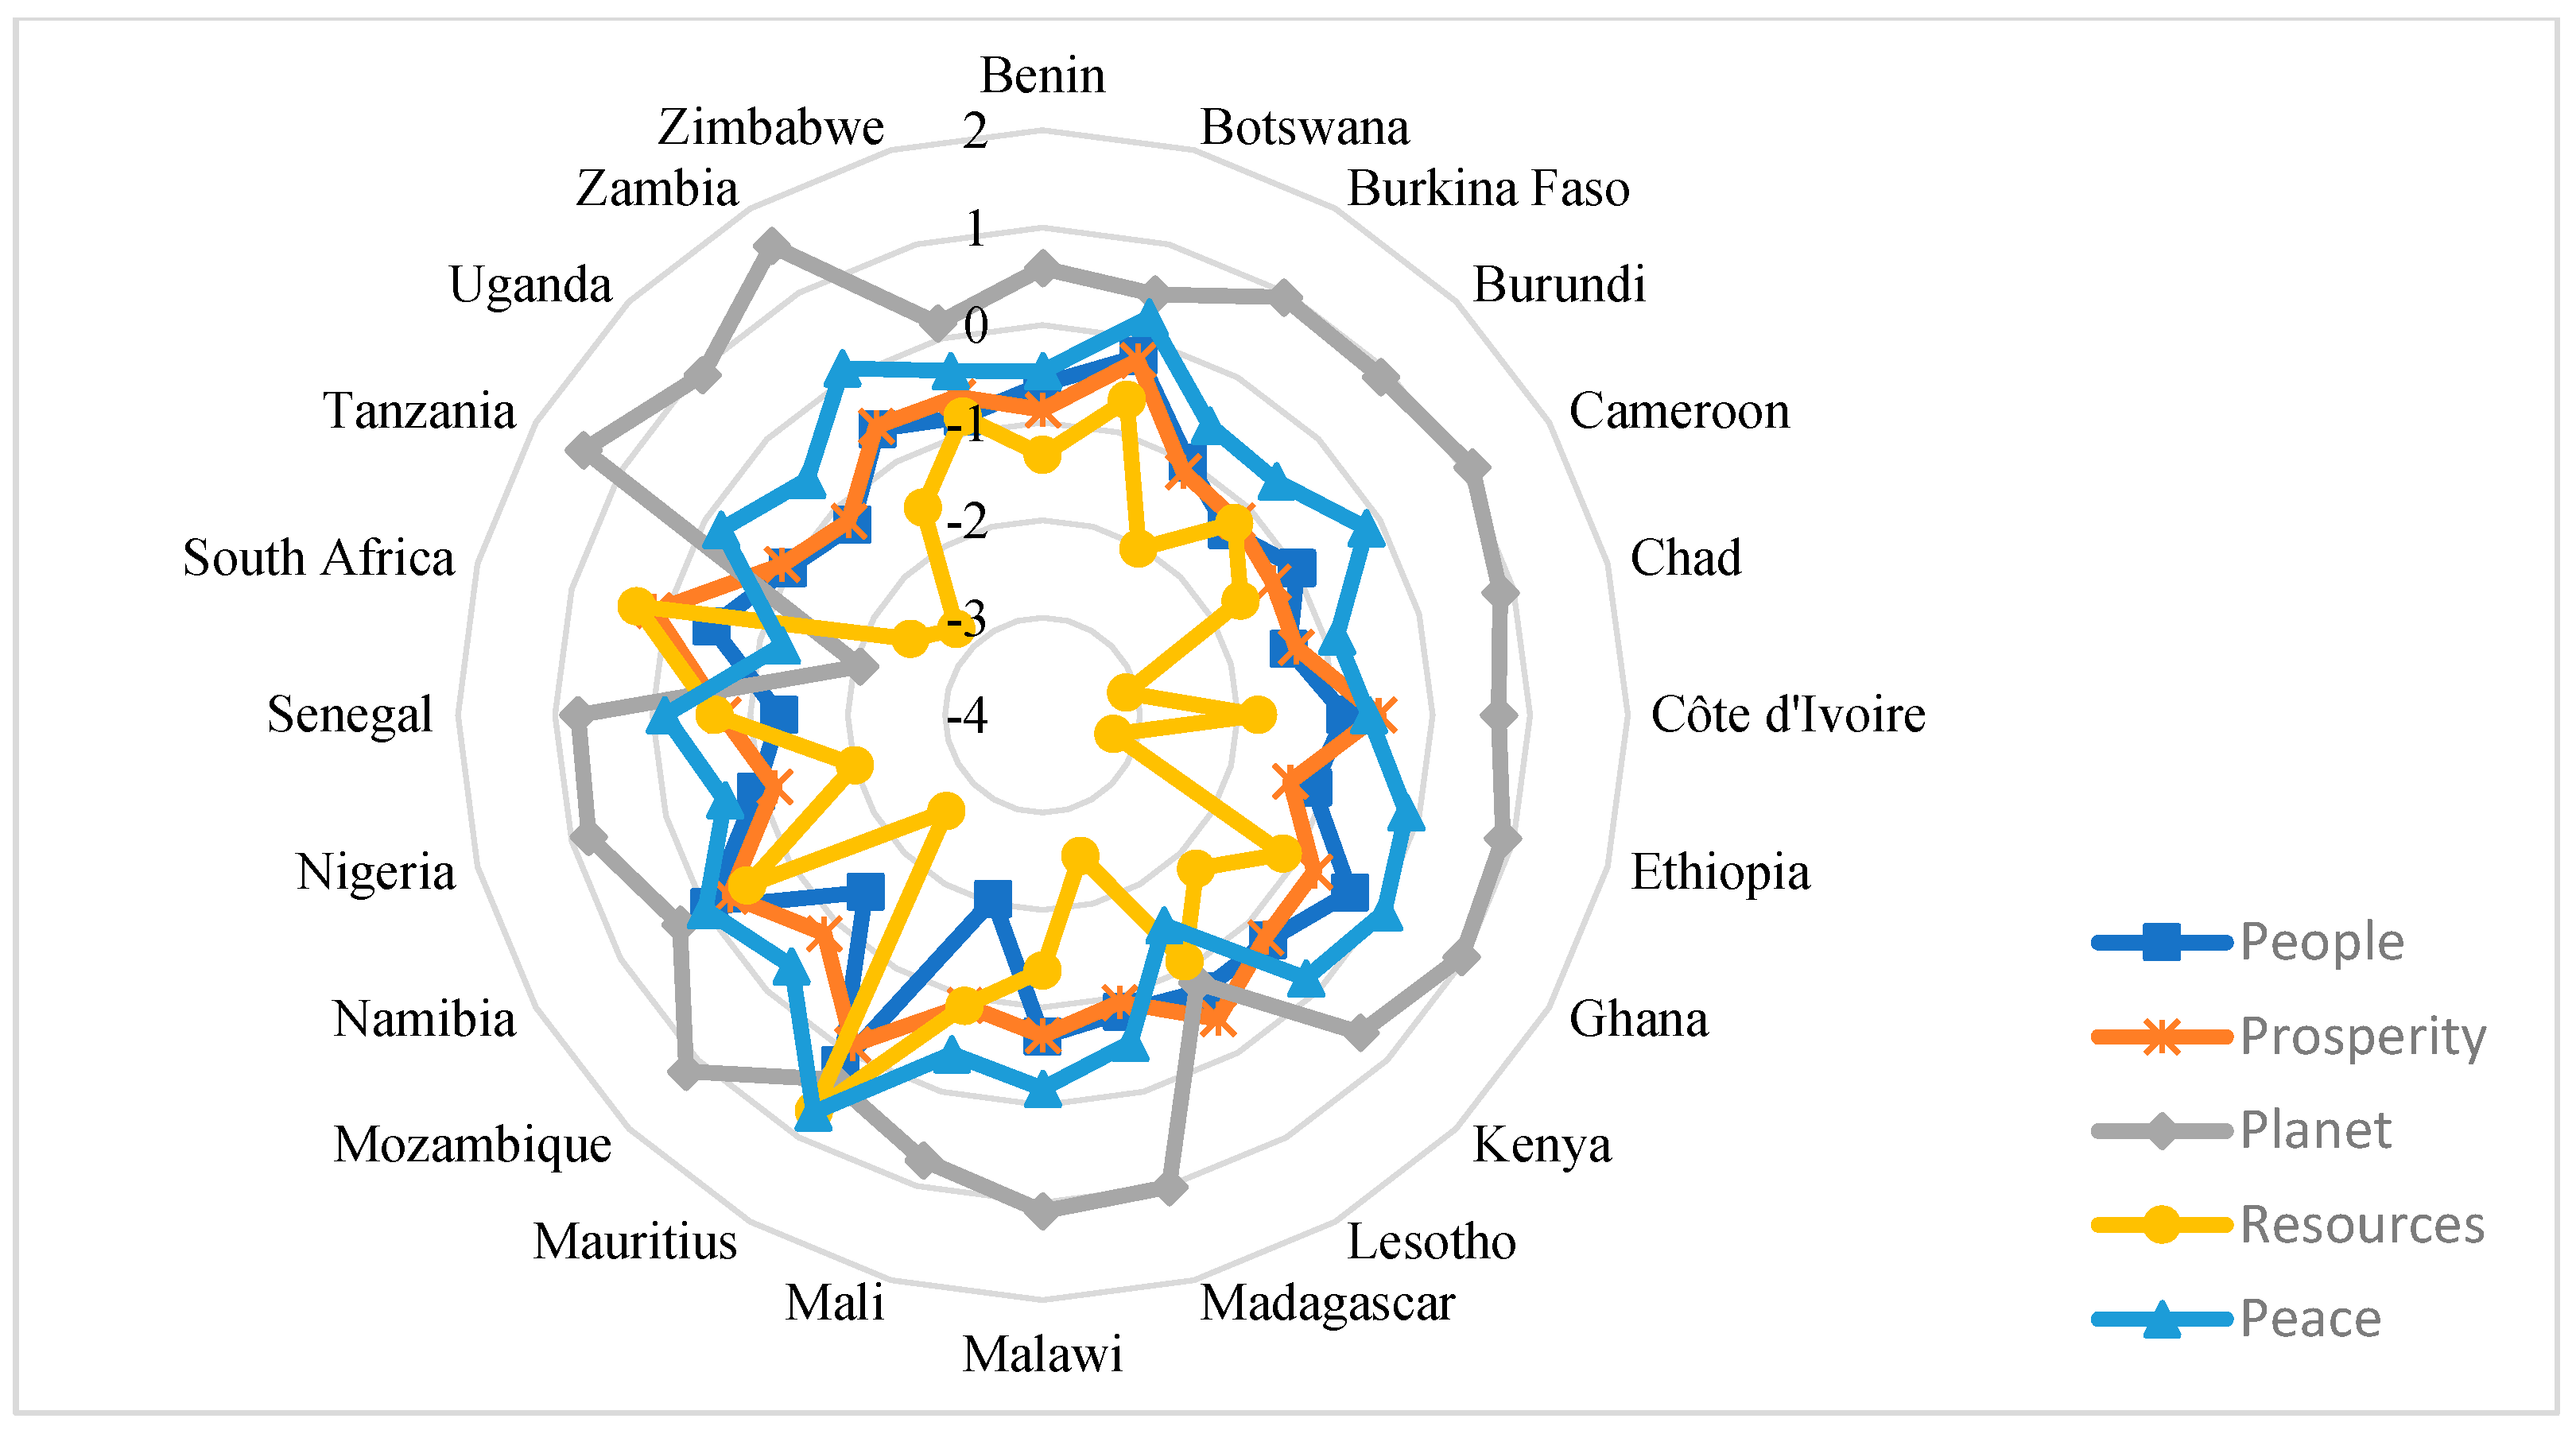
4.4.6. Sub-Saharan Africa
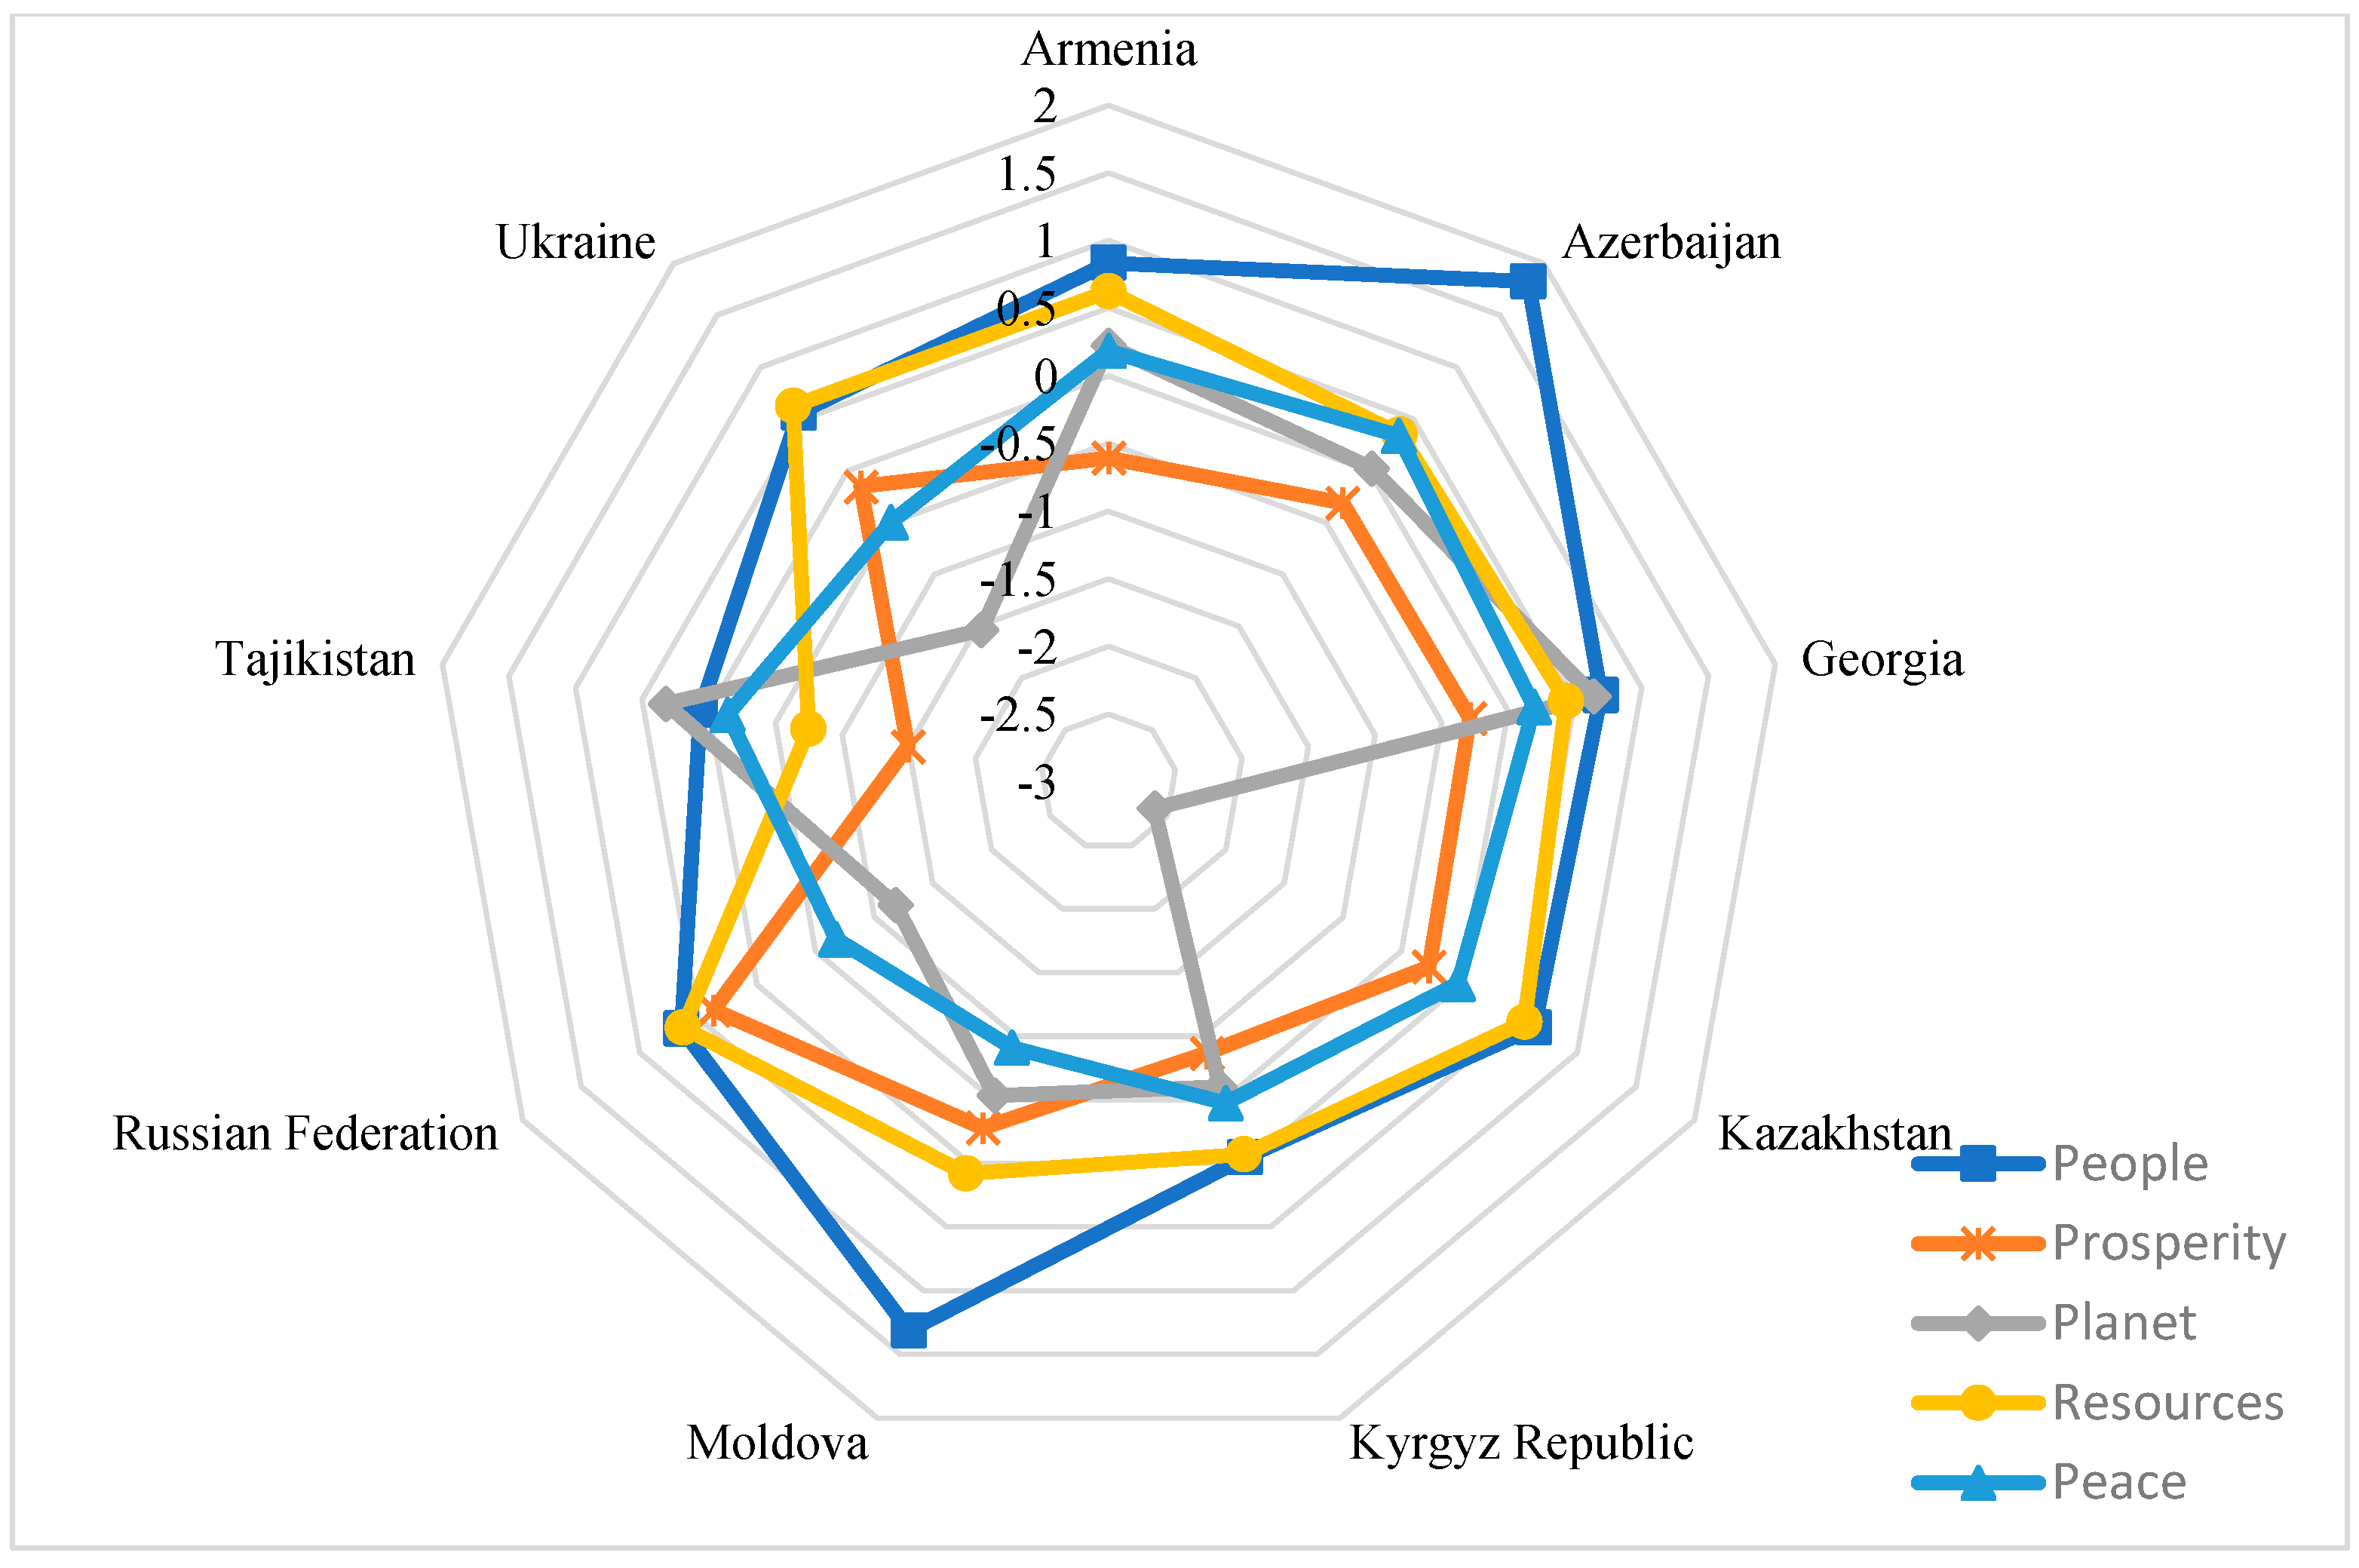
4.4.7. Commonwealth
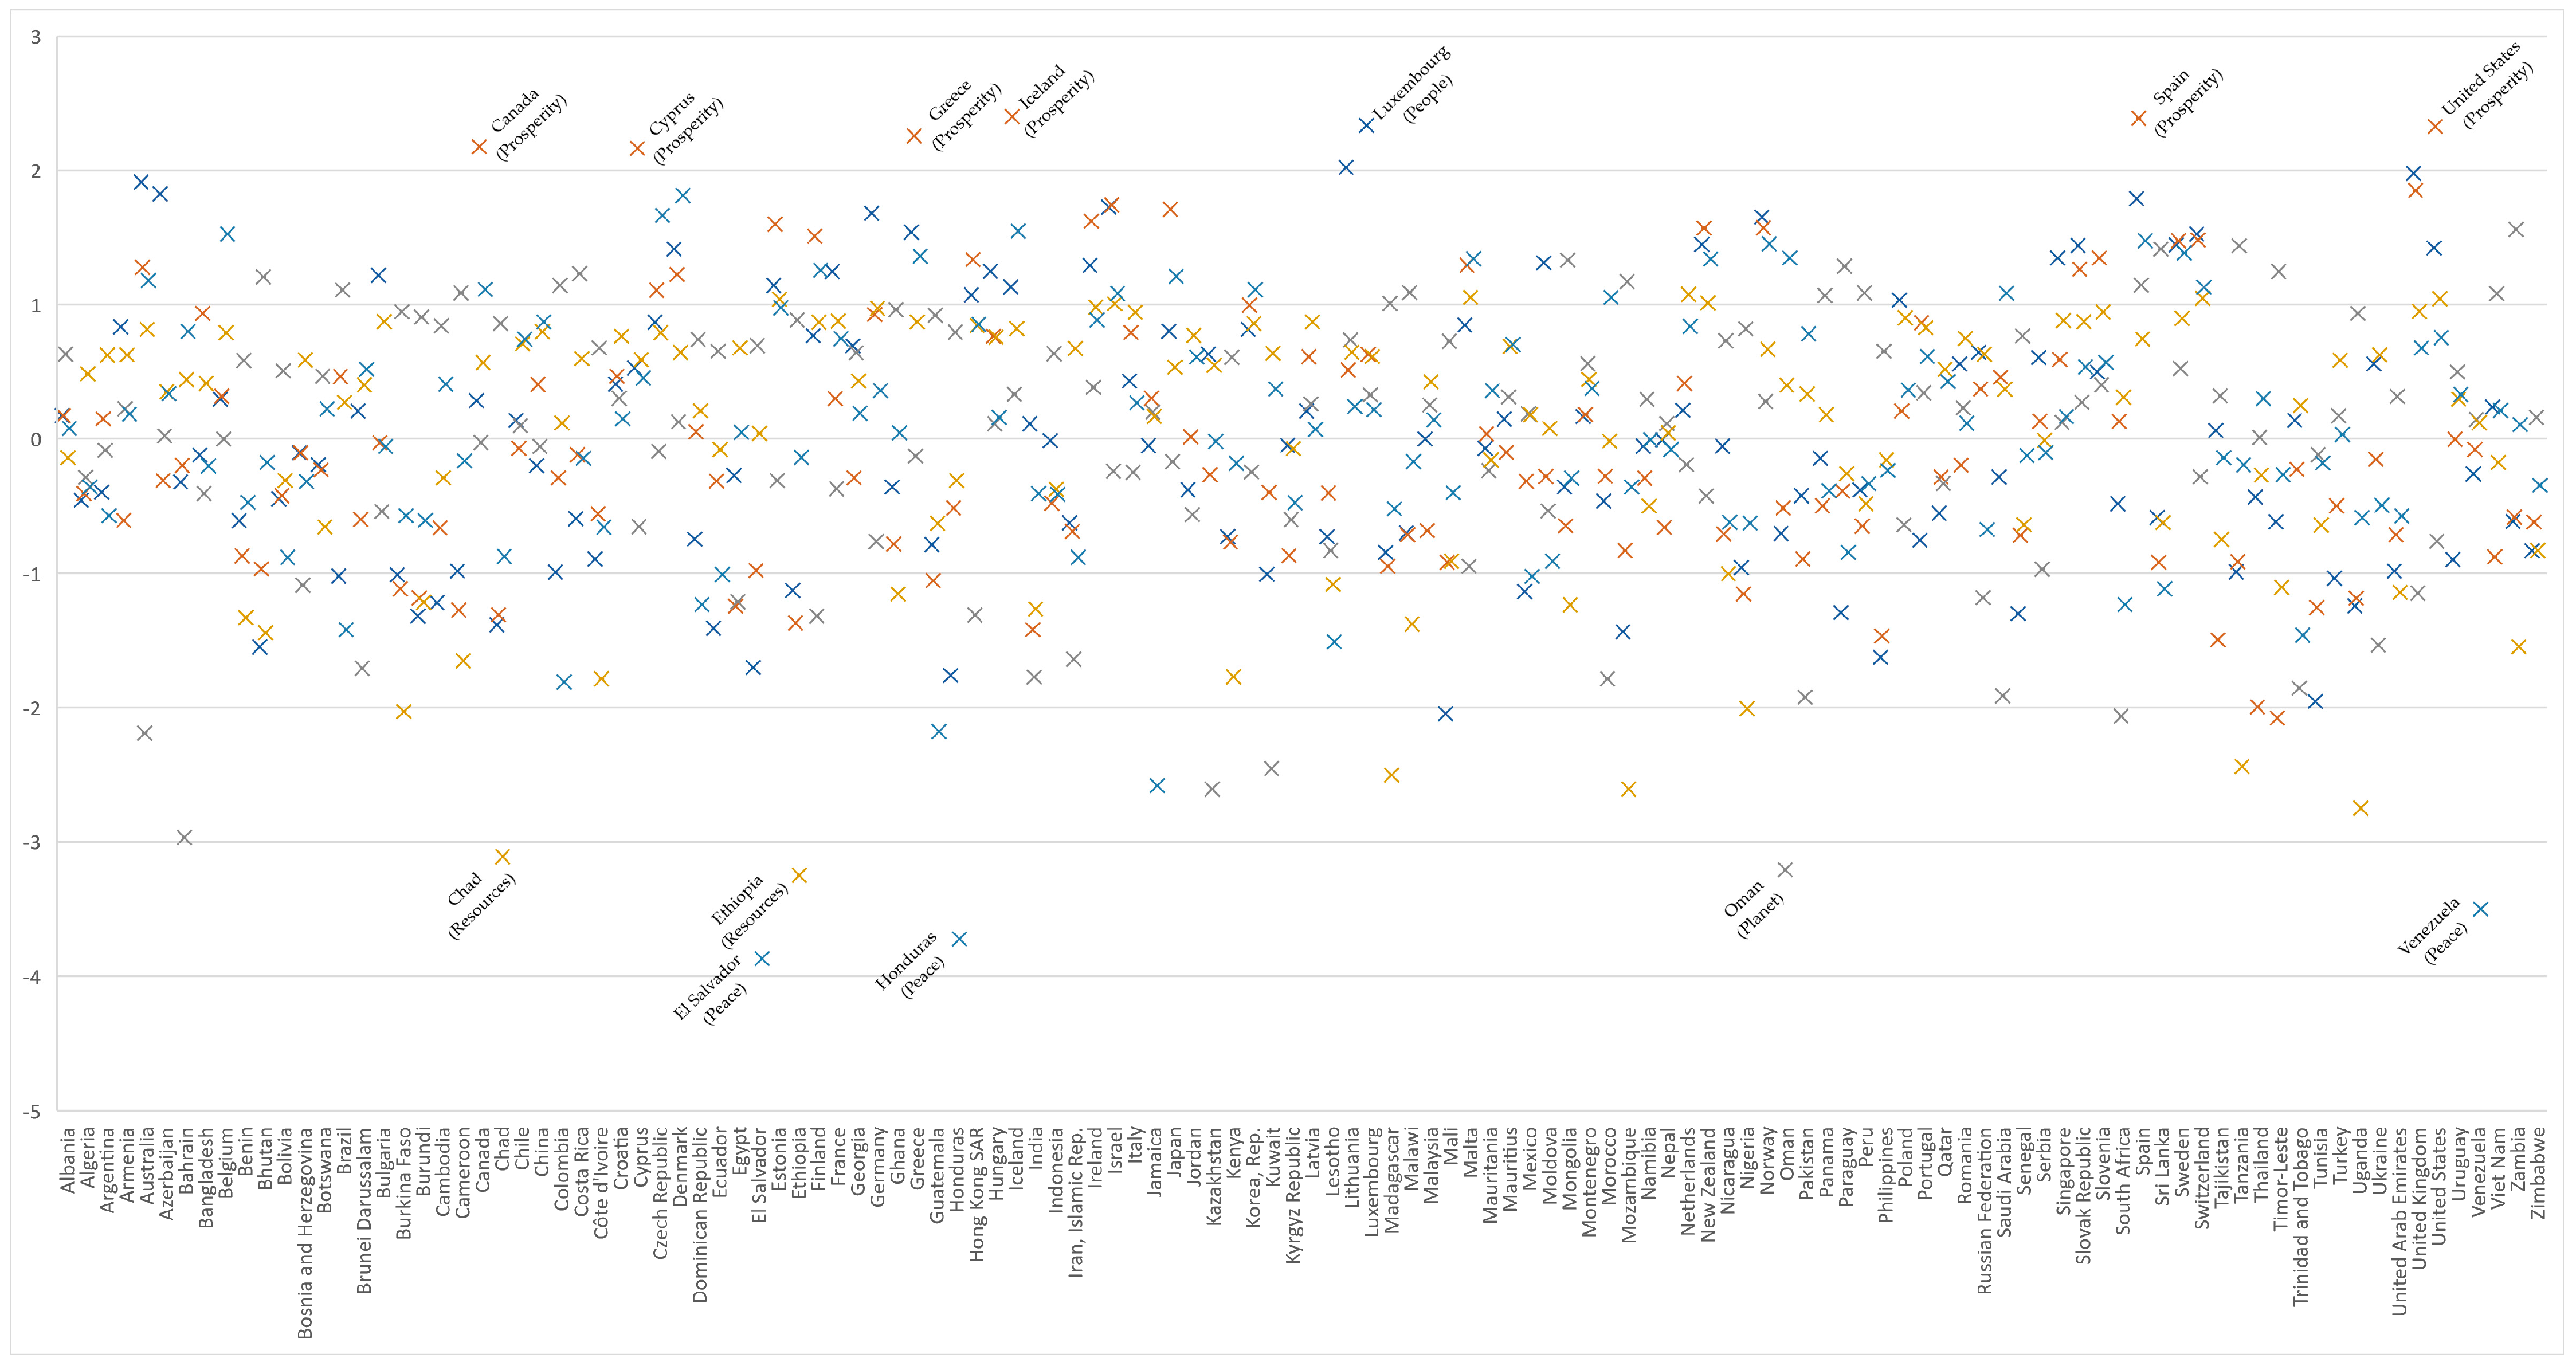
4.4.8. Country Outliers, Globally and Per Country Cluster
5. Implications, Limitations, and Future Research
5.1. Theoretical Implications
5.2. Practical Implications
5.3. Limitations and Future Research
6. Conclusions
Author Contributions
Funding
Institutional Review Board Statement
Informed Consent Statement
Data Availability Statement
Acknowledgments
Conflicts of Interest
Appendix A
| Global Competitiveness (Institutional) | |
|---|---|
| Higher Education and Training | Secondary education enrollment, gross % |
| Tertiary education enrollment, gross % | |
| Quality of the education system, 1–7 (best) | |
| Quality of math and science education, 1–7 (best) | |
| Quality of management schools, 1–7 (best) | |
| Internet access in schools, 1–7 (best) | |
| Availability of research and training services, 1–7 (best) | |
| Extent of staff training, 1–7 (best) | |
| Goods Market Efficiency | Intensity of local competition, 1-7 (best) |
| Extent of market dominance, 1–7 (best) | |
| Effectiveness of antimonopoly policy, 1–7 (best) | |
| No. procedures to start a business | |
| No. days to start a business | |
| Agricultural policy costs, 1–7 (best) | |
| Total tax rate, % profits | |
| Prevalence of trade barriers, 1–7 (best) | |
| Prevalence of foreign ownership, 1–7 (best) | |
| Business impact of rules on FDI, 1–7 (best) | |
| Goods Market Efficiency | Burden of customs procedures, 1–7 (best) |
| Imports as a percentage of GDP | |
| Trade tariffs, % duty | |
| Degree of customer orientation, 1–7 (best) | |
| Buyer sophistication, 1–7 (best) | |
| Labor Market Efficiency | Cooperation in labor–employer relations, 1–7 (best) |
| Hiring and firing practices, 1–7 (best) | |
| Flexibility of wage determination, 1–7 (best) | |
| Redundancy costs, weeks of salary | |
| Pay and productivity, 1–7 (best) | |
| Reliance on professional management, 1–7 (best) | |
| Women in labor force, ratio to men | |
| Financial Market Efficiency | Financing through local equity market, 1–7 (best) |
| Ease of access to loans, 1–7 (best) | |
| Venture capital availability, 1–7 (best) | |
| Soundness of banks, 1–7 (best) | |
| Regulation of securities exchanges, 1–7 (best) | |
| Technological Readiness | Legal rights index, 0–10 (best) |
| Availability of latest technologies, 1–7 (best) | |
| Firm-level technology absorption, 1–7 (best) | |
| FDI and technology transfer, 1–7 (best) | |
| Individuals using Internet, % | |
| Fixed broadband Internet subscriptions/100 pop. | |
| Global Competitiveness (Innovation Sophistication) | |
| Business Sophistication | Local supplier quantity, 1–7 (best) |
| Local supplier quality, 1–7 (best) | |
| State of cluster development, 1–7 (best) | |
| Nature of competitive advantage, 1–7 (best) | |
| Production process sophistication, 1–7 (best) | |
| Control of international distribution, 1–7 (best) | |
| Extent of marketing, 1–7 (best) | |
| Value chain breadth, 1–7 (best) | |
| Innovation | Capacity for innovation, 1–7 (best) |
| Quality of scientific research institutions, 1–7 (best) | |
| Company spending on R&D, 1–7 (best) | |
| University–industry collaboration in R&D, 1–7 (best) | |
| Government procurement of advanced tech products, 1–7 (best) | |
| Availability of scientists and engineers, 1–7 (best) | |
| Economic Enhancers (Institutional) | |
| Business Freedom | |
| Property Rights | |
| Government Integrity | |
| Judicial Effectiveness | |
| Economic Enhancers (Financial) | |
| Government Spending | |
| Monetary Freedom | |
| Trade Freedom | |
| Investment Freedom | |
| Financial Freedom | |
| Foreign Direct Investment | |
| FDI IN % of the GDP and Annual USD | |
| FDI OUT % of the GDP and Annual USD | |
| Sustainable Development Dimension (People) | |
| SDG1 | Poverty headcount ratio at USD 1.90 a day (2011 PPP) (% of the population) |
| Poverty headcount ratio at national poverty lines (% of the population) | |
| SDG3 | Maternal mortality ratio (modeled estimate per 100,000 live births) |
| SDG4 | Educational attainments, at least completed upper secondary, population 25+, total (%) (cumulative) |
| Educational attainment, at least completed postsecondary, population 25+, total (%) (cumulative) | |
| Educational attainment, at least completed lower secondary, population 25+, total (%) (cumulative) | |
| SDG5 | Women Business and the Law Index Score (scale 1-100) |
| Sustainable Development Dimension (Prosperity) | |
| SDG8 | GDP per capita growth (annual %) |
| Unemployment, total (% of the total labor force) (modeled ILO estimate) | |
| SDG9 | Research and development expenditure (% of GDP) |
| Individuals using the Internet (% of the population) | |
| SDG10 | Adjusted net savings, excluding particulate emission damage (% of GNI) |
| SDG11 | PM2.5 air pollution, mean annual exposure (micrograms per cubic meter) |
| Sustainable Development Dimension (Planet) | |
| SDG13 | CO2 emissions (metric tons per capita) |
| SDG14 | CO2 emissions (kg per PPP USD of GDP) |
| SDG15 | Forest area (% of land area) |
| Annual freshwater withdrawals, total (% of internal resources) | |
| Sustainable Development Dimension (Resources) | |
| SDG2 | Prevalence of undernourishment (% of the population) |
| SDG6 | People using at least basic drinking water services, rural (% of rural population) |
| People using at least basic drinking water services, urban (% of urban population) | |
| People using safely managed drinking water services (% of the population) | |
| SDG7 | Renewable energy consumption (% of total final energy consumption) |
| Sustainable Development Dimension (Peace) | |
| SDG16 | Intentional homicides (per 100,000 people) |
| SDG17 (adjusted average of following indicators) | Property rights, 1–7 (best) |
| Intellectual property protection, 1–7 (best) | |
| Diversion of public funds, 1–7 (best) | |
| Public trust in politicians, 1–7 (best) | |
| Judicial independence, 1–7 (best) | |
| Favoritism in decisions of government officials, 1–7 (best) | |
| Wastefulness of government spending, 1–7 (best) | |
| Burden of government regulation, 1–7 (best) | |
| Transparency of government policymaking, 1–7 (best) | |
| Business costs of terrorism, 1–7 (best) | |
| Business costs of crime and violence, 1–7 (best) | |
| Organized crime, 1–7 (best) | |
| Reliability of police services, 1–7 (best) | |
| Ethical behavior of firms, 1–7 (best) | |
| Strength of auditing and reporting standards, 1–7 (best) | |
| Efficacy of corporate boards, 1–7 (best) | |
| Protection of minority shareholders’ interests, 1–7 (best) | |
| Strength of investor protection, 0–10 (best) * | |
| Happiness and Life Satisfaction | |
| Adjusted to 100 (score) life satisfaction in the Cantril Ladder (Helliwell, Huang, and Wang, 2019) [104] The underlying source of the happiness scores in the World Happiness Report is the Gallup World Poll—a set of nationally representative surveys undertaken in more than 160 countries in over 140 languages. The main life evaluation question asked in the poll is: “Please imagine a ladder, with steps numbered from 0 at the bottom to 10 at the top. The top of the ladder represents the best possible life for you, and the bottom of the ladder represents the worst possible life for you. On which step of the ladder would you say you personally feel you stand at this time?” (Also known as the “Cantril Ladder.”) | |
| Populations | Percentages | GDP | Percentages | |
|---|---|---|---|---|
| Advanced Economies | 977,693,601.00 | 15.76057015 | 36,083,063,161,670.50 | 54.14794 |
| Emerging Europe | 164,754,708.00 | 2.655871052 | 1,880,760,824,314.84 | 2.822358 |
| Emerging Asia | 3,208,431,222.00 | 51.72040125 | 16,993,899,236,746.00 | 25.50184 |
| Middle East | 475,969,475.00 | 7.672700622 | 5,467,148,817,836.51 | 8.204261 |
| Latin America | 542,274,035.00 | 8.741540254 | 3,752,384,843,371.03 | 5.631005 |
| Sub-Saharan | 598,914,908.00 | 9.654599776 | 849,177,983,890.26 | 1.274316 |
| Commonwealth | 235,377,230.00 | 3.794316892 | 1,611,488,033,222.07 | 2.418275 |
| Clusters Total | 6,203,415,179.00 | 66,637,922,901,051.30 | ||
| World | 6,674,000,000.00 | 67,500,000,000,000.00 | ||
| % Of World | 92.94% | 98.72% |
| Countries | People | Prosperity | Planet | Resources | Peace |
|---|---|---|---|---|---|
| Australia | 1.913 | 1.278 | −2.192 | 0.816 | 1.179 |
| Belgium | 0.296 | 0.319 | 0 | 0.79 | 1.526 |
| Canada | 0.285 | 2.177 | −0.026 | 0.569 | 1.114 |
| Cyprus | 0.529 | 2.164 | −0.652 | 0.59 | 0.453 |
| Czech Republic | 0.87 | 1.108 | −0.092 | 0.79 | 1.665 |
| Denmark | 1.414 | 1.224 | 0.127 | 0.644 | 1.814 |
| Estonia | 1.144 | 1.599 | −0.309 | 1.04 | 0.976 |
| Finland | 0.768 | 1.509 | −1.318 | 0.869 | 1.257 |
| France | 1.247 | 0.301 | −0.372 | 0.878 | 0.747 |
| Germany | 1.68 | 0.928 | −0.763 | 0.973 | 0.36 |
| Greece | 1.539 | 2.257 | −0.127 | 0.872 | 1.361 |
| Hong Kong SAR | 1.072 | 1.336 | −1.312 | 0.844 | 0.853 |
| Iceland | 1.131 | 2.4 | 0.333 | 0.823 | 1.547 |
| Ireland | 1.291 | 1.62 | 0.384 | 0.981 | 0.886 |
| Israel | 1.727 | 1.742 | −0.241 | 1.007 | 1.083 |
| Italy | 0.432 | 0.792 | −0.249 | 0.943 | 0.269 |
| Japan | 0.802 | 1.711 | −0.169 | 0.535 | 1.21 |
| Korea, Rep. | 0.817 | 0.997 | −0.247 | 0.859 | 1.111 |
| Latvia | 0.207 | 0.612 | 0.262 | 0.871 | 0.071 |
| Lithuania | 2.021 | 0.512 | 0.736 | 0.646 | 0.241 |
| Luxembourg | 2.334 | 0.629 | 0.328 | 0.614 | 0.218 |
| Malta | 0.848 | 1.293 | −0.949 | 1.054 | 1.341 |
| Netherlands | 0.214 | 0.413 | −0.191 | 1.076 | 0.838 |
| New Zealand | 1.448 | 1.57 | −0.424 | 1.013 | 1.339 |
| Norway | 1.652 | 1.571 | 0.278 | 0.668 | 1.452 |
| Portugal | −0.753 | 0.866 | 0.342 | 0.828 | 0.613 |
| Singapore | 1.348 | 0.593 | 0.123 | 0.882 | 0.165 |
| Slovak Republic | 1.441 | 1.264 | 0.272 | 0.873 | 0.536 |
| Slovenia | 0.499 | 1.347 | 0.402 | 0.944 | 0.571 |
| Spain | 1.789 | 2.388 | 1.146 | 0.744 | 1.476 |
| Sweden | 1.445 | 1.477 | 0.524 | 0.897 | 1.385 |
| Switzerland | 1.525 | 1.482 | −0.282 | 1.048 | 1.13 |
| United Kingdom | 1.978 | 1.85 | −1.148 | 0.949 | 0.678 |
| United States | 1.423 | 2.327 | −0.761 | 1.045 | 0.754 |
| Countries | People | Prosperity | Planet | Resources | Peace |
|---|---|---|---|---|---|
| Bosnia and Herzegovina | −0.104 | −0.104 | −1.09 | 0.589 | −0.32 |
| Bulgaria | 1.219 | −0.028 | −0.54 | 0.874 | −0.06 |
| Croatia | 0.408 | 0.467 | 0.303 | 0.765 | 0.15 |
| Hungary | 1.248 | 0.764 | 0.112 | 0.758 | 0.16 |
| Montenegro | 0.166 | 0.182 | 0.561 | 0.444 | 0.376 |
| Poland | 1.035 | 0.208 | −0.64 | 0.902 | 0.364 |
| Romania | 0.558 | −0.194 | 0.232 | 0.749 | 0.117 |
| Serbia | 0.605 | 0.132 | −0.97 | −0.011 | −0.1 |
| Turkey | −1.038 | −0.498 | 0.172 | 0.586 | 0.034 |
| Countries | People | Prosperity | Planet | Resources | Peace |
|---|---|---|---|---|---|
| Bangladesh | −0.12 | 0.935 | −0.41 | 0.413 | −0.2 |
| Bhutan | −1.549 | −0.969 | 1.206 | −1.443 | −0.18 |
| Brunei Darussalam | 0.207 | −0.599 | −1.71 | 0.401 | 0.519 |
| Cambodia | −1.219 | −0.662 | 0.842 | −0.29 | 0.408 |
| China | −0.199 | 0.406 | −0.06 | 0.798 | 0.872 |
| India | 0.113 | −1.421 | −1.77 | −1.266 | −0.41 |
| Indonesia | −0.012 | −0.479 | 0.635 | −0.376 | −0.41 |
| Malaysia | 0 | −0.683 | 0.254 | 0.425 | 0.142 |
| Mongolia | −0.357 | −0.647 | 1.331 | −1.235 | −0.29 |
| Nepal | −0.007 | −0.658 | 0.114 | 0.044 | −0.08 |
| Philippines | −1.626 | −1.468 | 0.653 | −0.158 | −0.23 |
| Sri Lanka | −0.585 | −0.918 | 1.414 | −0.624 | −1.12 |
| Thailand | −0.433 | −1.995 | 0.011 | −0.271 | 0.3 |
| Timor-Leste | −0.617 | −2.079 | 1.247 | −1.105 | −0.27 |
| Viet Nam | 0.238 | −0.878 | 1.082 | −0.176 | 0.212 |
| Countries | People | Prosperity | Planet | Resources | Peace |
|---|---|---|---|---|---|
| Algeria | −0.457 | −0.408 | −0.29 | 0.485 | −0.36 |
| Bahrain | −0.321 | −0.196 | −2.97 | 0.442 | 0.801 |
| Egypt | −0.273 | −1.246 | −1.21 | 0.678 | 0.048 |
| Iran, Islamic Rep. | −0.625 | −0.688 | −1.64 | 0.674 | −0.88 |
| Jordan | −0.38 | 0.016 | −0.56 | 0.771 | 0.609 |
| Kuwait | −1.008 | −0.399 | −2.45 | 0.637 | 0.373 |
| Mauritania | −0.071 | 0.037 | −0.24 | −0.157 | 0.361 |
| Morocco | −0.462 | −0.278 | −1.79 | −0.017 | 1.053 |
| Oman | −0.705 | −0.515 | −3.21 | 0.399 | 1.348 |
| Pakistan | −0.422 | −0.894 | −1.92 | 0.334 | 0.782 |
| Qatar | −0.554 | −0.285 | −0.33 | 0.519 | 0.427 |
| Saudi Arabia | −0.285 | 0.459 | −1.91 | 0.371 | 1.085 |
| Tunisia | −1.956 | −1.255 | −0.12 | −0.641 | −0.18 |
| United Arab Emirates | −0.983 | −0.714 | 0.317 | −1.142 | −0.57 |
| Countries | People | Prosperity | Planet | Resources | Peace |
|---|---|---|---|---|---|
| Argentina | −0.398 | 0.15 | −0.08 | 0.624 | −0.57 |
| Bolivia | −0.446 | −0.423 | 0.506 | −0.309 | −0.88 |
| Brazil | −1.021 | 0.466 | 1.11 | 0.273 | −1.42 |
| Chile | 0.138 | −0.071 | 0.099 | 0.709 | 0.742 |
| Colombia | −0.992 | −0.29 | 1.143 | 0.118 | −1.81 |
| Costa Rica | −0.594 | −0.117 | 1.23 | 0.598 | −0.14 |
| Dominican Republic | −0.747 | 0.052 | 0.74 | 0.209 | −1.23 |
| Ecuador | −1.41 | −0.313 | 0.654 | −0.077 | −1.01 |
| El Salvador | −1.702 | −0.98 | 0.696 | 0.04 | −3.87 |
| Guatemala | −0.788 | −1.056 | 0.922 | −0.63 | −2.18 |
| Honduras | −1.761 | −0.514 | 0.795 | −0.309 | −3.72 |
| Jamaica | −0.051 | 0.302 | 0.199 | 0.168 | −2.58 |
| Mexico | −1.136 | −0.315 | 0.188 | 0.18 | −1.02 |
| Nicaragua | −0.054 | −0.708 | 0.731 | −1.003 | −0.62 |
| Panama | −0.143 | −0.498 | 1.068 | 0.179 | −0.39 |
| Paraguay | −1.293 | −0.389 | 1.285 | −0.259 | −0.85 |
| Peru | −0.382 | −0.649 | 1.087 | −0.482 | −0.33 |
| Trinidad and Tobago | 0.139 | −0.227 | −1.86 | 0.249 | −1.46 |
| Uruguay | −0.898 | −0.002 | 0.498 | 0.296 | 0.33 |
| Venezuela | −0.261 | −0.078 | 0.144 | 0.121 | −3.5 |
| Countries | People | Prosperity | Planet | Resources | Peace |
|---|---|---|---|---|---|
| Benin | −0.609 | −0.87 | 0.584 | −1.331 | −0.47 |
| Botswana | −0.191 | −0.23 | 0.468 | −0.654 | 0.224 |
| Burkina Faso | −1.011 | −1.117 | 0.947 | −2.03 | −0.57 |
| Burundi | −1.319 | −1.185 | 0.907 | −1.215 | −0.61 |
| Cameroon | −0.983 | −1.276 | 1.088 | −1.652 | −0.16 |
| Chad | −1.384 | −1.31 | 0.86 | −3.112 | −0.87 |
| Côte d’Ivoire | −0.894 | −0.557 | 0.678 | −1.786 | −0.66 |
| Ethiopia | −1.129 | −1.371 | 0.886 | −3.249 | −0.14 |
| Ghana | −0.357 | −0.784 | 0.963 | −1.154 | 0.044 |
| Kenya | −0.729 | −0.77 | 0.608 | −1.77 | −0.18 |
| Lesotho | −0.729 | −0.403 | −0.83 | −1.083 | −1.51 |
| Madagascar | −0.846 | −0.949 | 1.009 | −2.503 | −0.52 |
| Malawi | −0.701 | −0.714 | 1.09 | −1.379 | −0.17 |
| Mali | −2.046 | −0.919 | 0.726 | −0.911 | −0.4 |
| Mauritius | 0.148 | −0.099 | 0.313 | 0.69 | 0.703 |
| Mozambique | −1.435 | −0.832 | 1.17 | −2.608 | −0.36 |
| Namibia | −0.055 | −0.293 | 0.296 | −0.5 | −0.01 |
| Nigeria | −0.959 | −1.155 | 0.82 | −2.009 | −0.63 |
| Senegal | −1.302 | −0.718 | 0.766 | −0.638 | −0.12 |
| South Africa | −0.483 | 0.13 | −2.07 | 0.311 | −1.23 |
| Tanzania | −0.989 | −0.914 | 1.438 | −2.44 | −0.19 |
| Uganda | −1.243 | −1.186 | 0.935 | −2.751 | −0.59 |
| Zambia | −0.615 | −0.582 | 1.56 | −1.546 | 0.107 |
| Zimbabwe | −0.833 | −0.619 | 0.159 | −0.831 | −0.35 |
| Countries | People | Prosperity | Planet | Resources | Peace |
|---|---|---|---|---|---|
| Armenia | 0.833 | −0.607 | 0.223 | 0.626 | 0.185 |
| Azerbaijan | 1.826 | −0.309 | 0.024 | 0.35 | 0.337 |
| Georgia | 0.694 | −0.29 | 0.641 | 0.432 | 0.192 |
| Kazakhstan | 0.631 | −0.266 | −2.608 | 0.549 | −0.019 |
| Kyrgyz Republic | −0.048 | −0.868 | −0.601 | −0.072 | −0.475 |
| Moldova | 1.312 | −0.281 | −0.536 | 0.079 | −0.91 |
| Russian Federation | 0.645 | 0.373 | −1.182 | 0.632 | −0.675 |
| Tajikistan | 0.063 | −1.495 | 0.321 | −0.749 | −0.14 |
| Ukraine | 0.559 | −0.151 | −1.536 | 0.625 | −0.495 |
| Top 25 Countries’ H&LS | Top 25 Countries’ Pillars Avg | Bottom 25 Countries H&LS | Bottom 25 Countries Pillars Avg |
|---|---|---|---|
| Georgia | Cyprus | Ecuador | Chad |
| France | Finland | Saudi Arabia | El Salvador |
| Ukraine | Singapore | Benin | Honduras |
| Hungary | Germany | Belgium | Ethiopia |
| Azerbaijan | Korea, Rep. | Tunisia | Uganda |
| Brazil | Malta | Czech Republic | India |
| Australia | Slovenia | Venezuela | Lesotho |
| Egypt | Japan | Paraguay | Tunisia |
| Nicaragua | Canada | Bolivia | Mozambique |
| Netherlands | Luxembourg | Slovenia | Nigeria |
| Algeria | Lithuania | Luxembourg | Madagascar |
| Malta | United Kingdom | Bahrain | Burkina Faso |
| Croatia | Czech Republic | Dominican Republic | Guatemala |
| United Kingdom | Slovak Republic | Indonesia | Venezuela |
| Qatar | Estonia | Jamaica | Mali |
| Tanzania | United States | Mozambique | Burundi |
| Cameroon | Switzerland | Timor-Leste | South Africa |
| Sweden | New Zealand | Bosnia and Herzegovina | Côte d’Ivoire |
| Switzerland | Ireland | Burkina Faso | Iran, Islamic Rep. |
| Malawi | Denmark | Italy | Trinidad and Tobago |
| Uganda | Israel | Zimbabwe | Tanzania |
| Guatemala | Norway | China | United Arab Emirates |
| Philippines | Sweden | Colombia | Cameroon |
| Sri Lanka | Greece | Mexico | Bhutan |
| Tajikistan | Iceland | Germany | Kuwait |


References
- Perry, K.K. Innovation, institutions and development: A critical review and grounded heterodox economic analysis of late-industrialising contexts. Camb. J. Econ. 2019, 44, 391–415. [Google Scholar] [CrossRef]
- Stiglitz, J.E. Competition and competitiveness in a new economy. In Competition and Competitiveness in a New Economy; Austrian Federal Ministry for Economic Affairs and Labour Economic Policy Center: Vienna, Austria, 2002; pp. 11–22. [Google Scholar]
- Zizek, S. The Parallax View; The MIT Press: Cambridge, MA, USA, 2006. [Google Scholar]
- van Vuuren, D.P.; Zimm, C.; Busch, S.; Kriegler, E.; Leininger, J.; Messner, D.; Nakicenovic, N.; Rockstrom, J.; Riahi, K.; Sperling, F.; et al. Defining a sustainable development target space for 2030 and 2050. One Earth 2022, 5, 142–156. [Google Scholar] [CrossRef]
- Pianta, S.; Brutschin, E. Emissions Lock-in, Capacity, and Public Opinion: How Insights From Political Science Can Inform Climate Modeling Efforts. Politics Gov. 2022, 10, 186–199. [Google Scholar] [CrossRef]
- Rosile, G.A.; Boje, D.M.; Carlon, D.M.; Downs, A.; Saylors, R. Storytelling Diamond. Organ. Res. Methods 2013, 16, 557–580. [Google Scholar] [CrossRef]
- Gore, C. The Rise and Fall of the Washington Consensus as a Paradigm for Developing Countries. World Dev. 2000, 28, 789–804. [Google Scholar] [CrossRef]
- Rodrik, D. What do trade agreements really do? J. Econ. Perspect. 2018, 32, 73–90. [Google Scholar] [CrossRef]
- Arrighi, G.; Zhang, L. Beyond the Washington consensus: A new Bandung? Globalization and beyond: New Examinations of Global Power and Its Alternatives; The Pennsylvania State University Press: University Park, PA, USA, 2011; pp. 25–57. [Google Scholar]
- Ravetz, J.R. Post-Normal Science and the complexity of transitions towards sustainability. Ecol. Complex. 2006, 3, 275–284. [Google Scholar] [CrossRef]
- Latour, B. One more turn after the social turn: Easing science studies into the non-modern world. Soc. Dimens. Sci. 1992, 292, 272–294. [Google Scholar]
- Peneder, M. Competitiveness and industrial policy: From rationalities of failure towards the ability to evolve. Camb. J. Econ. 2016, 41, 829–858. [Google Scholar] [CrossRef]
- Khan, Z.; Abraham, E.; Aggarwal, S.; Khan, M.A.; Arguello, R.; Babbar-Sebens, M.; Bereslawski, J.L.; Bielicki, J.M.; Campana, P.E.; Carrazzone, M.E.S.; et al. Emerging Themes and Future Directions of Multi-Sector Nexus Research and Implementation. Front. Environ. Sci. 2022, 10, 918085. [Google Scholar] [CrossRef]
- Hoffmann, R.; Wiederkehr, C.; Dimitrova, A.; Hermans, K. Agricultural livelihoods, adaptation, and environmental migration in sub-Saharan drylands: A meta-analytical review. Environ. Res. Lett. 2022, 17, 083003. [Google Scholar] [CrossRef]
- Brutschin, E.; Andrijevic, M. Why Ambitious and Just Climate Mitigation Needs Political Science. Politics Gov. 2022, 10, 167–170. [Google Scholar] [CrossRef]
- Koehler, G.; Kühner, S.; Neff, D. Social policy development and its obstacles: An analysis of the South Asian welfare geography during and after the social turn. In Handbook of Development Policy; Edward Elgar Publishing: Cheltenham, UK, 2021. [Google Scholar] [CrossRef]
- West, W.; Jamila Haider, L.; Stålhammar, S.; Woroniecki, S. A relational turn for sustainability science? Relational thinking, leverage points and transformations. Ecosyst. People 2020, 16, 304–325. [Google Scholar] [CrossRef]
- Ellis, B.J.; Figueredo, A.J.; Brumbach, B.H.; Schlomer, G.L. Fundamental Dimensions of Environmental Risk. Hum. Nat. 2009, 20, 204–268. [Google Scholar] [CrossRef]
- Kuhn, T.S. The Structure of Scientific Revolutions, 3rd ed.; University of Chicago Press: Chicago, IL, USA, 1996. [Google Scholar]
- Sato, R. The Harrod-Domar Model vs the Neo-Classical Growth Model. Econ. J. 1964, 74, 380. [Google Scholar] [CrossRef]
- Solow, R.M. Perspectives on Growth Theory. J. Econ. Perspect. 1994, 8, 45–54. [Google Scholar] [CrossRef]
- Kanbur, R. The Co-Evolution of the Washington Consensus and the Economic Development Discourse. Macalester Int. 2009, 24, 8. [Google Scholar]
- Acemoglu, D.; Gallego, F.A.; Robinson, J.A. Institutions, human capital, and development. Annu. Rev. Econ. 2014, 6, 875–912. [Google Scholar] [CrossRef]
- Street, J.H. The Institutionalist Theory of Economic Development. J. Econ. Issues 1987, 21, 1861–1887. [Google Scholar] [CrossRef]
- Munir, K.A. Challenging Institutional Theory’s Critical Credentials. Organ. Theory 2019, 1, 2631787719887975. [Google Scholar] [CrossRef]
- Lebaron, F. Pierre Bourdieu: Economic models against economicism. Theory Soc. 2003, 32, 551–565. [Google Scholar] [CrossRef]
- Syll, L. The Main Reason Why Almost All Econometric Models Are Wrong. World Economics Association Commentaries, 8 June 2018. 2018. Available online: https://www.worldeconomicsassociation.org/newsletterarticles/econometric-models-wrong/ (accessed on 24 June 2022).
- Mardani, A.; Kannan, D.; Hooker, R.E.; Ozkul, S.; Alrasheedi, M.; Tirkolaee, E.B. Evaluation of green and sustainable supply chain management using structural equation modelling: A systematic review of the state of the art literature and recommendations for future research. J. Clean. Prod. 2019, 249, 119383. [Google Scholar] [CrossRef]
- Mardani, A.; Zavadskas, E.K.; Streimikiene, D.; Jusoh, A.; Khoshnoudi, M. A comprehensive review of data envel-opment analysis (DEA) approach in energy efficiency. Renew. Sustain. Energy Rev. 2017, 70, 1298–1322. [Google Scholar] [CrossRef]
- Ramos, G.; Hynes, W. Beyond Growth: Towards a New Economic Approach. OECD, General Secretariat. 2019. Available online: https://www.oecd.org/naec/averting-systemic-collapse/SG-NAEC(2019)3_Beyond%20Growth.pdf (accessed on 3 September 2022).
- Ghag, N.; Acharya, P.; Khanapuri, V. Prioritizing the Challenges Faced in Achieving International Competitiveness by Export-Oriented Indian SMEs: A DEMATEL Approach. Int. J. Glob. Bus. Compet. 2022, 17, 12–24. [Google Scholar] [CrossRef]
- Kowal, J.; Paliwoda-Pękosz, G. ICT for Global Competitiveness and Economic Growth in Emerging Economies: Economic, Cultural, and Social Innovations for Human Capital in Transition Economies. Inf. Syst. Manag. 2017, 34, 304–307. [Google Scholar] [CrossRef]
- Wojewódzka-Wiewiórska, A.; Kłoczko-Gajewska, A.; Sulewski, P. Between the Social and Economic Dimensions of Sustainability in Rural Areas—In Search of Farmers’ Quality of Life. Sustainability 2019, 12, 148. [Google Scholar] [CrossRef]
- Pawłowski, A. How many dimensions does sustainable development have? Sustain. Dev. 2008, 16, 81–90. [Google Scholar] [CrossRef]
- Alam, M.S.; Kabir, N. Economic growth and environmental sustainability: Empirical evidence from East and South-East Asia. Int. J. Econ. Financ. 2013, 5, 86–97. [Google Scholar] [CrossRef]
- Cebula, R.J. Which economic freedoms influence per capita real income? Appl. Econ. Lett. 2013, 20, 368–372. [Google Scholar] [CrossRef]
- Ekins, P. Economic Growth and Environmental Sustainability: The Prospects for Green Growth; Routledge: London, UK, 2002. [Google Scholar]
- Chai, J.; Hao, Y.; Wu, H.; Yang, Y. Do constraints created by economic growth targets benefit sustainable development? Evidence from China. Bus. Strat. Environ. 2021, 30, 4188–4205. [Google Scholar] [CrossRef]
- Sachs, J.D.; Schmidt-Traub, G.; Mazzucato, M.; Messner, D.; Nakicenovic, N.; Rockström, J. Six Transformations to achieve the Sustainable Development Goals. Nat. Sustain. 2019, 2, 805–814. [Google Scholar] [CrossRef]
- Albright, A.; Bundy, D.A.P. The Global Partnership for Education: Forging a stronger partnership between health and education sectors to achieve the Sustainable Development Goals. Lancet Child Adolesc. Health 2018, 2, 473–474. [Google Scholar] [CrossRef]
- Adebiyi, M.A.; Oladele, O. Public Education Expenditure and Defense Spending in Nigeria: An Empirical Investigation. 2005. Available online: http//www.saga.cornell.educ/saga/educconf/adebiyi.pdf (accessed on 10 February 2010).
- Bende-Nabende, A. Globalisation, FDI, Regional Integration and Sustainable Development: Theory, Evidence, and Policy; Routledge: London, UK, 2017. [Google Scholar]
- Bečić, E.; Mulej, E.M.; Švarc, J. Measuring Social Progress by Sustainable Development Indicators: Cases of Croatia and Slovenia. Proc.-Soc. Behav. Sci. 2012, 37, 458–465. [Google Scholar] [CrossRef]
- de Angelis, E.M.; Di Giacomo, M.; Vannoni, D. Climate Change and Economic Growth: The Role of Environmental Policy Stringency. Sustainability 2019, 11, 2273. [Google Scholar] [CrossRef]
- Gupta, J. Global Sustainable Development Governance: Institutional Challenges from a Theoretical Perspective. Int. Environ. Agreem. 2002, 2, 361–388. [Google Scholar] [CrossRef]
- Malmo¨ Declaration, Malmo¨ Ministerial Declaration, adopted by the Global Ministerial Environment Forum—Sixth Special Session of the Governing Council of the United Nations Environment Programme, Fifth Plenary Meeting, 31 May 2000; 2000; Volume 31. Available online: www.unep.org/malmo/malmo2.pdf (accessed on 21 July 2021).
- Frey, B.S.; Luechinger, S.; Stutzer, A. The Life Satisfaction Approach to Environmental Valuation. Annu. Rev. Resour. Econ. 2010, 2, 139–160. [Google Scholar] [CrossRef]
- Ortiz-Ospina, E.; Roser, M. “Happiness and Life Satisfaction”. Published online at Our World in Data.org. 2013. Available online: https://ourworldindata.org/happiness-and-life-satisfaction (accessed on 21 August 2022).
- Duffy, B. The Perils of Perception: Why We’re Wrong About Nearly Everything; Atlantic Books: London, UK, 2018. [Google Scholar]
- Petrunyk, I.; Pfeifer, C. Life satisfaction in Germany after reunification: Additional insights on the pattern of conver-gence. Jahrbücher Natl. Stat. 2016, 236, 217–239. [Google Scholar] [CrossRef]
- Stevenson, B.; Wolfers, J. Happiness Inequality in the United States. J. Leg. Stud. 2008, 37, S33–S79. [Google Scholar] [CrossRef]
- Diener, E.; Diener, M. Cross-Cultural Correlates of Life Satisfaction and Self-Esteem. In Culture and Well-Being; Springer: Dordrecht, The Netherlands, 2009; pp. 71–91. [Google Scholar] [CrossRef]
- Clark, A.E.; Flèche, S.; Senik, C. Economic Growth Evens Out Happiness: Evidence from Six Surveys. Rev. Income Wealth 2015, 62, 405–419. [Google Scholar] [CrossRef] [PubMed]
- Fosfuri, A.; Motta, M.; Rønde, T. Foreign direct investment and spillovers through workers’ mobility. J. Int. Econ. 2001, 53, 205–222. [Google Scholar] [CrossRef]
- Khan, S.; Mehboob, F. Impact of FDI on GDP: An Analysis of Global Economy on Production Function. Available online: https://mpra.ub.uni-muenchen.de/55352/ (accessed on 16 January 2022).
- Fernandez, M.; Alnuaimi, A.A.A.A.; Joseph, R. FDI Environment in China: A Critical Analysis. Int. J. Financ. Res. 2020, 11, 238. [Google Scholar] [CrossRef]
- Anh, N.T.N.; Huong, M.N.L. Impacts of Foreign Direct Investment on Vietnam’s Economy in a Relation to Natural Environment. Socio-Econ. Environ. Issues Dev. 2019, 977. [Google Scholar]
- Kumar, N. Globalization, Foreign Direct Investment and Technology Transfers; Taylor & Francis: Abingdon, UK, 1998. [Google Scholar]
- Cooper, R.N.; Moran, T.H. Foreign Direct Investment and Development: The New Policy Agenda for Developing Countries and Economies in Transition. Foreign Aff. 1999, 78, 166. [Google Scholar] [CrossRef]
- Glass, A.J.; Saggi, K. Multinational Firms and Technology Transfer. Scand. J. Econ. 2002, 104, 495–513. [Google Scholar] [CrossRef]
- Balasubramanyam, V.N.; Salisu, M.; Sapsford, D. Foreign direct investment and growth in E.P. and I.S. countries. Econ. J. 1996, 106, 92–105. [Google Scholar] [CrossRef]
- Borensztein, E.; De Gregorio, J.; Lee, J.W. How does foreign direct investment affect economic growth? J. Int. Econ. 1998, 45, 115–135. [Google Scholar] [CrossRef]
- Alguacil, M.T.; Cuadros, A.; Orts, V. Foreign direct investment, exports and domestic performance in Mexico: A causality analysis. Econ. Lett. 2002, 77, 371–376. [Google Scholar] [CrossRef]
- Liu, X.; Burridge, P.; Sinclair, P.J. Relationships between economic growth, foreign direct investment, and trade: Evidence from China. Appl. Econ. 2002, 34, 1433–1440. [Google Scholar] [CrossRef]
- Delevic, U.; Heim, I. Institutions in transition: Is the E.U. integration process relevant for inward FDI in transition European economies? Eurasian J. Econ. Financ. 2017, 5, 16–32. [Google Scholar] [CrossRef]
- Kok, R.; Ersoy, B.A. Analyses of FDI determinants in developing countries. Int. J. Soc. Econ. 2009, 36, 105–123. [Google Scholar] [CrossRef]
- Akkemik, K.A. Industrial Development in East Asia: A Comparative Look at Japan, Korea, Taiwan, And Singapore (With Cd-rom); World Scientific: Singapore, 2008; Volume 3. [Google Scholar]
- Görg, H.; Greenaway, D. Much ado about nothing? Do domestic firms really benefit from foreign direct investment? World Bank Res. Obs. 2004, 19, 171–197. [Google Scholar] [CrossRef]
- Wooster, R.B.; Diebel, D.S. Productivity Spillovers from Foreign Direct Investment in Developing Countries: A Meta-Regression Analysis. Rev. Dev. Econ. 2010, 14, 640–655. [Google Scholar] [CrossRef]
- Bwalya, S.M. Foreign direct investment and technology spillovers: Evidence from panel data analysis of manufacturing firms in Zambia. J. Dev. Econ. 2006, 81, 514–526. [Google Scholar] [CrossRef]
- Gorg, H.; Strobl, E. Multinational companies and productivity spillovers: A meta-analysis. Econ. J. 2001, 111, F723–F739. [Google Scholar] [CrossRef]
- Javorcik, B.S.; Spatareanu, M. To share or not to share: Does local participation matter for spillovers from foreign direct investment? J. Dev. Econ. 2008, 85, 194–217. [Google Scholar] [CrossRef]
- Kugler, M. Spillovers from foreign direct investment: Within or between industries? J. Dev. Econ. 2006, 80, 444–477. [Google Scholar] [CrossRef]
- Sjöholm, F. Productivity Growth in Indonesia: The Role of Regional Characteristics and Direct Foreign Investment. Econ. Dev. Cult. Chang. 1999, 47, 559–584. [Google Scholar] [CrossRef]
- Smeets, R. Collecting the Pieces of the FDI Knowledge Spillovers Puzzle. World Bank Res. Obs. 2008, 23, 107–138. [Google Scholar] [CrossRef]
- Xu, X.; Sheng, Y. Productivity Spillovers from Foreign Direct Investment: Firm-Level Evidence from China. World Dev. 2012, 40, 62–74. [Google Scholar] [CrossRef]
- Dunning, J.H. Trade, Location of Economic Activity and the MNE: A Search for an Eclectic Approach. In The International Allocation of Economic Activity; Palgrave Macmillan: London, UK, 1977; pp. 395–418. [Google Scholar]
- Dunning, J.H. Globalization and the new geography of foreign direct investment. Oxf. Dev. Stud. 1998, 26, 47–69. [Google Scholar] [CrossRef]
- Pradhan, J.P. The evolution of Indian Outward Foreign Direct Investment: Changing trends and patterns. Int. J. Technol. Glob. 2008, 4, 70. [Google Scholar] [CrossRef]
- Sauvant, K.P. China: Inward and Outward Foreign Direct Investment. Transnatl. Corp. Rev. 2011, 3, 1–4. [Google Scholar] [CrossRef]
- Sauvant, K.P.; Mallampally, P.; McAllister, G.; Xian, G.; Bellak, C.; Mayer, S.; De Beule, F.; Van Den Bulcke, D.D.; Bitzenis, A.P.; Acharya, R.C.; et al. Inward and Outward FDI Country Profiles; Vale Columbia Center on Sustainable International Investment: New York, NY, USA, 2013. [Google Scholar]
- Buckley, P.J.; Casson, M. A long-run theory of multinational enterprise. In The Future of the Multinational Enterprise; Palgrave Macmillan: London, UK, 1976; pp. 32–65. [Google Scholar]
- Irandoust, J.E.M. On the causality between foreign direct investment and output: A comparative study. Int. Trade J. 2001, 15, 1–26. [Google Scholar] [CrossRef]
- de Vita, G.; Kyaw, K.S. Growth effects of FDI and portfolio investment flows to developing countries: A disaggregated analysis by income levels. Appl. Econ. Lett. 2009, 16, 277–283. [Google Scholar] [CrossRef]
- Lensink, R.; Morrissey, O. Foreign direct investment: Flows, volatility, and the impact on growth. Rev. Int. Econ. 2006, 14, 478–493. [Google Scholar] [CrossRef]
- Al-Sadiq, M.A.J. Outward foreign direct investment and domestic investment: The case of developing countries. Int. Monet. Fund 2013. [Google Scholar] [CrossRef]
- Carkovic, M.; Levine, R. Does foreign direct investment accelerate economic growth. Does Foreign Direct Invest. Promot. Dev. 2005, 195, 220. [Google Scholar] [CrossRef]
- Blomström, M.; Kokko, A.; Mucchielli, J.L. The economics of foreign direct investment incentives. In Foreign Direct Investment in The Real and Financial Sector of Industrial Countries; Springer: Berlin/Heidelberg, Germany, 2003; pp. 37–60. [Google Scholar]
- Wei, S.-J. Open Door Policy and China’s Rapid Growth: Evidence from City-level Data. Growth Theor. Light East Asian Exp. 1995, 4, 73–104. [Google Scholar] [CrossRef]
- Dees, S. Foreign Direct Investment in China: Determinants and Effects. Econ. Chang. Restruct. 1998, 31, 175–194. [Google Scholar] [CrossRef]
- Wells, L.T. Third World Multinationals: The Rise of Foreign Investments from Developing Countries; MIT Press: Cambridge, MA, USA, 1983. [Google Scholar]
- Buckley, P.J.; Clegg, J.; Wang, C. The Impact of Inward FDI on the Performance of Chinese Manufacturing Firms. J. Int. Bus. Stud. 2002, 33, 637–655. [Google Scholar] [CrossRef]
- Javorcik, B.S. Does Foreign Direct Investment Increase the Productivity of Domestic Firms? In Search of Spillovers Through Backward Linkages. Am. Econ. Rev. 2004, 94, 605–627. [Google Scholar] [CrossRef]
- Dasgupta, N. Examining the Long Run Effects of Export, Import and FDI Inflows on the FDI Outflows from India: A Causality Analysis. J. Int. Bus. Econ. 2009, 10, 65–88. [Google Scholar] [CrossRef]
- Gorynia, M.; Nowak, J.; Wolniak, R. Poland’s investment development path and industry structure of FDI inflows and outflows. J. East-West Bus. 2008, 14, 189–212. [Google Scholar] [CrossRef]
- Alfaro, L.; Chanda, A.; Kalemli-Ozcan, S.; Sayek, S. Does foreign direct investment promote growth? Exploring the role of financial markets on linkages. J. Dev. Econ. 2010, 91, 242–256. [Google Scholar] [CrossRef]
- Vasa, L.; Angeloska, A. Foreign direct investment in the Republic of Serbia: Correlation between foreign direct in-vestments and the selected economic variables. J. Int. Stud. 2020, 13, 170–183. [Google Scholar] [CrossRef]
- Markusen, J.R.; Venables, A.J. Foreign direct investment as a catalyst for industrial development. Eur. Econ. Rev. 1999, 43, 335–356. [Google Scholar] [CrossRef]
- Lin, P.; Liu, Z.; Zhang, Y. Do Chinese domestic firms benefit from FDI inflow? Evidence of horizontal and vertical spillovers. China Econ. Rev. 2009, 20, 677–691. [Google Scholar] [CrossRef]
- Marcin, K. How does FDI inflow affect productivity of domestic firms? The role of horizontal and vertical spillovers, absorptive capacity and competition. J. Int. Trade Econ. Dev. 2008, 17, 155–173. [Google Scholar] [CrossRef]
- Rodriguez-Clare, A. Multinationals, linkages, and economic development. Am. Econ. Rev. 1996, 86, 852–873. [Google Scholar]
- World Bank Database. 2019. Available online: https://databank.worldbank.org/source/sustainable-development-goals-(sdgs) (accessed on 28 January 2021).
- Selim, S. Life Satisfaction and Happiness in Turkey. Soc. Indic. Res. 2007, 88, 531–562. [Google Scholar] [CrossRef]
- Helliwell, J.F.; Huang, H.; Wang, S. Changing world happiness. World Happiness Rep. 2019, 2019, 11–46. [Google Scholar]
- The Heritage Foundation. (2021a). Business Freedom. Business Freedom Index: Regulations on Starting & Operating a Business. 2021. Available online: https://www.heritage.org/index/business-freedom (accessed on 11 February 2022).
- The Heritage Foundation. (2021b). The 12 Economic Freedoms: Policies for Lasting Progress and Prosperity. Business Freedom Index: Regulations on Starting & Operating a Business. Available online: https://www.heritage.org/index/pdf/2022/book/02_2022_IndexofEconomicFreedom_12-ECONOMIC-FREEDOMS.pdf (accessed on 23 December 2021).
- World Economic Forum. Introduction. Global Competitiveness Index 2017–2018. 2018. Available online: http://reports.weforum.org/global-competitiveness-index-2017-2018/introduction/ (accessed on 28 February 2022).
- Dima, A.M.; Begu, L.; Vasilescu, M.D.; Maassen, M.A. The Relationship between the Knowledge Economy and Global Competitiveness in the European Union. Sustainability 2018, 10, 1706. [Google Scholar] [CrossRef]
- Bowen, H.P.; Moesen, W. Composite competitiveness indicators with endogenous versus predetermined weights: An application to the World Economic Forum’s global competitiveness index. Compet. Rev. 2011, 21, 129–151. [Google Scholar] [CrossRef]
- Bucher, S. The Global Competitiveness Index As an Indicator of Sustainable Development. Her. Russ. Acad. Sci. 2018, 88, 44–57. [Google Scholar] [CrossRef]
- Stiglitz, J.E.; Sen, A.; Fitoussi, J.P. Mismeasuring Our Lives: Why GDP Doesn’t Add Up; The New Press: New York, NY, USA, 2010. [Google Scholar]
- World Economic Forum. Global Competitiveness Report 2019: How to End a Lost Decade of Productivity Growth? 2019. Available online: https://www.weforum.org/reports/how-to-end-a-decade-of-lost-productivity-growth/ (accessed on 16 March 2022).
- World Bank Group. Bhutan Development Report, January 2019: A Path to Inclusive and Sustainable Development; World Bank Group: Washington, DC, USA, 2019. [Google Scholar]
- McLeod, S. What Does a Box Plot Tell You? Simply Psychology. 2020. Available online: https://www.simplypsychology.org/boxplots.html (accessed on 27 November 2022).
- Kock, N. Common Method Bias: A Full Collinearity Assessment Method for PLS-SEM. In Partial Least Squares Path Modeling; Springer: Cham, Switzerland, 2017; pp. 245–257. [Google Scholar]
- Kock, N. Common method bias in PLS-SEM: A full collinearity assessment approach. Int. J. E-Collab. (IJEC) 2015, 11, 1–10. [Google Scholar] [CrossRef]
- Tenenhaus, M.; Amato, S.; Esposito Vinzi, V. A global goodness-of-fit index for PLS structural equation modelling. In Proceedings of the XLII SIS Scientific Meeting; CLEUP: Padova, Italy, 2004; Volume 1, pp. 739–742. [Google Scholar]
- Hayes, T. R-squared change in structural equation models with latent variables and missing data. Behav. Res. Methods 2021, 53, 2127–2157. [Google Scholar] [CrossRef] [PubMed]
- Glass, L.-M.; Newig, J. Governance for achieving the Sustainable Development Goals: How important are participation, policy coherence, reflexivity, adaptation and democratic institutions? Earth Syst. Gov. 2019, 2, 100031. [Google Scholar] [CrossRef]
- Olawumi, T.O.; Chan, D.W. A scientometric review of global research on sustainability and sustainable development. J. Clean. Prod. 2018, 183, 231–250. [Google Scholar] [CrossRef]
- Kinda, S. Democratic Institutions and Environmental Quality: Effects and Transmission Channels. 2011. Available online: https://www.econstor.eu/bitstream/10419/48347/1/46_kinda.pdf (accessed on 19 February 2022).
- Kulin, J.; Sevä, I.J. The Role of Government in Protecting the Environment: Quality of Government and the Translation of Normative Views about Government Responsibility into Spending Preferences. Int. J. Sociol. 2019, 49, 110–129. [Google Scholar] [CrossRef]
- Stringham, E.P.; Levendis, J. The relationship between economic freedom and homicide. In Economic Freedom of the World: Annual Report; Gwartney, J.D., Hall, J.C., Lawson, R., Eds.; Fraser Institute: Vancouver, BC, Canada, 2010; pp. 203–217. [Google Scholar]
- Hockett, R. The Macroprudential Turn: From Institutional Safety and Soundness to Systematic Financial Stability in Financial Supervision. Va. L. Bus. Rev. 2014, 9, 201. [Google Scholar] [CrossRef]
- Ferrara, A.R.; Nisticò, R. Does Institutional Quality Matter for Multidimensional Well-Being Inequalities? Insights from Italy. Soc. Indic. Res. 2019, 145, 1063–1105. [Google Scholar] [CrossRef]
- Tiwari, A.K.; Mutascu, M. The relationship between environmental degradation and happiness in 23 developed contemporary economies. Manag. Environ. Qual. Int. J. 2015, 26, 301–321. [Google Scholar] [CrossRef]
- Collins, M.; Knutti, R.; Arblaster, J.; Dufresne, J.L.; Fichefet, T.; Friedlingstein, P.; Gao, X.; Gutowski, W.J.; Johns, T.; Krinner, G.; et al. Long-term climate change: Projections, commitments, and irreversibility. In Climate Change 2013-The Physical Science Basis: Contribution of Working Group I to the Fifth Assessment Report of the Intergovernmental Panel on Climate Change; Cambridge University Press: Cambridge, UK, 2013; pp. 1029–1136. [Google Scholar]
- Williams, J. Addressing the Completion Challenge in Portuguese Higher Education; M-RCBG Associate Working Paper Series 8; Mossavar-Rahmani Center for Business & Government, Harvard Kennedy School: Cambridge, MA, USA, 2017. [Google Scholar]
- Dawson, R.F.; Kearney, M.; Sullivan, J. Comprehensive Approaches to Increasing Student Completion in Higher Education: A Survey of the Landscape; No. w28046; National Bureau of Economic Research: Cambridge, MA, USA, 2020. [Google Scholar]
- Arvin, B.M.; Barillas, F.; Lew, B. Is democracy a component of donors’ foreign aid policies. In New Perspectives on Foreign Aid and Economic Development; Greenwood Publishing Group: Westport, CT, USA, 2002; pp. 171–198. [Google Scholar]
- Branden, J.B.; Bromley, D. ‘The economics of cooperation over collective bads’. J. Environ. Econ. Manag. 1981, 8, 134–150. [Google Scholar] [CrossRef]
- Khan, S.A.R.; Sharif, A.; Golpîra, H.; Kumar, A. A green ideology in Asian emerging economies: From environmental policy and sustainable development. Sustain. Dev. 2019, 27, 1063–1075. [Google Scholar] [CrossRef]
- Islam, R. The Role of Macro-Economic Variables for Determining Happiness: The Empirical Evidence from South Asian Region. 2017. Available online: http://dspace.uiu.ac.bd/handle/52243/810?show=full (accessed on 14 March 2022).
- Childs, A.; Tenzin, W.; Johnson, D.; Ramachandran, K. Science Education in Bhutan: Issues and challenges. Int. J. Sci. Educ. 2012, 34, 375–400. [Google Scholar] [CrossRef]
- Adhikari, C.; Yadav, R.K.; Timilshina, P.; Ojha, R.; Gaire, D.; Ghimire, A. Proportion and factors affecting for post-natal care utilization in developing countries: A systematic review. J. Manmohan Mem. Inst. Heal. Sci. 2016, 2, 14–19. [Google Scholar] [CrossRef]
- Tobgay, T.; Dophu, U.; Torres, C.; Bangchang, N. Health and Gross National Happiness: Review of current status in Bhutan. J. Multidiscip. Healthc. 2011, 4, 293–298. [Google Scholar] [CrossRef]
- Weiffen, B. The Cultural-Economic Syndrome: Impediments to Democracy in the Middle East. Comp. Sociol. 2004, 3, 353–375. [Google Scholar] [CrossRef]
- Ramzi, S.; Afonso, A.; Ayadi, M. Assessment of efficiency in basic and secondary education in Tunisia: A regional analysis. Int. J. Educ. Dev. 2016, 51, 62–76. [Google Scholar] [CrossRef]
- Gaaloul, N. Water resources and management in Tunisia. Int. J. Water 2011, 6, 92. [Google Scholar] [CrossRef]
- Graham, C.; Felton, A. Does Inequality Matter to Individual Welfare? An Initial Exploration Based on Happiness Surveys from Latin America. In Happiness, Economics and Politics; Edward Elgar Publishing: Cheltenham, UK, 2009. [Google Scholar]
- Wolff, L.; Schiefelbein, E.; Schiefelbein, P. ͞Primary Education in Latin America. The Unfinished Agenda; Technical Paper Series N° EDU-120; Interamerican Development Bank: Washington, DC, USA, 2002. [Google Scholar]
- Psacharopoulos, G.; Ng, Y.C. Earnings and Education in Latin America. Educ. Econ. 1994, 2, 187–207. [Google Scholar] [CrossRef]
- Montenegro, R.A.; Stephens, C. Indigenous health in Latin America and the Caribbean. Lancet 2006, 367, 1859–1869. [Google Scholar] [CrossRef] [PubMed]
- Mascayano, F.; Irrazabal, M.; Emilia, W.D.; Vaner, S.J.; Sapag, J.C.; Alvarado, R.; Yang, L.H.; Sinah, B. Suicide in Latin America: A growing public health issue. Rev. Fac. Cien. Med. Univ. Nac. Cordoba 2015, 72, 259–303. [Google Scholar]
- Briceño-León, R. Urban violence and public health in Latin America: A sociological explanatory framework. Cad. de Saúde Públic 2005, 21, 1629–1648. [Google Scholar] [CrossRef]
- Shelley, T. Oil: Politics, Poverty, and the Planet; Zed Books: London, UK, 2005. [Google Scholar]
- Kravdal, Ø. Education and fertility in sub-Saharan africa: Individual and community effects. Demography 2002, 39, 233–250. [Google Scholar] [CrossRef]
- Deaton, A. Income, Health, and Well-Being around the World: Evidence from the Gallup World Poll. J. Econ. Perspect. 2008, 22, 53–72. [Google Scholar] [CrossRef]
- Amavilah, V.; Asongu, S.A.; Andrés, A.R. Effects of globalization on peace and stability: Implications for governance and the knowledge economy of African countries. Technol. Forecast. Soc. Chang. 2017, 122, 91–103. [Google Scholar] [CrossRef]
- Millennium Ecosystem Assessment. Ecosystems and Human Well-Being; Island press: Washington, DC, USA, 2005; Volume 5, p. 563. [Google Scholar]
- Matlosa, K. Pondering the culture of violence in Lesotho: A case for demilitarisation. J. Contemp. Afr. Stud. 2020, 38, 381–398. [Google Scholar] [CrossRef]
- Mwangi, O.G. Hydropolitics, Ecocide and Human Security in Lesotho: A Case Study of the Lesotho Highlands Water Project. J. South. Afr. Stud. 2007, 33, 3–17. [Google Scholar] [CrossRef]
- De Villiers, G.D.T. South Africa’s water resources and the Lesotho highlands water scheme: A partial solution to the country’s water problems. Int. J. Water Resour. Dev. 1996, 12, 65–78. [Google Scholar] [CrossRef]
- Letcher, T.M. Global warmingda complex situation. In Climate Change: Observed Impacts on Planet Earth, 2; Elsevier Science: Amsterdam, The Netherlands, 2021. [Google Scholar]
- Aumeerally, N.; Chen-Carrel, A.; Coleman, P.T. Learning with Peaceful, Heterogeneous Communities: Lessons on Sustaining Peace in Mauritius. Peace Confl. Stud. 2022, 28, 3. [Google Scholar]
- Baker, M. Poverty, Social Assistance, and the Employability of Mothers in Four Commonwealth Countries. In Women’s Work is Never Done; Routledge: London, UK, 2013; pp. 87–112. [Google Scholar]
- M’Cormack-Hale, F.A.; M’Cormack-Hale, F.A.O. Gender, Peace, and Security: Women’s Advocacy and Conflict Resolution; Commonwealth Secretariat: London, UK, 2012.
- Lu, W.; Kasimov, I.; Karimov, I.; Abdullaev, Y. Foreign Direct Investment, Natural Resources, Economic Freedom, and Sea-Access: Evidence from the Commonwealth of Independent States. Sustainability 2020, 12, 3135. [Google Scholar] [CrossRef]


| “Social-turn 1” models | Model 1 | Model 2 | Model 3 | Model 4 | Model 5 | Model 6 |
| 0.379 | 0.367 | 0.325 | 0.430 | 0.321 | 0.373 | |
| “Social-turn 2” models | Model 7 | Model 8 | Model 8 | Model 10 | Model 11 | Model 12 |
| 0.569 | 0.551 | 0.519 | 0.497 | 0.399 | 0.387 |
| Model 4 | Model 7 | Model 13 | Model 14 | |
|---|---|---|---|---|
| Average path coefficient (APC) | 0.251, p < 0.001 | 0.186, p < 0.001 | 0.225, p < 0.001 | 0.170, p < 0.001 |
| Average adjusted R-squared (AARS) | 0.430, p < 0.001 | 0.569, p < 0.001 | 0.409, p < 0.001 | 0.478, p < 0.001 |
| Average full collinearity VIF (AFVIF) | 3.598 | 3.598 | 3.421 | 3.421 |
| Tenenhaus GoF (GoF) | 0.510 | 0.560 | 0.511 | 0.552 |
| R-squared contribution ratio (RSCR) | 0.953 | 0.987 | 0.953 | 0.985 |
| People | Prosperity | Planet | Resources | Peace | Financial Enhancers | Institutional Enhancers | GC-Ins | GC-InnS | FDI In-Flow | FDI Out-Flow | |
|---|---|---|---|---|---|---|---|---|---|---|---|
| People | (0.651) | ||||||||||
| Prosperity | 0.588 | (0.542) | |||||||||
| Planet | 0.220 | 0.181 | (0.623) | ||||||||
| Resources | 0.523 | 0.627 | 0.437 | (0.808) | |||||||
| Peace | 0.423 | 0.468 | 0.244 | 0.362 | (0.802) | ||||||
| Financial Enhancers | 0.501 | 0.668 | 0.111 | 0.509 | 0.451 | (0.774) | |||||
| Institutional Enhancers | 0.547 | 0.763 | 0.236 | 0.611 | 0.628 | 0.760 | (0.818) | ||||
| GC-Ins | 0.462 | 0.602 | 0.269 | 0.534 | 0.600 | 0.626 | 0.814 | (0.889) | |||
| GC-InnS | 0.475 | 0.702 | 0.240 | 0.562 | 0.574 | 0.575 | 0.798 | 0.890 | (0.980) | ||
| FDI In-flow | 0.203 | 0.198 | 0.135 | 0.224 | 0.225 | 0.242 | 0.296 | 0.313 | 0.316 | (0.770) | |
| FDI Out-flow | 0.243 | 0.279 | 0.133 | 0.227 | 0.247 | 0.265 | 0.358 | 0.333 | 0.388 | 0.823 | (0.783) |
| H&LS | 0.291 | 0.405 | 0.010 | 0.376 | 0.194 | 0.369 | 0.392 | 0.343 | 0.382 | 0.147 | 0.178 |
| Relationships | Model 4 Path Coefficients Total Effects/ Total Effect Sizes | Model 7 Path Coefficients Total Effects/ Total Effect Sizes | Model 13 Path Coefficients Total Effects/ Total Effect Sizes | Model 14 Path Coefficients Total Effects/ Total Effect Sizes |
|---|---|---|---|---|
| People → GC-Ins | N/A | 0.020 0.022/0.010 | 0.372 *** 0.202/0.101 ^ | 0.020 0.222/0.10 |
| People → GC-InnS | N/A | −0.026 −0.024/0.012 | 0.596 *** 0.213/0.142 ^ | −0.164 −0.024/0.012 |
| People → H&LS | N/A | N/A | 0.029 0.029/0.008 | 0.037 0.036/0.011 |
| Prosperity → GC-Ins | N/A | 0.276 *** 0.296/0.178 ^^ | 0.530 *** 0.102/0.052 ^ | 0.276 *** 0.296/0.178 ^^ |
| Prosperity → GC-InnS | N/A | 0.440 *** 0.468/0.329 ^^ | 0.669 *** 0.678/0.426 ^^^ | 0.440 *** 0.468/0.329 ^^^ |
| Prosperity → H&LS | N/A | N/A | 0.130 *** 0.130/0.053 ^ | 0.152 *** 0.232/0.094 ^ |
| Planet → GC-Ins | N/A | −0.031 −0.030/0.008 | 0.204 *** 0.390/0.214 ^^ | −0.031 −0.030/0.008 |
| Planet → GC-InnS | N/A | −0.006 −0.006/0.001 | 0.216 *** 0.598/0.456 ^^^ | −0.006 −0.006/0.001 |
| Planet → H&LS | N/A | N/A | 0.153 *** 0.153/0.002 | 0.054 * 0.051/0.011 |
| Resources → GC-Ins | N/A | 0.177 *** 0.185/0.099 ^ | 0.101 *** 0.534/0.326 ^^ | 0.177 *** 0.185/0.099 ^ |
| Resources → GC-InnS | N/A | 0.159 *** 0.170/0.095 ^ | 0.066 *** 0.678/0.426 ^^^ | 0.159 *** 0.170/0.095 ^^ |
| Resources → H&LS | N/A | N/A | 0.241 *** 0.241/0.091 ^ | 0.189 *** 0.224/0.092 ^ |
| Peace → GC-Ins | N/A | 0.359 *** 0.373/0.223 ^^ | 0.029 0.029/0.008 | 0.359 *** 0.373/0.223 ^^ |
| Peace → GC-InnS | N/A | 0.279 *** 0.299/0.171 ^^ | 0.130 *** 0.130/0.053 ^ | 0.279 *** 0.299/0.171 ^^ |
| Peace → H&LS | N/A | N/A | −0.050 * −0.050/0.010 | 0.084 *** 0.149/0.043 ^ |
| Institutional Enhancers → GC-Ins | 0.832 *** | 0.040/0.032 ^ | 0.802 *** | 0.040/0.049 ^ |
| Institutional Enhancers → GC-InnS | 0.854 *** | 0.061 */0.049 ^ | 0.854 *** | 0.061 */0.078 ^ |
| Institutional Enhancers → FDII | 0.276 ***/0.082 ^ | 0.265 *** | 0.276 ***/0.082 ^ | 0.265 *** |
| Institutional Enhancers → FDIO | 0.329 ***/0.118 ^ | 0.162 *** | 0.329 ***/0.118 ^ | 0.162 *** |
| Institutional Enhancers → People | 0.372 *** 0.390/0.214 ^^ | N/A | 0.372 *** 0.390/0.214 ^^ | N/A |
| Institutional Enhancers → Prosperity | 0.596 *** 0.598/0.456 ^^^ | N/A | 0.596 *** 0.598/0.456 ^^^ | N/A |
| Institutional Enhancers → Planet | −0.342 *** −0.361/0.085 ^ | N/A | −0.342 *** −0.361/0.085 ^ | N/A |
| Institutional Enhancers → Resources | 0.530 *** 0.534/0.326 ^ | N/A | 0.530 *** 0.534/0.326 ^ | N/A |
| Institutional Enhancers → Peace | 0.669 *** 0.678/0.426 ^^^ | N/A | 0.669 *** 0.678/0.426 ^^^ | N/A |
| Institutional Enhancers → H&LS | N/A | N/A | 0.134 *** 0.262/0.103 ^ | 0.011/0.004 |
| Financial Enhancers → GC-Ins | 0.016 | 0.004/0.002 | 0.016 | 0.004/0.002 |
| Financial Enhancers → GC-InnS | 0.074 * | −0.003/0.002 | −0.074 ** | −0.003/0.002 |
| Financial Enhancers → FDII | −0.011/0.003 | 0.040 | −0.011/0.003 | 0.040 |
| Financial Enhancers → FDIO | −0.034/0.009 | −0.049 * | −0.034/0.009 | −0.048 * |
| Financial Enhancers → People | 0.204 *** 0.202/0.101 ^ | N/A | 0.204 *** 0.202/0.101 ^ | N/A |
| Financial Enhancers → Prosperity | 0.216 *** 0.213/0.142 ^ | N/A | 0.216 *** 0.213/0.142 ^ | N/A |
| Financial Enhancers → Planet | 0.166 *** 0.166/0.018 | N/A | 0.166 *** 0.166/0.018 | N/A |
| Financial Enhancers → Resources | 0.101 *** 0.102/0.52 ^ | N/A | 0.101 *** 0.102/0.52 ^ | N/A |
| Financial Enhancers → Peace | −0.066 *** −0.678/0.030 ^ | N/A | −0.066 *** −0.66/0.032 ^ | N/A |
| Financial Enhancers → H&LS | N/A | N/A | 0.083 *** 0.170/0.063 ^ | −0.000/0.000 |
| FDII → GC-Ins | N/A | 0.102 *** | N/A | 0.102 *** |
| FDII → GC-InnS | N/A | −0.003 | N/A | −0.003 |
| FDII → FDIO | 0.785 *** | 0.787 *** | 0.785 *** | 0.787 *** |
| FDII → People | −0.007 | N/A | −0.007 | N/A |
| FDII → Prosperity | −0.117 *** | N/A | −0.117 *** | N/A |
| FDII → Planet | −0.089 *** | N/A | −0.089 *** | N/A |
| FDII → Resources | 0.107 *** | N/A | 0.107 *** | N/A |
| FDII → Peace | 0.070 * | N/A | 0.070 * | N/A |
| FDII → H&LS | N/A | N/A | −0.006/0.001 | 0.025/0.004 |
| FDIO → GC-Ins | N/A | 0.034 | N/A | 0.034 |
| FDIO → GC-InnS | N/A | 0.168 *** | N/A | 0.168 *** |
| FDIO → People | 0.062 * | N/A | 0.062 * | N/A |
| FDIO → Prosperity | 0.105 *** | N/A | 0.105 *** | N/A |
| FDIO → Planet | 0.019 | N/A | 0.019 | N/A |
| FDIO → Resources | −0.077 * | N/A | −0.077 * | N/A |
| FDIO → Peace | −0.033 | N/A | −0.033 | N/A |
| FDIO → H&LS | N/A | N/A | 0.001/0.000 | 0.024/0.004 |
| GC-Ins → FDII | 0.154 *** | N/A | 0.154 *** | N/A |
| GC-Ins → FDIO | −0.180 *** | N/A | −0.180 *** | N/A |
| GC-Ins → People | −0.005/0.002 | N/A | −0.005/0.002 | N/A |
| GC-Ins → Prosperity | −0.024/0.015 | N/A | −0.024/0.015 | N/A |
| GC-Ins → Planet | −0.015/0.004 | N/A | −0.015/0.004 | N/A |
| GC-Ins → Resources | 0.021/0.011 | N/A | 0.021/0.011 | N/A |
| GC-Ins → Peace | 0.013/0.008 | N/A | 0.013/0.008 | N/A |
| GC-Ins → H&LS | N/A | N/A | −0.001/0.000 | 0.071 ** |
| GC-InnS → FDII | 0.179 *** | N/A | 0.179 *** | N/A |
| GC-InnS → FDIO | 0.299 *** | N/A | 0.299 *** | N/A |
| GC-InnS → People | 0.026/0.012 | N/A | 0.026/0.012 | N/A |
| GC-InnS → Prosperity | 0.025/0.018 | N/A | 0.025/0.018 | N/A |
| GC-InnS → Planet | −0.008/0.002 | N/A | −0.008/0.002 | N/A |
| GC-InnS → Resources | −0.015/0.008 | N/A | −0.015/0.008 | N/A |
| GC-InnS → Peace | −0.002/0.001 | N/A | −0.002/0.001 | N/A |
| GC-InnS → H&LS | N/A | N/A | −0.001/0.000 | 0.125 *** |
| Relationships | Advanced Economies | Emerging and Developing Europe | Emerging and Developing Asia | Middle East, North Africa, and Pakistan | Latin America and the Caribbean | Sub-Saharan Africa | Commonwealth |
|---|---|---|---|---|---|---|---|
| Path Coeff. Total Effects/ Effect Sizes | Path Coeff. Total Effects/ Effect Sizes | Path Coeff. Total Effects/ Effect Sizes | Path Coeff. Total Effects/ Effect Sizes | Path Coeff. Total Effects/ Effect Sizes | Path Coeff. Total Effects/ Effect Sizes | Path Coeff. Total Effects/ Effect Sizes | |
| Institutional Enhancers → FDII (“Social-turn 2”) | 0.097 * | n.s. | −0.212 ** | n.s. | 0.370 *** | 0.130 * | n.s. |
| Institutional Enhancers → FDII (“Social-turn 1.2”) | 0.067 * | 0.248 ** | −0.212 ** | n.s. | 0.370 *** | n.s. | n.s. |
| Institutional Enhancers → FDIO (“Social-turn 2”) | 0.094 * | 0.211 * | 0.354 *** | 0.457 *** | 0.433 *** | 0.251 *** | n.s. |
| Institutional Enhancers → FDIO (“Social-turn 1.2”) | 0.094 * | n.s. | 0.354 *** | 0.457 *** | 0.433 *** | 0.251 *** | n.s. |
| Financial Enhancers → FDII (“Social-turn 2”) | 0.103 * | n.s. | 0.141 * | 0.142 * | n.s. | n.s. | n.s. |
| Financial Enhancers → FDII (“Social-turn 1.2”) | 0.103 * | n.s. | 0.141 * | 0.142 * | n.s. | n.s. | n.s. |
| Financial Enhancers → FDIO (“Social-turn 2”) | n.s. | n.s. | n.s. | n.s. | −0.204 *** | −0.103 * | −0.287 ** |
| Financial Enhancers → FDIO (“Social-turn 1.2”) | n.s. | n.s. | n.s. | n.s. | n.s. | −0.13 * | −0.287 ** |
| FDII → GC-Ins (“Social-turn 2”) | 0.264 *** | 0.746 *** | n.s. | n.s. | 0.444 *** | n.s. | 0.246 ** |
| FDII → GC-Ins (“Social-turn 1.2”) | 0.154 ** | 0.669 *** | n.s. | 0.158 ** | 0.318 *** | n.s. | n.s. |
| FDII → GC-InnS (“Social-turn 2”) | −0.169 *** | 0.248 ** | n.s. | n.s. | 0.480 *** | 0.118 * | n.s. |
| FDII → GC-InnS (“Social-turn 1.2”) | −0.209 *** | 0.264 ** | n.s. | 0.141 * | 0.379 *** | 0.109 * | −0.216 * |
| FDII → FDIO (“Social-turn 2”) | 0.819 *** | 0.980 *** | 0.403 *** | n.s. | 0.500 *** | 0.192 *** | 0.573 *** |
| FDII → FDIO (“Social-turn 1.2”) | 0.819 *** | 0.939 *** | 0.403 *** | n.s. | 0.500 *** | 0.192 *** | 0.573 *** |
| FDIO → GC-Ins (“Social-turn 2”) | n.s. | −0.551 *** | 0.159 * | n.s. | n.s. | n.s. | n.s. |
| FDIO → GC-Ins (“Social-turn 1.2”) | 0.085 * | −0.444 *** | 0.546 *** | 0.395 *** | 0.146 * | 0.127 * | n.s. |
| FDIO → GC-InnS (“Social-turn 2”) | 0.380 *** | n.s. | 0.227 ** | n.s. | n.s. | n.s. | 0.338 *** |
| FDIO → GC-InnS (“Social-turn 1.2”) | 0.438 *** | n.s. | 0.576 *** | 0.383 *** | 0.186 ** | 0.239 *** | 0.500 *** |
| People → GC-Ins (“Social-turn 2”) | 0.143 ** 0.147/0.055 ^ | n.s. | n.s. | 0.216 ** 0.225/0.096 ^ | 0.032 * 0.115/0.031 ^ | 0.278 *** 0.268/0.126 ^ | n.s. |
| People → GC-InnS (“Social-turn 2”) | n.s. | n.s. | n.s. | 0.315 *** 0.326/0.152 ^^ | n.s. | 0.228 *** 0.209/0.098 ^ | 0.287 *** 0.502/0.105 ^ |
| People → H&LS (“Social-turn 2”) | 0.172 *** 0.190/0.038 ^ | n.s. | n.s. | n.s. | n.s. | 0.130 *** 0.220/0.024 ^ | n.s. |
| Prosperity → GC-Ins (“Social-turn 2”) | 0.390 *** 0.398/0.280 ^^ | 0.308 *** 0.303/0.088 ^ | 0.211 *** 0.235/0.087 ^ | 0.416 *** 0.428/0.228 ^^ | n.s. | 0.394 *** 0.427/0.231 ^^ | n.s. |
| Prosperity → GC-InnS (“Social-turn 2”) | 0.596 *** 0.608/0.424 ^^^ | 0.202 * 0.096/0.041 ^ | 0.146 * 0.117/0.055 ^ | 0.411 *** 0.427/0.205 ^^ | n.s. | 0.398 *** 0.439/0.234 ^^ | n.s. |
| Prosperity → H&LS (“Social-turn 2”) | 0.096 ** 0.156/0.026^ | n.s. | 0.331 *** 0.388/0.142 ^ | n.s. | n.s. | n.s. | 0.498 *** 0.575/0.331 ^^ |
| Planet → GC-Ins (“Social-turn 2”) | n.s. | 0.241 ** 0.238/0.075 ^ | n.s. | n.s. | n.s. | 0.321 *** 0.268/0.090 ^ | n.s. |
| Planet → GC-InnS (“Social-turn 2”) | n.s. | n.s. | n.s. | 0.169 * 0.173/0.076 ^ | n.s. | n.s. | n.s. |
| Planet → H&LS (“Social-turn 2”) | n.s. | n.s. | n.s. | n.s. | 0.446 *** 0.472/0.197 ^^ | n.s. | n.s. |
| Resources → GC-Ins (“Social-turn 2”) | n.s. | 0.361 *** 0.365/0.109 ^ | 0.529 *** 0.539/0.380 ^^^ | n.s. | 0.407 *** 0.458/0.150 ^^ | 0.364 *** 0.359/0.195 ^^ | 0.440 *** 0.431/0.165 ^^ |
| Resources → GC-InnS (“Social-turn 2”) | n.s. | 0.632 *** 0.642/0.374 ^^^ | 0.464 *** 0.484/0.330 ^^ | n.s. | 0.599 *** 0.635/0.357 ^^^ | 0.183 *** 0.187/0.085 ^ | 0.241 * 0.195/0.076 ^ |
| Resources → H&LS (“Social-turn 2”) | 0.167 ** 0.141/0.029 ^ | 0.122 * 0.164/0.026 ^ | 0.151 *** 0.263/0.071 ^ | n.s. | 0.204 *** 0.280/0.051 ^^ | n.s. | n.s. |
| Peace → GC-Ins (“Social-turn 2”) | 0.528 *** 0.549/0.349 ^^ | n.s. | n.s. | n.s. | 0.181 * 0.115/0.033 ^ | 0.041 ** 0.156/0.025 ^ | 0.381 *** 0.378/0.150 ^^ |
| Peace → GC-InnS (“Social-turn 2”) | 0.173 *** 0.205/0.112 ^ | n.s. | 0.144 * 0.130/0.050 ^ | 0.012 * 0.176/0.083 ^ | 0.105 * 0.122/0.044 ^ | 0.165 *** 0.295/0.031 ^ | 0.295 ** 0.289/0.045 ^ |
| Peace → H&LS (“Social-turn 2”) | 0.103 * 0.175/0.042 ^ | n.s. | n.s. | n.s. | n.s. | 0.183 *** 0.254/0.027 ^ | n.s. |
| GC-Ins → H&LS (“Social-turn 2”) | 0.124 ** | −0.354 *** | 0.406 *** | n.s. | −0.531 *** | n.s. | n.s. |
| GC-InnS → H&LS (“Social-turn 2”) | n.s. | 0.646 *** | −0.221 ** | −0.314 *** | 0.493 *** | 0.435 *** | −0.276 ** |
| Institutional Enhancers → People (“Social-turn 1.2”) | −0.113 * −0.099/0.026 ^ | 0.392 *** 0.366/0.088 ^ | 0.137 * 0.169/0.042 ^ | 0.753 *** 0.740/0.388 ^^^ | 0.618 *** 0.647/0.310 ^^ | 0.562 *** 0.588/0.313 ^^ | n.s. |
| Institutional Enhancers → Prosperity (“Social-turn 1.2”) | 0.148 ** 0.178/0.116 ^ | 0.548 *** 0.540/0.292 ** | 0.211 ** 0.231/0.074 ^ | n.s. | 0.635 *** 0.667/0.219 ^^ | 0.757 *** 0.779/0.560 ^^^ | n.s. |
| Institutional Enhancers → Planet (“Social-turn 1.2”) | n.s. | n.s. | 0.314 *** 0.276/0.051 ^ | −0.500 *** −0.517/0.266 ^^ | n.s. | −0.730 *** −0.758/0.346 ^^ | n.s. |
| Institutional Enhancers → Resources (“Social-turn 1.2”) | 0.106 * 0.121/0.028 ^ | n.s. | 0.221 ** 0.334/0.164 ^^ | 0.844 *** 0.822/0.309 ^^ | 0.529 *** 0.617/0.305 ^^ | 0.604 *** 0.619/0.390 ^^^ | 0.324 *** 0.326/0.090 ^ |
| Institutional Enhancers → Peace (“Social-turn 1.2”) | 0.556 *** 0.566/0.403 ^^^ | n.s. | n.s. | 0.509 *** 0.514/0.355 ^^^ | 0.653 *** 0.628/0.375 ^^^ | −0.574 *** −0.582/0.242 ^^ | n.s. |
| Institutional Enhancers → H&LS (“Social-turn 1.2”) | −0.302 *** −0.238/0.023 ^ | 0.272 ** 0.251/0.078 ^ | 0.139 * 0.263/0.075 ^ | −0.443 *** −0.403/0.064 ^ | n.s. | n.s. | n.s. |
| Financial Enhancers → People (“Social-turn 1.2”) | n.s. | 0.284 *** 0.309/0.100 ^ | n.s. | −0.246 *** −0.247/0.037 ^ | n.s. | −0.278 *** −0.285/0.068 ^ | −0.349 *** −0.398/0.183 ^^ |
| Financial Enhancers → Prosperity (“Social-turn 1.2”) | n.s. | 0.378 *** 0.377/0.207 ^^ | 0.439 *** 0.443/0.231 ^^ | 0.255 *** 0.253/0.103 ^ | −0.534 *** −0.539/0.166 ^^ | −0.238 *** −0.244/0.093 ^ | −0.402 *** −0.445/0.165 ^^ |
| Financial Enhancers → Planet (“Social-turn 1.2”) | n.s. | n.s. | n.s. | n.s. | 0.625 *** 0.626/0.131 ^ | 0.544 *** 0.552/0.025 ^ | 0.483 *** 0.485/0.194 ^^ |
| Financial Enhancers → Resources (“Social-turn 1.2”) | n.s. | 0.205 * 0.226/0.062 ^ | n.s. | n.s. | n.s. | −0.213 *** −0.216/0.070 ^ | n.s. |
| Financial Enhancers → Peace (“Social-turn 1.2”) | −0.101 * −0.099/0.028 ^ | 0.496 *** 0.528/0.229 ^^ | −0.286 *** −0.248/0.037 ^ | 0.273 *** 0.272/0.155 ^^ | 0.179 ** 0.182/0.059 ^ | 0.321 *** 0.323/0.036 ^ | 0.578 *** 0.540/0.262 ^^ |
| Financial Enhancers → H&LS (“Social-turn 1.2”) | n.s. | 0.212 * 0.155/0.039 ^ | n.s. | 0.237 ** 0.331/0.032 ^ | n.s. | n.s. | n.s. |
| GC-Ins → People (“Social-turn 1.2”) | 0.425 *** | −0.257 * | −0.135 * | −0.283 *** | n.s. | n.s. | −0.234 ** |
| GC-Ins → Prosperity (“Social-turn 1.2”) | 0.352 *** | n.s. | 0.533 *** | 0.186 ** | −0.411 *** | n.s. | n.s. |
| GC-Ins → Planet (“Social-turn 1.2”) | −0.221 *** | 0.656 *** | 0.556 *** | −0.152 * | −0.758 *** | 0.269 *** | n.s. |
| GC-Ins → Resources (“Social-turn 1.2”) | n.s. | −0.533 *** | 0.653 *** | −0.434 *** | −0.444 *** | 0.249 *** | n.s. |
| GC-Ins → Peace (“Social-turn 1.2”) | 0.192 *** | −0.427 *** | 0.230 ** | n.s. | −0.452 *** | n.s. | n.s. |
| GC-InnS → People (“Social-turn 1.2”) | n.s. | −0.160 * | 0.327 *** | 0.210 ** | n.s. | 0.309 *** | 0.397 *** |
| GC-InnS → Prosperity (“Social-turn 1.2”) | 0.362 *** | −0.340 *** | −0.418 *** | 0.223 ** | 0.459 *** | 0.316 *** | 0.324 *** |
| GC-InnS → Planet (“Social-turn 1.2”) | 0.167 *** | −0.569 *** | −0.784 *** | n.s. | 0.558 *** | −0.509 *** | n.s. |
| GC-InnS → Resources (“Social-turn 1.2”) | 0.251 *** | 0.979 *** | n.s. | n.s. | 0.708 *** | n.s. | 0.502 *** |
| GC-InnS → Peace (“Social-turn 1.2”) | n.s. | n.s. | 0.331 *** | 0.155 * | 0.273 *** | −0.101 * | 0.230 ** |
| People → H&LS (“Social-turn 1.2”) | 0.198 *** | n.s. | n.s. | n.s. | 0.110 * | 0.223 *** | 0.254 ** |
| Prosperity → H&LS (“Social-turn 1.2”) | −0.099 * | n.s. | 0.465 *** | n.s. | −0.311 *** | 0.212 *** | 0.556 *** |
| Planet → H&LS (“Social-turn 1.2”) | n.s. | n.s. | −0.213 ** | n.s. | 0.524 *** | n.s. | −0.643 *** |
| Resources → H&LS (“Social-turn 1.2”) | n.s. | n.s. | 0.185 ** | −0.146 * | 0.316 ** | −0.231 *** | −0.597 *** |
| Peace → H&LS (“Social-turn 1.2”) | 0.153 *** | n.s. | −0.325 *** | 0.202 ** | n.s. | 0.252 *** | n.s. |
| SD Pillars ↓ H&LS | Advanced Economies | Emerging and Developing Europe | Emerging and Developing Asia | Middle East, North Africa, and Pakistan | Latin America and the Caribbean | Sub-Saharan Africa | Commonwealth |
|---|---|---|---|---|---|---|---|
| Path Coeff. Total Effects/ Effect Sizes | Path Coeff. Total Effects/ Effect Sizes | Path Coeff. Total Effects/ Effect Sizes | Path Coeff. Total Effects/ Effect Sizes | Path Coeff. Total Effects/ Effect Sizes | Path Coeff. Total Effects/ Effect Sizes | Path Coeff. Total Effects/ Effect Sizes | |
| People → H&LS “Social-turn 1” | 0.234 *** 0.234/0.046 ^ | n.s. | n.s. | n.s. | n.s. | n.s. | 0.265 * 0.265/0.107 ^ |
| People → H&LS “Social-turn 1.2” | 0.198 *** | n.s. | n.s. | n.s. | 0.110 * | 0.223 *** | 0.254 ** |
| People → H&LS “Social-turn 2” | 0.172 *** 0.190/0.038 ^ | n.s. | n.s. | n.s. | n.s. | 0.123 * 0.220/0.024 ^ | 0.207 * 0.123/0.050 ^ |
| Prosperity → H&LS “Social-turn 1” | n.s. | n.s. | 0.453 *** 0.453/0.166 ^^ | n.s. | n.s. | n.s. | 0.560 *** 0.560/0.366 ^^^ |
| Prosperity → H&LS “Social-turn 1.2” | −0.099 * | n.s. | 0.465 *** | n.s. | −0.311 *** | 0.212 *** | 0.556 *** |
| Prosperity → H&LS “Social-turn 2” | 0.096 0.156/0.026 ^ | 0.120 0.148/0.027 ^ | 0.331 *** 0.388/0.142 ^ | n.s. | n.s. | n.s. | 0.498 *** 0.502/0.331 ^^ |
| Planet → H&LS “Social-turn 1” | n.s. | n.s. | n.s. | n.s. | 0.474 *** 0.474/0.198 ^^ | n.s. | 0.630 *** 0.630/0.341 ^^ |
| Planet → H&LS “Social-turn 1.2” | n.s. | n.s. | −0.213 ** | n.s. | 0.524 *** | n.s. | −0.643 *** |
| Planet → H&LS “Social-turn 2” | n.s. | n.s. | n.s. | n.s. | 0.446 *** 0.472/0.197 ^^ | n.s. | 0.322 *** 0.275/0.149 ^^ |
| Resources–H&LS “Social-turn 1” | n.s. | n.s. | n.s. | 0.193 0.201/0.333 ^^ | 0.200 ** 0.200/0.036 ^ | 0.273 *** 0.273/0.019 ^ | 0.583 *** 0.583/0.058 ^ |
| Resources–H&LS “Social-turn 1.2” | n.s. | n.s. | 0.185 ** | −0.146 * | 0.316 ** | −0.231 *** | −0.597 *** |
| Resources–H&LS “Social-turn 2” | 0.167 *** 0.141/0.029 ^ | 0.122 0.164/0.026 ^ | 0.151 0.263/0.071 ^ | n.s. | 0.204 *** 0.208/0.051 ^ | n.s. | n.s. |
| Peace → H&LS “Social-turn 1” | 0.217 *** 0.217/0.034 ^ | n.s. | n.s. | 0.195 0.150/0.023 ^ | n.s. | 0.187 *** 0.187/0.020 ^ | 0.085 0.085/0.028 ^ |
| Peace → H&LS “Social-turn 1.2” | 0.153 *** | n.s. | −0.325 *** | 0.202 ** | n.s. | 0.252 *** | n.s. |
| Peace → H&LS “Social-turn 2” | 0.103 0.175/0.042 ^ | n.s. | 0.342 *** 0.327/0.062 ^ | 0.208 0.208/0.025 ^ | n.s. | 0.183 ** 0.254/0.027 ^ | n.s. |
Disclaimer/Publisher’s Note: The statements, opinions and data contained in all publications are solely those of the individual author(s) and contributor(s) and not of MDPI and/or the editor(s). MDPI and/or the editor(s) disclaim responsibility for any injury to people or property resulting from any ideas, methods, instructions or products referred to in the content. |
© 2023 by the authors. Licensee MDPI, Basel, Switzerland. This article is an open access article distributed under the terms and conditions of the Creative Commons Attribution (CC BY) license (https://creativecommons.org/licenses/by/4.0/).
Share and Cite
Canatay, A.; Prieto, L.; Amin, M.R. Integrating “Neoliberal-Turn” and “Social-Turn” Constructs in Examining Sustainable Development and Happiness and Life Satisfaction: A Global-, Country Cluster-, and Country-Level Study. Sustainability 2023, 15, 10010. https://doi.org/10.3390/su151310010
Canatay A, Prieto L, Amin MR. Integrating “Neoliberal-Turn” and “Social-Turn” Constructs in Examining Sustainable Development and Happiness and Life Satisfaction: A Global-, Country Cluster-, and Country-Level Study. Sustainability. 2023; 15(13):10010. https://doi.org/10.3390/su151310010
Chicago/Turabian StyleCanatay, Arman, Leonel Prieto, and Muhammad Ruhul Amin. 2023. "Integrating “Neoliberal-Turn” and “Social-Turn” Constructs in Examining Sustainable Development and Happiness and Life Satisfaction: A Global-, Country Cluster-, and Country-Level Study" Sustainability 15, no. 13: 10010. https://doi.org/10.3390/su151310010
APA StyleCanatay, A., Prieto, L., & Amin, M. R. (2023). Integrating “Neoliberal-Turn” and “Social-Turn” Constructs in Examining Sustainable Development and Happiness and Life Satisfaction: A Global-, Country Cluster-, and Country-Level Study. Sustainability, 15(13), 10010. https://doi.org/10.3390/su151310010