Article

Methods for Assessing the Psychological Tension of Social Network Users during the Coronavirus Pandemic and Its Uses for Predictive Analysis

1
Institute of Information Systems and Engineering Computer Technologies, Russian New University, Radio St. 22, Moscow 105005, Russia
2
Chitkara University Institute of Engineering and Technology, Chitkara University, Rajpura 140401, Punjab, India
3
Institute of Advance Computing, Sage University, Indore 452001, Madhya Pradesh, India
4
Department of Electrical Engineering, Medi-Caps University, Indore 452001, Madhya Pradesh, India
*
Authors to whom correspondence should be addressed.
Sustainability 2023, 15(13), 10008; https://doi.org/10.3390/su151310008
Submission received: 1 May 2023 / Revised: 4 June 2023 / Accepted: 12 June 2023 / Published: 24 June 2023

Abstract

:
This article address approaches to the development of methods for assessing the psychological state of social network members during the coronavirus pandemic through sentiment analysis of messages. The purpose of the work is to determine the psychological tension index by using a previously developed thematically ranked dictionary. Researchers have investigated methods to evaluate psychological tension among social network users and to forecast the psychological distress. The approach is novel in the sense that it ranks emojis by mood, considering both the emotional tone of tweets and the emoji’s dictionary meanings. A novel method is proposed to assess the dynamics of the psychological state of social network users as an indicator of their subjective well-being, and develop targeted interventions for help. Based on the ranking of the Emotional Vocabulary Index (EVI) and Subjective Well-being Index (SWI), a scheme is developed to predict the development of psychological tension. The significance lies in the efficient assessment of the fluctuations in the mental wellness of network users as an indication of their emotions and a prerequisite for further predictive analysis. The findings gave a computed value of EVI of 306.15 for April 2022. The prediction accuracy of 88.75% was achieved.

1. Introduction

The outbreak of COVID-19 was accompanied by an “infodemic”—an over-abundance of information about the outbreak [1]. There has been both a surge in scientific publications [2] and an increase in the number of discussions on social networks. The Twitter dataset provides a wide range of relevant information related to user behavior, emotions, and opinions about world events [3]. Researchers have explored methods to assess the psychological tension of social network users and predict psychological distress during the pandemic [4].
Machine learning [5] is widely being used to predict psychological distress among social network users. A study by Ahmed et al. [6] analyzed Facebook posts to predict anxiety and depression among users during the pandemic. Researchers have also used sentiment analysis to examine the psychological tension of social network users. Hossain et al. [7] examined the sentiment of tweets related to COVID-19 and found that negative sentiment was associated with higher psychological distress among users.
Text analysis of a tweet corpus is complicated by the fact that tweets are very short messages, often combined with images, videos, and emoticons, and text analysis is not as obvious as on other corpus types [8].
Twitter sentiment analysis starts from scanning the tweets for hashtags to collect all related data. The next step is to pre-process and clean up the tweets. Then, the tweets are analyzed depending on the specific purpose. Sentiment analysis uses a list of words associated with strongly positive or negative sentiment [9]. Budiharto and Meiliana [10] used polarity as the difference among the list of positive and negative words in every text separated by the total number of sentiment words when predicting presidential elections.
The simplest tone dictionary is a list of words with a sentiment value for each word [11]. The Russian language is rarely used for tonal analysis research [12,13]. However, a method for extracting Russian vocabulary [14] was designed for grammatically correct media texts and not for Internet content. To determine public opinion in Russian texts, a Tone Dictionary was developed [15].
Previous studies have suggested that NLP (Natural Language Processing), machine learning [16], and sentiment analysis [17] are effective methods for assessing psychological tension of social network users during the coronavirus pandemic. These methods can provide insights into the emotional state and language use of individuals on social networks during the pandemic. This can be used in predictive analysis to identify individuals or groups at higher risk of psychological distress and develop targeted interventions to help.
Despite the promising results, there are limitations to these methods. For instance, NLP may not capture the nuance of human language, and machine learning algorithms may suffer from over fitting or bias problems. Therefore, it is crucial to develop reliable and validated methods for assessing psychological tension of social network users during the pandemic.
In view of the mentioned limitations, this research is aimed at creating methods for determining “emotional charge” of user-generated Internet content, as well as creating predictive models for assessing the psychological and social well-being of the population in the context of the coronavirus pandemic.
The research here proposes to examine the interaction between emoji and text. Additionally, based on the previous studies, the following three hypothesis were formed.
The first hypothesis is that emoticons affect their accompanying texts depending on the valency. Positive emojis make the message more positive, while negative emojis make it more negative [18,19].
Looking at the valency of emoticons used, Derks et al. [20] reported that the valence of emoji corresponded to the valence of the context, suggesting that emojis reflect the valence of the context, and serve to clarify the valence of the message (second hypothesis).
The third hypothesis is that the repetition of emojis enhances the emotional valence of the message. Based on this hypothesis, this article proposes a method for calculating the IPTt (Index of Psychological Tension for tweet) indicator.
The approach proposed in this article has the following features:
-
A five-rank scale is used to assess the emotional charge of terms and emojis;
-
Emojis are considered, with a multiplying factor used when using multiple identical emojis;
-
Parameters can be applied both at the level of a tweet and at the level of an array of tweets.
The objectives of this research work are as follows:
i.
Analysis of collections of tweets using proprietary software for highlighting tonal words about socio-psychological accounting;
ii.
Creation of a tonal dictionary of terms (with assignment of a rank and type of tonality);
iii.
Development of methods for assessing the psychological state of social network users based on sentiment analysis of messages;
iv.
Creation of methods for assessing the dynamics of the psychological state of network users as a reflection of their subjective result;
v.
Creating a methodology for analyzing the predictive accounting for psychological heightened severity, with the mood of tweets and pandemic indicators.
The proposed dictionaries contain not only ranked terms, but also ranked emojis and text emoticons. The dictionaries contain all detected word forms with a common root, including abbreviations, intentional change in the spelling of words.

2. Related Work

Article [21] shows that English is the dominant language used in sentiment analysis studies. Most authors have studied texts in English. The text of bilingual documents (in English and other languages) was translated into English to extract the useful information.
A study by Chen et al. [22] analyzed over 100 million tweets related to COVID-19 and found that the dominant sentiments were negative, with fear being the most prevalent emotion. The study also found that there was a significant increase in negative sentiments during the early stages of the pandemic. Similarly, a study by Almishal et al. [23] analyzed over 60,000 tweets related to COVID-19 and found that the dominant sentiment was anxiety, followed by sadness and anger. The study also found that there was a significant increase in negative sentiments as the number of COVID-19 cases increased.
Study by Abdel-Basset et al. [24] analyzed over 400,000 tweets related to COVID-19 and found that the dominant sentiment was negative, with fear being the most prevalent emotion.
Cao et al. [25] used sentiment analysis to evaluate the emotional state of social network users during COVID-19. The study analyzed over 6 million Weibo posts related to COVID-19 and found that negative emotions such as anxiety and anger were prevalent among social network users.
Li et al. [26] used topic modeling to identify the key topics discussed by social network users during COVID-19. The study analyzed over 2 million Weibo posts related to COVID-19 and found that topics related to health, the economy, and government policies were prevalent. The study also found that the level of discussion of these topics was associated with the psychological tension of social network users.
A study by Liao et al. [27] used network analysis to examine the social network structure of Twitter users during COVID-19. The study analyzed over 1.6 million tweets related to COVID-19 and found that users who were more connected to others in their network reported lower levels of psychological tension. Gao et al. (2021) analyzed tweets to identify the emotional state of social media users during the pandemic [28].
Samuel et al. [29] analyzed the text of tweets in the United States during the COVID-19 peak to track the evolution of the fear–panic–despair triad associated with COVID-19. Bhat et al. [30] examined the positive, neutral, and negative sentiments of tweets related to the spread of COVID-19. Lwin et al. [31] studied global Twitter emotional trends in relation to the pandemic by applying a lexical approach and the Crystal-Feel algorithm to four emotions (fear, anger, sadness, and joy).
An exploratory study and sentiment analysis on a big dataset about the COVID-19 pandemic focusing on the Omicron variant was proposed by Thakur N. et al. [32]. The role of Twitter during the COVID-19 pandemic in spreading information and misinformation was presented through sentiment analysis [33].
The researchers proposed various indices to measure the sentiment of tweets. For example, the Sentiment Index represents the proportion of the difference of positive emotions and negative emotions to the totality of positive emotions, negative emotions, and neutral emotions of users [34,35].
Gann et al. [36] chose 6799 tokens based on Twitter data, and each token was assigned a sentiment score, specifically the TSI (Total Sentiment Index), indicating whether it is a positive or negative token:
T S I = p t p t n   × n p + t p t n   × n
where p is the number of occurrences of a token in positive tweets and n is the number of occurrences of a token in negative tweets. Furthermore, tp/tn is the ratio of total positive tweets to total negative tweets.
The Sentiment Index was used to analyze and forecast customer changes and feelings over time [37]:
S I = P N P + N + N t
where P denotes the number of positive tweets, N the number of negative tweets, and Nt the number of neutral tweets.
Sentiment Score assesses a good or negative statement in a text or document [38]. Ratings can be given on a scale of 0 to 10, with 0 indicating a negative score, 4 indicating neutral, and 7 indicating a good score. In general, the sentiment score is defined as the weighted average of the document’s sentiment score [39].
Panchenko [40] evaluated Russian-language texts on Facebook using various methods. The Word Sentiment Index is a measure of the proportion of positive to negative terms in all texts (posts and comments). The Text Sentiment Index (TSI) is a ratio of positive to negative texts in a corpus. The Word Emotion Index is a ratio of emotional (positive or negative) words in the corpus of texts. The Text Emotion Index is a ratio of positive and negative texts in the corpus. Two approaches concentrate on emotive terms, while the other two concentrate on text classification.
During the coronavirus pandemic, researchers analyzed public opinion, emotions, and sentiment in social media posts. Twitter is one of the best social networks for gathering news [41]. To analyze sentiment in India [42], visualization methods were used—a word cloud and a graphical representation of emotions. Rustam et al. extracted tweets related to COVID-19 and visualized people’s moods by dividing tweets into positive, neutral, and negative [43]. Naseem et al. when analyzing opinions about COVID-19, each tweet is marked as positive, negative, or neutral [44].
Zhang et al. [45] suggested a sentiment classification system that organizes opinion terms in the WordNet lexical method dataset to categorizing text at the sentence level rather than the document level.
Sanders et al. examined one million tweets to gauge public opinion on the usage of masks as a preventive approach during the COVID-19 epidemic [46]. Based on Twitter data, NLP was utilized to analyze the increase in the frequency of positive tweets, as well as perform topic clustering and visualization.
Jalil et al. [47] conducted a statistical analysis of keyword trends in the corpus of tweets about the coronavirus disease pandemic and analyzed the sentiment of the collected tweets using various feature sets and classifiers.

3. Materials and Methods

A technique for sentiment analysis of tweets based on English-language tweets is proposed. The technique is based on ranking of emotional words and emojis. To determine the tone of tweets, experts created dictionaries of ranked words and emojis (emotional components, elements). A five-point system (−2, −1, 0, +1 or +2) was chosen to determine the degree of emotional charge of dictionary elements, and each element of the dictionary was assigned a degree of emotional charge.
Tweets were collected in Excel format, using the Vicinitas API, while marking up the texts of tweets by words and by the tweets themselves. Next, the text processing system was used to extract terms from tweets, and the addresses of occurrences of terms were saved. After that, the terms were normalized; a separate list of normalized terms was created, including the address of the term in its original form.
The list of stop-words was used to filter the list of selected words. A large number of stop-words have been created. The biggest challenge in extracting keywords from tweets using the standard set of python stop-words (the standard set comprises only conjunctions, interjections, etc., which were eliminated from consideration) was similar to “noise”, namely, many words that are unrelated to the explored topic. Categories of stop-words were added based on expert analysis (place names, dates, days of the week, names of months, proper names, names of institutions, positions, and so on). New stop-words were added to the collection on a regular basis.
Then, the list of terms was processed by an expert with the assignment of ranks according to the emotional scale. The list of terms in the database includes the following elements: term, its rank, synonyms, abbreviations, derivatives, informal spellings. This makes it possible to compare the different representations of the same term with its main meaning and eliminate errors in determining the frequency of use of the term in messages.
Tweets often use informal notations for common words. After analyzing the tweets, following categories of spelling errors are identified.
Internet memes (Lol), slang (kinda, wonna, outta), informal abbreviations (government as gov’t, gvnt; children as cdns; kid as kd; years as yrs; season as szn; month as mths; COVID as cvd), informal spellings (because as cuz, bc, bec; you as u; no as n;), repeating letters in a word (dieeeeee, knowwww), hiding informal vocabulary (fwcked, fkg, fking), informal exclamations (ummmm, ew).
These distortions were considered when extracting terms from tweets by comparing them with the correct form of the words. Some categories of word distortion were used to add emotion to the text of tweets, such as letter repetition, informal vocabulary, and informal exclamations. This was considered when assessing the emotionality of a tweet.
In addition, the emotionality of tweets is enhanced using emojis. A list of emojis was compiled and ranked on a five-digit emotional scale. When assessing the emotionality of a tweet, ranks of the words (in various spellings) and emojis were considered. Then, an additive evaluation of the “emotional charge” of each tweet was performed and the average value of the evaluation for the collection of tweets was calculated. An Index of Psychological Tension (IPT) is proposed. IPT is calculated as the sum of the ranks of emotionally charged words and emojis for each tweet:
I P T t = r t + ( e t × k )   n w
where, IPTt—Index of Psychological Tension for the tweet, r t —ranks of the emotional words in tweet, e t —ranks of emojis in tweet, k—enhancing coefficient:
k = r + ( m e 1 ) × 1.25 × r )
me—number of emoji repeats.
For the collection of tweets, the proposed equation to evaluate the average ( I P T a v ) is:
I P T a v = I P T t n t
where,   I P T a v is Index of Psychological Tension for collection of tweets, n t —number of tweets in the collection.
Data for research (Results, Section 1) were downloaded from Twitter from 22 April 2022 to 30 April 2022). Data for research (Results, Section 2) were downloaded from Twitter from 1 January 2021 to 31 January 2023). Data for research (Results, Section 3) were downloaded from Twitter from 20 November 2021 to 8 December 2021). These time periods were chosen such that they were comparable to the average incidence rate (excluding periods of sharp spikes in incidence) (Results, Section 1 and Section 3). The period of pandemic development was chosen (excluding the initial period of the pandemic development and the end period) (Results, Section 2). The upload was carried out using the analytical mechanisms of Twitter (https://www.vicinitas.io/) (accessed on 22 March 2023). This allows for uploading the Tweet Id, Tweet Type, hashtags, User Id, Name, location. Vicinitas is an effective way to import tweets using Twitter’s streaming API. Vicinitas allows us to search and display up to 2000 tweets for free. The results have been integrated into Microsoft Excel to remove duplicate content [45]. The whole procedure took place in real time. This research contains 7830 English tweets (including retweets) (Section 1), 4771 English original tweets (Section 2), and 4024 Russia original tweets (Section 3).
For the automated calculation of the IPT, a set of programs in the python language was developed, which implemented the following functions:
-
Building a corpus of tweets based on the created database structure in sqlite3, including the tweet body, author, geographic label, creation date, tweet type;
-
Extracting of terms from tweets, the address of the occurrence of the term in the tweet is simultaneously fixed for navigation through terms to analyze their context;
-
Expert assessment of the degree of emotional charge of terms with the setting of ranks on a scale of “−2, −1, 0, +1, +2” (from strongly negative to strongly positive) and the assignment of expert ranks to terms in the database;
-
Calculation of IPT based on the calculation of the additive rank of the terms in tweets, considering their frequency, and outputting the results to an excel table.
The predictive analysis method assumed that, in tweets discussing the coronavirus, the main emotions are related to the coronavirus disease. The emotional background of people was undoubtedly influenced by reports of morbidity and mortality during the pandemic, illness, and death among the social circle. From the published indicators of the coronavirus pandemic, the considered indicators were: (1) the average mortality per week (for the period of publication of the tweets of the collection); (2) the average incidence per day (over the period of publication of the collection); (3) average increase in incidence (thousand people) for 4 months prior the period of publication of tweets. Then, a search was made for the correlation of these indicators with the results of sentiment analysis of tweets. The predictive analysis technique was tested on Russian-language messages related to the coronavirus from Twitter for the periods March–April, July–August, and November–December 2021.
Collections of user messages from the tweets were prepared for different periods of time (Table 1).
A method of predictive analysis of the growth of psychological tension was created, based on the rankings of the IPT. The predictive analysis technique included the following sequence of steps: (1) Preparation of collections of tweets for different periods of time; (2) Expert compilation of dictionaries of both negatively and positively colored vocabulary, selected from the collections; (3) Machine calculation of the modification of the IPT coefficient into the Emotional Vocabulary Index (EVI) as the ratio of negative to positive vocabulary for each array, per 1000 messages; (4) Graphical representation of the calculation results; (5) Choice of an indicator characterizing the pandemic, which correlates with the EVI; (6) EVI forecast.
To assess the dynamics of the psychological state of social network users as a reflection of their subjective well-being, this article proposes to define the value of the Subjective Well-being Index (SWI) of messages for a certain period (year, month, and week).
The SWI was calculated using the formula:
S W I = N n e g a t i v e N p o s i t i v e × 100 n ,
where, N n e g a t i v e is the number of negative tweets, N p o s i t i v e is the number of positive tweets, n is the total number of tweets. Negative and positive tweets were ranked by IPT.
The Emotional Vocabulary Index (EVI) was calculated for a collection of tweets. It is equal to the ratio of negative to positive vocabulary (including emojis) per thousand tweets:
E V I = m n e g a t i v e m p o s i t i v e × 1000 n ,
where, EVI is Emotional Vocabulary Index, m n e g a t i v e is the number of negative words in collection of tweets including emojis, m p o s i t i v e   is the number of positive words in collection of tweets, including emojis, and n is the number of tweets.

4. Results

4.1. Index of Psychological Tension

To test the method of automatic calculation of the IPT indicator, words, and expressions on the topics “Reproductive health and coronavirus (COVID)” and “Reproductive health and vaccine” were included in the dictionary of terms (first dictionary) (Table 2) and the dictionary of emojis (emoji dictionary) (Table 3). All these words and emojis were extracted from a collection of tweets containing the keywords (hashtags): “COVID, fertility”, “COVID, infertility”, “Coronavirus, fertility”, “COVID, sterility”, “Vaccine COVID Fertility”.
For a collection of 1380 original tweets (excluding retweets) on the topic “Reproductive Health and Coronavirus”, IPT = −0.172 (Equation (5)). At the same time, for 4610 tweets (including retweets), IPT = −0.183 (Equation (5)). A comparison of these values suggests that tweets with negative content are often re-tweeted.
For the collection of tweets on the topic “Reproductive Health and Vaccine”, for 990 original tweets IPT = −0.12. For 3220 tweets (including retweets), the IPT = −0.07. Consequently, positive tweets (often messages about vaccine safety) are circulated as retweets.
Negative IPT values indicate that discussions about coronavirus and fertility are dominated by negative assessments that accompany judgments that coronavirus causes infertility. The differences between IPT values calculated from original tweets and those calculated from retweets can help to identify trends in the spread of judgments of a particular tone.

4.2. Index of Subjective Well-Being

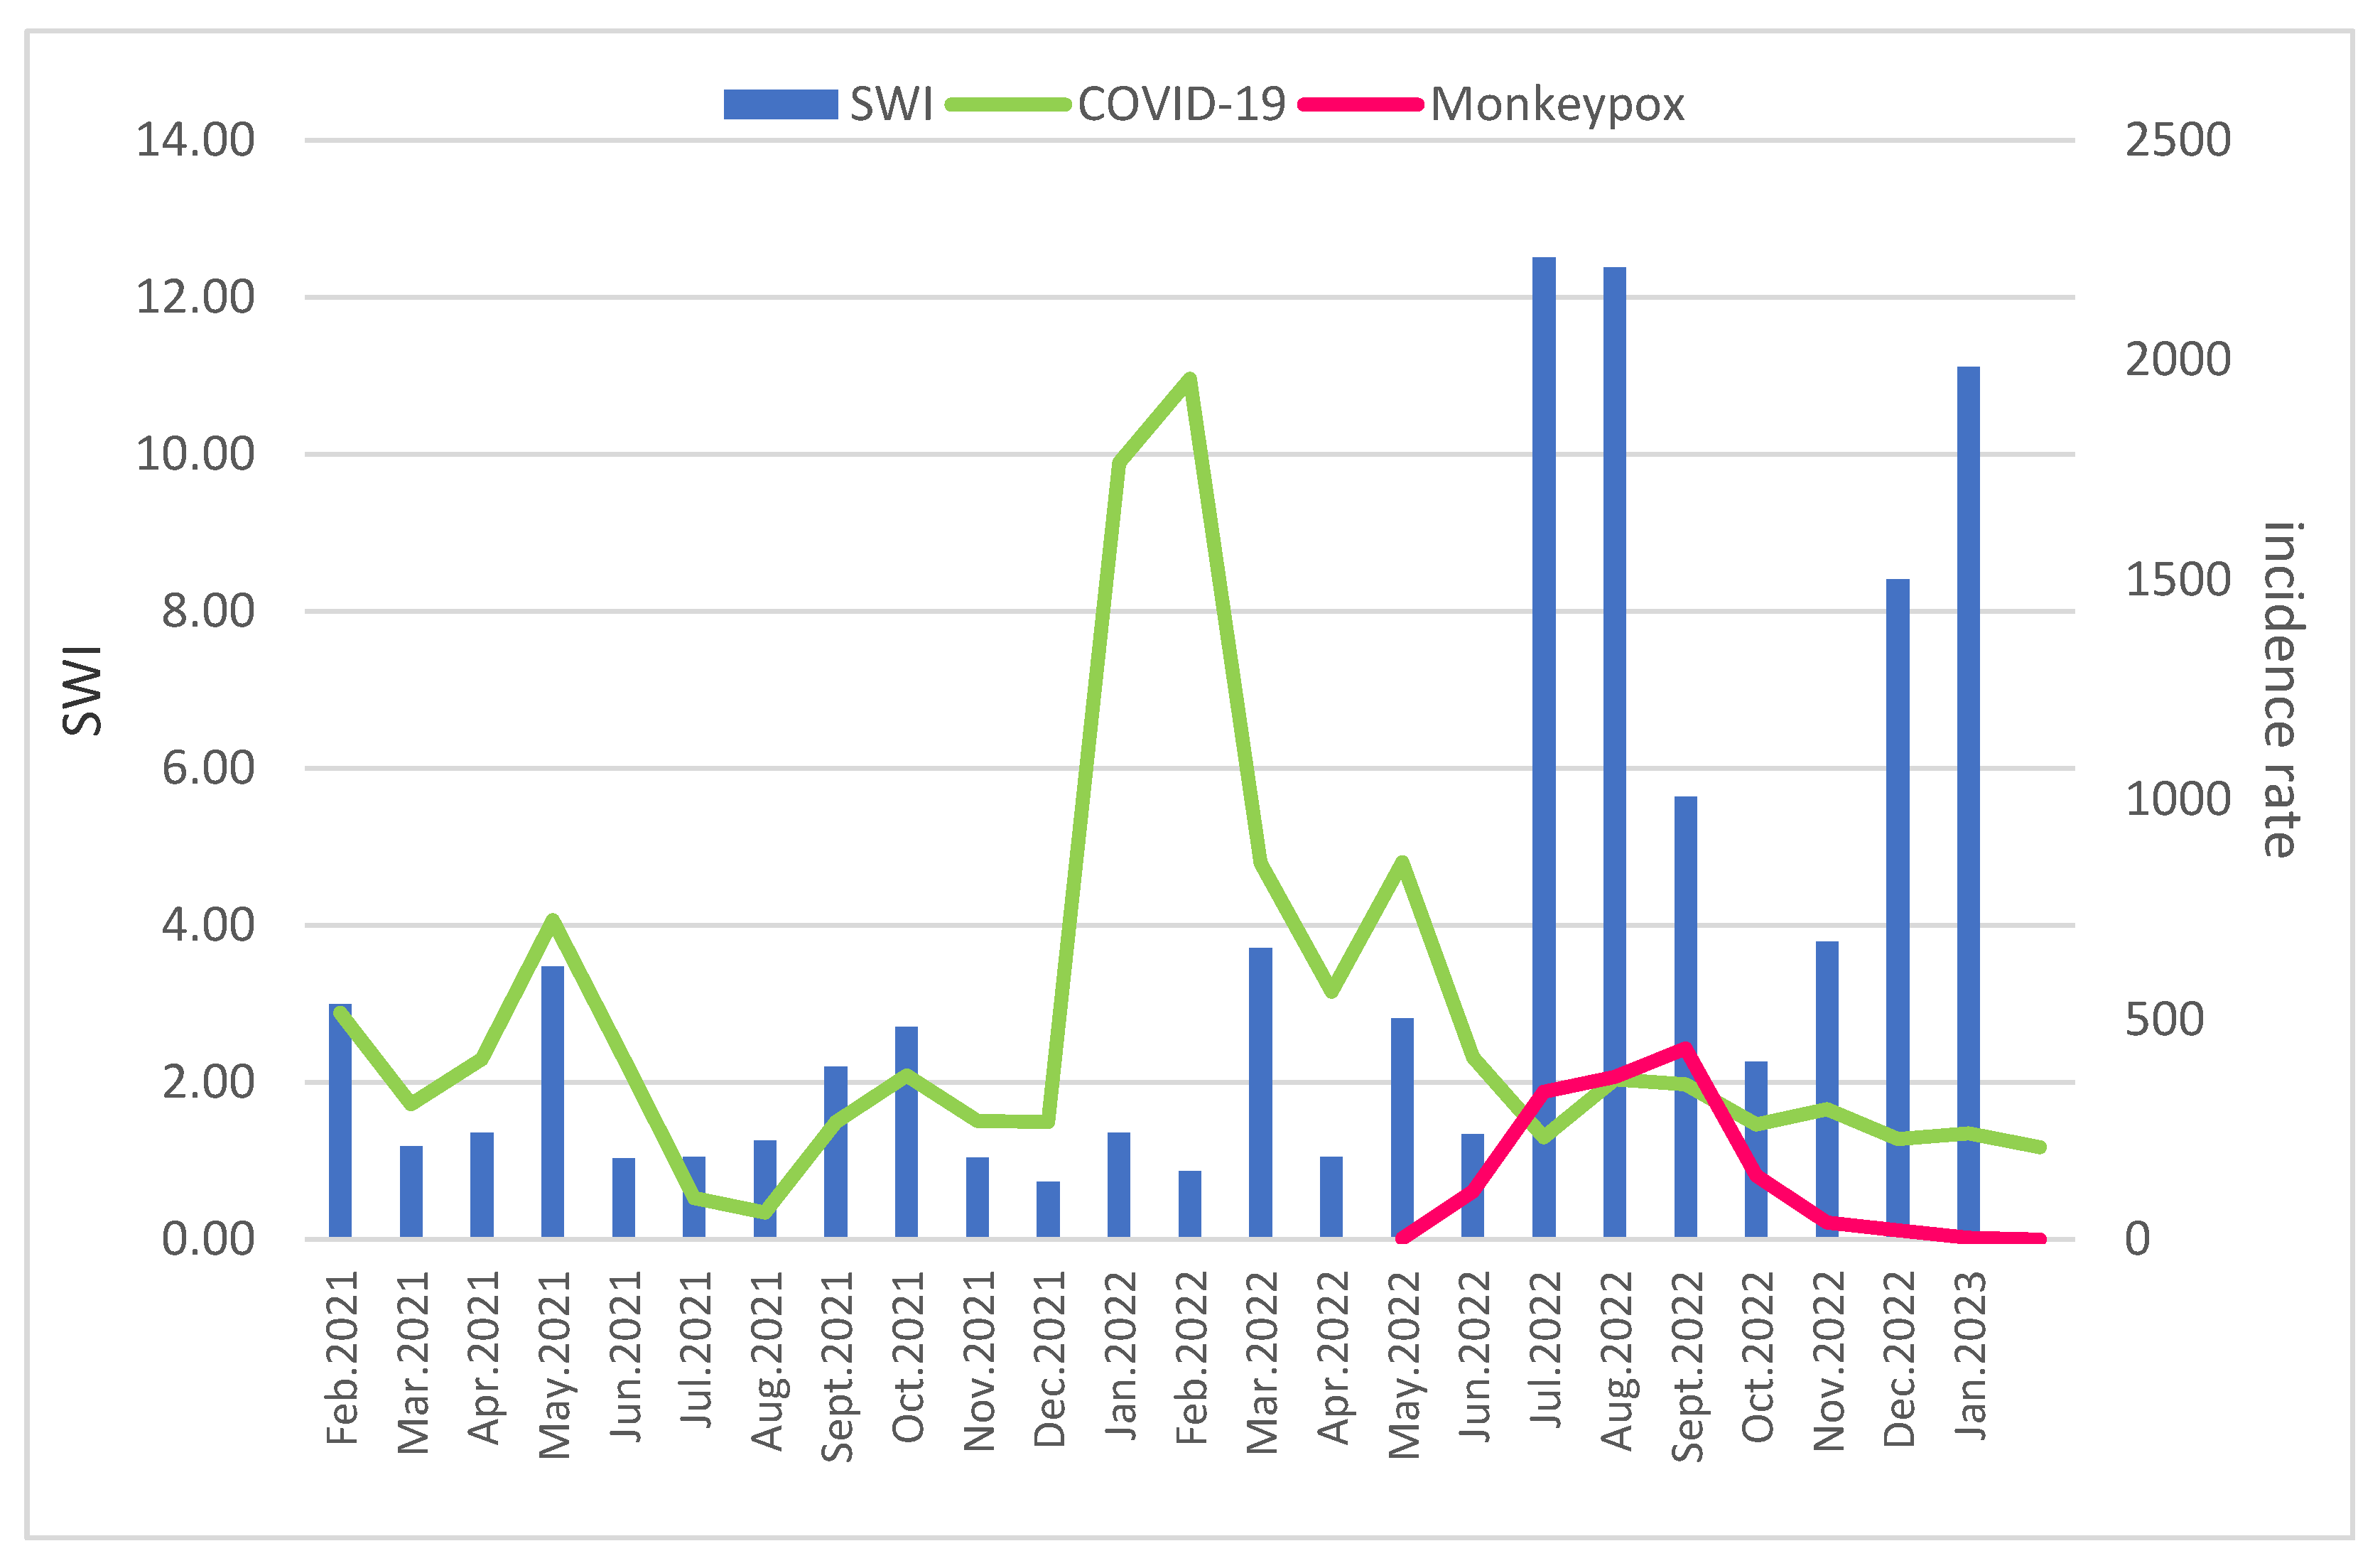
The Twitter user @e****** (Ottawa, ON, Canada) was randomly selected. The user’s 4771 tweets were downloaded for the period from January 2021 to January 2023. A lot of tweets were divided into arrays for each month (Table 4 and Table 5). SWI values were calculated per each month (Equation (6)). The SWI values were compared with the incidence during the COVID-19 pandemic and the monkey pox outbreak 2022 (the calculation was performed based on the data of [47,48,49]). The results are presented in Figure 1.
Over the entire observation period, positive tweets only prevailed over negative ones in July 2021. In February, May, September, and October 2021, there is a similar level of negativism in tweets with the incidence of COVID. For example, a surge of negative sentiment in May 2021 was due to the following facts: the death of residents of two nursing homes in Ontario, who were badly affected by the corona virus, dehydration, and neglect [47] (terms—terrible, died due to dehydration); deaths of colleagues and friends [48,49] (terms—we lost a colleague, my anger goes to a govt, tragically, miss).
In January–February 2022 surges of negativity are due to the Freedom Convoy, protests in Canada that began with a protest of truck drivers against vaccine passports. In July–August 2022 the negativity is associated with health problems in Canada and the outbreak of COVID (terms—depressing, COVID19′s Omicron ‘tsunami’, staffing crisis, ER crisis, impossible workloads). The mention of an outbreak of monkey pox is in June. In December 2022–January 2023, the negativity was associated with the COVID crisis in children’s hospitals (terms—child will never grow up, children’s hospital crisis, the poorest health and well-being outcomes for children and youth), and the oppression of women in Afghanistan (terms—Suicidal, indefensible, Afghan women will die, imprisoned at home).

4.3. Methods of Predictive Analysis of the Growth of Psychological Tension

Dictionaries of negatively and positively colored Russian vocabulary and emojis selected from the collections were compiled (examples are given in Table 6 and Table 7). At the same time, strongly emotionally colored terms and emojis with a rank of −2 (negative) and +2 (positive) are highlighted. For example, references to death (death, mortality, die, die out, kill, etc.), horror (horror, 😱), and evil (malice, sinister, 😡) were classified as negative vocabulary. Positive vocabulary included references to love (love, beloved, 🥰), victory (victory, win), and hope.
A variant of machine calculation of the modified IPT coefficient is proposed and named as Emotional Vocabulary Index (EVI) (Equation (7)). The Emotional Vocabulary Index was calculated for a collection of tweets, not for each tweet. It is equal to the ratio of negative to positive vocabulary (including emojis) per thousand tweets.
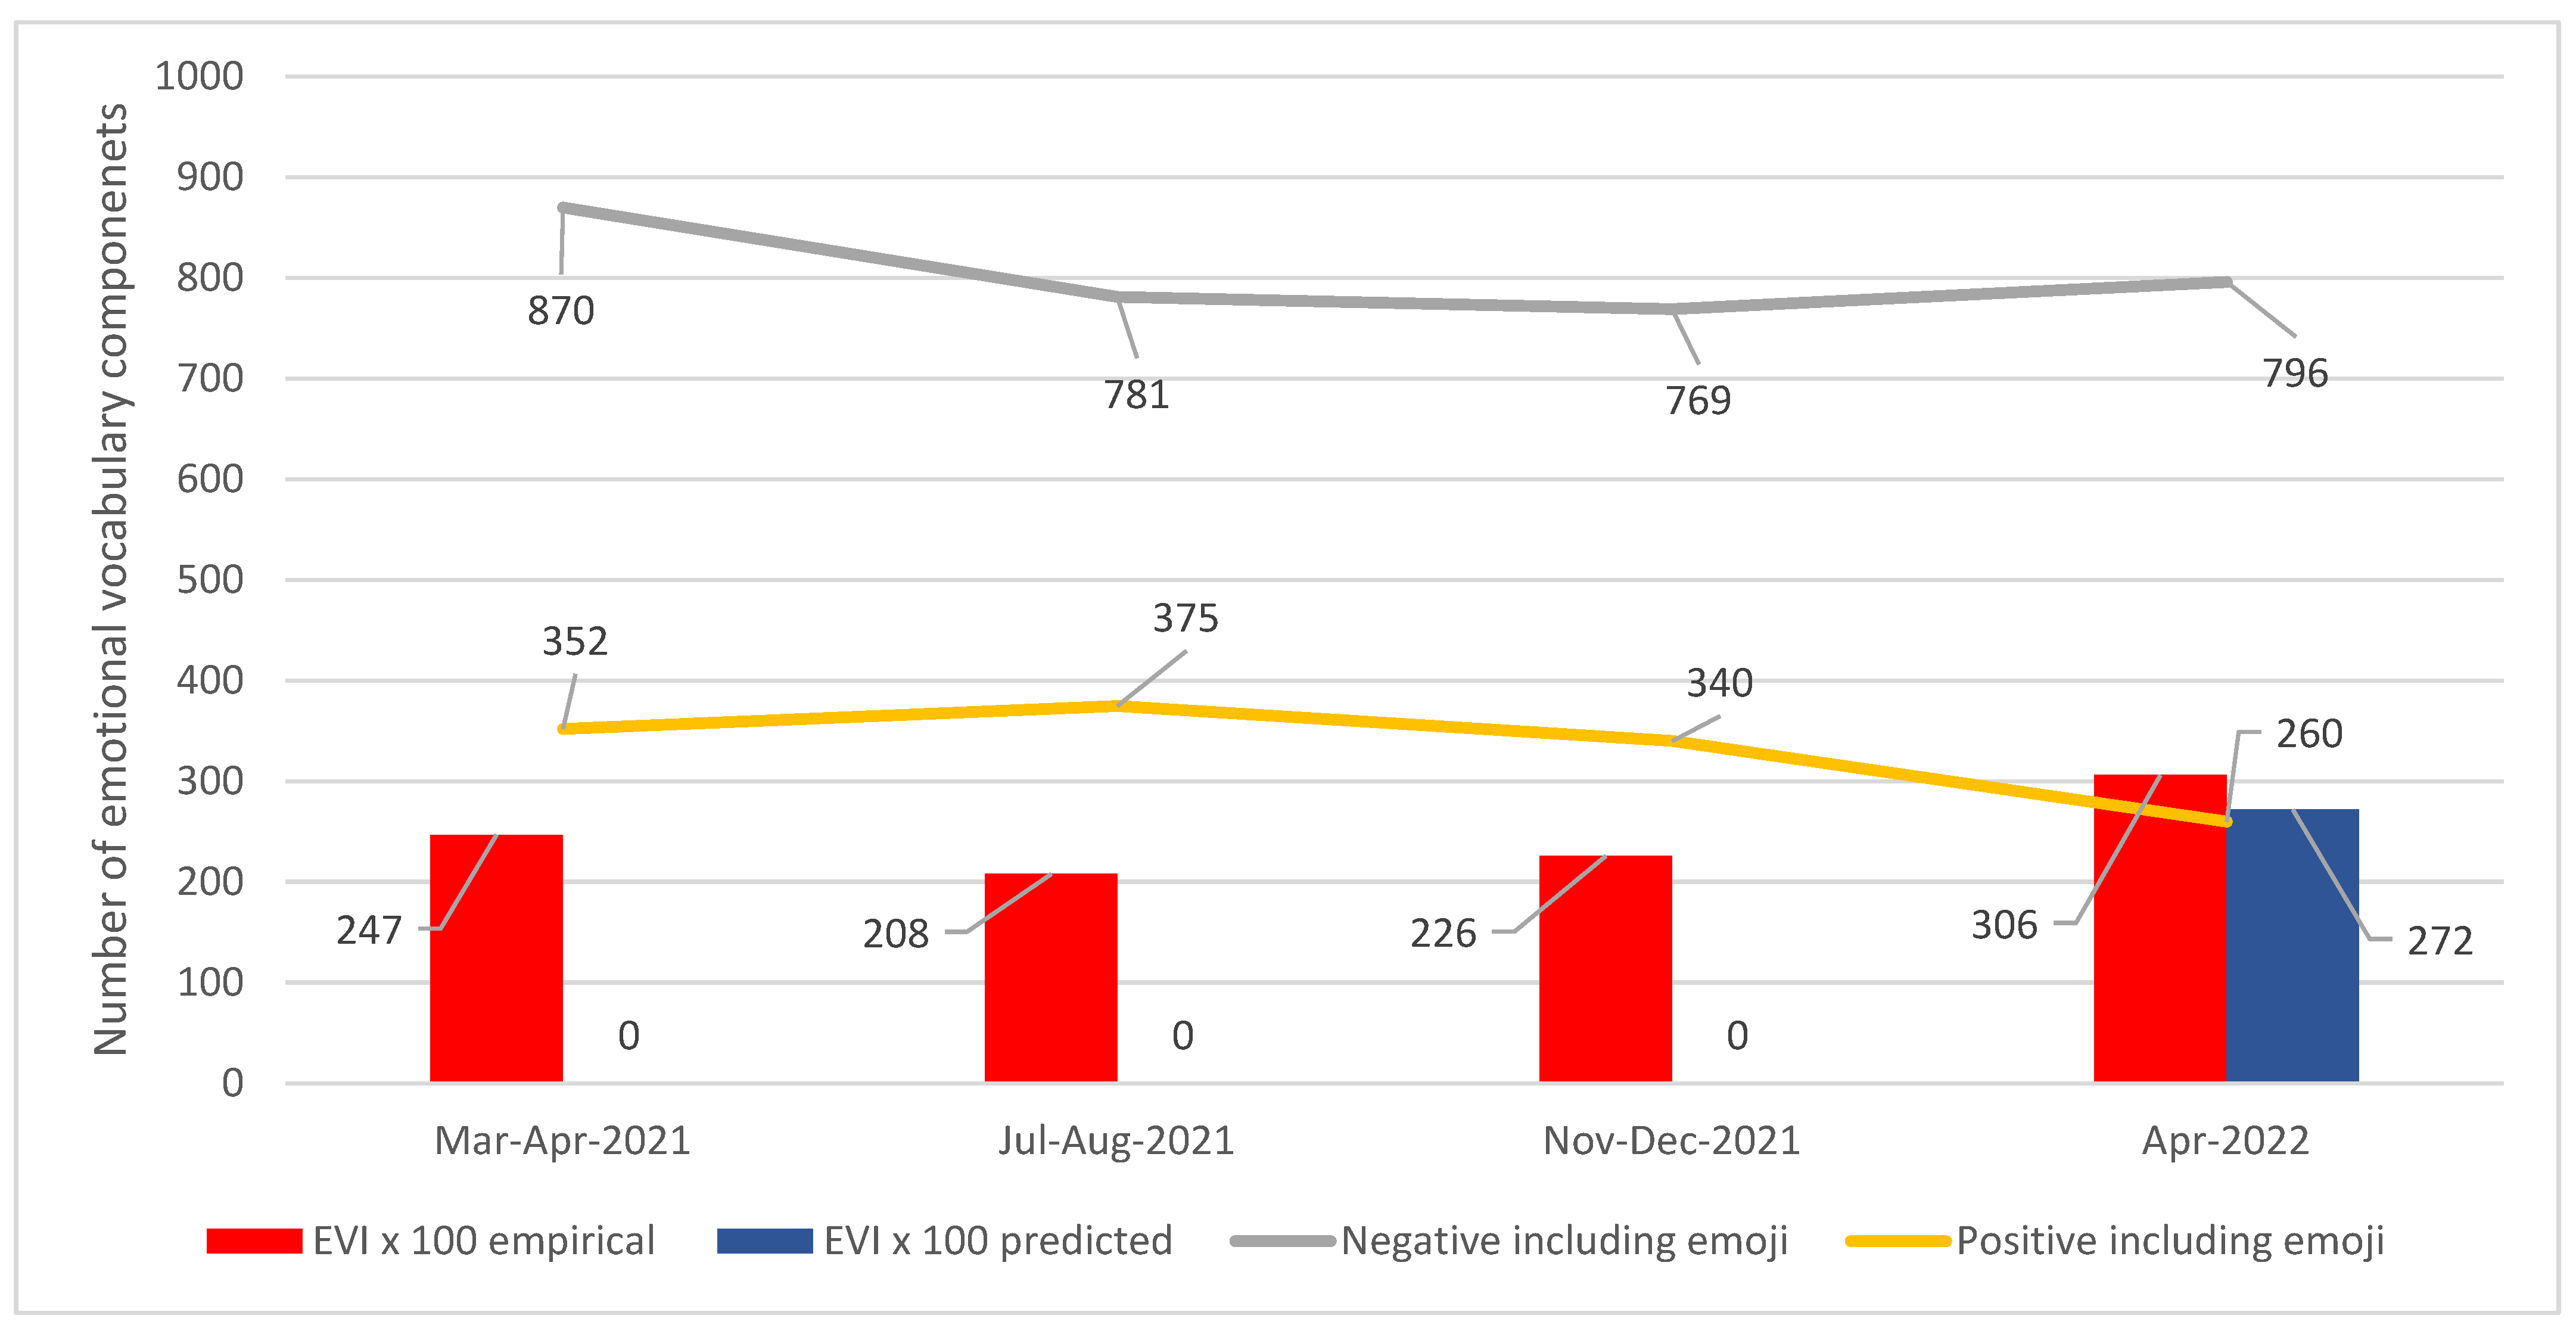
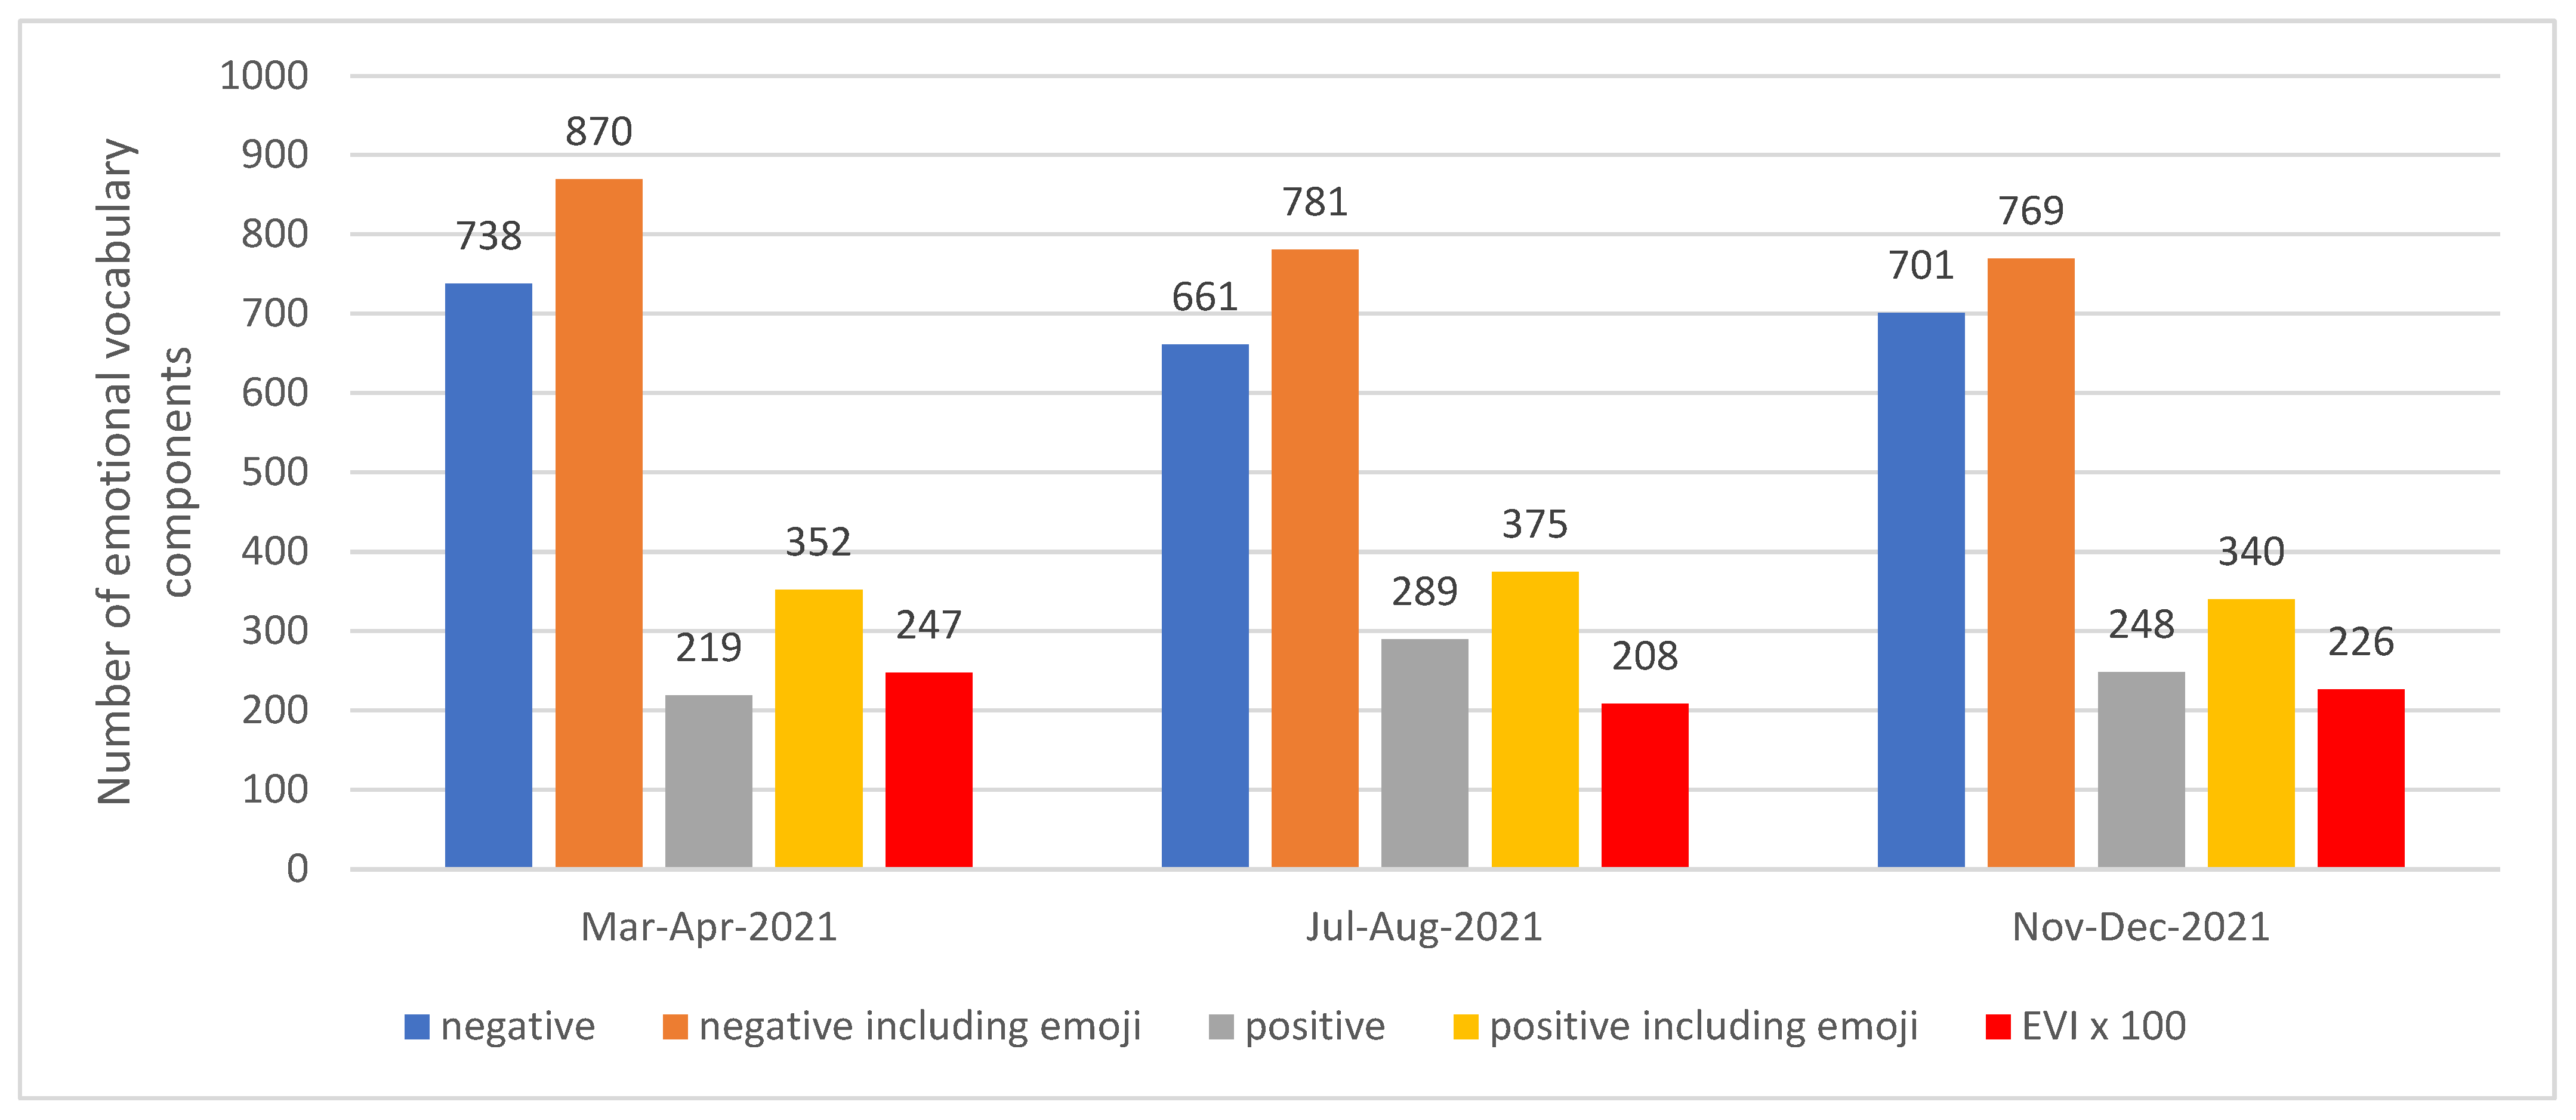
For each collection of tweets, the total frequency of negative and positive vocabulary was calculated and then recalculated for 1000 tweets (Figure 2). Graphical representations of the Emotional Vocabulary Index (EVI) values are shown in Figure 2 (red columns).
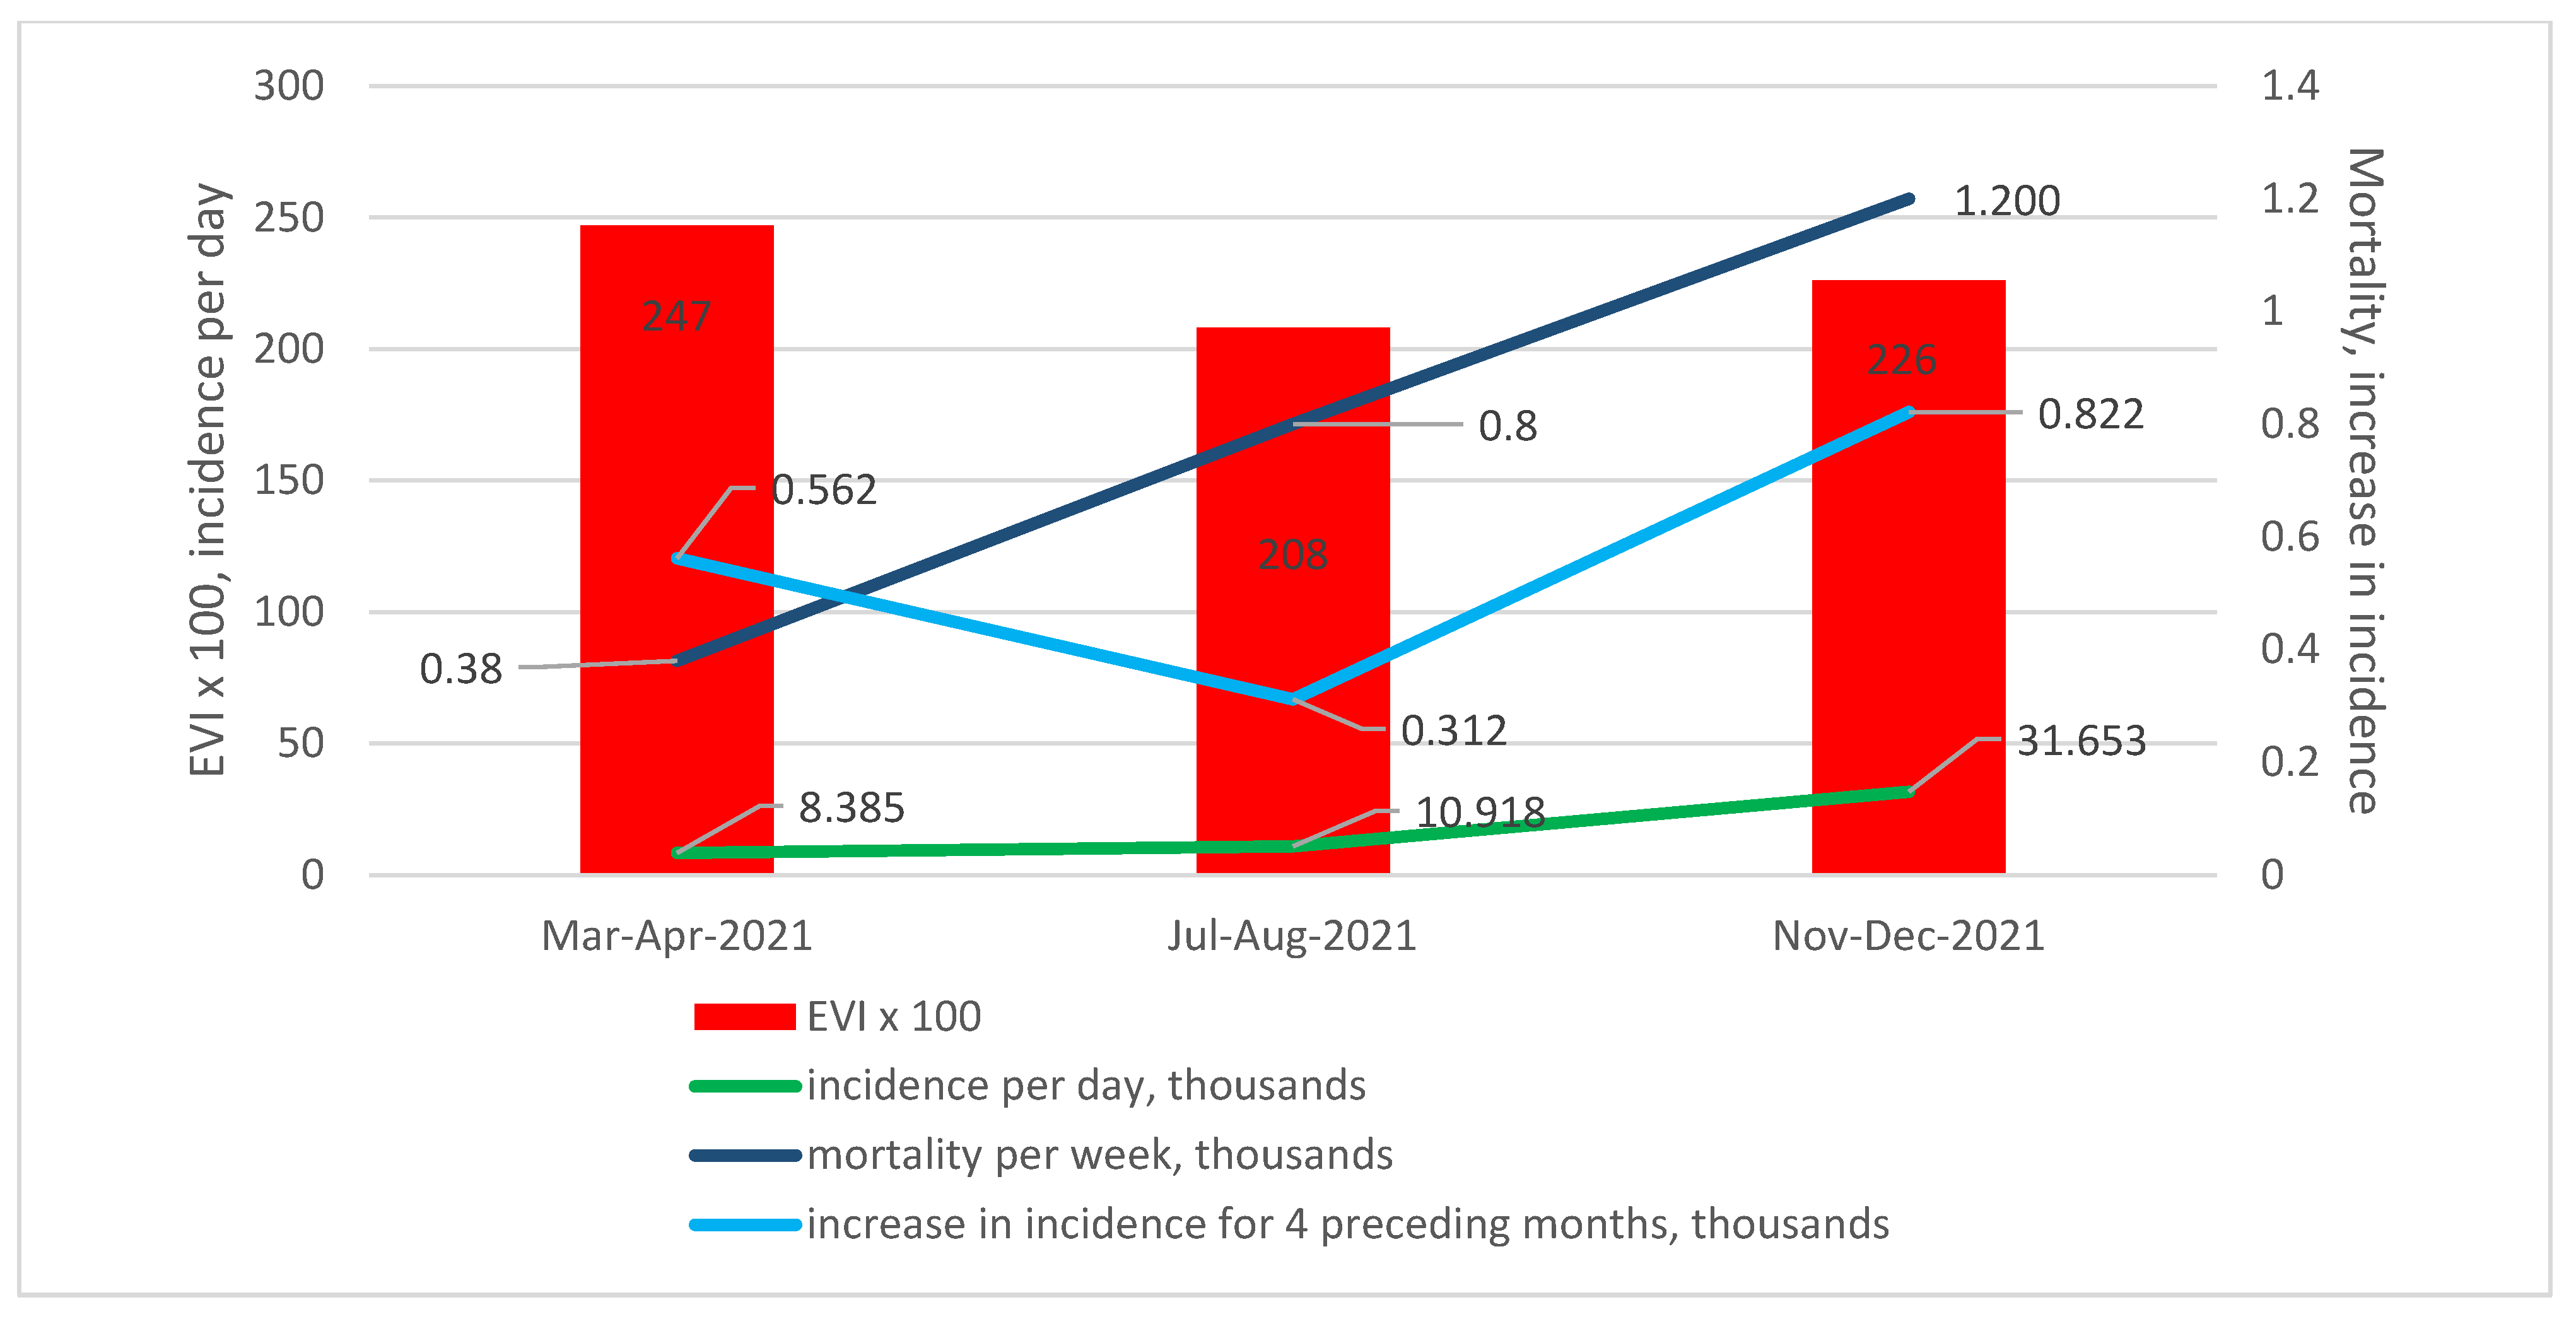
Among the indicators characterizing the pandemic in the Russian Federation, the following were considered: (1) The average mortality per week (for the period of publication of the tweets of the collection); (2) The average incidence per day (over the period of publication of the collection); (3) Average increase in incidence (thousand people) for 4 months preceding the period of publication of tweets (Figure 3). The indicators were calculated according to coronavirus monitor information [50].
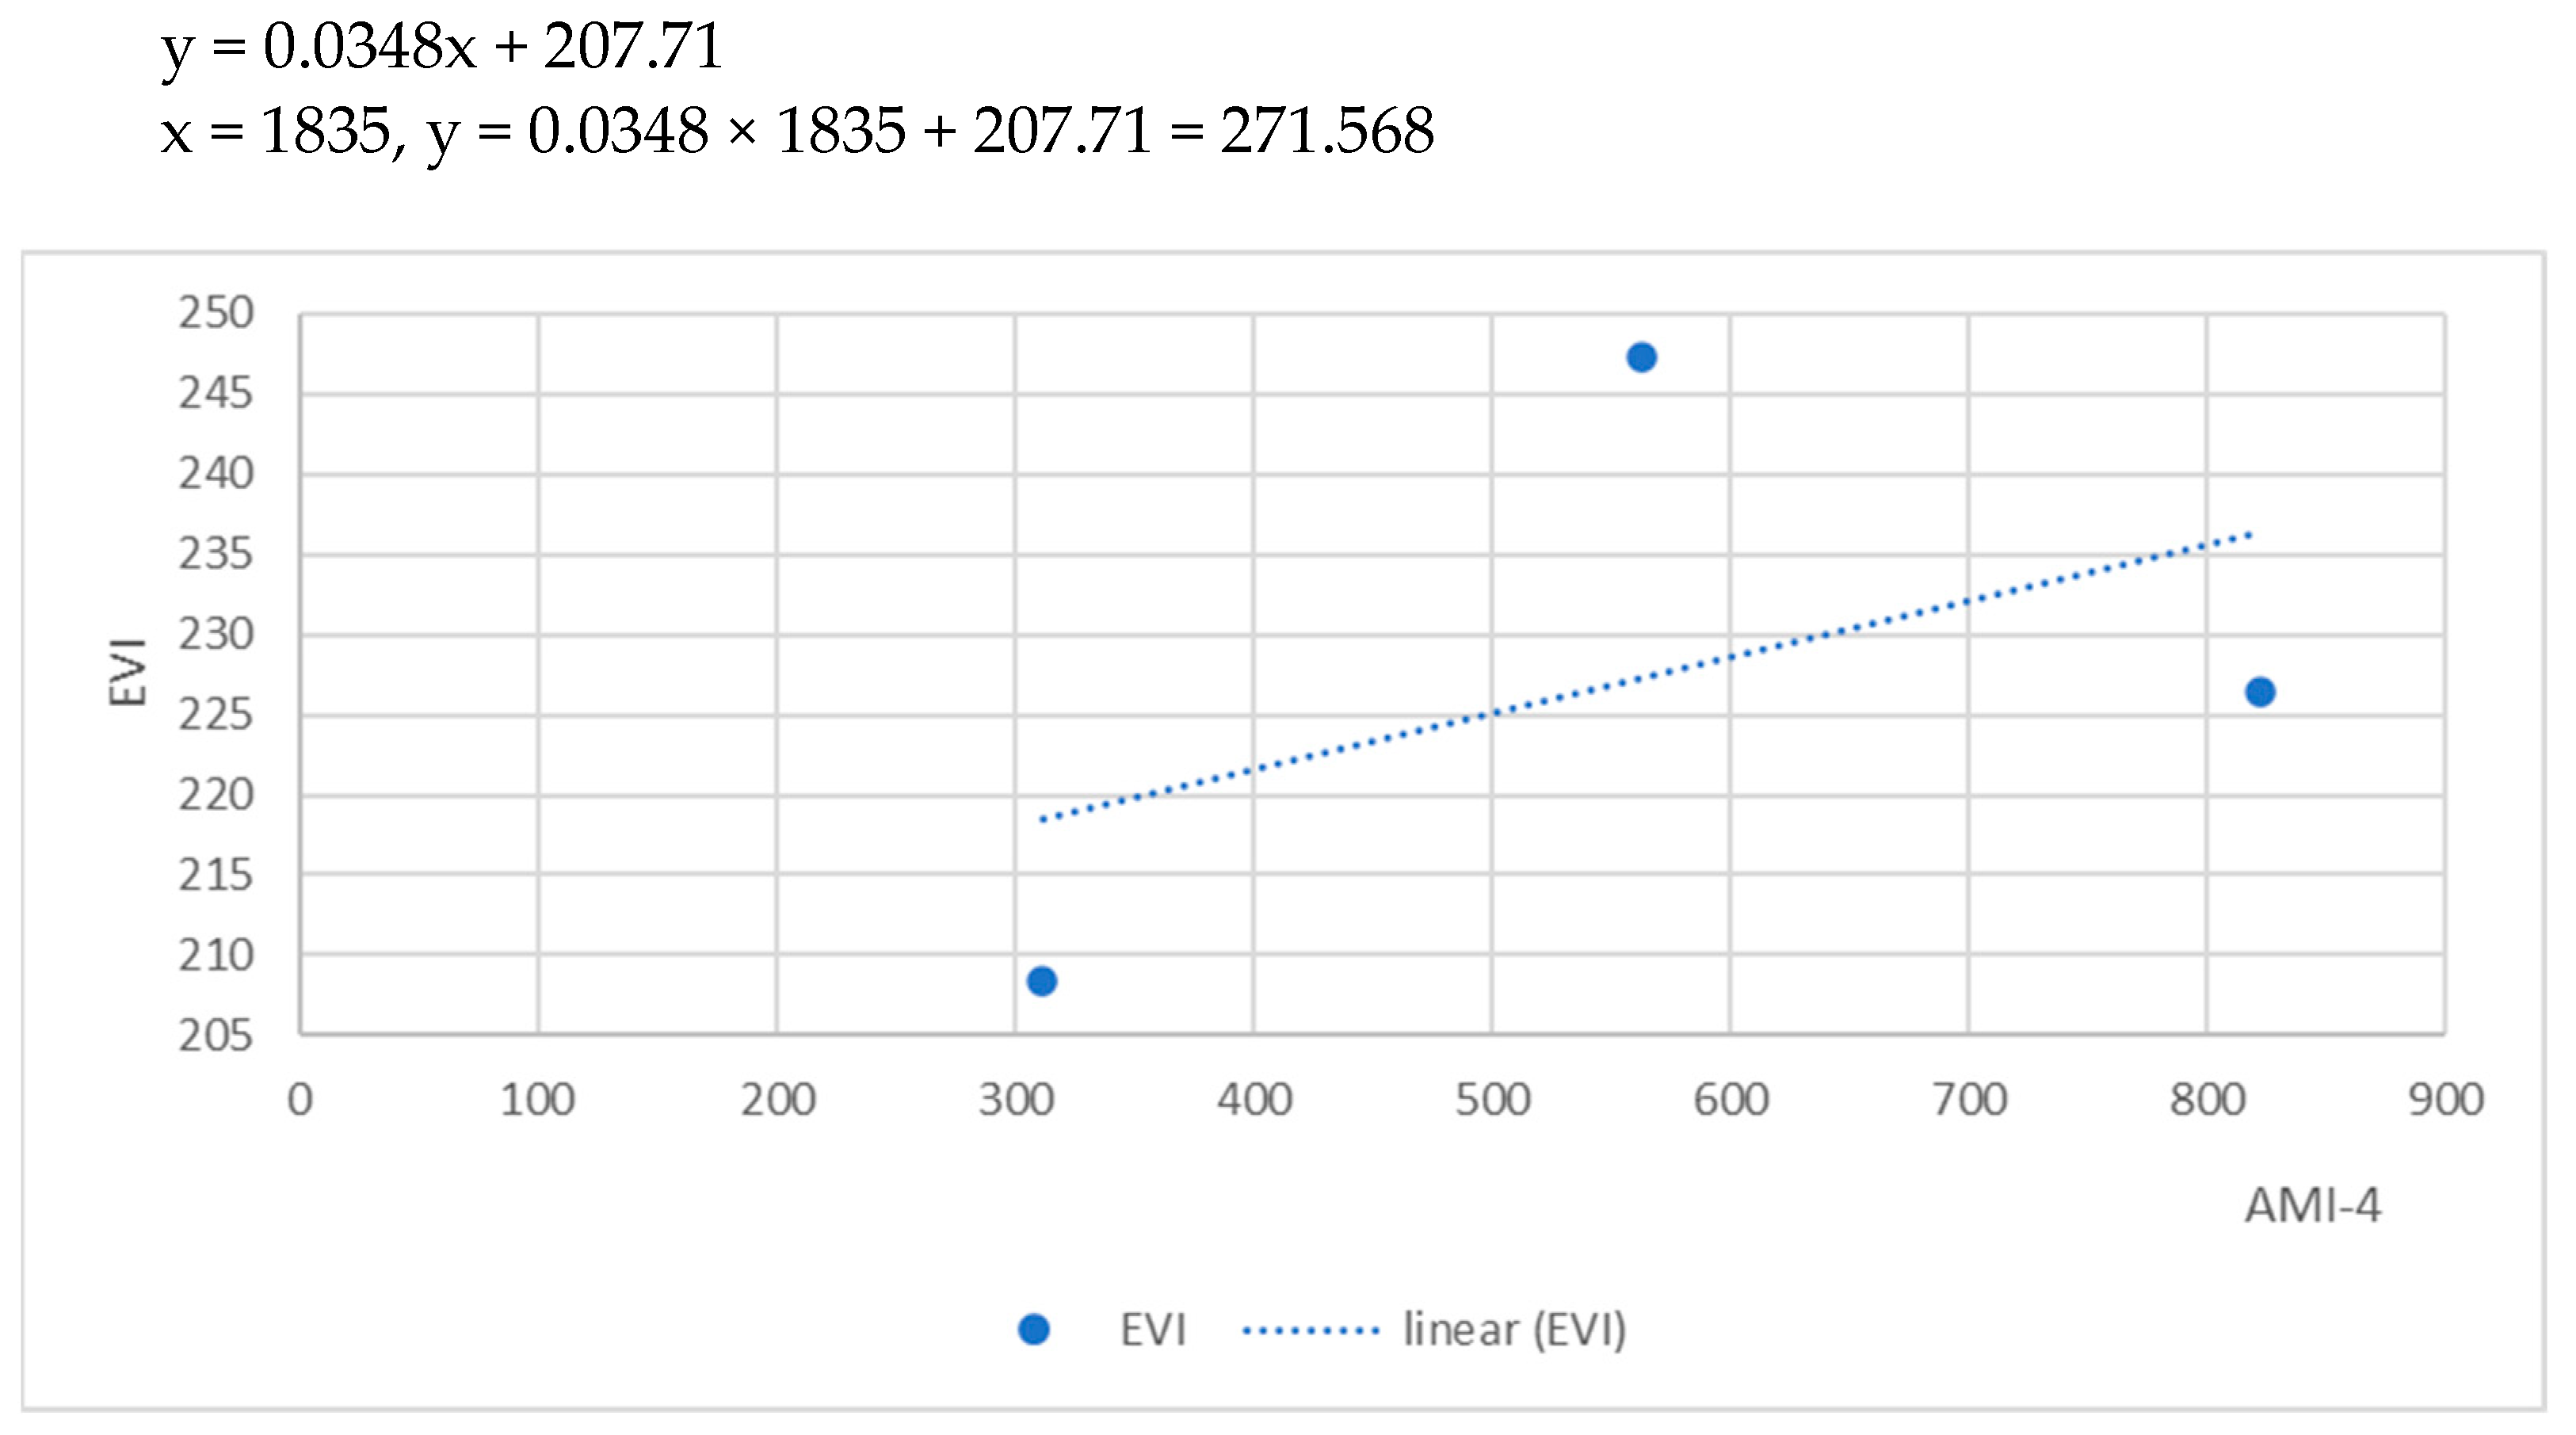
As an indicator characterizing the pandemic, the average monthly increase in the incidence of coronavirus in the Russian Federation for four months preceding the period of collecting tweets (AMI-4) was chosen, since a correlation was found between the EVI and this indicator, R = 0.518.
Considering the trend equation, the EVI value for April 2022 was predicted (Figure 4):
The predicted value was 271.57. A check was made on the collection of tweets for April 2022. The calculated value of EVI is 306.15 (Figure 5). Therefore, the prediction accuracy is 88.75%.
The accuracy was calculated as the ratio of the calculated value to the empirical value, expressed as a percentage.

5. Discussion

A model for ranking the degree of emotional coloring (tonality) of tweets using statistical approaches is developed. Methods for calculating special coefficients (index of psychological tension, index of subjective well-being) are proposed.
The proposed compiled socio-psychological dictionaries for vocabulary and emojis differ from the existing ones in the following ways:
This dictionary contains ranked terms and emojis based on five ranks (−2, −1, 0, +1, +2), where rank “−2” corresponds to strongly negative emotions, rank “−1” to moderately negative emotions, rank “0” to neutral emotional coloring, rank “+1” to moderately positive emotions, and rank “+2” to strongly positive emotions. In existing works, as a rule, a smaller number of ranks are used. The ranks “−1, 0, +1” are used to create a lexicon of emoticon moods in [51]. The same ranks were used to assign values to emoticons based on the mood of the tweets [52].
The novelty of the proposed approach is to rank emojis by mood, considering both the mood of tweets and the dictionary meanings of emojis. A novel method for involuntary calculation of the IPT index based on a sentiment analysis of tweets and on previously developed thematic ranked dictionaries has been proposed. Words, expressions, and emojis in the tweets are assigned ranking values taken from dictionaries. The index of psychological tension is proposed to be calculated as the total value of the ranks of emotionally charged words and emojis for each tweet. The author’s program for the automated calculation of the IPT is developed.
Additionally, a novel method was developed to assess the dynamics of the psychological state of social network users as a reflection of their subjective well-being, which is proposed to be defined as the average value of the subjective well-being index (SWI) of a particular user’s messages for a certain period, as the individual IPT.
The study was limited by: (1) geographical limitations for predictive analysis; (2) time constraints (selected periods of time); (3) only tweets in Russian and English were considered; and (4) a subjective approach when assigning ranks to terms and emojis within the framework of sentiment analysis.
Further research will focus on extracting new knowledge on infectious diseases from scientific publications and social networks.
6. Conclusions

This paper analyzes approaches to determining the emotional state of Twitter users because of the coronavirus pandemic and proposes methods for assessing their psychological state. The assessment of the user’s emotional intensity is based on the use of word and emoji dictionaries ranked by the degree of emotional intensity. An Index of Psychological Tension (IPT) has been proposed. It is calculated as the sum of the ranks of emotionally charged words and emojis for each tweet, which shows the emotional coloring of the tweet, considering the emojis used and informal spellings of words. At the same time, it is proposed to consider the repetition of emojis as enhancement of the emotional charge of the message and the total number of words in a tweet. For the collected tweets, the average IPT is evaluated.
A method for predictive analysis of the growth of psychological tension based on the ranking of the Emotional Vocabulary Index (EVI) has been created.

Author Contributions

Writing—original draft, data curation, methodology, funding acquisition and editing by A.K. and B.S.; data curation, methodology, software implementation, paper review and editing by O.Z.; draft preparation, software implementation and funding support by B.S.; review editing, data curation, software implementation and methodology by S.A.; Writing—original draft, review and editing, and methodology by S.K.J. All authors have read and agreed to the published version of the manuscript.

Funding

This research received no external funding.

Institutional Review Board Statement

Not applicable.

Informed Consent Statement

Not applicable.

Data Availability Statement

Datasets related to this article can be found at: https://github.com/AidaKh155/Sentiment-analysis; http://bigwer.ru/zol2/index.html (accessed on 2 April 2023).

Conflicts of Interest

The authors declare no conflict of interest.

References

  1. World Health Organization. 2019 Novel Coronavirus (2019-nCoV): Strategic Preparedness and Response Plan; World Health Organization: Geneva, Switzerland, 2020. [Google Scholar]
  2. Khakimova, A.K.; Zolotarev, O.V.; Berberova, M.A. Coronavirus infection study: Bibliometric analysis of publications on COVID-19 using PubMed and Dimensions databases. Sci. Vis. 2020, 12, 112–119. [Google Scholar] [CrossRef]
  3. Manguri, K.H.; Ramadhan, R.N.; Amin, P.R.M. Twitter sentiment analysis on worldwide COVID-19 outbreaks. Kurd. J. Appl. Res. 2020, 54–65. [Google Scholar] [CrossRef]
  4. Prabha, B.; Kaur, S.; Singh, J.; Nandankar, P.; Jain, S.K.; Pallathadka, H. Intelligent predictions of Covid disease based on lung CT images using machine learning strategy. Mater. Today Proc. 2023, 80, 3744–3750. [Google Scholar] [CrossRef]
  5. Khakimova, A.; Zolotarev, O.; Zatsman, I. Principles of Forming a Strategy for Reducing the Psychological Tension of Social Network Users. Open Public Health J. 2022, 15, e187494452208185. [Google Scholar] [CrossRef]
  6. Ahmed, A.; Aziz, S.; Toro, C.T.; Alzubaidi, M.; Irshaidat, S.; Serhan, H.A.; Abd-Alrazaq, A.A.; Househ, M. Machine Learning Models to Detect Anxiety and Depression through Social Media: A Scoping Review. Comput. Methods Programs Biomed. Update 2022, 2022, 100066. [Google Scholar] [CrossRef]
  7. Hossain, M.; Rahman, M.; Trisha, N.F.; Tasnim, S.; Nuzhath, T.; Hasan, N.T.; Clark, H.; Das, A.; McKyer, E.L.J.; Ahmed, H.U.; et al. Prevalence of anxiety and depression in South Asia during COVID-19: A systematic review and meta-analysis. Heliyon 2021, 7, e06677. [Google Scholar] [CrossRef]
  8. Suwalska, J.; Napierała, M.; Bogdański, P.; Łojko, D.; Wszołek, K.; Suchowiak, S.; Suwalska, A. Perinatal Mental Health during COVID-19 Pandemic: An Integrative Review and Implications for Clinical Practice. J. Clin. Med. 2021, 10, 2406. [Google Scholar] [CrossRef] [PubMed]
  9. Zimbra, D.; Abbasi, A.; Zeng, D.; Chen, H. The state-of-the-art in Twitter sentiment analysis: A review and benchmark evaluation. ACMTrans. Manag. Inf. Syst. 2018, 9, 1–29. [Google Scholar] [CrossRef]
  10. Budiharto, W.; Meiliana, M. Prediction and analysis of Indonesia Presidential election from Twitter using sentiment analysis. J. Big Data 2018, 5, 51. [Google Scholar] [CrossRef] [Green Version]
  11. Benamara, F.; Cesarano, C.; Picariello, A.; Recupero, D.R.; Subrahmanianin, V.S. Sentiment analysis: Adjectives and verbs are better than adjectives alone. In Proceedings of the International Conference on Weblogs and Social Media, ICWSM, Boulder, CO, USA, 26–28 March 2007; Volume 7, pp. 203–206. [Google Scholar]
  12. Kukreja, V.; Dhiman, P.A. Deep Neural Network based disease detection scheme for Citrus fruits. In Proceedings of the 2020 IEEE International Conference on Smart Electronics and Communication (ICOSEC),, Trichy, India, 10–12 September 2020; pp. 97–101. [Google Scholar]
  13. Chetviorkin, I.; Loukachevitch, N. Extraction of Russian sentiment lexicon for product meta-domain. In Proceedings of the COLING, Mumbai, India, 8–15 December 2012; pp. 593–610. [Google Scholar]
  14. Chetviorkin, A.; Loukachevitch, A. Evaluating Sentiment Analysis Systems in Russian. In Proceedings of the 4th Biennial International Workshop on Balto-Slavic Natural Language Processing, Sofia, Bulgaria, 8–9 August 2013; pp. 12–17. [Google Scholar]
  15. Pazelskaya, A.G.; Soloviev, A.N. A method for determining emotions in Russian texts. In Computational Linguistics and Intelligent Technologies; Annual math. conf. “Dialogue”; Russian State University for the Humanities: Moscow, Russia, 2011; pp. 574–586. [Google Scholar]
  16. Alekseeva, S.V.; Koltsov, S.N.; Koltsova, O.Y. Linis-crowd.org: A lexical resource for analyzing the sentiment of socio-political texts in Russian. Computational linguistics and computational ontologies: A collection of scientific articles. In Proceedings of the XVIII Joint Conference “Internet and Modern Society” (IMS-2015), St. Petersburg, Russia, 23–25 June 2015; pp. 23–25. [Google Scholar]
  17. Agrawal, S.; Jain, S.K.; Sharma, S.; Khatri, A. COVID-19 Public Opinion: A Twitter Healthcare Data Processing Using Machine Learning Methodologies. Int. J. Environ. Res. Public Health 2023, 20, 432. [Google Scholar] [CrossRef]
  18. Kukreja, V. A retrospective study on handwritten mathematical symbols and expressions: Classification and recognition. Eng. Appl. Artif. Intell. 2021, 103, 104292. [Google Scholar]
  19. Pfeifer, V.A.; Armstrong, E.L.; Lai, V.T. Do all facial emojis communicate emotion? The impact of facial emojis on perceived sender emotion and text processing. Comput. Hum. Behav. 2022, 126, 107016. [Google Scholar] [CrossRef]
  20. Derks, D.; Bos, A.E.; Von Grumbkow, J. Emoticons and social interaction on the Internet: The importance of social context. Comput. Hum. Behav. 2007, 23, 842–849. [Google Scholar] [CrossRef]
  21. Alamoodi, A.H.; Zaidan, B.B.; Zaidan, A.A.; Albahri, O.S.; Mohammed, K.I.; Malik, R.Q.; Almahdi, E.M.; Chyad, M.A.; Tareq, Z.; Albahri, A.S.; et al. Sentiment analysis and its applications in fighting COVID-19 and infectious diseases: A systematic review. Expert Syst. Appl. 2021, 167, 114155. [Google Scholar] [CrossRef]
  22. Chen, E.; Lerman, K.; Ferrara, E. Tracking social media discourse about the COVID-19 pandemic: Development of a public corona virus Twitter data set. JMIR Public Health Surveill. 2020, 6, e19273. [Google Scholar] [CrossRef]
  23. Almishal, A.; Alharbi, F.; Alharthi, R. Sentiment analysis of Twitter data during COVID-19 outbreak. In International Conference on Intelligent Computing and Optimization; Springer: Berlin/Heidelberg, Germany, 2021; pp. 67–76. [Google Scholar]
  24. Abdel-Basset, M.; Mohamed, M.; Jiang, C.; Zhang, Q. Sentiment analysis and topic modeling of Twitter data during the COVID-19 pandemic: Case study of the United States. J. Med. Syst. 2021, 45, 1–13. [Google Scholar]
  25. Cao, W.; Fang, Z.; Hou, G.; Han, M.; Xu, X.; Dong, J.; Zheng, J. The psychological impact of the COVID-19 epidemic on college students in China. Psychiatry Res. 2020, 287, 112934. [Google Scholar] [CrossRef] [PubMed]
  26. Li, H.; Luo, J.; Xu, C.; Tang, Q. Using topic modeling to explore the psychological tension of netizens under COVID-19. J. Comput. 2020, 15, 151–162. [Google Scholar]
  27. Liao, X.; Liu, X.; Sun, X.; Yang, C.; Li, Z.; Zhang, H. Network analysis of COVID-19 Twitter data: Implications for social support and mental health services. Int. J. Environ. Res. Public Health 2021, 18, 1109. [Google Scholar]
  28. Gao, J.; Zheng, P.; Jia, Y.; Chen, H. Natural language processing to extract and study people’s emotions on social media during a crisis: A case study of COVID-19. Inf. Process. Manag. 2021, 58, 102440. [Google Scholar]
  29. Samuel, J.; Ali, G.G.M.N.; Rahman, M.M.; Esawi, E.; Samuel, Y. COVID-19 Public Sentiment Insights and Machine Learning for Tweets Classification. Information 2020, 11, 314. [Google Scholar] [CrossRef]
  30. Bhat, M.; Qadri, M.; Noor-ul-Asrar Beg, M.K.; Ahanger, N.; Agarwal, B.J.B. Sentiment Analysis of Social Media Response on the COVID19 Outbreak. Brain Behav. Immun. 2020, 87, 136–137. [Google Scholar] [CrossRef]
  31. Lwin, M.O.; Lu, J.; Sheldenkar, A.; Schulz, P.J.; Shin, W.; Gupta, R.; Yang, Y. Global Sentiments Surroundingthe COVID-19 Pandemic on Twitter: Analysis of Twitter Trends. JMIR Public Health Surveill. 2020, 6, e19447. [Google Scholar] [CrossRef] [PubMed]
  32. Thakur, N.; Han, C.Y. An Exploratory Study of Tweets aboutthe SARS-CoV-2 Omicron Variant: Insightsfrom Sentiment Analysis, Language Interpretation, Source Tracking, Type Classification, and Embedded URL Detection. COVID 2022, 2, 1026–1049. [Google Scholar] [CrossRef]
  33. Rosenberg, H.; Syed, S.; Rezaie, S. The Twitter Pandemic: The Critical Roleof Twitter in the Dissemination of Medical Information and Misinformationduringthe COVID-19 Pandemic. Can. J. Emerg. Med. 2020, 22, 418–421. [Google Scholar] [CrossRef] [Green Version]
  34. Agrawal, M.; Agrawal, S. A Systematic Review on Artificial Intelligence/Deep Learning Applications and Challenges to Battle against COVID-19 Pandemic. Disaster Adv. 2021, 14, 90–99. [Google Scholar] [CrossRef]
  35. Fang, X.; Zhan, J. Sentiment Analysis Using Product Review Data. J. Big Data 2015, 2, 5. [Google Scholar] [CrossRef] [Green Version]
  36. Gann, W.-J.K.; Day, J.; Zhou, S. Twitter Analytics for Insider Trading Fraud Detection System. In Proceedings of the Second ASE International Conference on Big Data, ASE, Beijing, China, 27–31 May 2014. [Google Scholar]
  37. Ahmad, S.; Chandra, U.; Tyagi, N. Sentiment Index and Sentiment Score of Mobile Phones. Int. J. Res. Eng. Appl. Manag. 2019, 4, 11. [Google Scholar]
  38. Singh, S.K.; Paul, S. Sentiment Analysis of Social Issues and Sentiment Score Calculationof Negative Prefixes. Int. J. Appl. Eng. Res. 2015, 10, 1694–1699. [Google Scholar]
  39. Krishnan, H. Sentiment Analysis of Tweets for Inferring Popularityof Mobile Phones. Int. J. Comput. Appl. 2017, 157, 2–4. [Google Scholar]
  40. Panchenko, A.I. Sentiment Index of the Russian Speaking Facebook. Available online: https://arxiv.org/ftp/arxiv/papers/1808/1808.07851.pdf (accessed on 25 March 2023).
  41. Abd-Alrazaq, A.; Alhuwail, D.; Househ, M.; Hamdi, M.; Shah, Z. Top Concerns of Tweeters During the COVID-19 Pandemic: Info-Veillance Study. J. Med. Internet Res. 2020, 22, e19016. [Google Scholar] [CrossRef] [Green Version]
  42. Barkur, G.; Vibha, G.B.K. Sentiment Analysis of Nationwide Lockdown Due to COVID-19 Outbreak: Evidence from India. Asian J. Psychiatr. 2020, 51, 102089. [Google Scholar] [CrossRef]
  43. Rustam, F.; Khalid, M.; Aslam, W.; Rupapara, V.; Mehmood, A.; Choi, G.S. A Performance Comparison of Supervised Machine Learning Models for COVID-19 Tweets Sentiment Analysis. PLoS ONE 2021, 16, e0245909. [Google Scholar] [CrossRef]
  44. Naseem, U.; Razzak, I.; Khushi, M.; Eklund, P.W.; Kim, J. Covidsenti: A Large-Scale Benchmark Twitter Dataset for COVID-19 Sentiment Analysis. IEEE Trans. Comput. Soc. Syst. 2021, 8, 1003–1015. [Google Scholar] [CrossRef]
  45. Zhang, S.; Zheng, D.; Hu, X.; Yang, M. Bidirectional Long Short-Term Memory Networks for Relation Classification. In Proceedings of the 29th Pacific Asia Conference on Language, Information, and Computation, Shanghai, China, 30 October–1 November 2015; pp. 73–78. [Google Scholar]
  46. Sanders, A.; White, R.; Severson, L.; Ma, R.; McQueen, R.; Paulo, H.C.A.; Zhang, Y.; Erickson, J.S.; Bennett, K.P. Unmasking the Conversation on Masks: Natural Language Processing for Topical Sentiment Analysis of COVID-19 Twitter Discourse. AMIA Jt. Summits Transl. Sci. Proc. 2021, 2021, 555–564. [Google Scholar] [PubMed]
  47. Jalil, Z.; Abbasi, A.; Javed, A.R.; Badruddin Khan, M.; Abul Hasanat, M.H.; Malik, K.M.; Saudagar, A.K.J. COVID-19 Related Sentiment Analysis Using State-of-the-Art Machine Learning and Deep Learning Techniques. Front. Public Health 2022, 9, 812735. [Google Scholar] [CrossRef] [PubMed]
  48. The Globe and Mail. Patients Died from Neglect, Not COVID-19, in Ontario LTC Homes, Military Report Finds: ‘All They Needed Was Water and a Wipe Down’. Available online: https://www.theglobeandmail.com/canada/article-canadian-military-report-documents-deplorable-conditions-at-two/ (accessed on 25 April 2023).
  49. Lorraine Gouveia. Obituary. Sharing Memories. Available online: https://www.arbormemorial.ca/brampton/obituaries/lorraine-gouveia/65404 (accessed on 25 April 2023).
  50. Ottawa Citizen. Dave Dutton (1951–2021): A ‘Lovable Curmudgeon’—COVID Claims Motorcycle-Racing Editor. Available online: https://ottawacitizen.com/news/local-news/dave-dutton-1951-2021-a-loveable-curmudgeon-covid-claims-motorcycle-racing-editor#:~:text=Dutton%2C%20who%20died%20Friday%20afternoon,mentored%2C%20loved%20him%20for%20it (accessed on 29 April 2023).
  51. Tomažič, T.; Mišič, K.U. Parliament-Citizen Communication in Terms of Local Self-Government and Their Use of Social Media in the European Union. Lex Localis-J. Local Self-Gov. 2019, 17, 4. [Google Scholar]
  52. Kralj Novak, P.; Smailović, J.; Sluban, B.; Mozetič, I. Sentiment of Emojis. PLoS ONE 2015, 10, e0144296. [Google Scholar] [CrossRef] [Green Version]
Figure 1. SWI results from Twitter user @e****** (Canada) for the period from January 2021 to January 2023 compared to cases of COVID-19 (average weekly incidence of COVID per month, one tenth) and monkey pox (cases per month) in Canada.
Sustainability 15 10008 g001
Figure 2. Emotional Vocabulary Index (EVI), and the frequency of emotionally charged terms and emojis (emotional vocabulary components) used in tweets discussing the corona virus, per 1000 tweets.
Sustainability 15 10008 g002
Figure 3. Emotional Vocabulary Index (EVI) with indicators that characterize the pandemic.
Sustainability 15 10008 g003
Figure 4. Correlation–regression analysis of the relationship between EVI and AMI-4. EVI—Emotional Vocabulary Index. AMI-4—average monthly increase in the incidence of coronavirusin the Russian Federation for 4 months preceding the period of collecting tweets.
Sustainability 15 10008 g004
Figure 5. Emotional Vocabulary Index (EVI) (empirical and predicted) and the frequency of emotionally charged terms and emojis (emotional vocabulary components) used in tweets discussing the coronavirus, per 1000 tweets.
Sustainability 15 10008 g005
Table 1. Characteristics of collections of Russian-language tweets for different periods of time.
PeriodCollection 1Collection 2Collection 3
From 28 March 2021 to 26 April 2021From 30 June 2021 to 31 August 2021From 20 November 2021 to 8 December 2021
Number of tweets17,86912,4816245
Number of original tweets14,22369583755
Number of Russian-language tweets (after the removal of other Cyrillic languages)12,60465133495
Number of tweets (after the removal of pandemic updates and news)394727142480
Number of tweets after filtering (removing incoherent answers)174111821101
Table 2. Examples of ranked terms and phrases from tweets discussing infertility and corona virus.
Rank−2−1+1+2
1Brain fogaffected by the SARS-Cov-2 bragAmazing
2BitchAffectingboomBest
3ApocalypticaffectsbetterDoes not
4Abnormally shaped spermAffect sperm qualityavoidEnjoy
5AffectedaggravatedadequateExcellent
6AlarmBadalrightGood reason
7AnnihilationAdverse reactionamusingGreat
8CancerAffectHave babiesHope
9CatastrophicAffect fertilityhaving a babyLove
10ChaosAffect fertilityeffectiveLuck
11ClotAffect ofexcitesSafe
12Control of the populationabortionGoodSafely
13CrapAltergratitudeSafety
14CrisisautismcareSave
15Decreased motilityanti-fertilityinsightSaving lives
16Decreased spermbumpinspiration
17Deformed spermCame downinterestingNo evidence
18DeadCan causeIronicNo indication
19DeathCan impactironyNo link
20DecimatingCan leadhelpRecover
21CulpritCan messHow ironicStay alive
22DamageBeing sickimprovedSurvivor
23DestructionBirth defectincreasedThanks
24Diecatch COVIDmitigationTruth
Table 3. Examples of ranked emojis from tweets discussing infertility and coronavirus (adapted from https://www.emojiall.com/ru/search_results?keywords= (accessed on 27 March 2023)).
Rank−2−1+1+2
1💩 feces😮 surprise🌚 new moon, self-irony😁 glows with happiness
2👹 monster😕 confused😌 relieved😂 laughing to tears
3☠️ skull and bones😑 don’t care🔮 crystal ball, divination, wealth🤣 rolling with laughter
4😓 in a cold sweat😒 bored😉 winking🥰 smiling face with hearts
5🤬 censorship😬 grimace😜 shows tongue and winks😄 laughs with closed eyes
6😠 angry😐 without emotion😅 laughing nervously🤟🏻 I love you
7🤦 ♀️ speechless, no words, irritation🙈 I don’t see anything🙏 prayer, remembrance🤩 stars in the eyes, admiration, enthusiasm
8🤦 ♂️ speechless🤷 ♂️ shrugs☺️ smiles pretty☀️ sunshine, positive attitude
9😭 tears flowing😞 disappointment✊ raised fist, strength, power🥳 at a party
10😱 horrified😔 thinking🙂 slightly smiling❤️ scarlet heart, love
11🤯 brain explosion😳 blushing🌝 full moon smiles, self-irony🧡 orange heart, vitality
12🤮 vomiting😖 confused😏 grinning💖 sparkling heart, love
13😢 crying🙁 a little sad👌 everything is fine😍 loving face
14😲 shocked😶 silence and disappointment😋 delicious👍 thumb sup
15☣️ biohazard😼 grinning🤠 in a cowboy hat, freedom, fun😃 laughing
Table 4. Examples of negative/positive words and collocations of tweets from Twitter user @e****** (Canada) for the period from January 2021 to December 2021.
MonthNegative Words and Collocations (1)Positive Words and Collocations (2)Number of (1)Number of (2)Number of Tweets
JanuaryDeaths, heartbreaking, died, humanitarian crisis, killed, desperately, heavy damage, 💔Hope, Proud, happy, amazing folks, Vaccines are powerful, thankful331755
FebruaryEnemy, dies with corona virus, death, racial inequality, Shocking, unfair, killed, wrong direction, very scaryBrave, great, loved, Hope, save lives, brilliant3310110
MarchDeath, “alarming rates”, scandal, deeply saddened, extreme stress, Heartbreaking, dies of COVID-19Amazing, positive impact of vaccines, hope, 🙏6128184
April😢, will die, much worse, dies of #COVID19, so much alarm, very bad, policy failure tsunamis, desperate time, disaster, 😯, shockingHope, hopefully, helpful, beautiful tribute, 🎉, very good vaccine10432239
MayTerrible, died due to dehydration, lost a colleague to #COVID19, 💔, have died, tragically burned down, broken-heartedHoping, terrific work, great picture, braving, 😀8117137
JuneHorror, sadness, shock, All dead, life too fragile, COVID crisis, bad idea, very frustrating, deathsGreat progress, Grateful, great news, Amazing, highly effective, good day, ❤️5640135
July Dangerous, epidemiological stupidity, victims, unfortunately, 😷, 🤔, insane, One of the scariest things, ShockingBrave, love, Beautifully, super nice, wonderful story, help keep everyone safe, help save lives232781
AugustDeaths, 💩, anxiety, crying, sadness, died, suffer, dangerous, troubling, died of #COVID19, hellHelping, ❤️, safety, save lives 🙏🏽, amazing4832119
Septemberstressed, burnt out, disbelief, saddened, dangerous, deaths, tragic, disheartening, terrifying, 🤬Help, wonderful, kindness, safety9628156
Octoberdie alone, scary, crisis, horrifying inequity, died, Saddened, COVID-19 deaths, tragic lossHope, help, enjoying, beautiful, excellent391880
NovemberDeath, killed, 🤦 ♀️, shocking, dead, died from COVID, 🤔, Disappointing, serious riskhelped save people, Help, fabulous, grateful, Hope6636176
DecemberDied, vaccine inequity, dangerous, stress, deeply troubling, worrisome, maddening, unacceptableIncredible, wonderful, hoping, help, careful11051295
Table 5. Examples of negative/positive words and collocations of tweets from Twitter user @e****** (Canada) for the period from January 2022 to January 2023.
MonthNegative Words and Collocations (1)Positive Words and Collocations (2)Number of (1)Number of (2)Number of Tweets
Januaryget worse, painful, staffing crisis, died, deaths, pandemic chaos, distress, burden, tragicWonderful, Hooray for community, encouraging, terrific, incredible support17854242
Februaryfurious mob, disheartening, distress, occupation, utter lawlessness, harassed🙏, 👏, Hope, great step, proud, victory16340467
MarchDevastating, terrible, death, society’s cracks, heartbreak, deaths from COVID, evil, 😷, Confusing timeunsung heroes, amazed, Grateful, ❤️, save lives5910159
Aprilrisk of dying because of COVID, suffering, damaged, died of COVID-19, 👀, terrible organ damageSuccess, great, astonishing, 😁, proud3322143
MayDeaths, occupation, feel unsafe, awful, Sad, pandemic tragedy, humiliationGreat, helped, fabulous, godsend3911126
Junehuge loss, lonely, worse nightmare, 😒, brunt of anger, deathsExcellent, victory, congratulate, successful, hope3818157
July staffing crisis, furious, vandal, Omicron ‘tsunami’, shocking, 😔, getting angrier, depressing as hellgood people, good protection, beautifully, 🙏, won25450
AugustKill, pandemic worsens, harassed, aggressive attacks, threats, and intimidation, shocking, getting worse, very troublingHelp, Amazing, very well done26370
SeptemberCrisis, harass, death, killed, dangerous, killer of humans, Terrifying, 🙄positive step forward, hope, help, 🙏, great victory23668
OctoberDeaths, the worst, disturbing, chaos, crisis, harassmentSuccessful, saves lives, victory, Bravo3314104
NovemberDevastating, deaths, Unfortunately, chaotic, chaos, crisis, anxious, panic, anger, 💔Helping, Friendly, magic, good thing449129
Decemberchildren’s hospital crisis, suicidal, die, deaths, very sadmost enthusiastic, good wishes, saved lives29569
January 2023dangerous, false, exhausting pandemic journey, health care crisis, 👀Dreaming, save, be safe, fun events15345
Table 6. Examples of negative emotional Russian vocabulary (translated to English) and negative emojis used in tweets discussing the coronavirus.
PeriodFrom 28 March 2021 to 26 April 2021From 30 June 2021 to 31 August 2021From 20 November 2021 to 8 December 2021
Number of tweets174111821101
Coronavirus references184812471205
Aggression, aggressive235
Hell, infernal612
Anti vaxxer, anti vaccinator-122
Apocalypse, apocalyptic111
Trouble, poor, poverty1256
Demon, infuriate, demonism, piss off553
Bio weapon, biological weapon5235
Afraid10106
Blame, guilty, culprit111215
Bastard, filth440
Evil, anger, spiteful, malice, angry9513
Death, mortality, lethal433427
Funeral, bury, burial221
Kill, killer392426
😭353913
😫1 1
😠-9 5
🤬-21
😱212
🤮-9-
🤢223
😡6184
🤡894
Table 7. Examples of positive Russian vocabulary (translated to English) and positive emojis used in tweets discussing the corona virus.
PeriodFrom 28 March 2021 to 26 April 2021From 30 June 2021 to 31 August 2021From 20 November 2021 to 8 December 2021
Thank you, give thanks4813
Great, greatness123
Splendid, splendor121
Believe, faith, believer61212
Be proud, proud13-
Kindness181810
The best252024
Love, beloved161714
Hope8311
Win9510169
Laugh, funny1682
🤣26728
😜412
🥰952
😂31249
🙂1165
😊536
❤️72-
Disclaimer/Publisher’s Note: The statements, opinions and data contained in all publications are solely those of the individual author(s) and contributor(s) and not of MDPI and/or the editor(s). MDPI and/or the editor(s) disclaim responsibility for any injury to people or property resulting from any ideas, methods, instructions or products referred to in the content.