Exploring Relationships between Spatial Pattern Change in Steel Plants and Land Cover Change in Tangshan City
Abstract
1. Introduction
2. Materials and Methods
2.1. Study Area
2.2. Data Source and Pre-Processing
2.3. Segmentation and Changing Region Identification of Steel Plants
2.4. Spatial Analysis
2.4.1. Kernel Density Estimation
2.4.2. Standard Deviational Ellipse
2.4.3. Bivariate Spatial Autocorrelation
3. Results
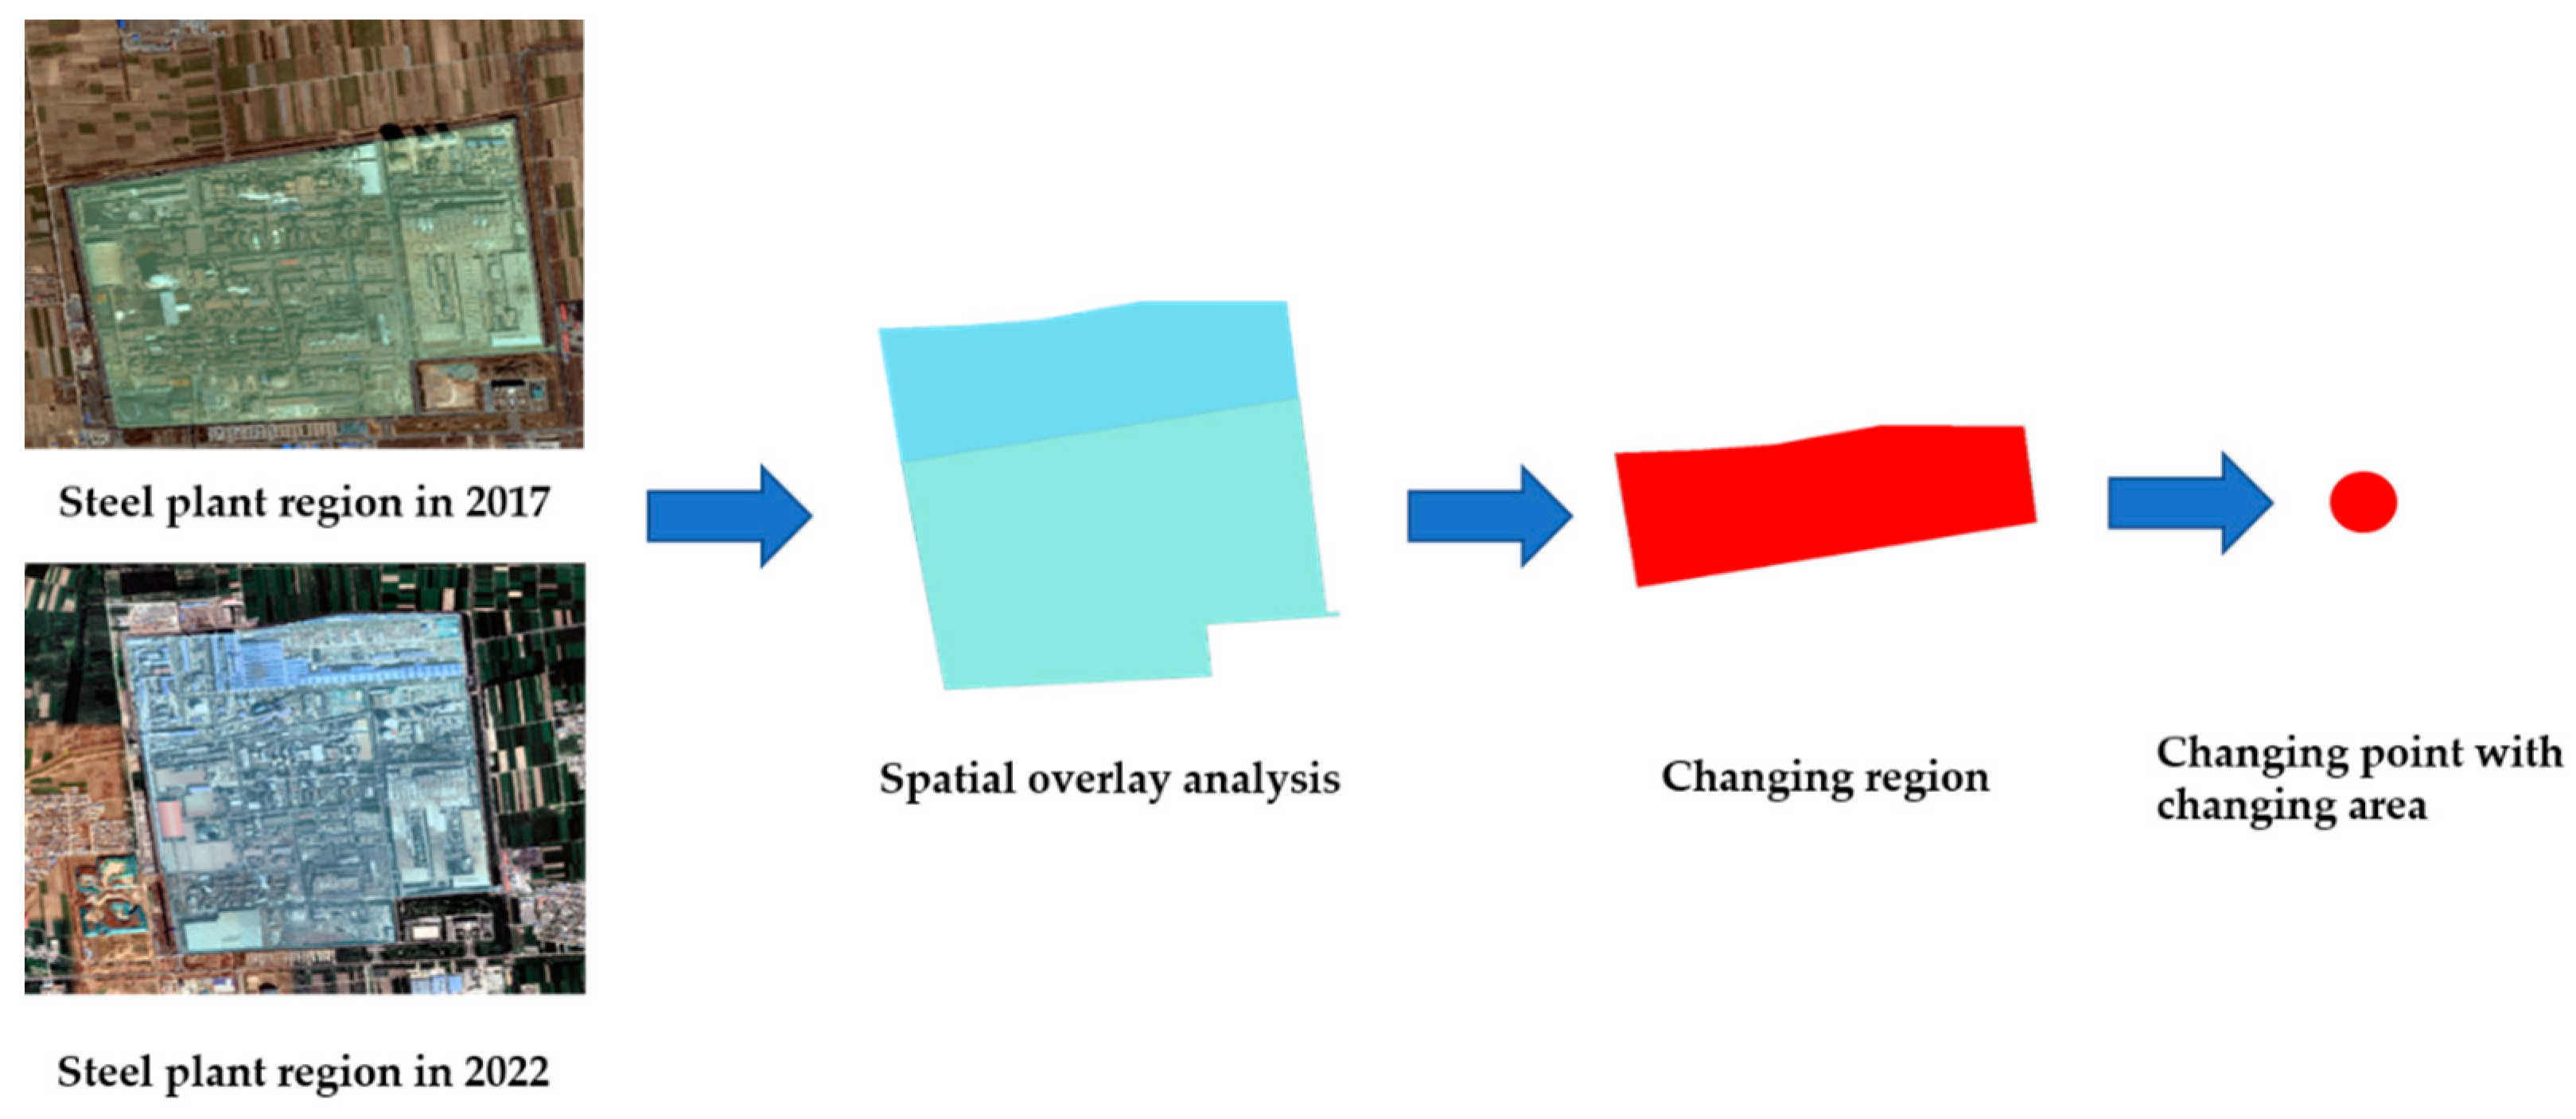
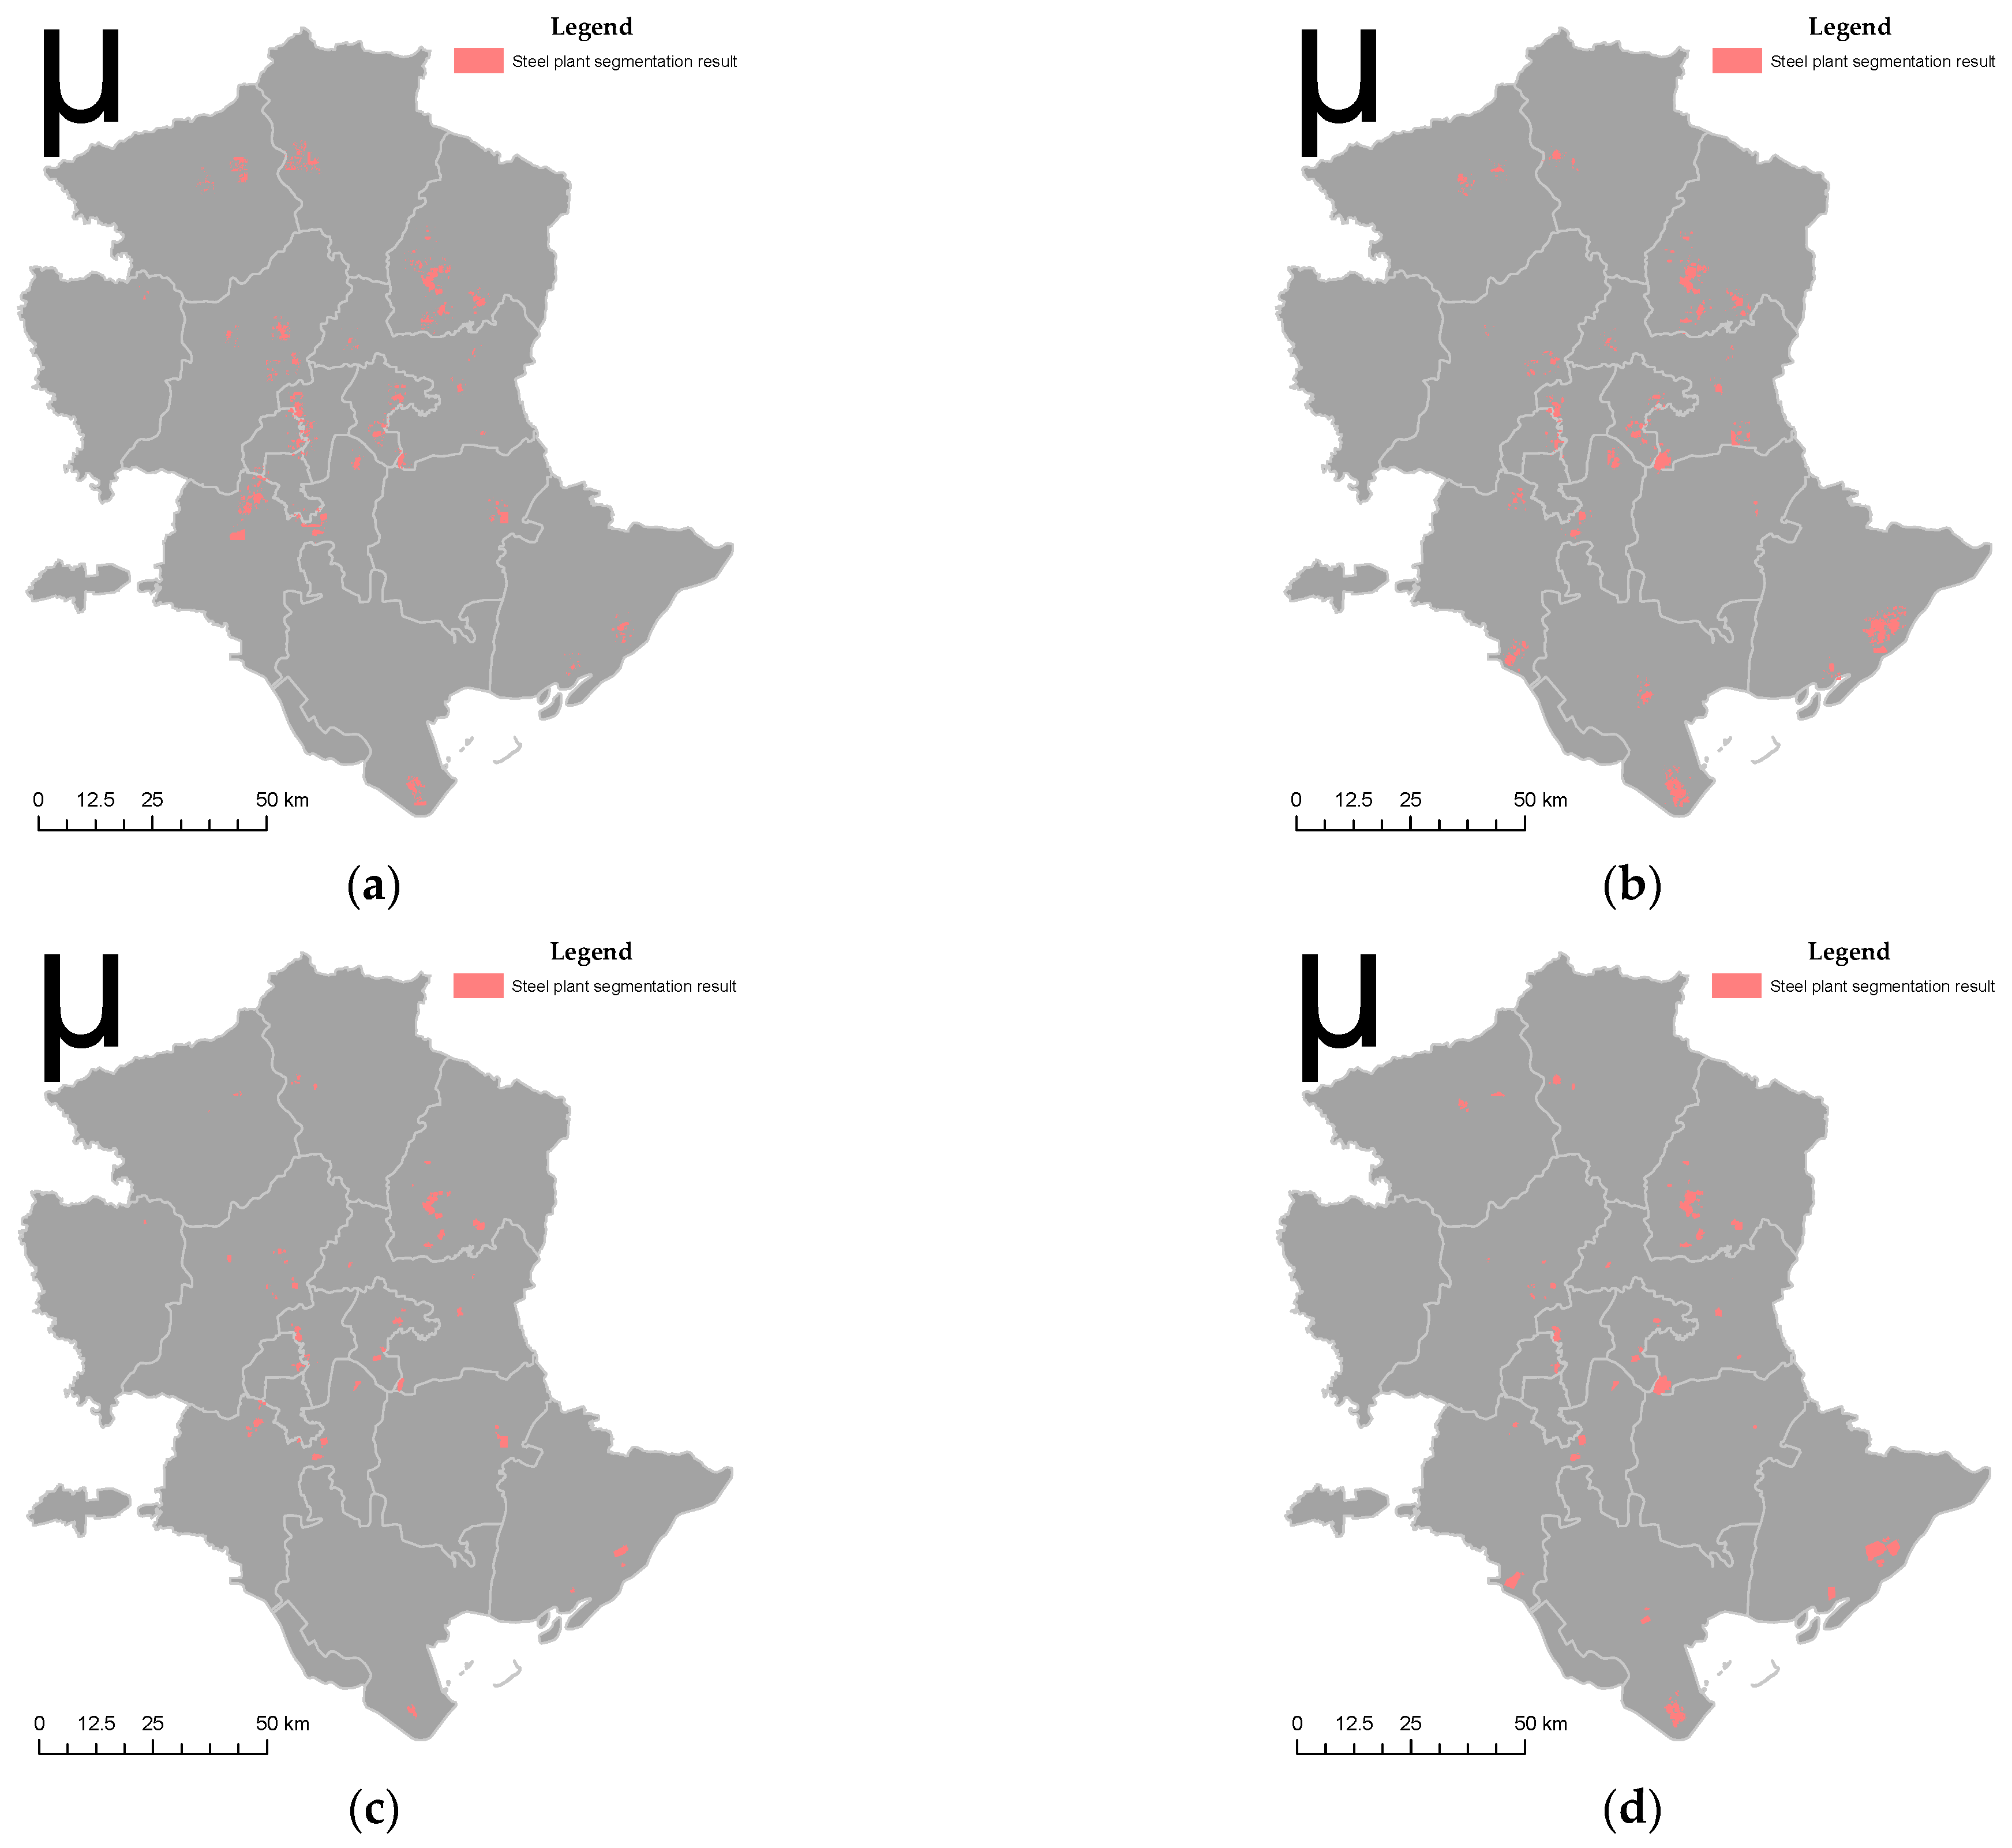
3.1. Results of Segmentation and Change Region Identification of Steel Plants
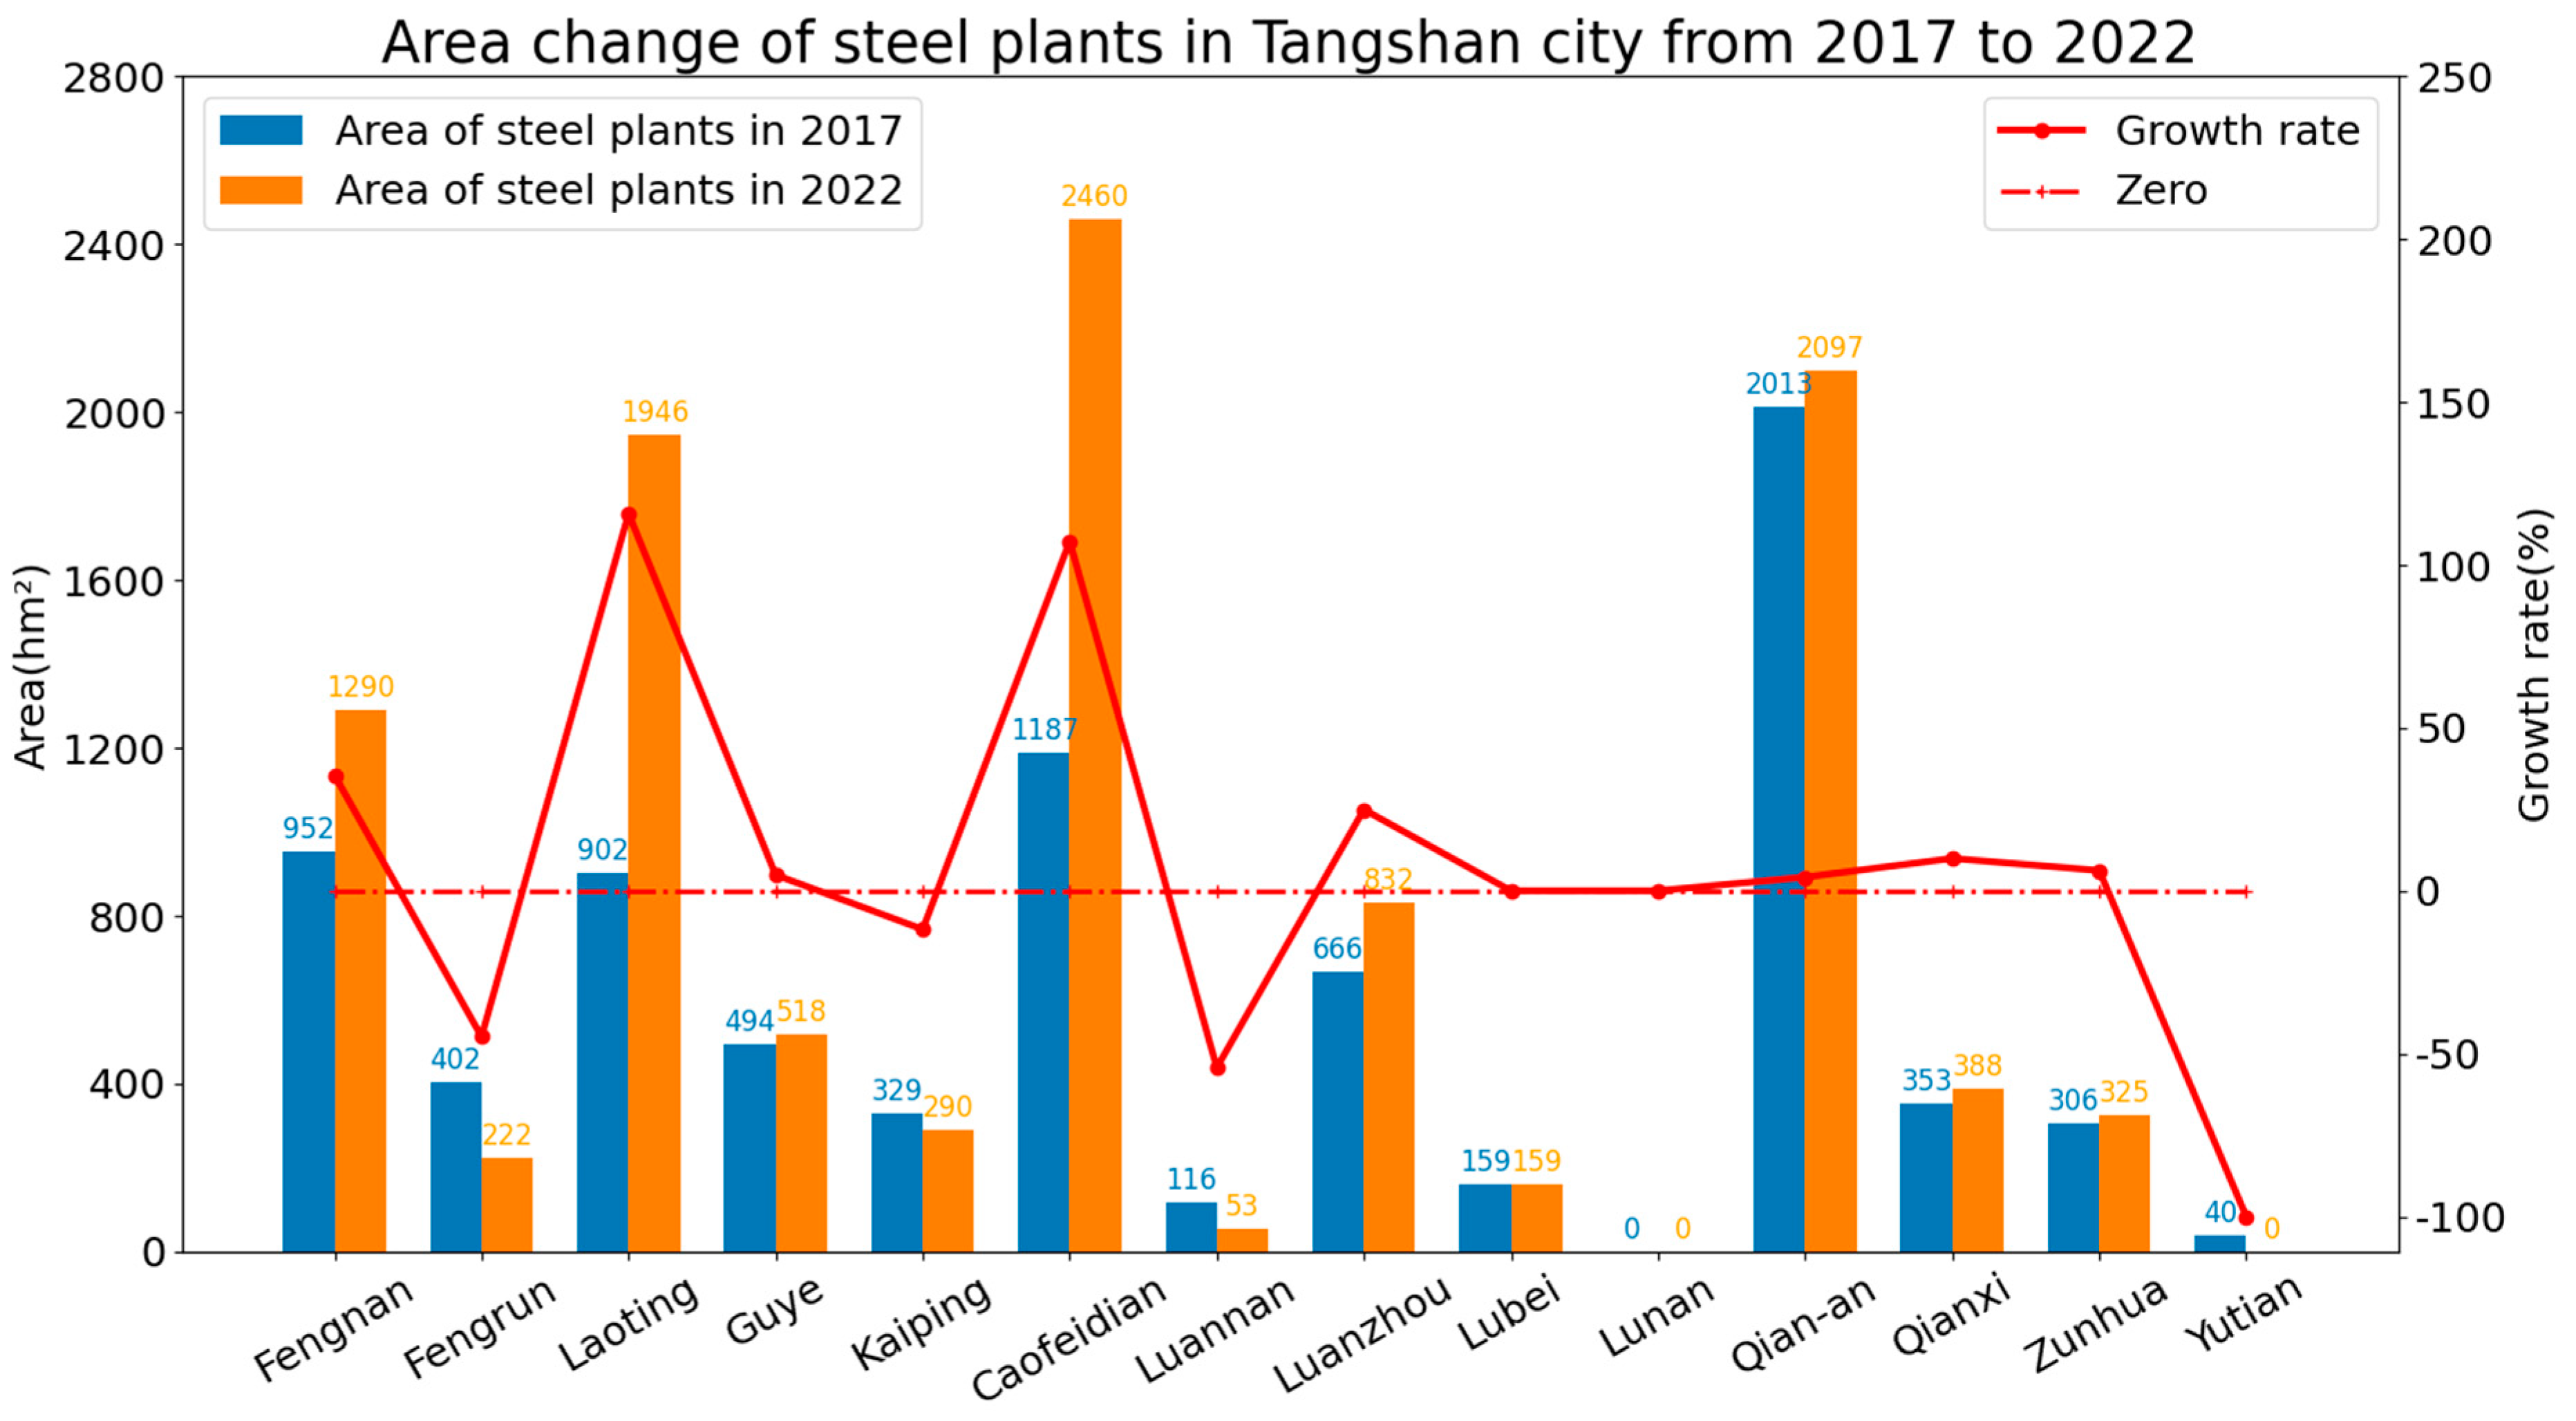
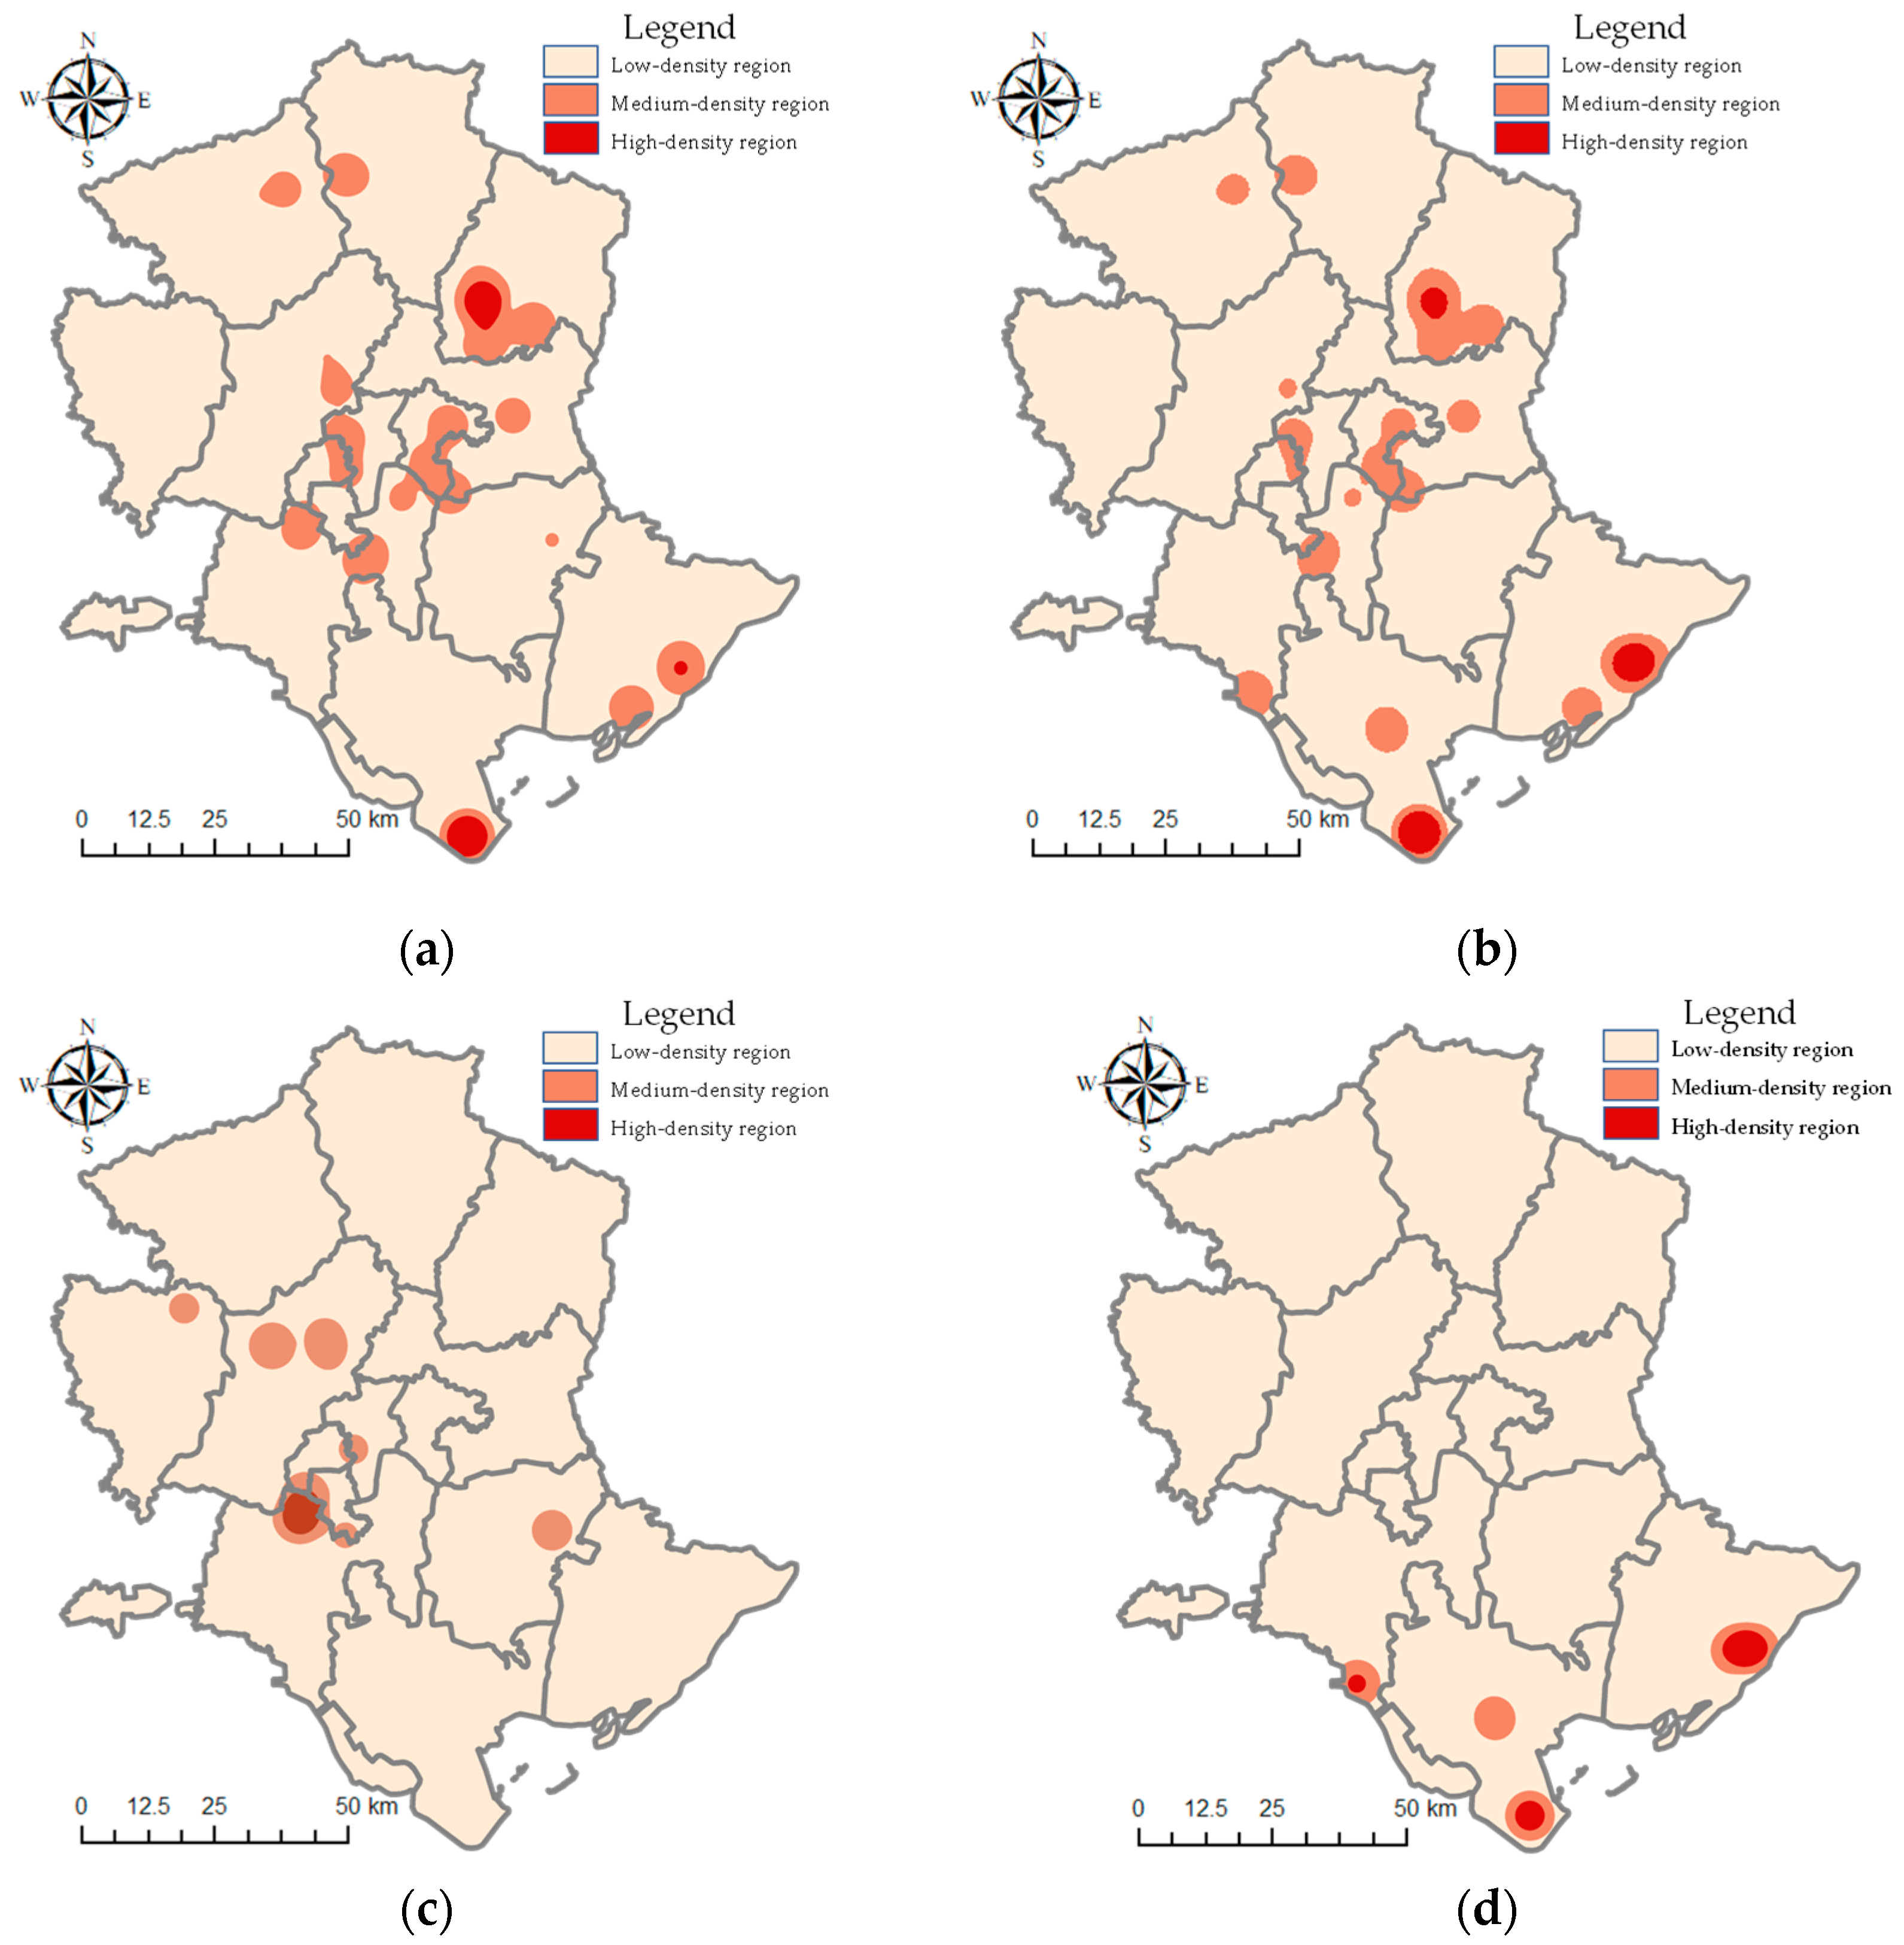
3.2. Analysis of Spatial Pattern Change in Steel Plants in Tangshan City
3.3. Relationships between Steel Plant Spatial Pattern Change and Land Cover Change in Tangshan City
4. Discussion
4.1. Effect of POI Data and OSM Data on Segmentating Steel Plants
- (1)
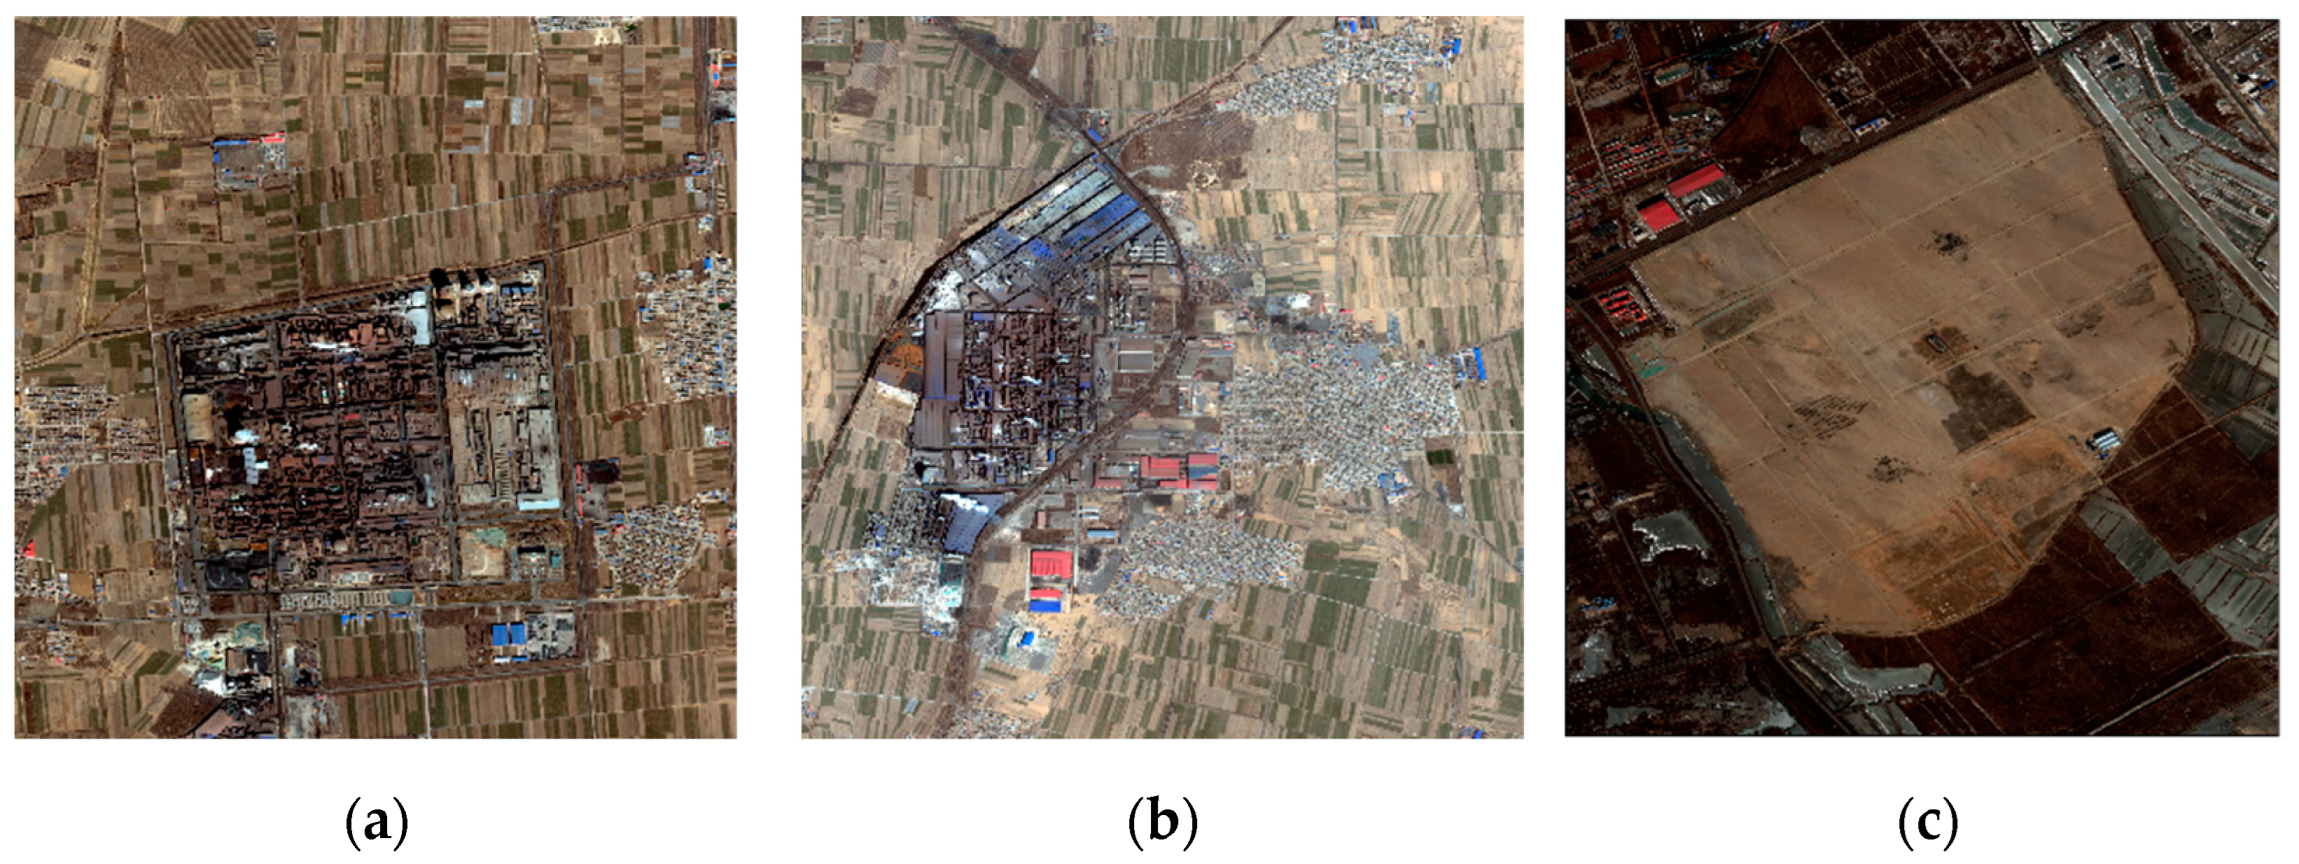
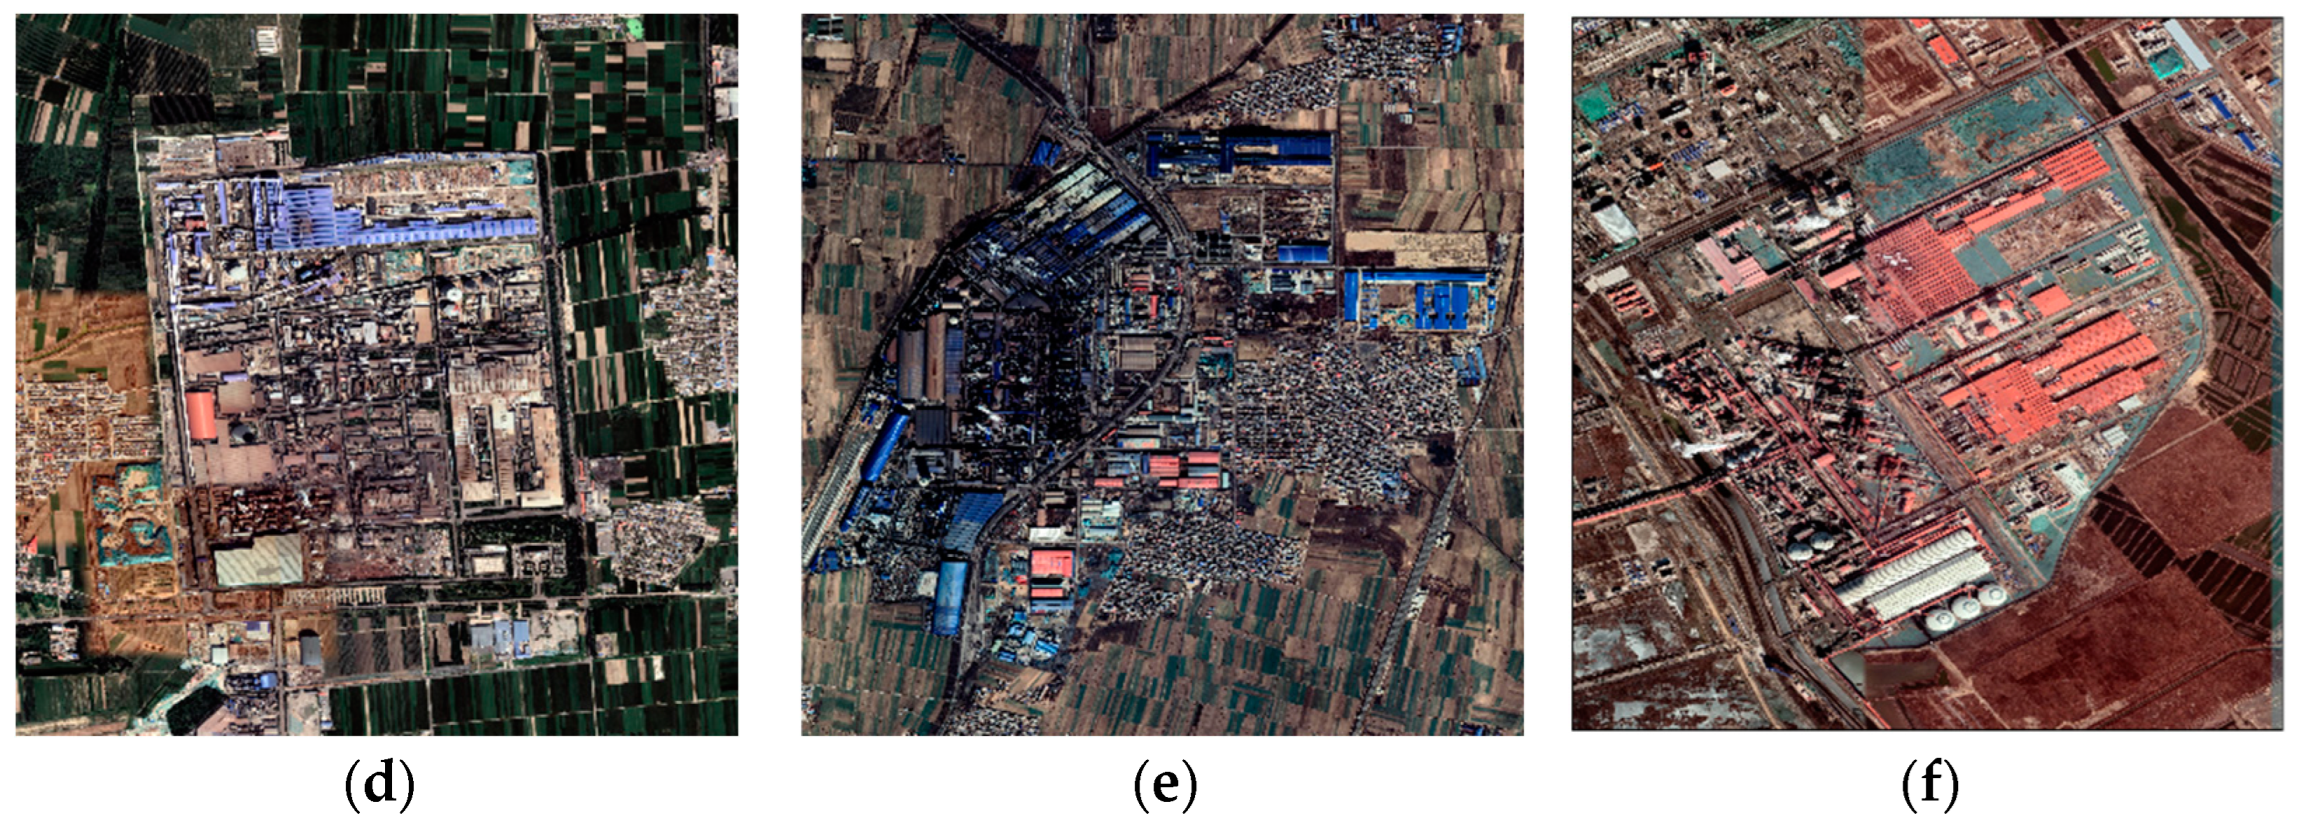
- The RSI + OSM strategy effectively improves the effectiveness of steel plant segmentation. Compared to the RSI strategy, the experiment in the Seg-SP17 test set showed improvements of 4.17% in precision, 2.90% in recall, 3.84% in F1 score, and 3.55% in IoU, and that, in the Seg-SP22 test set, these values were 5.53%, 8.45%, 6.88%, and 7.58%, respectively. It can be observed that the RSI + OSM strategy showed greater improvements in the Seg-SP22 test set compared to the Seg-SP17 test set. This is because the steel plant parcels segmented by OSM data in the coastal regions of Tangshan, particularly in southeastern Laoting and southwestern Fengnan, were better matched with the actual situation in 2022 compared to that in 2017. In other words, there is a stronger correlation between the actual steel plants and the steel plant parcels in the Seg-SP22 test set. By counting the number of steel plant parcels that meet the judgment criteria in the two test sets, it can be seen that there are 15 steel plant parcels that meet the criteria in Seg-SP22 test set, which is approximately twice that in Seg-SP17 test set (7 parcels).
- (2)
- Compared to the RSI strategy, the strategies of using RSIs and POI data showed significant improvements in precision in both the Seg-SP17 and Seg-SP22 test sets. However, these strategies have a negative impact on recall. The varying degrees of improvements and reductions depended on the selection of the DT. In the Seg-SP17 test set, the improvements in precision and recall were 23.61% and −7.61% at DT = 500 m, 6.24% and −3.69% at DT = 1000 m, and 5.22% and −0.03% at DT = 1500 m, respectively. While that in the Seg-SP22 test set were 18.95% and −11.11% at DT = 500 m, 11.24% and −0.07% at DT = 1000 m, and 5.06% and −0.00% at DT = 1500 m, respectively. It can be observed that the strategies of using RSIs and POI data have a trade-off effect between recall and precision, with a lower DT resulting in a more pronounced improvement in precision and reduction in recall. Additionally, the strategies also showed improvements in F1 score and IoU, where the best values for F1 score and IoU were achieved at DT = 500 m in Seg-SP17 and DT = 1000 m inSeg-SP22, respectively.
- (3)
- Compared to the RSI strategy, the strategies of using RSIs, OSM data, and POI data can significantly enhance the effectiveness of steel plant segmentation. In the Seg-SP17 test set, the improvements were observed as: 32.26% in precision, 1.59% in recall, 14.33% in F1 score, and 14.45% in IoU at DT = 500 m; 17.39% in precision, 2.37% in recall, 9.41% in F1 score, and 9.16% in IoU at DT = 1000 m; and 10.71% in precision, 3.10% in recall, 6.90% in F1 score, and 6.59% in IoU at DT = 1500 m. While that in the Seg-SP22 were: 24.88%, 6.36%, 14.98%, and 17.58% at DT = 500 m; 17.23%, 8.41%, 12.80%, and 14.76% at DT = 1000 m; and 10.71%, 3.10%, 6.90%, and 6.59% at DT = 1500 m. Meanwhile, compared to the strategy that combines RSIs and OSM data, as well as the strategies that combine RSIs and POI data with different DT, these strategies can significantly improve the precision of steel plant segmentation while effectively controlling the reduction in recall. Among all steel plant segmentation strategies, the best F1 score and IoU for both Seg-SP17 and Seg-SP22 appeared when using this strategy with a DT of 500 m.
4.2. Effect of the Spatial Pattern Change in Steel Plants on Land Cover Change in Tangshan City during the Study Period
4.3. Driving Mechanism and Possible Impact of the Spatial Pattern Change in Steel Plants in the Context of Resource-Based City Transformation
- (1)
- National policies drive Tangshan’s industrial transformation. The long-term extensive economic development model, dominated by mining and heavy industries, has led to prominent issues in resource-based cities, such as the imbalance of industrial structure, heavy reliance on resources, environmental degradation, and low land use efficiency. These issues have gradually reduced the investment attractiveness of resource-based cities and hindered their sustainable development. Industrial transformation and upgrading are crucial for modern societal development and the successful transformation of resource-based cities. To promote the transformation and sustainable development of resource-based cities in China, the State Council issued the “National Sustainable Development Plan for Resource-Based Cities (2013–2020)” in 2013 [49]. This plan outlines the overall strategic planning for the transformation and development of resource-based cities in China and promotes their industrial transformation. In 2017, the National Development and Reform Commission (NDRC) issued a notice titled “Supporting the Construction of Demonstration Zones for Industrial Transformation and Upgrading in the First Batch of Old Industrial Cities and Resource-Based Cities”, in which Tangshan City was designated as one of the first demonstration zones for industrial transformation and upgrading [50]. The notice requires the local governments in the demonstration zones to actively explore suitable paths and models for industrial transformation and upgrading based on their local conditions and characteristics. The following year, in order to improve air quality and address deteriorating living environments, the State Council issued a notice titled “Three-Year Action Plan for Winning the Battle for Blue Skies” [51], which designated the Beijing-Tianjin-Hebei region, including Tangshan City, as key regions. The notice emphasizes the adjustment and optimization of industrial structure as one of the important work objectives. These policies have accelerated the pace of industrial transformation in Tangshan City.
- (2)
- Tangshan’s industrial transformation led to the spatial pattern change in steel plants. The process of industrial transformation and the changes in industrial spatial patterns are interconnected in resource-based cities. On one hand, the industrial transformation and upgrading of resource-based cities often involve an adjustment of industrial structure, which is an important influencing factor in the changes of industrial spatial patterns [7,8]. On the other hand, by optimizing the industrial spatial pattern, it is possible to enhance the spatial competitiveness of enterprises, reduce production costs, and promote technological innovation, thereby driving the industries towards higher added value and technological content and achieving the transformation and upgrading of the industries [52,53]. Due to long-term development and renewal, the central region of Tangshan City has a relatively well-developed infrastructure and supporting facilities, serving as the commercial and residential center of the city. Steel plants occupy a significant amount of land, and the flow of people and logistics associated with steel plants can contribute to congestion and environmental issues in the city, limiting the development potential of the central region. Relocating the steel plants away from the region can free up land resources, alleviate the pressures on traffic and population, and attract high-value-adding industries, such as technology-intensive and knowledge-intensive industries, optimizing the city’s industrial structure. Additionally, the spatial restructuring of plants involves various aspects such as equipment relocation and reconstruction, factory region redevelopment, and employee resettlement. For the steelmaking industry, due to the uniqueness of steelmaking equipment, there are limited facilities that can be relocated and utilized, making it necessary to establish new facilities in a new location. This opportunity allows steel plants to phase out outdated equipment and redesign production capacity, which has significant positive implications for the development of the steelmaking industry and the reduction in excess capacity.
- (3)
- Tangshan’s future development plan decides the changing direction of the spatial pattern of the steel plants. When city policymakers engage in urban planning, they need to consider the current challenges and future development directions, ensuring that urban planning is both realistic and forward-looking. The “overall land-use plan for Tangshan City (2021–2035)” [54], published by the Tangshan Bureau of Natural Resources and Planning, proposes four major transformations including working towards an ecological civilization demonstration zone, a modern coastal city with land–sea linkage, a strong innovation-driven industrial city, and a prosperous, comfortable, beautiful, and livable city. Three major target, including serving as a window city for economic cooperation in Northeast Asia, a new industrialization base in the Bohai-Rim region, and an important hub in the Capital Economic Circle, were also proposed in the plan. These indicate that, in its future development, Tangshan will adjust its economic development model, promote ongoing industrial transformation, emphasize the protection of the ecological and living environment, leverage its geographical location and industrial foundation advantages, promote industrial agglomeration and develop industrial parks, strengthen exchanges and cooperation with Northeast Asian regions, and enhance and coordinate in the division of labor and collaboration with other cities within the Capital Economic Circle. In addition, the plan also mentions the “One Port, Two Cities” spatial development pattern, which signifies the establishment of a new urban center in the Caofeidian District, in addition to the existing central urban area of Tangshan City. These plans decided the spatial change direction for the steel plants of relocating from the central region towards coastal regions. The relocation of steel plants from the central region to coastal regions can alleviate environmental pollution and improve air quality in the central region, contributing to Tangshan’s transformation into an ecological civilization demonstration zone and a prosperous, comfortable, beautiful, and livable city. An efficient transportation network connecting the port and the inland is crucial for achieving the integration of land and sea. The relocation of steel plants will bring a significant population influx to the coastal regions, leading to an improvement in the surrounding infrastructure, including roads and railways. This development will contribute to Tangshan’s transformation into a modern coastal city with land–sea linkage. Additionally, the population influx and the improvement in infrastructure will further drive the development of the coastal regions, supporting the implementation of the “One Port, Two Cities” strategy, which can alleviate environmental and resource pressures in the central region. The relocation of the steel plants to the coastal regions can also leverage the influence of the steel industry as a dominant industry, attracting upstream and downstream industries, as well as other industries, to gather in the coastal regions, promoting the formation and development of the new Bohai-Rim industrialization base. The Bohai Sea serves as a gateway for communication between Tangshan and Northeast Asian countries. Its strategic geographical location makes it an important hub for exchanges between China and Northeast Asian countries. The formation and development of the new Bohai-Rim industrialization base will strengthen the connection and interaction between Tangshan and Northeast Asian countries. The strengthening of the connection and the interaction will promote economic cooperation and exchange, facilitate resource sharing, industrial collaboration, and market openness in the region, which is of great significance for promoting the formation of a development pattern that benefits all parties and achieves regional sustainable development.
4.4. Limitations and Prospects
5. Conclusions
- (1)
- Compared to using only RSIs, the steel plant segmentation strategy combining RSIs and POI data can significantly improve the precision of steel plant segmentation; however, it will, to some extent, reduce the recall of steel plant segmentation. This phenomenon weakens as DT increases. For this strategy, the best F1 score and IoU appeared at DT = 500 m in the Seg-SP17, while, in the Seg-SP22 test set, the best F1 score and IoU appeared at DT = 1000 m. The steel plant segmentation strategy combining RSIs and OSM data can effectively improve the effectiveness of steel plant segmentation; however, it has significant limitations. The segmentation results of combining RSIs, POI data, and OSM data were the most excellent, and the best F1 score and IoU in the Seg-SP17 and Seg-SP22 test sets both appear at DT = 500 m.
- (2)
- The area of steel plants increased significantly with a total area increase of 2714 hm2, while the spatial distribution center of steel plants moved to the southeast significantly. The PC was mainly distributed in the southern coastal regions, including southeastern Laoting, southern Caofeidian, and southwestern Fengnan, and the NC was mainly distributed in the central area, including central Fengrun and northern Fengnan.
- (3)
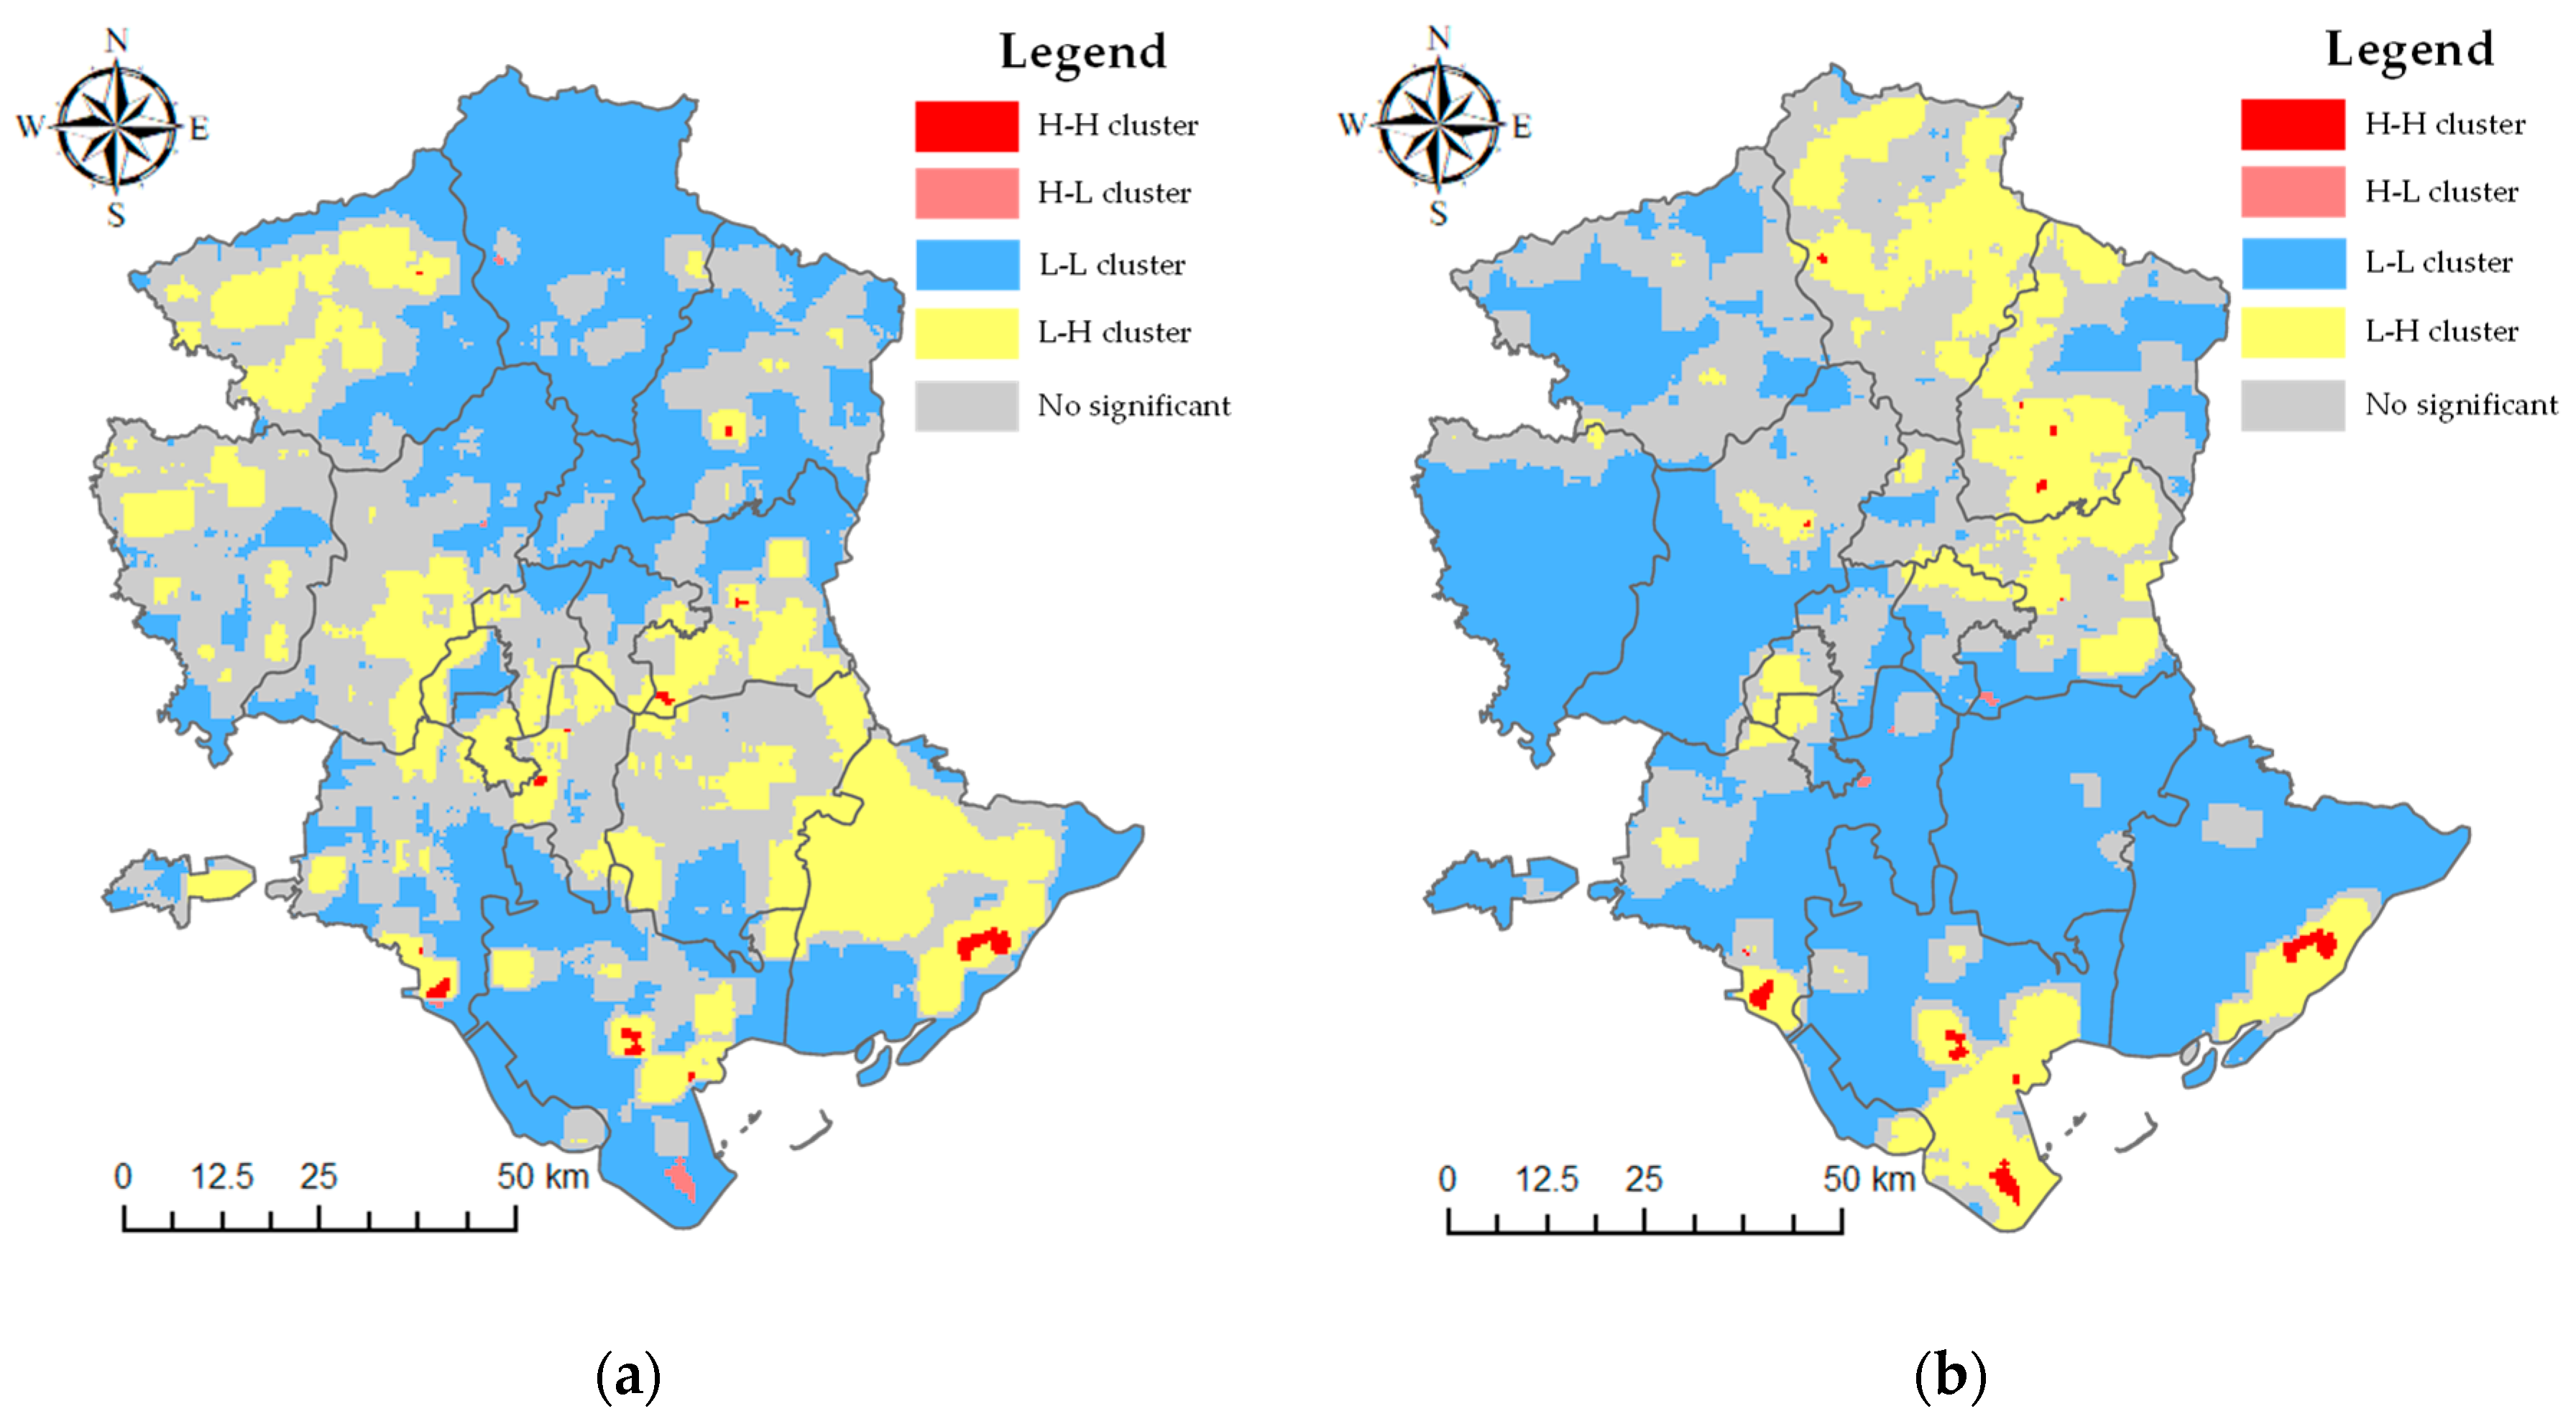
- The V-BA had the strongest spatial correlation with the PC among the five main types of land cover change, with the bivariate Moran’s I of 0.212 (OC = 1), 0.122 (OC = 3), 0.060 (OC = 5), and 0.033 (OC = 10). The impact of the PC on the V-BA was concentrated in southeastern Laoting, central and southern Caofeidian, southwestern Fengnan, western Qianxi, and southwestern Qian’an. The C-BA also had a strong spatial correlation with the PC, with the bivariate Moran’s I of 0.137 (OC = 1), 0.063 (OC = 3), 0.033 (OC = 5), and 0.009 (OC = 10). The impact of the PC on the C-BA was concentrated in southeastern Laoting, central Caofeidian, southwestern and central Fengnan, southwestern and central Luan-zhou, and southwestern Qian’an. This indicates that the PC led to C and V transfer to BA during the spatial reorganization process of steel plants in Tangshan City during 2017–2022. Considering the area change in C and V, the protection of cropland in the transformation process of Tangshan City is relatively outstanding. However, in the subsequent spatial restructuring of steel plants and the development of urbanization, attention needs to be paid to the protection of the ecological environment.
Author Contributions
Funding
Conflicts of Interest
References
- Zhou, D.; Xu, K.; Lv, Z.; Yang, J.; Li, M.; He, F.; Xu, G. Intelligent Manufacturing Technology in the Steel Industry of China: A Review. Sensors 2022, 22, 8194. [Google Scholar] [CrossRef]
- Ge, X.J.; Liu, X. Urban land use efficiency under resource-based economic transformation—A case study of Shanxi Province. Land 2021, 10, 850. [Google Scholar] [CrossRef]
- Zheng, H.; Ge, L. Carbon emissions reduction effects of sustainable development policy in resource-based cities from the perspective of resource dependence: Theory and Chinese experience. Resour. Policy 2022, 78, 102799. [Google Scholar] [CrossRef]
- Conejo, A.N.; Birat, J.-P.; Dutta, A. A review of the current environmental challenges of the steel industry and its value chain. J. Environ. Manag. 2020, 259, 109782. [Google Scholar] [CrossRef]
- Xu, F.; Cui, F.; Xiang, N. Roadmap of green transformation for a steel-manufacturing intensive city in China driven by air pollution control. J. Clean. Prod. 2021, 283, 124643. [Google Scholar] [CrossRef]
- Song, J.; Wang, B.; Fang, K.; Yang, W. Unraveling economic and environmental implications of cutting overcapacity of industries: A city-level empirical simulation with input-output approach. J. Clean. Prod. 2019, 222, 722–732. [Google Scholar] [CrossRef]
- Jin, L.; Wang, C.; Zhang, H.; Ye, Y.; Du, Z.; Zhang, Y. Evolution and Mechanism of the “Core–Periphery” Relationship: Micro-Evidence from Cross-Regional Industrial Production Organization in a Fast-Developing Region in China. Sustainability 2019, 12, 189. [Google Scholar] [CrossRef]
- Shao, J.; Zhou, J. Study on the influences of industry transformation on the sustainable development of resource-exhausted city space. Procedia Eng. 2011, 21, 421–427. [Google Scholar] [CrossRef]
- Cao, Q.; Liu, Y.; Georgescu, M.; Wu, J. Impacts of landscape changes on local and regional climate: A systematic review. Landsc. Ecol. 2020, 35, 1269–1290. [Google Scholar] [CrossRef]
- Ding, Y.; Feng, H.; Zou, B. Remote Sensing-Based Estimation on Hydrological Response to Land Use and Cover Change. Forests 2022, 13, 1749. [Google Scholar] [CrossRef]
- Kafy, A.-A.; Rahman, M.S.; Hasan, M.M.; Islam, M. Modelling future land use land cover changes and their impacts on land surface temperatures in Rajshahi, Bangladesh. Remote Sens. Appl. 2020, 18, 100314. [Google Scholar] [CrossRef]
- Davison, C.W.; Rahbek, C.; Morueta-Holme, N. Land-use change and biodiversity: Challenges for assembling evidence on the greatest threat to nature. Global. Change Biol. 2021, 27, 5414–5429. [Google Scholar] [CrossRef] [PubMed]
- Hoyer, R.; Chang, H. Assessment of freshwater ecosystem services in the Tualatin and Yamhill basins under climate change and urbanization. Appl. Geogr. 2014, 53, 402–416. [Google Scholar] [CrossRef]
- Li, K.; Feng, M.; Biswas, A.; Su, H.; Niu, Y.; Cao, J. Driving factors and future prediction of land use and cover change based on satellite remote sensing data by the LCM model: A case study from Gansu province, China. Sensors 2020, 20, 2757. [Google Scholar] [CrossRef] [PubMed]
- Ma, C.; Niu, Z.; Ma, Y.; Chen, F.; Yang, J.; Liu, J. Assessing the distribution of heavy industrial heat sources in India between 2012 and 2018. ISPRS Int. J. Geo-Inf. 2019, 8, 568. [Google Scholar] [CrossRef]
- Lu, K.; Li, G.; Chen, Z.; Jiu, L.; Li, B.; Jianwei, G. Extraction of steel plants based on optimized SSD network incorporating negative sample’s multi channels. J. Univ. Chin. Acad. Sci. 2020, 37, 352. [Google Scholar]
- Zhu, L.; Wang, L.; Li, X.; Zhang, L. A Summary of analysis and application research on the spatial distribution of POI data based on urban service industry. J. Phys. Conf. Ser. 2020, 1634, 012070. [Google Scholar] [CrossRef]
- Shen, S.; Zhu, C.; Fan, C.; Wu, C.; Huang, X.; Zhou, L. Research on the evolution and driving forces of the manufacturing industry during the “13th five-year plan” period in Jiangsu province of China based on natural language processing. PLoS ONE 2021, 16, e0256162. [Google Scholar] [CrossRef]
- Fu, Y.; Yang, X.; Wang, T.; Supriyadi, A.; Cirella, G.T. Spatial Pattern Characteristics of the Financial Service Industry: Evidence from Nanjing, China. Appl. Spat. Anal. Polic. 2022, 15, 595–620. [Google Scholar] [CrossRef]
- Andrade, R.; Alves, A.; Bento, C. POI mining for land use classification: A case study. ISPRS Int. J. Geo-Inf. 2020, 9, 493. [Google Scholar] [CrossRef]
- Yeow, L.W.; Low, R.; Tan, Y.X.; Cheah, L. Point-of-Interest (POI) data validation methods: An urban case study. ISPRS Int. J. Geo-Inf. 2021, 10, 735. [Google Scholar] [CrossRef]
- Liu, X.; Long, Y. Automated identification and characterization of parcels with OpenStreetMap and points of interest. Environ. Plann. B 2016, 43, 341–360. [Google Scholar] [CrossRef]
- Huang, C.; Xiao, C.; Rong, L. Integrating Point-of-Interest Density and Spatial Heterogeneity to Identify Urban Functional Areas. Remote. Sens. 2022, 14, 4201. [Google Scholar] [CrossRef]
- Wang, Z.; Ma, D.; Sun, D.; Zhang, J. Identification and analysis of urban functional area in Hangzhou based on OSM and POI data. PLoS ONE 2021, 16, e0251988. [Google Scholar] [CrossRef] [PubMed]
- Miao, R.; Wang, Y.; Li, S. Analyzing urban spatial patterns and functional zones using sina Weibo POI data: A case study of Beijing. Sustainability 2021, 13, 647. [Google Scholar] [CrossRef]
- Wang, Z.; Zhao, J.; Lin, S.; Liu, Y. Identification of Industrial Land Parcels and Its Implications for Environmental Risk Management in the Beijing–Tianjin–Hebei Urban Agglomeration. Sustainability 2019, 12, 174. [Google Scholar] [CrossRef]
- Shen, W.; Zhang, J.; Zhou, X.; Li, S.; Geng, X. How to Perceive the Trade-Off of Economic and Ecological Intensity of Land Use in a City? A Functional Zones-Based Case Study of Tangshan, China. Land 2021, 10, 551. [Google Scholar] [CrossRef]
- Yang, Y.; Tang, X.; Li, Z. Land use suitability analysis for town development planning in Nanjing hilly areas: A case study of Tangshan new town, China. J. Mt. Sci. 2021, 18, 528–540. [Google Scholar] [CrossRef]
- OSM Geographic Data Platform. Available online: https://www.openstreetmap.org/ (accessed on 6 March 2023).
- Karra, K.; Kontgis, C.; Statman-Weil, Z.; Mazzariello, J.C.; Mathis, M.; Brumby, S.P. Global land use/land cover with Sentinel 2 and deep learning. In Proceedings of the 2021 IEEE International Geoscience and Remote Sensing Symposium IGARSS, Brussels, Belgium, 11–16 July 2021; IEEE: Piscataway, NJ, USA, 2021. [Google Scholar] [CrossRef]
- ESRI Land Cover. Available online: https://livingatlas.arcgis.com/landcover/ (accessed on 6 March 2023).
- Chen, L.; Wang, X.; Cai, X.; Yang, C.; Lu, X. Combined Effects of Artificial Surface and Urban Blue-Green Space on Land Surface Temperature in 28 Major Cities in China. Remote Sens. 2022, 14, 448. [Google Scholar] [CrossRef]
- Su, H.; Peng, Y.; Xu, C.; Feng, A.; Liu, T. Using improved DeepLabv3+ network integrated with normalized difference water index to extract water bodies in Sentinel-2A urban remote sensing images. J. Appl. Remote Sens. 2021, 15, 018504. [Google Scholar] [CrossRef]
- Gorelick, N.; Hancher, M.; Dixon, M.; Ilyushchenko, S.; Thau, D.; Moore, R. Google Earth Engine: Planetary-scale geospatial analysis for everyone. Remote Sens. Environ. 2017, 202, 18–27. [Google Scholar] [CrossRef]
- PIE-Engine AI Platform. Available online: https://engine.piesat.cn/artificial-intelligence (accessed on 6 March 2023).
- Abdulhafedh, A. Identifying vehicular crash high risk locations along highways via spatial autocorrelation indices and kernel density estimation. World J. Eng. Technol. 2017, 5, 198–215. [Google Scholar] [CrossRef]
- Silverman, B.W. Density Estimation for Statistics and Data Analysis; CRC Press: Boca Raton, FL, USA, 1986; Volume 26. [Google Scholar]
- Wang, N.; Fu, X.; Wang, S. Spatial-temporal variation and coupling analysis of residential energy consumption and economic growth in China. Appl. Energ. 2022, 309, 118504. [Google Scholar] [CrossRef]
- Anselin, L. Local indicators of spatial association—LISA. Geogr. Anal. 1995, 27, 93–115. [Google Scholar] [CrossRef]
- Data Classification Methods. Available online: https://pro.arcgis.com/en/pro-app/latest/help/mapping/layer-properties/data-classification-methods.htm (accessed on 6 May 2023).
- Zhong, J.; Qi, W.; Dong, M.; Xu, M.; Zhang, J.; Xu, Y.; Zhou, Z. Land Use Carbon Emission Measurement and Risk Zoning under the Background of the Carbon Peak: A Case Study of Shandong Province, China. Sustainability 2022, 14, 15130. [Google Scholar] [CrossRef]
- Guo, L.; Gong, H.; Ke, Y.; Zhu, L.; Li, X.; Lyu, M.; Zhang, K. Mechanism of land subsidence mutation in Beijing plain under the background of urban expansion. Remote Sens. 2021, 13, 3086. [Google Scholar] [CrossRef]
- Zhou, Y.; Li, X.; Liu, Y. Cultivated land protection and rational use in China. Land Use Policy 2021, 106, 105454. [Google Scholar] [CrossRef]
- Sun, Q.; Wu, M.; Du, P.; Qi, W.; Yu, X. Spatial Layout Optimization and Simulation of Cultivated Land Based on the Life Community Theory in a Mountainous and Hilly Area of China. Sustainability 2022, 14, 3821. [Google Scholar] [CrossRef]
- Deng, L.; Liu, G.; Shangguan, Z. Land-use conversion and changing soil carbon stocks in China’s ‘Grain-for-Green’Program: A synthesis. Global. Change Biol. 2014, 20, 3544–3556. [Google Scholar] [CrossRef]
- Shi, Y.; Li, J.; Xie, M. Evaluation of the ecological sensitivity and security of tidal flats in Shanghai. Ecol. Indic. 2018, 85, 729–741. [Google Scholar] [CrossRef]
- Sun, X.; Zhang, R.; Wang, G.; Guo, J.; Liu, Z. Factor decomposition, reduction potential, and rebound effect of energy consumption related PM2. 5 in China. J. Clean. Prod. 2021, 322, 129088. [Google Scholar] [CrossRef]
- Zhu, S.; Huang, J.; Zhao, Y. Coupling coordination analysis of ecosystem services and urban development of resource-based cities: A case study of Tangshan city. Ecol. Indic. 2022, 136, 108706. [Google Scholar] [CrossRef]
- Notice of the State Council on the Issuance of the “National Plan for Sustainable Development of Resource-Based Cities (2013–2020)”. Available online: https://www.gov.cn/gongbao/content/2013/content_2547140.htm (accessed on 2 June 2023).
- Notice of the National Development and Reform Commission on “Supporting the Construction of Demonstration Zones for Industrial Transformation and Upgrading in the First Batch of Old Industrial Cities and Resource-Based Cities”. Available online: https://www.gov.cn/xinwen/2017-04/21/content_5188011.htm (accessed on 2 June 2023).
- Notice of the State Council on the Issuance of the “Three-Year Action Plan for Winning the Battle for Blue Skies”. Available online: https://www.mee.gov.cn/ywgz/fgbz/gz/201807/t20180705_446146.shtml (accessed on 2 June 2023).
- Xu, H.; Liu, W.; Zhang, D. Exploring the role of co-agglomeration of manufacturing and producer services on carbon productivity: An empirical study of 282 cities in China. J. Clean. Prod. 2023, 399, 136674. [Google Scholar] [CrossRef]
- Yuan, H.; Feng, Y.; Lee, C.; Cen, Y. How does manufacturing agglomeration affect green economic efficiency? Energy Econ. 2020, 92, 104944. [Google Scholar] [CrossRef]
- Public Announcement of the Overall Land-Use Plan for Tangshan City (2021–2035). Available online: http://zygh.tangshan.gov.cn/ts/xxgk/gggs/ghbz/10805039838206521344.html (accessed on 2 June 2023).
- Shao, P.; Shi, W.; Liu, Z.; Dong, T. Unsupervised Change Detection Using Fuzzy Topology-Based Majority Voting. Remote Sens. 2021, 13, 3171. [Google Scholar] [CrossRef]
- Fu, W.; Shao, P.; Dong, T.; Liu, Z. Novel Higher-Order Clique Conditional Random Field to Unsupervised Change Detection for Remote Sensing Images. Remote Sens. 2022, 14, 3651. [Google Scholar] [CrossRef]
- Peng, D.; Bruzzone, L.; Zhang, Y. SemiCDNet: A semisupervised convolutional neural network for change detection in high resolution remote-sensing images. IEEE Trans. Geosci. Remote Sens. 2020, 59, 5891–5906. [Google Scholar] [CrossRef]
- Yuan, J.; Zheng, Y.; Xie, X. Discovering regions of different functions in a city using human mobility and POIs. In Proceedings of the 18th ACM SIGKDD International Conference on Knowledge Discovery and Data Mining, New York, NY, USA, 12 August 2012. [Google Scholar] [CrossRef]
- Ghosh, S.; Chifos, C. The 1985 siting of a Toyota manufacturing plant in rural Kentucky, USA: The ensuing land use change and implications for planning. Landsc. Urban Plan. 2017, 167, 288–301. [Google Scholar] [CrossRef]
- Fan, C.; Wang, Z. Spatiotemporal Characterization of Land Cover Impacts on Urban Warming: A Spatial Autocorrelation Approach. Remote Sens. 2020, 12, 1631. [Google Scholar] [CrossRef]
- Bao, J.; Wang, W.; Zhao, T. Spatiotemporal Changes of Ecosystem Service Values in Response to Land Cover Dynamics in China from 1992 to 2020. Sustainability 2023, 15, 7210. [Google Scholar] [CrossRef]




| W * (hm2) | V * (hm2) | C * (hm2) | BA * (hm2) | BG * (hm2) | Total (hm2) | LUDD (%/Year) | |
|---|---|---|---|---|---|---|---|
| W (hm2) | 1303.612 | 24.768 | 41.532 | 47.112 | 9.907 | 1426.931 | 0.109 |
| V (hm2) | 21.124 | 2151.671 | 401.361 | 167.402 | 11.035 | 2752.593 | −1.774 |
| C (hm2) | 81.110 | 242.771 | 5874.815 | 328.411 | 3.822 | 6530.929 | −0.257 |
| BA (hm2) | 10.675 | 54.678 | 117.097 | 3113.839 | 4.360 | 3300.649 | 2.299 |
| BG (hm2) | 8.155 | 34.618 | 12.071 | 33.262 | 23.770 | 111.876 | −10.544 |
| Total (hm2) | 1424.676 | 2508.506 | 6446.876 | 3690.026 | 52.894 | - | - |
| V-C | V-BA | C-V | C-BA | BA-C | ||
|---|---|---|---|---|---|---|
| OC = 1 | PC | −0.014 | 0.212 | 0.006 | 0.137 | −0.016 |
| NC | −0.003 | 0.002 | −0.003 | −0.005 | 0.007 | |
| OC = 3 | PC | −0.010 | 0.122 | 0.004 | 0.063 | −0.012 |
| NC | −0.003 | 0.002 | −0.004 | −0.001 | 0.006 | |
| OC = 5 | PC | −0.009 | 0.060 | 0.002 | 0.033 | −0.011 |
| NC | 0.000 | 0.001 | −0.003 | 0.002 | 0.003 | |
| OC = 10 | PC | −0.010 | 0.033 | −0.004 | 0.009 | −0.011 |
| NC | −0.001 | 0.000 | −0.003 | 0.007 | 0.004 |
| Test Set | Strategy | Precision (%) | Recall (%) | F1 Score (%) | IoU (%) |
|---|---|---|---|---|---|
| Seg-SP17 | RSI | 50.09 | 53.71 | 51.84 | 34.99 |
| RSI + OSM | 54.80 | 56.51 | 55.64 | 38.54 | |
| RSI + POI_500 m | 73.70 | 46.10 | 56.72 | 39.58 | |
| RSI + POI_1000 m | 61.04 | 52.92 | 56.69 | 39.56 | |
| RSI + POI_1500 m | 55.31 | 53.68 | 54.48 | 37.44 | |
| RSI + OSM + POI_500 m | 82.35 | 55.30 | 66.17 | 49.44 | |
| RSI + OSM + POI_1000 m | 67.48 | 56.08 | 61.25 | 44.15 | |
| RSI + OSM + POI_1500 m | 60.80 | 56.81 | 58.74 | 41.58 | |
| Seg-SP22 | RSI | 59.89 | 63.75 | 61.76 | 44.68 |
| RSI + OSM | 65.42 | 72.20 | 68.64 | 52.26 | |
| RSI + POI_500 m | 78.84 | 52.64 | 63.13 | 46.12 | |
| RSI + POI_1000 m | 71.13 | 63.68 | 67.20 | 50.60 | |
| RSI + POI_1500 m | 64.95 | 63.75 | 64.34 | 47.43 | |
| RSI + OSM + POI_500 m | 84.77 | 70.11 | 76.74 | 62.26 | |
| RSI + OSM + POI_1000 m | 77.12 | 72.16 | 74.56 | 59.44 | |
| RSI + OSM + POI_1500 m | 70.70 | 72.18 | 71.43 | 55.56 |
Disclaimer/Publisher’s Note: The statements, opinions and data contained in all publications are solely those of the individual author(s) and contributor(s) and not of MDPI and/or the editor(s). MDPI and/or the editor(s) disclaim responsibility for any injury to people or property resulting from any ideas, methods, instructions or products referred to in the content. |
© 2023 by the authors. Licensee MDPI, Basel, Switzerland. This article is an open access article distributed under the terms and conditions of the Creative Commons Attribution (CC BY) license (https://creativecommons.org/licenses/by/4.0/).
Share and Cite
Ni, M.; Zhao, Y.; Ma, C.; Hou, X.; Xie, Y. Exploring Relationships between Spatial Pattern Change in Steel Plants and Land Cover Change in Tangshan City. Sustainability 2023, 15, 9729. https://doi.org/10.3390/su15129729
Ni M, Zhao Y, Ma C, Hou X, Xie Y. Exploring Relationships between Spatial Pattern Change in Steel Plants and Land Cover Change in Tangshan City. Sustainability. 2023; 15(12):9729. https://doi.org/10.3390/su15129729
Chicago/Turabian StyleNi, Mingyan, Yindi Zhao, Caihong Ma, Xiaolin Hou, and Yanmei Xie. 2023. "Exploring Relationships between Spatial Pattern Change in Steel Plants and Land Cover Change in Tangshan City" Sustainability 15, no. 12: 9729. https://doi.org/10.3390/su15129729
APA StyleNi, M., Zhao, Y., Ma, C., Hou, X., & Xie, Y. (2023). Exploring Relationships between Spatial Pattern Change in Steel Plants and Land Cover Change in Tangshan City. Sustainability, 15(12), 9729. https://doi.org/10.3390/su15129729


