Article

Economic Policy Uncertainty and Firm Value: Impact of Investment Sentiments in Energy and Petroleum

1
Putra Business School, University Putra Malaysia (UPM), Serdang 43400, Malaysia
2
Department of Statistics and Operations Research, Faculty of Science, King Saud University, P.O. Box 2455, Riyadh 11451, Saudi Arabia
3
College of Agriculture, Jawaharlal Nehru Krishi Vishwavidyalaya, Rewa 486001, India
4
Management Department, BINUS Online Learning, Bina Nusantara University, West Jakarta 11480, Indonesia
5
Department of Medical and Surgical Sciences, University of Bologna, 40126 Bologna, Italy
*
Author to whom correspondence should be addressed.
Sustainability 2023, 15(12), 9656; https://doi.org/10.3390/su15129656
Submission received: 9 May 2023 / Revised: 7 June 2023 / Accepted: 10 June 2023 / Published: 16 June 2023
(This article belongs to the Special Issue Corporate Social Performance, Responsibility and Value)

Abstract

:
This study seeks to determine how economic policy uncertainty (EPU) influences investment decisions and the market value of the Pakistan Stock Exchange. This study examines investment and operational data from 249 energy and petroleum companies between 2015 and 2020 and macroeconomic variables such as EPU. This study investigates the moderating effects of EPU on investments in fixed and intangible assets and its effect on Tobin’s Q and the market price per share. The outcomes demonstrate that EPU reduces the costs of both tangible and intangible assets for businesses. In addition, companies with a higher Tobin’s Q and market price per share are more impacted by uncertain corporate investment policies. However, financial leverage is negatively correlated with share price and positively correlated with earnings per share and earnings per unit. Tobin’s Q positively correlates with financial leverage, indicating that firms that raise capital through debt are more likely to create value for investors. The research indicates that market-dependent enterprises are more susceptible to the unpredictability of monetary policy. According to this study, consistent application and open communication of economic policies are likely to increase the efficacy of company investments, resulting in more effective resource allocation and business decision-making.

1. Introduction

This study investigates the relationship between economic policy uncertainty (EPU) and corporate investment decisions. The conflicting findings of earlier studies are brought up to emphasize the necessity for more analysis and study on the subject at hand. When past research on a topic produces contradictory or inconsistent findings, it suggests that several different elements or variables may influence the phenomenon under consideration. It is important to undertake more research to obtain a more thorough and trustworthy understanding of the subject. The goal is to identify any gaps or discrepancies that currently exist in the literature. We are primarily concerned with economic policy uncertainty instead of idiosyncratic uncertainty. Wars and terrorist attacks can significantly impact business operations, affecting expenses, sales, and profitability. Additionally, external factors such as taxes and subsidies can influence investment decisions. Corporate investment is a substantial and irreversible expense, making policy modifications essential for businesses’ operations and investments.
EPU is a key factor in corporate decisions and market outcomes, influencing investment, production, and consumption patterns. Although the impact of EPU on business decisions and results has been extensively studied, additional research is required to examine how EPU interacts with various investment sentiments at the firm level and influences the value of the firm. The authors of [1] reported that EPU has increased over the past few years, which has had significant effects on businesses and markets. High levels of policy uncertainty can result in decreased business investment and employment, diminished consumer confidence, and heightened market volatility. Therefore, it is essential to examine the effect of EPU on the firm’s value to comprehend how policy uncertainty influences businesses’ decision-making and, ultimately, their value.
New economic policy adoption and debate often take an extended period, and results might be unpredictable. According to the fundamental option theory, uncertainty makes it more valuable to postpone investments, especially when such assets are irreversible, to learn more about how profitable the projects will be [2]. On the other hand, uncertainty might heighten financial sector frictions that obstruct enterprises’ access to outside capital and actual investments. According to empirical research, the unpredictable nature of government economic policy has a detrimental influence on corporate investments and corporate bank loans [3], prompting companies to keep more cash on hand as a safety measure [4]. According to [5], uncertainty is a significant risk factor for stocks since it positively correlates with excess market returns. No earlier study has examined the relationship between macroeconomic uncertainty and financing contraction, even though debt is a significant source of corporate borrowing susceptible to market frictions. The study investigates the connection between company debt structure and the economic policy uncertainty of public limited firms.
Our research concentrates on the substantial effect of Pakistan’s internal policy uncertainty on economic activity. This factor is the primary impetus for our investigation. In conjunction with political factors, policy uncertainty is frequently directly related to unanticipated events that can affect the economic climate, thereby modifying the required returns for businesses to discount future cash flows. Consequently, it is essential to investigate how policy uncertainty influences corporate investment decisions. We utilize data from the Pakistan Stock Exchange because it is believed that Pakistan’s economy is transitioning from planned to market-based. In the past, Pakistan had adhered to a more centrally planned economic structure in which the government had substantial influence over economic direction and management. Nevertheless, the nation has been putting changes into place recently to liberalize and open up its economy, allowing more opportunity for market forces to function and promoting private sector engagement. Several significant reforms and policy adjustments are required for the transition to a market economy, i.e., deregulation, trade liberalization, and fiscal responsibility [5]. It would be fascinating to determine if the effect of economic policy uncertainty on corporate investment is analogous to or distinct from that of market-based developed nations. The findings may have implications for other economies in transition.
The corpus of currently available research offers empirical evidence for the hypothesis that policy-related uncertainty may slow economic development by driving businesses to cut spending. The relationship between real per capita GDP and the unpredictability of policies in 46 developing countries between 1970 and 1985 was initially studied by [6]. They provide evidence that investment growth may be affected by policy uncertainty. According to more recent research, policy uncertainty is to blame for declining business investment spending during the global financial crisis [7,8].
They show that fiscal instability and disruptions hurt economic activity, whereas tax credits and budget certainty boost company investment [9]. This economic policy uncertainty affects global and individual businesses very in a different way. We can see Figure 1 and the assessment in Figure 2. It is not much different. Figure 2 depicts the Pakistani economy’s economic policy uncertainty from 2015 to the present.
Concerning [10], we create firm-level instruments to evaluate the causal effect of uncertainty shocks while addressing endogeneity issues. Their method of identifying exogenous variance in firm-level volatility uses industry differences in exposure to nine distinct types of aggregate uncertainty. The research considers firm-level uncertainty instruments that consider second-moment vulnerabilities to seven major currencies, i.e., the Canadian Dollar, Japanese Yen, Euro, British Pound, Swiss Franc, and Swedish Krona, in conjunction with the United States Dollar, crude oil prices, and economic policy uncertainty. The Canadian Dollar, Japanese Yen, Euro, British Pound, Swiss Franc, and Swedish Krona are among these currencies. Through testing, their EPU score has proven to be an accurate predictor of basic economic policy uncertainty. The researchers similarly constructed EPU indexes for Europe, Canada, Pakistan, and India. Due to its ambiguity, we quantify economic policy uncertainty in Pakistan differently.
Corporate investment, stock prices, and Tobin’s Q are examined for a sample of publicly listed Pakistani enterprises from 2015 through 2020. This contact has a substantial influence on business investment in Pakistan. Our findings confirm earlier studies in industrialized nations that policy-related economic uncertainty hurts company investment. Second, policy uncertainty affects enterprises differently. Higher Tobin’s Q, external finance, and non-state ownership reduce policy uncertainty’s negative effect on tangible and intangible asset investments. Our findings remain solid when we assess endogeneity, use alternative variables, evaluate stock prices and Tobin’s Q’s longer-lag effects, and examine economic policy uncertainty’s interaction effects. Our results contribute to the literature and provide valuable counsel for policymakers in comparable nations.
The remainder of the essay is organized as follows: The development of our primary ideas and pertinent theoretical background from the literature are presented in the second part. We discuss our sample and variables in the third part. The empirical findings are shown in the fourth part. Testing is conducted in the fifth part. The last segment brings us to a close.

2. Literature Review

Research on the connection between business investment and the influence of uncertain economic policy on business value has produced conflicting results. According to Knight’s famous idea (1921), entrepreneurs can detect and seize investment opportunities when they arise and may increase profitability by integrating resources. Therefore, the uncertainty of the economy is what drives corporate profits. An advanced degree of uncertainty will also increase the anticipated yield of capital, which will lead to an increase in investment, according to the economic models developed by [11] as well as [12] that are founded on the suppositions of perfect rivalry among firms, a stable exchange scale factor, and a balanced adjustment cost. However, if the assumptions of [13,14] are loosened, [15] contends that capital investments fall as tax uncertainty rises. The genuine option arguments draw the same results. Because investment initiatives are irreversible or have buried costs, businesses must consider the difference in profit between present and future investments. Companies cut their current investment expenditures due to economic uncertainty since waiting to make future investments yields a greater return and a higher perceived worth [16]. Ref. [17] provides more industry-level evidence in support of this claim, as do [18,19] for firms.
Economic policy uncertainty (EPU) has become an essential concern for policymakers and businesses, with its impact on investment decisions and firm value being a hotly debated topic. Although the link between EPU and company value has been the subject of research, little is known about how EPU interacts with other investment attitudes at the business level.
The Economic Policy Unit’s effect on Pakistani public enterprises’ market value between 2015 and 2020 was examined in research by [20]. They discovered that economic policy inconsistency had a negative link with market share prices but a beneficial association with financial leverage. The research results demonstrated a positive association between working capital operations, the sample’s market value per share, and the information in the financial statements analyzed.
Ref. [21] examined how EPU affected European firms’ return on investment using data from 23 European states between 2000 and 2019. EPU drastically lowered European companies’ stock market performance. EPU affected stock returns more during periods of high market volatility and low market liquidity. In contrast, research by [22] examined how EPU affected Taiwanese companies’ investing practices. According to the research, EPU favored Taiwanese companies’ investment decisions, especially those with significant financial slack. The study recommended that firms with an ample financial cushion were better equipped to cope with the uncertainty caused by EPU and were far more inclined to invest in profitable projects.
Additionally, research conducted in 2017 by Dibooglu and Kutan looked at the effect of EPU on the inflow of foreign direct investment (FDI). The study discovered that EPU has a detrimental impact on the influx of FDI to Turkey, showing that investors from other nations were wary of investing there while economic policy uncertainty was high.
Policy uncertainty is a form of uncertainty that substantially impacts the investment behavior of businesses. It can result in higher-than-anticipated expenditures, decreased long-term investment, and diminished productivity [23]. Entrepreneurs are reluctant to increase investment when policy changes occur, particularly in developing nations, until the uncertainty associated with policy reform is resolved [24]. Theoretical and empirical studies conducted by [25] indicate that policy uncertainty diminishes the value of government market protections, causing more frequent stock price fluctuations. Ref. [26] demonstrates that corporate investment declines during presidential election years relative to other years. Ref. [27] research indicates that stock prices fluctuate less radically during election years due to increased positive noise, but election uncertainty undermines company performance and results in inefficient capital allocation. According to the findings of [28], higher levels of economic policy uncertainty harm corporate investment. The relationship between uncertainty and corporate investment can be influenced by corporate characteristics such as management flexibility, organization size, and financial constraints [29].
Unlike established market economies, countries undergoing economic transitions, such as Pakistan, may experience distinct effects of economic uncertainty on corporate investment. Ref. [30] discovered that Pakistan’s return on capital is substantially greater than that of other developing market economies. Similarly, Ref. [31] compared India’s return on capital and argued that the country’s high investment rate results from its superior return on capital, which is significantly higher than that of other established nations. In the face of heightened policy unpredictability, greater returns on invested capital can encourage businesses to continue investing rather than postpone their plans. Uncertainty will likely negatively impact business investment less if the projected return on invested capital is greater.
Literature indicates that EPU can impact firm value positively and negatively, depending on the investment sentiment prevalent at the firm’s level. In periods of high EPU, while some businesses may be better suited to deal with uncertainty and identify investment opportunities, others may encounter financial constraints and reduce investment expenditure. Therefore, when making investment decisions, policymakers and business managers must closely consider the impact of EPU on investment sentiment and firm value. The following initial hypothesis is derived from this study:
Hypothesis 1 (H1):
The interaction effect between investment in intangible assets and economic policy uncertainty (EPU) on firm value is statistically significant.
Several studies have found that policy uncertainty negatively affects businesses, including by reducing external funding and escalating financial restrictions, which can delay investment [32]. The condition of the stock and credit markets substantially impacts corporations’ financing and investment decisions [33]. Companies with greater access to external debt markets, such as credit ratings, may acquire more debt [34].
In addition, policy uncertainty may cause creditors to shorten loan maturities for various reasons, including the deterioration of the capacity of borrowing companies to repay their loans by increasing operational risk and cash flow volatility. Creditors face less risk with short-term financing because they can closely monitor business management [35]. When government economic policies are highly uncertain and lenders are exposed to greater interest rate risk, they may be less inclined to lend long-term debt. This reluctance may prevent companies that prefer long-term debt from securing longer-term loans, forcing them to compromise for shorter-term loans [36].
In addition, policy uncertainty increases equity risk premiums, which increases payment failure risk and enterprises’ cash flow volatility [37,38]. During periods of significant policy unpredictability, creditors may become concerned about borrowers’ capacity to repay, resulting in higher risk premiums to counterbalance the increased lending risk. To protect themselves against borrowers defaulting on payments due to policy uncertainty, creditors may impose stricter covenants on loans provided to small, highly leveraged borrowers, loans made during economic downturns, and loans made when credit spreads are high [39,40,41]. Debt covenants may replace debt maturity in reducing the default risk of consumers. The discussion that has come before leads to the following hypothesis:
Hypothesis 2 (H2):
Financial leverage and economic policy uncertainty significantly interact with business value.
This claim establishes a connection between corporate value, economic policy uncertainty, and fixed asset investment. A business invests in fixed assets such as furniture, equipment, and machinery. The market value of a company is its worth. Economic laws and regulations’ unpredictable and fluctuating nature impacts business and market conditions. Uncertainty regarding economic policies.
The hypothesis suggests that uncertainty in economic policy and fixed asset investment may impact corporate value. Uncertainty in economic policy may impact a firm’s fixed asset investments and value. Uncertainty in economic policy in this scenario impacts fixed asset investment and company value. The interaction between fixed asset investments and economic policy’s irrationality will impact business value. For this theory to be verified and evaluated, more study is required. Three factors—fixed asset investment, economic policy uncertainty, and business value—must be present to calculate the interaction effect. Depending on the research environment and methodology, there may be variations in the statistically significant interaction impact. Additional study and interpretation are frequently required to fully comprehend the findings and their consequences.
Hypothesis 3 (H3):
There is a significant interaction effect between fixed asset investment and economic policy uncertainty on firm value.
According to [42], there is a clear correlation between the payment cycle, the turnover of stock, the accounts payable turnover period, and the receivables turnover period. It demonstrates that when there is uncertainty about economic policy, managing working capital for a business becomes more challenging, which reduces working capital management’s effectiveness. It was discovered that uncertainty detrimentally affected working capital management effectiveness. Since little research has been conducted on this connection, the study will add to our knowledge of the interactive effect of uncertainty regarding economic policies on handling working capital. We formulate the following hypothesis as follows:
Hypothesis 4 (H4):
Working capital management and economic policy uncertainty significantly affect business value.
The study in this chapter investigates the relationship between business investments and the unpredictability of economic policy, with a particular focus on Pakistan. Even though the current body of research offers empirical evidence of the detrimental effect of policy-related uncertainty on business investment, some holes in the argument still need to be filled. The absence of studies investigating the connection between macroeconomic unpredictability and a contraction in finance, especially concerning debt, is one possible gap in the research that must be filled. Even though it is mentioned in the text that debt is a substantial source of corporate borrowing sensitive to market frictions, no additional examination is conducted into how policy uncertainty can influence enterprises’ access to debt financing.
Another potential research gap is the limited focus on the specific characteristics of Pakistani firms and how they might differ from firms in developed economies. According to the paragraph, the research uses figures from the Pakistan Stock Exchange to determine if the impacts of uncertain economic policies on corporate investment are equal to or greater than those in industrialized nations. However, further study is needed to determine how particular contextual elements unique to Pakistan may influence the link between unpredictability in economic policy and business investment. Finally, although the text emphasizes the need to research how policy uncertainty impacts company investment decisions, it does not investigate alternative policy remedies to reduce the detrimental effect of delay on business investments. Future studies should concentrate on finding policy solutions that could assist in minimizing uncertainty about economic policies and encouraging business investment.

3. Theory Applicable to Current Research

Real options theory is one theory that supports the notion of economic policy uncertainty (EPU) and its interactive effects on company value. Real options theory states that enterprises must deal with uncertainty in the investment environment and that their ability to adapt their investment strategy in response to shifting economic conditions impacts their decision-making. Uncertainty in the setting for investment is generated by unpredictability in economic policies, which may impact changes in tax, financial, or regulatory laws and the intrinsic worth of real business options. The value of a firm’s real choices is impacted by the heightened economic uncertainty that EPU-related enterprises confront. In reaction to higher EPU, businesses may postpone investments, cut down on capital expenditures, or even abandon certain initiatives. These choices demonstrate the worth of companies’ genuine alternatives and adaptability to changes in the economic environment.
Moreover, EPU influences the value of real options and, therefore, company value by interacting with other firm-specific variables such as financial limitations, development prospects, and firm size. For instance, businesses struggling in the commercial environment may be more susceptible to EPU because they have fewer resources available to adjust to changes in the economic environment. Similarly, companies with significant development potential may be more impacted by EPU due to their higher actual option values. The real options model, on the whole, offers a theoretical framework to comprehend how EPU influences company value through the value of real choices that businesses own. It also emphasizes the importance of considering company-specific aspects when evaluating how EPU affects firm value.

4. Research Methods

Using the Generalized Method of Moments (GMM) model, this study examines the relationship between policy uncertainty and firm value in Pakistan’s energy and petroleum industries. GMM is preferred over other prevalent panel data approaches such as fixed effects (FE), random effects (RE), and ordinary least squares (OLS) because it resolves the endogeneity issue that arises when the dependent variable is correlated with the error term. Due to data limitations, the sample size of 249 firms in Pakistan’s energy and hydrocarbon sectors is restricted. The State Bank of Pakistan provided the secondary data used for this investigation, which spans the years 2015 through 2020. In its analysis, the research considers the unpredictability of economic policy, company investment in physical and intangible assets, working capital management, financial leverage, and firm value. The independent variable in this equation is the degree of economic policy uncertainty. The Arellano–Bond estimator provides an estimate for the GMM model, which addresses the issue of endogeneity by including lag-dependent variables. Robust standard errors consider the possibility of heteroskedasticity and autocorrelation. The primary findings of this research are the GMM model’s calculated coefficient on economic policy uncertainty, corporate investment, and well-worth in Pakistan’s energy and petroleum industries. This study is looked at to draw conclusions and formulate policy recommendations (Figure 3).
Y i t = α i t + β 1 X 1 i t + β 2 X 2 i t   + β 3 ( X 2 i t ) × ( X 1 i t   ) + + β n X n i t + ε i t
( Tobin sQ i t ) = β 0 it + β 1 ( INTA i t ) + β 2 ( IFA i t ) + β 3 ( FL i t ) + β 4 ( W C i t ) + β 5 ( E P U i t ) + β 6 ( A g e i t ) + β 7 ( S i z e i t ) + β 8 ( C F O i t ) + η i + λ t + ε
( MPPS i t ) = β 0 + β 1 ( INTA i t ) + β 2 ( IFA i t ) + β 3 ( FL i t ) + β 4 ( W C i t ) + β 5 ( E P U i t ) + β 6 ( A g e i t ) + β 7 ( S i z e i t ) + β 8 ( C F O i t ) + η i + λ t + ε
( Tobin sQ i t ) = β 0 it + β 1 ( INTA i t ) + β 2 ( IFA i t ) + β 3 ( FL i t ) + β 4 ( W C i t ) + β 5 ( E P U i t ) + β 6 ( A g e i t ) + β 7 ( S i z e i t ) + β 8 ( C F O i t ) + β 9 ( INTA EPU i t ) + β 10 ( IFA EPU i t ) + β 11 ( FL EPU i t ) + β 12 ( W C EPU i t ) + η i + λ t + ε
( MPPS i t ) = β 0 it + β 1 ( INTA i t ) + β 2 ( IFA i t ) + β 3 ( FL i t ) + β 4 ( W C i t ) + β 5 ( E P U i t ) + β 6 ( A g e i t ) + β 7 ( S i z e i t ) + β 8 ( C F O i t ) + β 9 ( INTA EPU i t ) + β 10 ( IFA EPU i t ) + β 11 ( FL EPU i t ) + β 12 ( W C EPU i t ) + η i + λ t + ε
where all the independent and dependent variables are explained below.

4.1. Dynamic Panel Data Analysis

A statistical technique called dynamic panel data analysis is used to examine panel data, a collection of observations made over time on several people, businesses, nations, or other entities. The approach considers the data’s cross-sectional and time-series aspects. A dynamic panel data analysis emphasizes how the dependent variable varies over time and how explanatory factors affect those changes. Analyzing dynamic panel data is comparable to solving a puzzle in which the components constantly alter and change form. The Generalized Method of Moments (GMM) is one of the most prevalent techniques for this form of analysis.
In contrast to other methods, such as fixed and random effects models, GMM considers the possibility of endogeneity. It happens when there is a correlation between the examined factors and the error term in the regression equation. GMM aids in the resolution of this issue by minimizing the disparity between sample and population moments. In other words, it helps us locate the missing puzzle components and properly assemble them.
Dynamic panel data analysis is used in economics and the social sciences to understand phenomena. One of these research topics, government policies and economic growth, is crucial to sustainable development. Dynamic panel data analysis examines corporate governance and company performance to find the finest business practices. Researchers also study complicated aspects affecting international commerce. Dynamic panel data analysis helps researchers comprehend variable connections across time and make educated findings. Finance uses this method to track numerous corporations’ stock prices, interest rates, and currency rates. Dynamic panel data models address endogeneity. Lag-dependent variables in the regression equation might relate explanatory factors to the error term. This association might explain the regression results. It reduces the impact of invisible factors on variables. These factors may affect the variables being addressed.
Dynamic panel data analysis may also calculate the short- and long-term effects of variables affecting the dependent variable. The lagging dependent variable represents a long-term effect. Dynamic panel data analysis is needed to study complex financial data interactions over time. Several ways exist.

4.2. Generalized Method of Moments (GMM) Estimators

When conventional OLS, FE, and RE techniques cannot account for the potential endogeneity problem, economists estimate model parameters using the Generalized Methods of Moments (GMM). GMM estimators use moment conditions derived from the population to evaluate the model’s parameters. These moment conditions are data functions where the population mean is zero.
Because they can deal with various problems, including unobserved heterogeneity, endogeneity, and measurement error, GMM estimators are frequently used in panel data analysis. They are considered more effective than conventional techniques because they estimate the model’s parameters using all of the information in the data, including momentary conditions.
GMM estimators are frequently used in the financial industry to estimate asset pricing models and investigate the correlation between macroeconomic factors and stock returns. When working with financial data that may display non-stationarity, time-varying volatility, and heteroskedasticity, GMM estimators are especially helpful. They enable researchers to consider these variables and estimate the model’s parameters more accurately.
yit = δyi, t−1 + x’itβ + uit    i = 1, …, N; t = 1, …, T
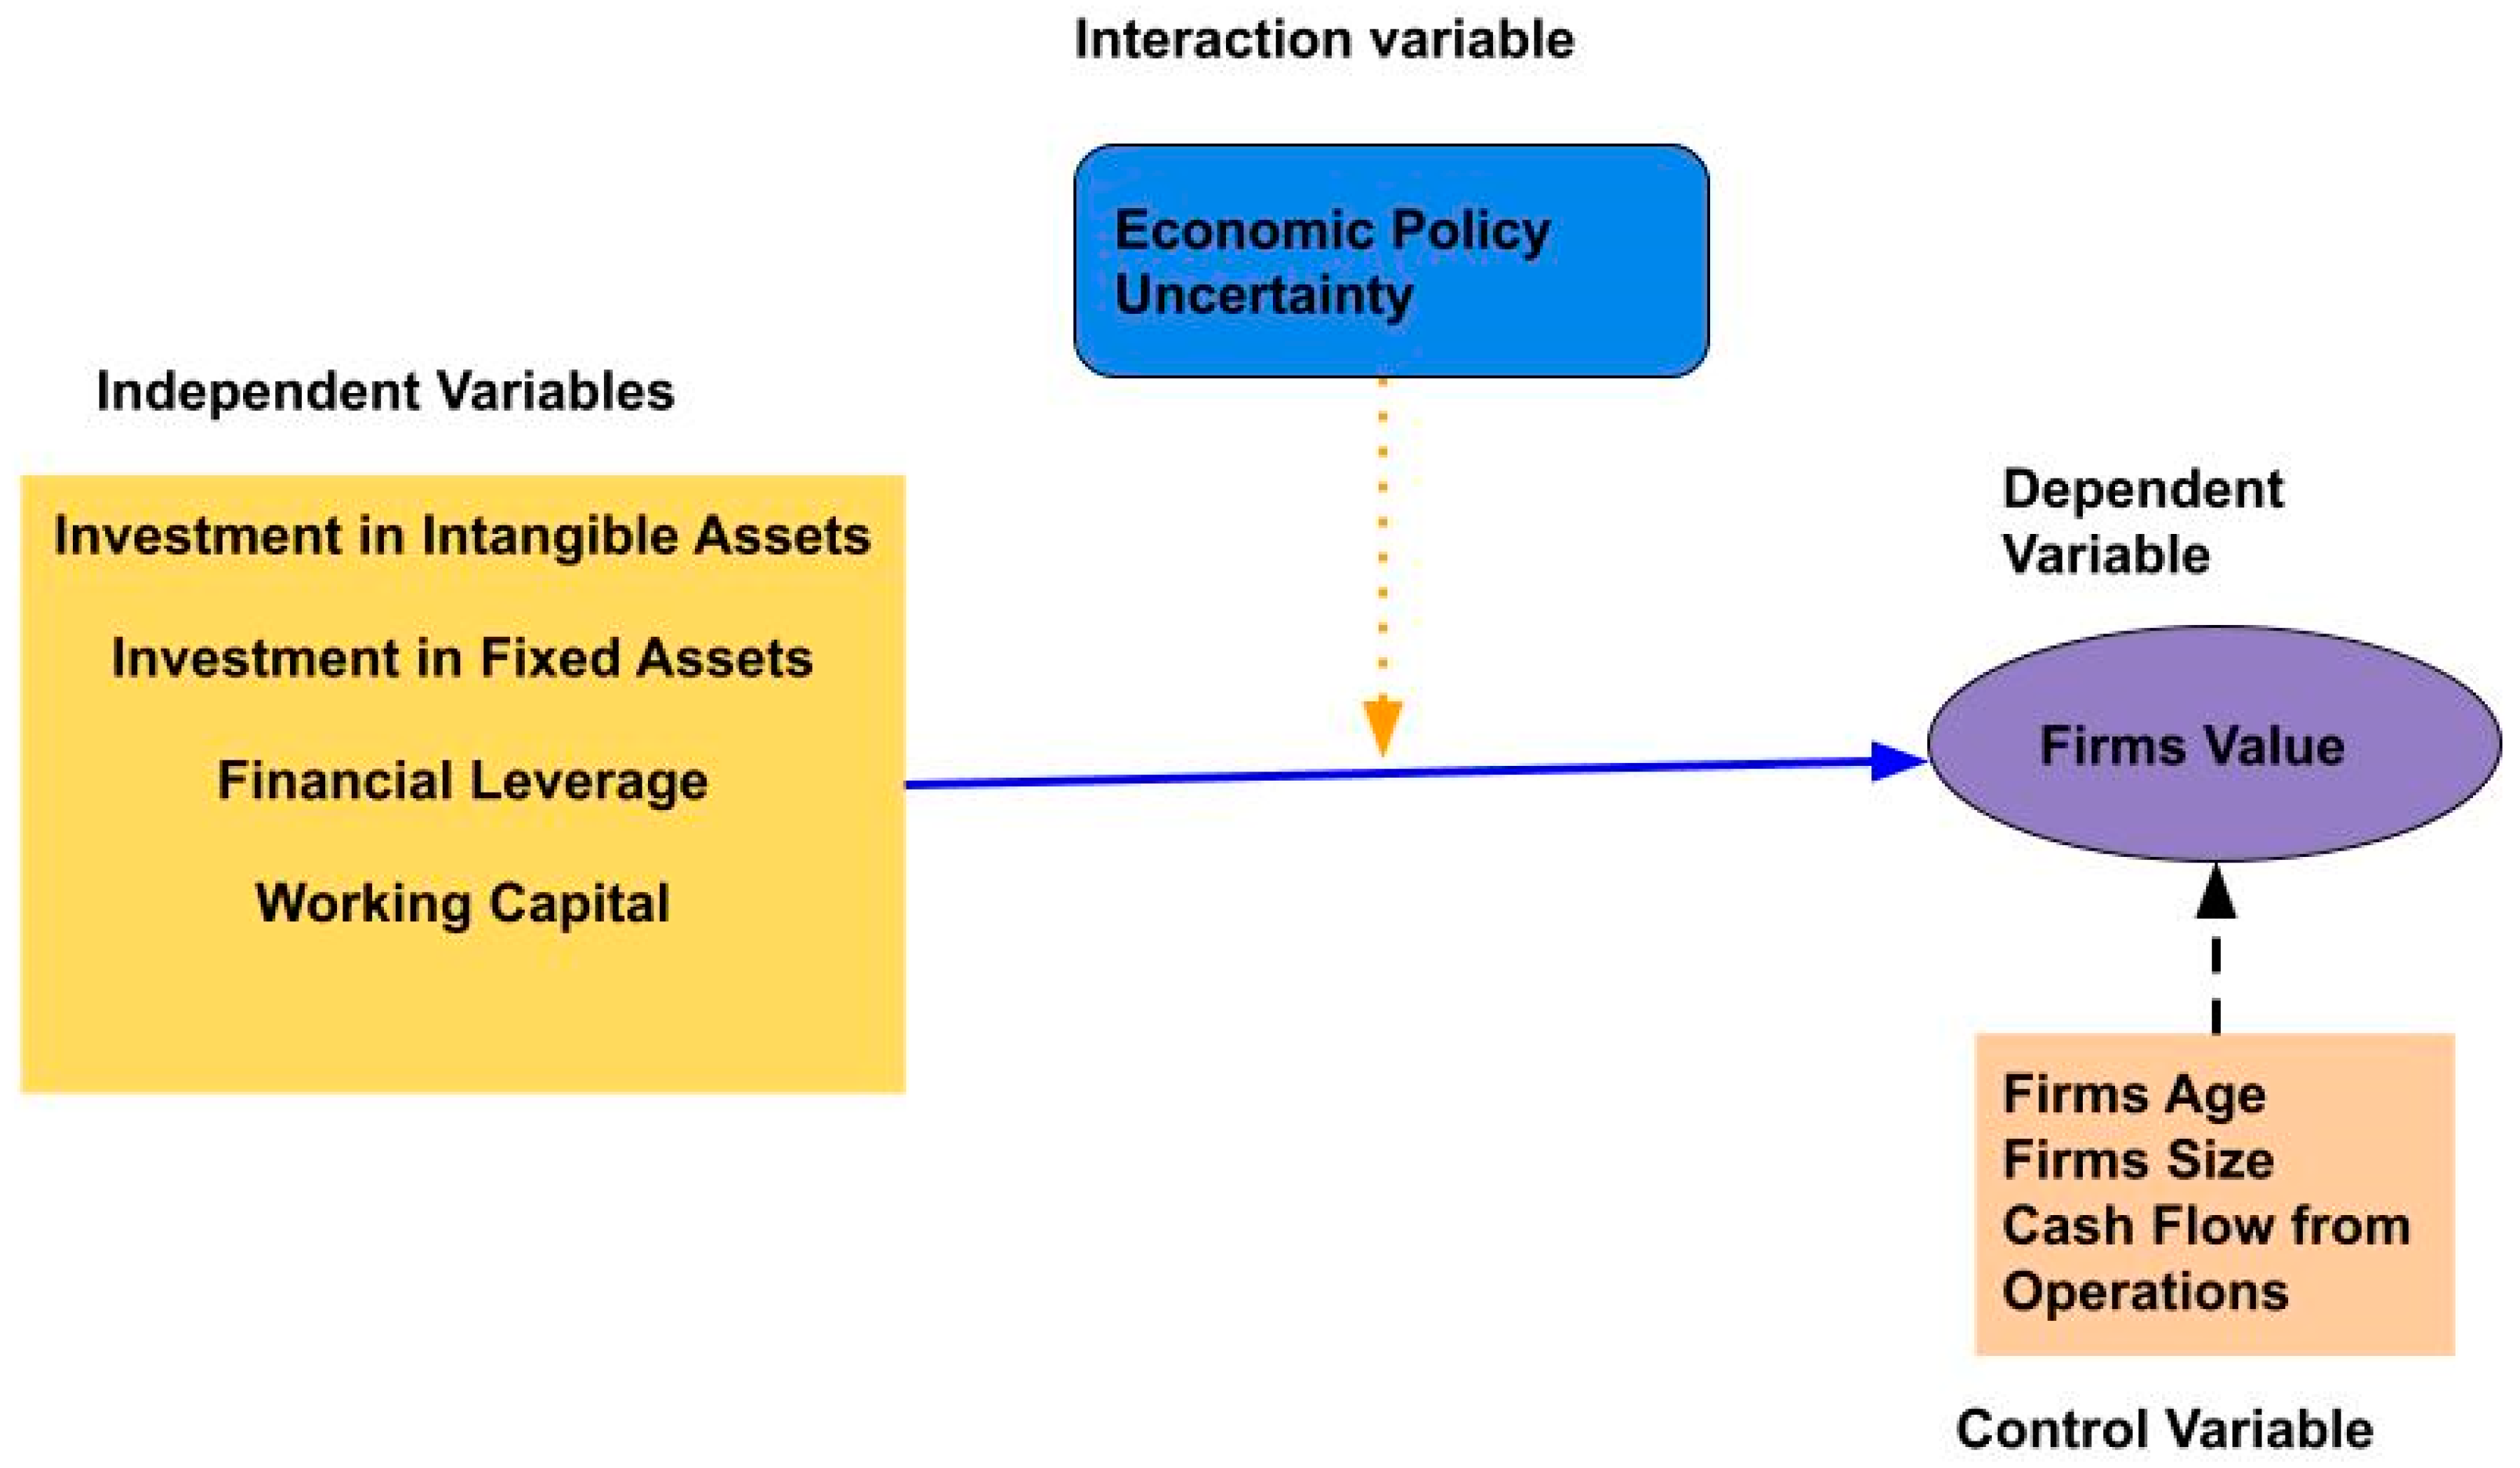
Statistics descriptive: Table 1 offers descriptive statistics for the key variables and an overview of the data utilized in the research. The variables in the data include: IFA (investing in non-moving assets), INTA (investing in intangible assets), FLR (financial leverage ratio), WCR (working capital ratio), EPU (economic policy uncertainty index), FS (firm size), AGE (firm age), CFO (cashflow from operations), Tobin’s Q, and MPPS (market price per share) are some other financial metrics. While WCR is derived by dividing current assets by current liabilities, FLR is computed by dividing total assets by equity. Scott Baker, Nicholas Bloom, and Steven Davis created a gauge of economic policy uncertainty known as the EPU index. AGE, CFO, and FS are all measurements of the age and performance of a corporation, and FS is calculated by taking the logarithm of the total assets. Essential determinants of a company’s financial performance are Tobin’s Q and MPPS. As opposed to MPPS, which is the market price per share of a company’s stock, Tobin’s Q is calculated by dividing the market value of a firm by the cost of replacing its assets. The research seeks to thoroughly understand the link between economic policy uncertainty and company investment behavior by considering these factors.
Additionally, MPPS is calculated by dividing the share price as of the current day by the total number of outstanding shares. We used the natural logarithm approach to standardize the initial annual data. The cash flow is calculated annually by subtracting the net operating cash flow.
The average Tobin’s Q and market price per share values in Pakistani manufacturing companies are 1.411 and 93.513, respectively, representing the income based on shareholder investment. The average financial leverage is 6.766, the average EPU is 95.326 percent, and the average CFO is 0.226 for businesses that want to balance current assets and liabilities. The average INTA value is approximately 6.632. It suggests that very few intangible assets are owned by Pakistani companies, and they have less of a predisposition to hold assets that would swiftly and gradually amortize. While investing in fixed assets indicates a 15.763 mean value. Age is shown to have a mean value of 30.600 across all manufacturing industries. Examining the mean size value, which in this case is 15.783, which indicates a very high correlation between total assets, is the next factor that is particularly appropriate. We can see that some variables have a more comprehensive range of values than others based on the descriptive statistics given in the table. For instance, the maximum value of the variable FL is 195.511, significantly higher than its mean value of 6.766. It implies that the distribution of this variable may contain some extreme values. The variable MPPS is similarly widely dispersed from the mean, as shown by its high standard deviation of 253.211. The range of values for the variable INTA is smaller, with a minimum and maximum value of 6.632 and 18.371, respectively, and a relatively low standard deviation (5.740).
Table 2: INTA and IFA strongly connect with MPPS and Tobin’s Q. The firm performance accounting model will enable meaningful, apparent linkages between macroeconomic indicators such as EPU, Tobin’s Q, and MPPS. Tobin’s Q and MPPS are output-dependent and closely associated with the macroeconomic vector and EPU. Table 3 and Table 4 (2.76 and 2.08) show how variance inflation analysis (VIF) handled the variable multicollinearity issue. All values are less than 10, and in all models, the greatest VIF value is linked to the variance influence factor values of 2.76 and 2.08, respectively. The variables’ impacts will not have multicollinearity. Table 2 shows how much INTA, IFA, FL, and WC affect company success. Further research has shown strong evidence for the association and hypothesis effects in Table 3.
The yearly financial statement includes fixed assets, intangible assets, and other long-term assets. Capital expenditure measures companies’ fixed asset investments as a percentage of total assets at the start of the fiscal year. The Pakistan Monthly Index of Policy Uncertainty measures economic policy uncertainty. Scott Baker, Nicholas Bloom, and Steven Davis calculated “Measuring Economic Policy Uncertainty”, the EPU index. Net operational cash flow is divided by total assets at the start of the fiscal year. Total debt is divided by total assets one period later to calculate the market value of traded and non-traded shares. A one-period lag leverage ratio is the ratio of total debt to total assets. Size is the current total asset’s natural logarithm.
The correlation matrix was examined to see whether economic policy uncertainty negatively affected company investment. Economic policy uncertainty affects firm investment. Corporate investment tends to drop when economic policy is unclear. Table 2 shows relevant variable correlation coefficients. As shown, Tobin’s Q and investments in physical and intangible assets (0.410; 0.433) and firms’ size and intangible assets (0.517; 0.866) are the only significant correlations. Corporate investment correlates positively with other factors but negatively with the CFO’s measure of economic policy uncertainty.
EPU negatively correlates with Tobin’s Q, intangible assets, and fixed assets. The variance inflation factor (VIF) tests regression analysis for multicollinearity. Both leaner models (below 10) had VIFs of 2.76 and 2.08, indicating no multicollinearity.
Real options theory is used practically by examining how different factors affect a firm’s Tobin’s Q, which calculates the market value of a company’s assets based on their replacement cost. The following factors were considered in this analysis: MPPS, IntA, IFA, FL, WC, EPU, age, size, and CFO. According to this study, MPPS significantly improves Tobin’s Q. This implies that businesses that make new investments or increase their operational capacity frequently enjoy greater market value. Tobin’s Q is positively influenced by IntA, age, size, and CFO, suggesting that investors often value bigger, older companies with better financial performance.
On the other hand, IFA, FL, and EPU negatively impact Tobin’s Q. According to this, elements including significant financial debt, an unclear economic outlook, and a lack of investment in fixed assets may affect a company’s market value. Overall, the analysis’s findings emphasize the significance of considering natural choices when making investment decisions and the possible effects that outside influences may have on a company’s value. Firms may more accurately determine the future value of their assets and make better investment choices by adding real options theory into their decision-making processes.
Table 5 also reports several diagnostic tests commonly used to evaluate the model’s validity. We used several tests to assess errors in the model’s specification, including the B&P LM test, the Hausman test, the heteroskedasticity test, the autocorrelation test, and the VIF test. In contrast, the Sargan and Hansen tests test the validity of the instruments used in the GMM estimation. The AR1 and AR2 tests test for autocorrelation in the model’s residuals. The threshold is that the problem is not present in the model if its value is significant. In this model, the dependent variable is Tobin’s Q, a financial metric used to measure a firm’s market value relative to its assets. The model includes nine independent variables: IntA, IFA, FL, WC, EPU, age, size, CFO, and a constant term. Model GMM is a regression model estimated using the Generalized Method of Moments (GMM) estimation technique. GMM is a popular econometric method used to estimate a model’s parameters when the assumptions of ordinary least squares (OLS) or fixed effects (FE) regression models are violated.
We applied both static and dynamic statistical models in this research. Ultimately Our baseline regression equation is based on research investments in intangible assets, investments in fixed assets, and working capital [43,44]. We observed how much focus financial managers have on financial leverage and decisions regarding the use of internal funds or external sources and found that it has a negative relationship with Tobin’s Q, which means the usage of internal funds is supportive as compared with debts. We lag Tobin’s Q and MPPS variable by one period, following [45,46]. The following is the central equation in Model 4, the primary model for our upcoming empirical discussion. In Table 3, Table 4, Table 5 and Table 6, our major focus will be Model Four.
( Tobin sQ i t ) = δ TobinQ i , t 1 + β 1 ( INTA i t ) + β 2 ( IFA i t ) + β 3 ( FL . i t ) + β 4 ( W C i t ) + β 5 ( E P U i t ) + β 6 ( A g e i t ) + β 7 ( S i z e i t ) + β 8 ( C F O i t ) + μ i t
where MPPSit is the market price per share and Tobin’s Qit, a firm’s market performance indicator, are used. INTAit represents intangible value at the end of each year, FLit represents leverage ratio in the previous period, WCit represents current assets to current liabilities during the last period, EPUit represents uncertainty in economic policies in each period, CFOit represents cash flow, Firm sizeit represents firm size, which is sales revenue scaled by assets, and Firm ageit represents firm age. We hypothesize that businesses spend less on tangible and intangible assets when economic policy uncertainty is high. This anticipation is predicated on the idea that uncertainty breeds risk aversion and postpones investment choices. We estimated a regression model using our dataset to test our hypothesis, and the results are shown in Table 6.
Based on the empirical findings, we determine that Model 4, in Table 7 and Table 8 which contains a lag-dependent variable, is the best specification for our research. We interpret the results in light of the significant coefficients produced by the GMM system model. Economic policy uncertainty, our main factor of interest, is proven to have a significant detrimental impact on company investment in both tangible and intangible assets. This result implies that enterprises are less inclined to invest in assets with long-term advantages when uncertainty is high, maybe due to the option value of delaying investments in uncertain situations. This outcome is consistent with the idea that investments are irreversible [47].
Additionally, we expand Model 4 to include age, size, and CFO as three control variables. These variables are designed to measure how business characteristics affect investment choices. Our results indicate that economic policy uncertainty significantly influences corporate investment choices in tangible and intangible assets, even after adjusting for other firm-specific factors.
The finding is consistent with the principle of irreversibility in investments and the expected benefit of postponing investments, e.g., [48]. We extend Model (4) to include the three control variables age, size, and CFO. The results demonstrate that, despite the sizeable and favorable impacts of economic policy uncertainty, cash flow from operations, age, and business size all have a large negative effect on Tobin’s Q. Therefore, our first hypothesis is not supported. It suggests that enterprises involved in Pakistani manufacturing are not focusing on external macroeconomic uncertainty when developing their plans to invest in fixed or intangible assets because of the uncertain economic policy climate. We employed interaction terms in Model 4 of Table 5 when Tobin’s Q is our dependent variable. In the open discussion, we will focus on Table 4’s finding Model 4 in the last column.
Real options theory is a financial theory that enables businesses to choose their strategic investments based on their possible future worth. It tries to estimate the investment’s worth considering its ambiguity and flexibility. In this situation, the GMM model examines how real option theory is used to make business investment choices. Tobin’s Q, a measurement of the market value of a firm’s assets relative to their replacement cost, is a component of the model. Additional factors that affect a company’s financial and operational success include IntA, IFA, FL, WC, EPU, age, size, and CFO.
Each variable’s influence on the firm’s investment choice is represented by a set of coefficients in the model, some of which are statistically significant while others are not. The EPUIFA, EPUINTA, EPUFL, and EPUWC coefficients show how the company’s economic policy uncertainty (EPU) interacts with each of the other variables. Diagnostic tests, including the Sargan test, Hansen test, and AR1 and AR2 tests, are utilized to guarantee the validity and correctness of the model. These tests look for problems, including heteroscedasticity, autocorrelation, and endogeneity. This model, among others, applies real options theory in this situation to examine investment choices and estimate their prospective worth in light of hazy future developments.
Tobin’s Q, which gauges a company’s market value, and the number of independent variables are estimated using GMM in this model. Here is a basic explanation of how Tobin’s Q relates to each independent variable. When discussing investment in intangible assets, the coefficient is positive and statistically significant. It reveals that companies with larger intangible asset investments have higher Tobin’s Qs. It could be because intangible assets, such as patents and trademarks, can give businesses a competitive edge and raise their market value. The statistically significant positive coefficient indicates that enterprises with more fixed asset investments have higher Tobin’s Qs. It can be the case since investing in fixed assets can increase a company’s capacity for output and competitiveness, raising its market value. Financial leverage has a positive, statistically significant coefficient, meaning that businesses with more financial leverage and more debt compared with equity have a positive association with Tobin’s Q and are more valuable.
If the firm can provide a return on investment greater than the cost of its debt, then increased leverage may result in better returns for equity investors. The positive and statistically significant working capital ratio coefficient shows that businesses with a greater working capital ratio of more current assets than current liabilities tend to have higher Tobin’s Qs. It could be the case because investors may perceive a firm favorably if it has a greater working capital ratio as a sign that it has more liquidity and is better equipped to satisfy its short-term commitments. A greater Tobin’s Q is often seen with businesses functioning in an environment with more uncertain economic policy, according to the positive and statistically significant uncertainty coefficient. It can seem illogical to do this. However, investors may reward firms that can navigate and adapt to ambiguous economic situations. Because the age coefficient is statistically significant and negative, it shows that older businesses often have a lower Tobin’s Q. Younger businesses may have more development potential and are seen as more inventive and energetic, which might account for this. The positive and statistically significant size coefficient shows that bigger businesses often have a greater Tobin’s Q. The size, operating cash flow, and unpredictability of economic policy are a few variables that affect a company’s share price in the market. Market valuations are often higher for bigger, more powerful firms. Furthermore, companies with greater cash flow from operations often have higher market values because they may reinvest their gains into the business or pay them to shareholders.
Economic policy uncertainty affects the link between each independent variable and Tobin’s Q, a metric of a company’s market value in proportion to its assets. The interaction terms EPUIFA, EPUINTA, EPUFL, and EPUWC describe this connection. The negative coefficients of these components show the weakening of the positive association between each independent variable and Tobin’s Q when economic policy uncertainty is high. It shows that the unpredictability of economic policy may moderate the link between these variables and Tobin’s Q.
Depending on their financial status and limits, various enterprises may be impacted differently by economic policy uncertainty. According to our data, companies with higher Tobin’s Q scores, greater internal financing capacity, and non-state ownership are less likely to be adversely affected by uncertain economic conditions when making investment choices. These businesses could be better equipped to manage unpredictable times and keep making investments in their assets. Following [48,49], we make the following adjustments to our original regression equation to account for interaction terms:
T o b i n s Q i t = δ T o b i n Q i , t 1 + β 1 I N T A i t + β 2 I F A i t + β 3 F L . i t + β 4 W C i t + β 5 E P U i t + β 6 A g e i t + β 7 S i z e i t + β 8 C F O i t + β 9 I N T A E P U i t + β 10 I F A E P U i t + β 11 F L E P U i t + β 12 W C E P U i t + μ i t
When estimating the parameters in Equation (1), the Generalized Method of Moments (GMM) method considers any possible unmeasured error factors or endogeneity of the model’s explanatory variables. In the middle of the 1990s, refs. [49,50] created the GMM estimate technique. The GMM technique combines equations at the level for which lagging variances of endogenous constructs are utilized as instruments with equations at the first difference that employ lagging levels of endogenous constructs as instruments. The endogenous variables in this research are INTAit, IFAit, FLit, and WCit, as well as the terms that govern their interactions with EPUit. Cash flows from operations and economic policy uncertainties are further factors. A series of instruments are used with delays starting from the second on the back for the first-difference equations and with lag 2 in the levels equation to handle the potential of delayed impacts of economic policy shocks on the real economy. The Sargan–Hansen test of over-identifying constraints is used to assess the validity of instruments. The squared correlation between the dependent variable’s actual and anticipated values is the goodness-of-fit metric.
The error term is examined for potential autocorrelation problems using the Lagrange multiplier test. We use the [51] STATA system GMM estimation tool, xtabond2, for econometric estimation. Model 4 generates the GMM estimate when the general interaction effect of economic policy uncertainty is considered, as shown in Table 5. The delayed Tobin’s Q shows that Sargan–Hansen tests do not challenge the validity of over-identifying limitations; all anticipated variables have extremely significant signals that make intuitive sense. However, Lagrange multiplier tests for second-order correlation in the error component cannot disprove the null hypothesis that there is no autocorrelation in empirical models. The model seems to have great potential for explanatory power based on the goodness-of-fit statistics produced from the inverse correlation between the actual and anticipated values of Tobin’s Q. The linearity terms included in the model make sure that missing variables are not to blame for the substantial model and relative significance of an interaction effect. The result shows that the relationship between Tobin’s Q and investment in tangible and intangible assets increases when firm-level uncertainty rises [52].
( MPPS i t ) = δ MPPS i , t 1 + β 1 ( INTA i t ) + β 2 ( IFA i t ) + β 3 ( FL . i t ) + β 4 ( W C i t ) + β 5 ( E P U i t ) + β 6 ( A g e i t ) + β 7 ( S i z e i t ) + β 8 ( C F O i t ) + μ i t
A rise in investment in intangible assets is linked to an increase in MPPS, according to the positive and statistically significant coefficient for IntA. It implies that investors may believe businesses with stronger intangible asset investments (such as patents or intellectual property) have more growth potential and long-term profitability. A rise in investment in fixed assets is linked to a drop in MPPS, according to the negative and statistically significant IFA coefficient. Investors could assume that businesses with larger fixed asset investments are less effective or quick to adjust to shifting market circumstances. As shown by the negative and statistically significant coefficient for FL, higher levels of financial leverage are linked to lower MPPS. Investors can interpret this to mean that more leverage raises the possibility of economic difficulty or insolvency. The working capital coefficient is negative and weakly significant, showing that a lower MPPS correlates with a greater working capital ratio (current assets minus current liabilities). Investors could assume that businesses with greater working capital are less adept at managing their cash flow or inventories. Greater degrees of economic policy uncertainty are linked to greater MPPS, according to the positive and statistically significant coefficient for EPU. Investors may believe that uncertainty increases the likelihood of future gains or expansion prospects. The statistically significant negative age coefficient shows that older enterprises have lower MPPS than younger ones. It may imply that investors think more innovatively or with more growth potential about younger companies. Larger enterprises have greater MPPS than smaller firms, according to the positive and statistically significant size coefficient, which is positive. It can imply that investors believe bigger companies are more diversified or have more dependable cash flows.
CFO: The statistically significant negative coefficient for CFO shows that lower MPPS are connected with greater cash flow from operations. It can imply that investors think the company is not investing enough in successful ideas if its cash reserves are large. The coefficients for these four interaction terms, EPUIFA, EPUINTA, EPUFL, and EPUWC, are negative and statistically significant, demonstrating that levels of economic policy uncertainty mitigate the impacts of IFA, IntA, FL, and WPS on MPPS. The negative coefficient for each interaction term indicates that the negative effects of IFA, IntA, FL, and WPS on MPPS are less pronounced at times of significant economic policy uncertainty. It could imply that during difficult times, investors consider businesses with substantial investments in fixed or intangible assets or high levels of financial leverage less hazardous, potentially due to these businesses’ higher physical assets or more diversification. Similarly, the positive coefficient for EPU indicates that high levels of uncertainty may boost the possibility of growth, which may partially counteract the negative consequences of excessive financial leverage or investment in fixed or intangible assets.
The shown models illustrate the effects of different independent factors on the dependent variables of Tobin’s Q and market price per share. The research discovered substantial positive connections between Tobin’s Q and IFA, FL, WC, EPU, and size. Tobin’s Q, on the other hand, was negatively impacted by age, showing that older businesses had lower market values. IntA, EPU, and size were shown to have a positive link with market price per share, whereas IFA, WC, and CFO had a negative relationship. FL had hardly any impact on MPPS. It is important to highlight that the findings may not generalize to other situations since they depend on the particular dataset and model parameters utilized in the research.
Overall, the findings suggest that various factors, including a firm’s investment in fixed and intangible assets, financial leverage, working capital, economic policy uncertainty, and firm size, can influence a firm’s market valuation.
( MPPS i t ) = δ MPPS i , t 1 + β 1 ( INTA i t ) + β 2 ( IFA i t ) + β 3 ( FL . i t ) + β 4 ( W C i t ) + β 5 ( E P U i t ) + β 6 ( A g e i t ) + β 7 ( S i z e i t ) + β 8 ( C F O i t ) + β 9 ( INTA EPU i t ) + β 10 ( IFA EPU i t ) + β 11 ( FL EPU i t ) + β 12 ( W C EPU i t ) + μ i t
According to the results of the Generalized Method of Moments (GMM) analysis, the variables MPPS (market price per share), IntA (investment in fixed assets), IFA (investment in fixed assets), FL (firm leverage), WC (working capital), EPU (economic policy uncertainty), age, size, and CFO (cash flow from operations) are significant determinants of firm value. These variables influence businesses’ real option value in the real option theory setting. For instance, companies with high MPPS may have more latitude to postpone investment choices since they have a larger value of actual options. Similarly, businesses with high levels of cash flow from operations (CFO) could better adapt their investment plans to changes in the macroeconomic environment. The findings imply that a considerable impact on company value is caused by the interplay between EPU and certain firm-specific characteristics, including IFA, IntA, FL, and WC. It is suggested that the effect of EPU on company value depends on the unique traits of the business and the worth of its actual choices. These results may aid businesses in making investment choices in hazy economic climates. Firms may choose the best time to invest, the amount to invest, and the investment strategy by knowing the variables that impact the value of their real choices. Moreover, companies may more accurately analyze the influence of EPU on their investment choices and modify their strategies as necessary by considering the interplay between EPU and firm-specific variables.
The stock market price of a company is the dependent variable in this research. The shift in economic policy uncertainty from positive to negative is estimated using the market price per share shock (MPPS) lag. Economic policy irrationality impacts this connection, which has a positive and statistically significant coefficient for the lag-dependent variable. The importance of other coefficient estimates is mostly unaffected by the interaction term and the lack of a change in economic policy uncertainty.
The effect of uncertain economic policy on a firm’s investment in physical and intangible assets, financial leverage, and working capital is examined in Column 4 of Table 6. This column contains “company stock market price volatility” and “economic policy uncertainty.” The EPUINTA and EPUWC interaction variables are negative in Column 4 of the system GMM regression equation, suggesting a negative impact on businesses’ short- and long-term investment choices. Column 4’s significance threshold is set at 1%.
The lag-dependent variable MPPS’s positive and significant coefficient estimates align with what we anticipated. Given that all coefficients are effective at the 1% level, we utilized the system GMM model in Column 4 to conclude that economic policy uncertainty moderates the variables. Our research suggests that, in addition to the influence of policy shocks, individual business uncertainty, such as stock price volatility, influences company-level investment choices. It is consistent with the real alternatives hypothesis, which holds that when faced with uncertainty, firms are more likely to postpone investment and production [53]. When intrinsic uncertainty increases, businesses are more susceptible to negative extrinsic economic policy shocks.
The share market price of a company is a key metric for assessing its success in the world of finance. A GMM regression analysis result is shown in Table 6, which reveals the correlation between MPPS, the dependent variable, and several independent variables. The table contains a wealth of data that may aid analysts and investors in making wise choices.
The degree of confidence in the findings is indicated by the numbers in parenthesis next to the coefficient estimations. As we go down the rows, we can see that certain factors influence MPPS positively while others have a negative impact. When an independent factor changes, the coefficients indicate how much the share market price is expected to vary.
By closely reviewing the findings, we may find patterns and insights that are not immediately obvious. For instance, we may see that a firm’s investment in physical and intangible assets, financial leverage, and working capital are negatively impacted by economic policy’s unpredictability. It shows that firms are more cautious in their investment decisions when the policy climate is unclear. Table 6 comprehensively examines the intricate world of money and economics. Anyone trying to make wise selections in investing and corporate finance may benefit from the insights included in it.
The findings demonstrate a high positive correlation between Tobin’s Q Lag value and MPPS, with a coefficient estimate of 0.998 and a standard error of 0.0896. It implies that businesses with a high Tobin’s Q also often have high MPPS [54]. With a coefficient estimate of 29.23 and a standard error of 12.02, IntA likewise exhibits a favorable connection with MPPS. It implies that businesses with significant intangible assets also have significant MPPS. With a coefficient estimate of −54.52 and a standard error of 67.31, IFA has a bad connection with MPPS. It implies that businesses with substantial financial asset investments often have low MPPS. With a coefficient estimate of −1.348 and a standard error of 4.959, FL has a bad connection with MPPS. It implies that businesses with significant financial leverage often have poor MPPS. With a coefficient estimate of 0.731 and a standard error of 2.924, WC shows a favorable connection with MPPS. It implies that businesses with large working capital have higher MPPS levels. With a coefficient estimate of −4.745 and a standard error of 4.261, EPU has a bad connection with MPPS. It implies that businesses that operate in highly unpredictable environments often have low MPPS. With a coefficient estimate of 15.58 and a standard error of 11.91, age positively correlates with MPPS. It implies that older businesses often have higher MPPS. With a coefficient estimate of 4.975 and a standard error of 8.840, size positively correlates with MPPS. It means that bigger firms often have higher MPPS. With a coefficient estimate of −7.098 and a standard error of 14.95, the CFO has a poor connection with MPPS. According to this, companies with insufficient cash flows often have low MPPS.
The outcomes also demonstrate a positive relationship between MPPS and the interaction between EPU and IFA, with an estimated coefficient of 0.275 and a standard error of 0.286. It suggests that firms operating in a high-uncertainty environment with high investments in financial assets tend to have high MPPS. Similarly, the interaction between EPU and INTA has a negative relationship with MPPS, with a coefficient estimate of −0.0572 and a standard error of 0.122. It suggests that firms operating in highly uncertain environments with high intangible assets tend to have low MPPS. The interaction between EPU and FL has a positive relationship with MPPS, with a coefficient estimate of 0.00907 and a standard error of 0.0422. It suggests that firms operating in a high-uncertainty environment with high financial leverage tend to have high MPPS.
Finally, the interaction between EPU and WC has a negative relationship with MPPS, with a coefficient estimate of −0.0111 and a standard error of 0.0306. It suggests that firms operating in a high-uncertainty environment with high working capital tend to have low MPPS.
Overall, the results of the GMM analysis provide insights into the relationship between various independent variables and MPPS. The findings suggest that Tobin’s Q, intangible assets, working capital, age, and size have positive relationships with MPPS, while financial assets, financial leverage,
The findings of a GMM regression study that looked at the correlation between the dependent variable MPPS and several independent factors are shown in Table 6. In parenthesis, the table gives the coefficient estimates and the accompanying standard errors. These coefficients show the magnitude and axis of the link between the independent and dependent variables. The analysis’s findings indicate that several different factors and MPPS are significantly correlated. While FL and EPU have negative relationships with MPPS, IntA, size, and WC have favorable relationships with them. Additionally, only the IFA coefficient is significant, whereas the age, CFO, and IFA coefficients are all negative.
Additionally, the significant interactions between EPU, IFA, INTA, FL, and WC indicate that the values of IFA, INTA, FL, and WC affect the link between EPU and MPPS. These findings suggest that IntA, size, and WC favorably impact MPPS, whereas FL and EPU are adversely impacted. However, given that these results are based on a particular dataset and model, it is crucial to use care when extrapolating them to other scenarios.
These findings emphasize the need to consider various variables when examining how uncertainty in economic policy affects MPPS. According to the results, businesses may be more likely to keep more working capital and invest in physical and intangible assets when there is less economic policy uncertainty. On the other hand, high levels of economic policy uncertainty may cause businesses to lower their financial leverage and put off making investment choices. The impact of interactions between EPU and other independent variables shows how complicated this connection is and how important it is to grasp the variables at work thoroughly. By closely reviewing the findings, we may find patterns and insights that are not immediately obvious. For instance, we may see that a firm’s investment in physical and intangible assets, financial leverage, and working capital are negatively impacted by economic policy’s unpredictability. It shows that firms are more cautious in their investment decisions when the policy climate is unclear. Table 6 comprehensively examines the intricate world of money and economics. Anyone trying to make wise selections in investing and corporate finance may benefit from the insights included in it.

4.3. Explanation of the Hypothesis

According to Hypothesis 1, Table 5 and Table 6 show that Hypothesis 1—that investment in intangible assets and economic policy uncertainty (EPU) affect business value—is statistically significant. Table 5 presumably offers a statistical analysis of the major effects of intangible asset investment, economic policy uncertainty, and their relationship to business value. This analysis shows how each variable affects business value. Table 6 will show how investment in intangible assets and economic policy uncertainty affect firm value. It would show whether the interaction term is statistically significant, indicating that these variables affect company values more than their separate effects. To prove a statistically significant interaction effect, these tables provide p-values and coefficients. It would show that the observed interaction effect is unlikely to have occurred randomly and that the combined effect of investment in intangible assets and economic policy uncertainty on firm value differs from their personal effects. To clarify the conclusions, examine the research study’s tables and results. It is suggested that, depending on the level of economic policy uncertainty, the impact of investing in intangible assets on business value may be boosted or diminished. The type and ramifications of this interaction effect must be determined through additional research and testing. Intangible assets are non-physical assets that companies own and operate, such as patents, trademarks, and copyrights.
When economic policy uncertainty is high, firms are less inclined to invest in fixed and intangible assets because they are unclear about future financial circumstances and the possible effects of policy changes on their investment choices. Businesses could hang onto their cash in such a scenario instead of investing it in potential loss-making assets. In contrast, firms are more inclined to invest in fixed and intangible assets when economic policy uncertainty is low because they are more confident in the state of the economy and the prospective returns on their investments. It may result from consistent governmental actions, an expanding economy, and favorable market circumstances.
Overall, Hypothesis 1 shows that economic policy uncertainty greatly impacts a firm’s investment choices in intangible assets.
According to Hypothesis 2, Table 5 and Table 6 show a statistically significant interaction between financial leverage and economic policy uncertainty on business value. Table 5 may provide a statistical analysis of financial leverage, economic policy uncertainty, and other variables affecting business value. It shows how each variable affects business value. Table 6 examines the financial leverage-economic policy uncertainty connection. It indicates whether the combined effect of these two variables on business value differs considerably from their independent effects.
The significant results suggest that economic policy uncertainty affects financial leverage and corporate value. Economic policy uncertainty may increase or decrease the impact of financial leverage on corporate value.
Thus, financial leverage may have a greater influence on corporate value during periods of severe economic policy uncertainty. This interaction effect suggests that economic policy conditions can change enterprises’ leverage decisions, which affects their value. Use the tables’ p-values or coefficients to prove a substantial interaction effect. Further analysis and interpretation are needed to completely comprehend this interaction’s impact on the research investigation. Firms depend more on external funding sources, such as bank loans, bonds, or equity financing, than internal ones, such as retained profits or cash reserves, when economic policy uncertainty is high. Because of increased monetary policy uncertainty, firms may be less willing to spend internal capital on long-term initiatives. They can instead go to the outside world for finance to lessen their risks and uncertainties.
In contrast, firms may be more eager to utilize internal resources to finance investments in real and intangible assets when economic policy uncertainty is low because they see fewer risks and economic uncertainties. They could be less dependent on outside money as a consequence. Overall, the theory contends that firm financing choices are influenced by the degree of economic policy uncertainty, with higher levels of delay resulting in a greater dependence on outside finance sources. According to this theory, financial leverage and the unpredictability of economic policy have a major interaction effect on firm value. It implies that economic policy uncertainty affects the link between financial leverage and corporate value. The theory suggests that the impact of financial leverage on enterprise value may depend on the firm’s exposure to economic policy uncertainty. This interaction effect’s precise nature and ramifications would require further examination and research.
According to Hypothesis 3, Table 5 and Table 6 show a statistically significant interaction between fixed asset investment and economic policy uncertainty on business value. Table 5 may provide the statistical analysis of fixed asset investment, economic policy uncertainty, and other variables on company value. It shows how each variable affects firm value. Table 6 examines the link between fixed asset investment and economic policy uncertainty. It shows whether the combined effect of these two variables on firm value differs considerably from their independent effects. The significant results suggest that economic policy uncertainty affects fixed asset investment and business value. Economic policy uncertainty alters the impact of fixed asset investment on business value. Thus, fixed asset investment may have a greater influence on business value during periods of severe economic policy uncertainty. This interaction effect shows that economic policy conditions affect fixed asset investment decisions and their value. The value of a corporation is significantly impacted by the relationship between fixed asset investment and economic policy uncertainty. It implies that economic policy uncertainty affects the link between fixed asset investment and business value. According to the idea, the effect of fixed asset investments on business value may differ depending on uncertain economic policy. More investigation and analysis would be needed to examine the precise particulars and ramifications of this interaction effect.
Table 5 supports Hypothesis 4 by statistically examining working capital management, economic policy uncertainty, and other variables affecting business value. It shows how variables affect business value. Table 6 compares working capital management, economic policy uncertainty, and corporate value. It evaluates if the combined effect of these two variables on business value differs significantly from their standalone effects. Significant findings suggest that working capital management and economic policy uncertainties affect corporate value. Results reveal that working capital management and economic policies affect firm value.
Working capital management may affect corporate value more under economic policy uncertainty. Economic policy uncertainty may affect a company’s working capital management, including cash flow, inventories, receivables, and value. When economic policy uncertainty is low, companies may be more confident and invest in working capital to improve operations and financial stability. Operational capital and value may increase. Tables’ p-values and coefficients determine impact. Working capital management, economic policy uncertainty, and business value need more investigation.

5. Conclusions

This study concluded that various variables significantly affected the firm’s value and investment choices, including Tobin’s Q, MPPS, IntA, IFA, FL, WC, EPU, age, size, and CFO. In the framework of real options theory, several things impact firms’ real choice values. This study also found that the importance of a firm’s choices and distinguishing qualities is significant in how economic policy uncertainty (EPU) influences a firm’s value. Our findings provide helpful advice on how businesses could pick their investments in uncertain economic climates by considering the variables affecting their real decisions’ value. This study finds that the interplay between EPU and firm-specific characteristics such as IFA, IntA, FL, and WC considerably impacts company value. Finally, this study’s regression analysis revealed that whereas Tobin’s Q Lag, IntA, WC, age, and size have positive relationships with MPPS, IFA, FL, and CFO have negative ones. This study highlights how important it is for investors to consider internal company uncertainty and external economic policy shocks when making investment decisions.
Our research findings highlight the vital importance of real options theory in understanding how policy uncertainty affects enterprises’ financial constraints and investment activity. Our data support the idea that policy uncertainty has detrimental effects on investments due to market frictions by confirming that it exacerbates financial conditions and hinders access to external finance. Our analysis also demonstrates that contradictory economic policies have a negative effect on market share prices but are favorably related to financial leverage. We also find a strong correlation between working capital operations, an important financial statement indicator, and the market price per share for the sample companies. Our findings are supported by the discovery of a link between a firm’s physical and intangible assets and the unpredictable nature of economic policy. We must recognize that our findings may not generalize to other contexts since they depend on the information and methods used in our research. However, our results provide an important new understanding of how policy uncertainty affects businesses’ financial judgments and investment practices.
The implications of our study are particularly significant for businesses with constrained budgets. We demonstrate that the real negative effects of economic policy uncertainty on fixed asset investments are more pronounced at times of heightened macroeconomic variables due to a lack of external loan financing and unfavorable lending circumstances. Our research indicates that restricting external debt financing with important macroeconomic drivers worsens the financial restrictions that businesses confront and has a negative impact on corporate investments. Our analysis emphasizes how crucial it is for investors, business managers, and politicians to consider how policy uncertainty may impact businesses’ financial constraints and investment activity. Firms may be able to negotiate unclear economic policies and make prudent investment decisions by applying real option theory.

6. Limitations of this Study

This study sheds light on economic policy uncertainty and investment decisions, although it has limits. This study examines Pakistan’s energy and petroleum industries between 2015 and 2020. Other industries, locales, and historical periods may not apply. Replication studies in different contexts are needed to assess generalizability. Data limitations: it is about 6-year data; it can be expanded; further similar industries can be added into this study.
Regression analysis examines variable relationships in this study. Variables and model definitions can affect results. Alternative models or variable combinations may yield different results. Limited factors: this study covers Tobin’s Q, MPPS, INTA, IFA, FL, WC, EPU, age, size, and CFO, but additional significant variables may have been left out. Omitted variables may distort results and impede interpretation. Economic policy uncertainty is indexed; it can be calculated in different ways, measured, and interpreted. Researchers and analysts may define economic policy uncertainty differently, affecting results and comparability.
Timeframe limitations: economic policy uncertainty may affect investment decisions differently over time. This study does not examine variable changes or long-term impacts. Addressing these constraints and performing future research with larger and more diversified samples, robust data, and refined techniques might improve understanding and dependability of how economic policy uncertainty affects investment decisions.

7. Further Recommendations

This study’s conclusions indicate the following research and decision-making: More research is required to understand how economic policy uncertainty influences firms’ investment and decision-making, particularly in emerging countries such as Pakistan. Future studies may explore how government interventions might reduce monetary policy uncertainty and its negative consequences for investments and company value. Policymakers should adopt measures that reduce uncertainty, stabilize the economy, and encourage enterprises to invest in physical and intangible assets. In a future study, corporate governance may protect firms’ investments and value against uncertain economic policies.
EPU’s influence on different industries and SMEs may be studied. Pakistan’s EPU influence on company value may be compared with India, Bangladesh, and Sri Lanka. More data may be collected over time to increase the sample size and reliability. These suggestions will assist policymakers and researchers in understanding how economic policy uncertainty impacts firm investments and value and provide realistic mitigation solutions for its negative effects.

Author Contributions

Conceptualization, S.H.; Methodology, S.H. and R.A.; Software, P.M., M.F. and A.M.; Formal analysis, A.M.; Investigation, S.H., W.E. and P.M.; Writing—review & editing, Y.T. All authors have read and agreed to the published version of the manuscript.

Funding

The study was funded by Researchers Supporting Project number (RSP2023R488), King Saud University, Riyadh, Saudi Arabia.

Institutional Review Board Statement

Not applicable.

Informed Consent Statement

Not applicable.

Data Availability Statement

On reasonable request, the corresponding author will provide data supporting the study’s results. The raw data, cannot be made public for reasons of confidentiality and privacy. However, researchers who satisfy the requirements for access to confidential data can be given access to aggregated and anonymized data as well as the statistical analysis codes. To request access to the data, interested researchers can get in touch with the corresponding author at WhatsApp +923216905677 or [email protected].

Acknowledgments

We all authors Sarfraz Hussain, Rosalan Ali, Walid Emam, Yusra Tashkandy, Pradeep Mishra, Mochammad Fahlevi, and Adelajda Matuka acknowledge the study was funded by Researchers Supporting Project number (RSP2023R488), King Saud University, Riyadh, Saudi Arabia. We thankful to the King Saud University, Saudi Arabia for this kindness.

Conflicts of Interest

The authors have no conflict of interest.

References

  1. Arve, M.; Zwart, G. Optimal procurement and investment in new technologies under uncertainty. J. Econ. Dyn. Control 2023, 147, 104605. [Google Scholar] [CrossRef]
  2. Ngene, G.M.; Tah, K.A. How are policy uncertainty, real economy, and financial sector connected? Econ. Model. 2023, 123, 106291. [Google Scholar] [CrossRef]
  3. Akron, S.; Demir, E.; Díez-Esteban, J.M.; García-Gómez, C.D. Economic policy uncertainty and corporate investment: Evidence from the U.S. hospitality industry. Tour. Manag. 2019, 77, 104019. [Google Scholar] [CrossRef]
  4. Alfaro, I.; Bloom, N.; Lin, X. The Finance Uncertainty Multiplier (No. w24571); National Bureau of Economic Research: Cambridge, MA, USA, 2018. [Google Scholar] [CrossRef]
  5. Amore, M.D.; Corina, M. Political elections and corporate investment: International evidence. J. Int. Bus. Stud. 2021, 52, 1775–1796. [Google Scholar] [CrossRef]
  6. Apergis, N.; Poufinas, T.; Antonopoulos, A. ESG scores and cost of debt. Energy Econ. 2022, 112, 106186. [Google Scholar] [CrossRef]
  7. Arellano, M.; Bover, O. Another look at the instrumental variable estimation of error-components models. J. Econ. 1995, 68, 29–51. [Google Scholar] [CrossRef] [Green Version]
  8. Audi, M.; Sulehri, F.A.; Ali, A.; Al-Masri, R. An Event Based Analysis of Stock Return and Political Uncertainty in Pakistan: Revisited. Int. J. Econ. Financ. Issues 2022, 12, 39–56. [Google Scholar] [CrossRef]
  9. Baker, S.R.; Bloom, N.; Davis, S.J. Measuring Economic Policy Uncertainty. Q. J. Econ. 2016, 131, 1593–1636. [Google Scholar] [CrossRef]
  10. Balcilar, M.; Usman, O.; Gungor, H.; Roubaud, D.; Wohar, M.E. Role of global, regional, and advanced market economic policy uncertainty on bond spreads in emerging markets. Econ. Model. 2021, 102, 105576. [Google Scholar] [CrossRef]
  11. Batabyal, S.; Killins, R. Economic policy uncertainty and stock market returns: Evidence from Canada. J. Econ. Asymmetries 2021, 24, e00215. [Google Scholar] [CrossRef]
  12. Bloom, N.; Bond, S.; Van Reenen, J. Uncertainty and Investment Dynamics. Rev. Econ. Stud. 2007, 74, 391–415. [Google Scholar] [CrossRef] [Green Version]
  13. Blundell, R.; Bond, S. Initial conditions and moment restrictions in dynamic panel data models. J. Econ. 1998, 87, 115–143. [Google Scholar] [CrossRef] [Green Version]
  14. Boyer, M.M.; Filion, D. Common and fundamental factors in stock returns of Canadian oil and gas companies. Energy Econ. 2007, 29, 428–453. [Google Scholar] [CrossRef] [Green Version]
  15. Caixe, D.F. Corporate governance and investment sensitivity to policy uncertainty in Brazil. Emerg. Mark. Rev. 2021, 51, 100883. [Google Scholar] [CrossRef]
  16. Chen, L.; Yuan, Y.; Zhao, N. The Effect of Oil Price Uncertainty on Corporate Investment in the Presence of Growth Options: Evidence from Listed Companies in China (1998–2019). N. Am. J. Econ. Financ. 2022, 62, 101779. [Google Scholar] [CrossRef]
  17. Cheng, X. The Impact of Economic Policy Uncertainty on the Efficiency of Corporate Working Capital Management—The Evidence from China. Mod. Econ. 2019, 10, 811–827. [Google Scholar] [CrossRef] [Green Version]
  18. Cui, X.; Wang, C.; Liao, J.; Fang, Z.; Cheng, F. Economic policy uncertainty exposure and corporate innovation investment: Evidence from China. Pac.-Basin Financ. J. 2021, 67, 101533. [Google Scholar] [CrossRef]
  19. Custódio, C.; Ferreira, M.A.; Laureano, L. Why are US firms using more short-term debt? J. Financ. Econ. 2013, 108, 182–212. [Google Scholar] [CrossRef]
  20. de Fontenay, E. The Use of Debt in Corporate Finance. In Encyclopedia of Law and Economics; Edward Elgar: Cheltenham, UK, 2022. [Google Scholar] [CrossRef]
  21. Faff, R.W.; Brailsford, T.J. Oil price risk and the Australian stock market. J. Energy Financ. Dev. 1999, 4, 69–87. [Google Scholar] [CrossRef]
  22. Fernandes, B.; Cunha, J.; Ferreira, P. The use of real options approach in energy sector investments. Renew. Sustain. Energy Rev. 2011, 15, 4491–4497. [Google Scholar] [CrossRef] [Green Version]
  23. Hartman, R. The effects of price and cost uncertainty on investment. J. Econ. Theory 1972, 5, 258–266. [Google Scholar] [CrossRef]
  24. Huang, H.H.; Kerstein, J.; Wang, C.; Wu, F. Firm climate risk, risk management, and bank loan financing. Strat. Manag. J. 2022, 43, 2849–2880. [Google Scholar] [CrossRef]
  25. Ilyas, M.; Khan, A.; Nadeem, M.; Suleman, M.T. Economic policy uncertainty, oil price shocks and corporate investment: Evidence from the oil industry. Energy Econ. 2021, 97, 105193. [Google Scholar] [CrossRef]
  26. Iqbal, N.; Naeem, M.A.; Suleman, M.T. Quantifying the asymmetric spillovers in sustainable investments. J. Int. Financ. Mark. Inst. Money 2021, 77, 101480. [Google Scholar] [CrossRef]
  27. Irwin, K.; Gilstrap, C.; McDowell, W.; Drnevich, P.; Gorbett, A. How knowledge and uncertainty affect strategic international business investment decisions: Implications for cross-border mergers and acquisitions. J. Bus. Res. 2021, 139, 831–842. [Google Scholar] [CrossRef]
  28. Jacob, M.; Wentland, K.; Wentland, S.A. Real Effects of Tax Uncertainty: Evidence from Firm Capital Investments. Manag. Sci. 2022, 68, 4065–4089. [Google Scholar] [CrossRef]
  29. Jory, S.R.; Khieu, H.D.; Ngo, T.N.; Phan, H.V. The influence of economic policy uncertainty on corporate trade credit and firm value. J. Corp. Financ. 2020, 64, 101671. [Google Scholar] [CrossRef]
  30. Jumah, Z.; Younas, Z.I.; Al-Faryan, M.A.S. Economic policy uncertainty, corporate diversification, and corporate investment. Appl. Econ. Lett. 2022, 1–11. [Google Scholar] [CrossRef]
  31. Knight Frank, H. Risk, Uncertainty, and Profit; Houghton Mifflin: Boston, MA, USA, 2019; Volume 31. [Google Scholar] [CrossRef]
  32. Kundu, S. The Anatomy of Corporate Securitizations and Contract Design. J. Corp. Financ. 2022. [Google Scholar] [CrossRef]
  33. Le, A.-T.; Tran, T.P. Does geopolitical risk matter for corporate investment? Evidence from emerging countries in Asia. J. Multinatl. Financ. Manag. 2021, 62, 100703. [Google Scholar] [CrossRef]
  34. Li, D.; Tong, T.W.; Xiao, Y.; Zhang, F. Terrorism-induced uncertainty and firm R&D investment: A real options view. J. Int. Bus. Stud. 2021, 53, 255–267. [Google Scholar] [CrossRef]
  35. Loughran, T.; Mcdonald, B. Textual Analysis in Accounting and Finance: A Survey. J. Account. Res. 2016, 54, 1187–1230. [Google Scholar] [CrossRef]
  36. Muriithi, S.G.; Walters, B.A.; McCumber, W.R.; Robles, L.R. Managerial entrenchment and corporate social responsibility engagement: The role of economic policy uncertainty. J. Manag. Gov. 2021, 26, 621–640. [Google Scholar] [CrossRef]
  37. Nguyen, N.H.; Phan, H.V. Policy Uncertainty and Mergers and Acquisitions. J. Financ. Quant. Anal. 2017, 52, 613–644. [Google Scholar] [CrossRef] [Green Version]
  38. Kwabi, F.O.; Owusu-Manu, S.; Boateng, A.; Ezeani, E.-B.; Du, M. Economic policy uncertainty and cost of capital: The mediating effects of foreign equity portfolio flow. Rev. Quant. Financ. Account. 2022, 59, 457–481. [Google Scholar] [CrossRef]
  39. Phan, H.V.; Nguyen, N.H.; Nguyen, H.T.; Hegde, S. Policy uncertainty and firm cash holdings. J. Bus. Res. 2018, 95, 71–82. [Google Scholar] [CrossRef]
  40. Li, S.; Wang, H. Robust irreversible investment strategy with ambiguity to jump and diffusion risk. Int. Rev. Financ. 2023. [Google Scholar] [CrossRef]
  41. Qi, X.-Z.; Ning, Z.; Qin, M. Economic policy uncertainty, investor sentiment and financial stability—An empirical study based on the time varying parameter-vector autoregression model. J. Econ. Interact. Co-Ord. 2021, 17, 779–799. [Google Scholar] [CrossRef]
  42. Fang, L.; Yu, H.; Li, L. The effect of economic policy uncertainty on the long-term correlation between US stock and bond markets. Econ. Model. 2017, 66, 139–145. [Google Scholar] [CrossRef]
  43. Rashid, A.; Nasimi, A.N.; Nasimi, R.N. The uncertainty–investment relationship: Scrutinizing the role of firm size. Int. J. Emerg. Mark. 2021, 17, 2605–2635. [Google Scholar] [CrossRef]
  44. Roodman, D. How to do Xtabond2: An Introduction to Difference and System GMM in Stata. Stata J. Promot. Commun. Stat. Stata 2009, 9, 86–136. [Google Scholar] [CrossRef] [Green Version]
  45. Sen, P. Capital Accumulation and Convergence in a Small Open Economy. Rev. Int. Econ. 2013, 21, 690–704. [Google Scholar] [CrossRef] [Green Version]
  46. Athari, S.A.; Bahreini, M. Does economic policy uncertainty impact firms’ capital structure policy? Evidence from Western European economies. Environ. Sci. Pollut. Res. 2023, 30, 37157–37173. [Google Scholar] [CrossRef] [PubMed]
  47. Thiem, C. Cross-category, trans-Pacific spillovers of policy uncertainty and financial market volatility. Open Econ. Rev. 2020, 31, 317–342. [Google Scholar] [CrossRef] [Green Version]
  48. Tran, D.T.T.; Phan, H.V. Government economic policy uncertainty and corporate debt contracting. Int. Rev. Financ. 2021, 22, 169–199. [Google Scholar] [CrossRef]
  49. Wang, D.; Liu, T.; Li, X.; Huang, Y.; Zhou, Y. Identifying the Dynamic Influence of Economic Policy Uncertainty on Enterprise Investment Using Functional Data Analysis. Math. Probl. Eng. 2022, 2022, 7822710. [Google Scholar] [CrossRef]
  50. Wen, H.; Lee, C.-C.; Zhou, F. How does fiscal policy uncertainty affect corporate innovation investment? Evidence from China’s new energy industry. Energy Econ. 2021, 105, 105767. [Google Scholar] [CrossRef]
  51. Zakari, A.; Adedoyin, F.F.; Bekun, F.V. The effect of energy consumption on the environment in the OECD countries: Economic policy uncertainty perspectives. Environ. Sci. Pollut. Res. 2021, 28, 52295–52305. [Google Scholar] [CrossRef]
  52. Zeitun, R.; Goaied, M. The nexus between debt structure, firm performance, and the financial crisis: Non-linear panel data evidence from Japan. Appl. Econ. 2022, 54, 4681–4699. [Google Scholar] [CrossRef]
  53. Su, X.; Zhou, S.; Xue, R.; Tian, J. Does economic policy uncertainty raise corporate precautionary cash holdings? Evidence from China. Account. Financ. 2020, 60, 4567–4592. [Google Scholar] [CrossRef]
  54. Khan, I.; Khan, I.; Khan, I.U.; Suleman, S.; Ali, S. Board diversity on firm performance from resource-based view perspective: New evidence from Pakistan. Int. J. Prod. Perform. Manag. 2023; ahead-of-publish. [Google Scholar] [CrossRef]
Figure 1. Global economic policy uncertainty (GEPU).
Sustainability 15 09656 g001
Figure 2. Pakistan’s EPU index-2 and EPU index-4 chart.
Sustainability 15 09656 g002
Figure 3. Conceptual Model of the Research: Source Author.
Sustainability 15 09656 g003
Table 1. Literature Matrices.
Authors Findings Difference Points Citations
(Arve and Zwart, 2023)It focused on a buyer’s ideal investment plan for cutting-edge technology, where costs fluctuate randomly and are kept secret from suppliers. We demonstrate how the timing of investments and technology selection are optimally distorted in a real option setting by the asymmetric knowledge of the stochastic variables. Compared with the first-best real option benchmark, we discover that asymmetric information may cause various technologies to postpone or hasten investment. We also recommend a payment system that implements a Vickrey-style auction to reflect the buyer’s ideal timing for making investments.Firm-level investigation on investment choices. Even so, it does not disclose short-term or long-term investments. [1]
(Ngene and Tah, 2023)Frequent changes in economic policy heighten economic policy uncertainty. It focused on actual investment, which is negatively impacted by policy uncertainty. We analyze the inter- and intra-variable shock transmissions to perform a disaggregated tripartite investigation of the relationship between policy uncertainty, the actual economy, and the financial sector. We find that 48% of all shock spillovers occur due to cross-variable shock transmissions using monthly US data from January 1985 to June 2022. The impulse response analysis demonstrates that policy uncertainty shocks have different contractionary impacts on real sector variables while momentarily amplifying financial sector variables. According to the network study, credit is the main financial channel for transferring policy uncertainty shocks to the actual economy. Policy uncertainty and financial sector variables, notably credit and leverage, have time-varying destabilizing impacts on the real sector due to their net shock transmission functions. It focused on the financial sector but did not use the present study variables. It focused on the US, which is a developed economy, instead of a developing economy, where uncertainty is different. [2]
(Akron, Demir, Díez-Esteban, and García-Gómez, 2020)In this study, the author focused on how uncertainty impacts the choices made by hospitality firms that have gained popularity. We investigate the impact of economic policy uncertainty (EPU) on 305 U.S. hospitality companies’ investment strategies from 2001 to 2018. Using the generalized methods of moments (GMM) methodology, we discover that EPU has a detrimental impact on investment policies in hotel companies.Its hospitality firms have different organizational structures and are again based on a developed economy, i.e., the US. However, the present study is based on selected firms from energy and petroleum companies in an emerging economy instead of a developed economy. [3]
(Alfaro, Bloom, and Lin, 2018)To estimate the impact of uncertainty, this study first addresses endogeneity by utilizing firm differential exposure to the exchange rate, policy, and energy price volatility in a panel of US enterprises. Following an uncertainty shock, it is demonstrated that ex-ante financially limited firms reduce their investment significantly more than firms that are not. Then, we construct a general equilibrium model of heterogeneous firms with real and financial frictions and discover that financial frictions: (i) double the impact of uncertainty shocks on output; (ii) lengthen the duration of the drop by 50%; and (iii) propagate uncertainty shocks by spreading their impact onto financial variables. These findings demonstrate why uncertainty can be especially harmful during times of increased financial friction.First, this study uses different macroeconomic sentiments instead of moderating the impact of the EPU. In the present study, we use the moderating impact of EPU, but we also measure the direct impact on firms’ outputs. [4]
(Amore and Corina, 2021)According to recent literature, the increase in uncertainty that occurs around political elections hurts enterprises’ investment. We contend that the electoral system of the nation affects how political elections affect corporations’ investment activities by fusing concepts from political science and international business. We specifically anticipate that businesses operating under plurality systems will experience less negative impact from elections on corporate investment. We test our theory using a panel dataset of publicly traded companies from around the world and a panel of US multinationals. The findings demonstrate that businesses in nations with a plurality system decrease investment less than in other nations during an election period. Furthermore, it demonstrates that elections overseas impact multinationals’ international investment. Their investment in a host country drops during an election in that country, though to a lesser extent if the election is held under a plurality system. When taken as a whole, our findings offer new information about how political institutions influence business investment decisions.This study focused on political elections, while the present study focused on the EPU index, where political instability is a part of the EPU index calculations. They focused on the cross-border effect on multinational firms. In the present study, we only checked the macroeconomic impact on the firm’s performance and stock value. [5]
Table 2. Calculations of the variables.
Abbreviation UseFormulas
1.IFAInvestment in Fixed Assets = Capital Expenditures − Disposals + Change in Fixed Asset Inventory
2.INTANon-physical assets, known as intangible assets, are valuable and support a company’s position in the market, ability to compete effectively, and potential for future revenue production.
3.WCCurrent Liabilities/Current Assets
4.FLTotal Equity/Total Debt
5.EPUUsed the EPU Index
6.Firm AgeAge of the Company
7.Firm Size Log of Total Assets
8.CFONet Income + Non-cash Expenses − Changes in Working Capital
9.Tobin’s Q Market Value of the Firm/Replacement Cost of Assets
10.Market Price Per Share(Net profit before taxes − Tax provision)/Number of ordinary shares
Investment in fixed assets (IFA), investment in intangible assets (INTA), financial leverage (FL), working capital ratio (WC), economic policy uncertainty (EPU), firm age (AGE), firm size (log of total assets), cashflow from operations (CFO), Tobin’s Q Ratio (TobinQ), market price per share (MPPS).
Table 3. Descriptive Statistics.
MeanMaximumMinimumStd. Dev.SkewnessKurtosisObservations
INTA6.63218.3716.6325.760−0.0031.5785129
IFA15.76319.4688.9282.507−0.8523.2835129
FL6.766195.5111.02220.5087.11862.2275129
WC11.816113.54311.81634.7653.06314.0845129
EPU95.326139.82058.72028.7390.1491.7245129
AGE30.60068.0007.00017.4190.7752.3365129
SIZE15.78320.47715.7834.125−2.1968.2705129
CFO0.2266.7620.2260.7507.53960.9945129
TOBINQ1.4119.9551.4111.6602.74712.0095129
MPPS93.5131575.64093.513253.2114.62424.0825129
Investment in fixed assets (IFA), investment in intangible assets (INTA), financial leverage (FL), working capital ratio (WC), economic policy uncertainty (EPU), firm age (AGE), firm size (log of total assets), cashflow from operations (CFO), Tobin’s Q Ratio (TobinQ), market price per share (MPPS).
Table 4. Correlation matrix.
CorrelationINTAIFAFLWCEPUAGESIZECFOTOBINQMPPS
INTA 1.000
IFA 0.5261.000
0.000
FL 0.1850.2761.000
0.0440.002
WC 0.2550.0150.0291.000
0.0050.0050.006
EPU −0.066−0.0130.073−0.1691.000
0.0740.0880.0290.006
AGE 0.3250.3770.3840.1440.0971.000
0.0000.0000.0000.1170.091
SIZE 0.5170.8660.2240.1150.0230.3051.000
0.0000.0000.0140.0110.0010.001
CFO −0.149−0.267−0.059−0.1130.035−0.078−0.2541.000
0.1050.0030.0190.0200.0020.0960.005
TOBINQ 0.4330.4100.3560.254−0.2650.2810.408−0.1191.000
0.0000.0000.0000.0050.0030.0020.0000.195
MPPS0.0650.158−0.0300.0250.0100.0720.207−0.0360.4261.000
0.0820.0040.0490.0870.0140.0380.0230.0990.000
Investment in fixed assets (IFA), investment in intangible assets (INTA), financial leverage (FL), working capital ratio (WC), economic policy uncertainty (EPU), firm age (AGE), firm size (log of total assets), cashflow from operations (CFO), Tobin’s Q Ratio (TobinQ), market price per share (MPPS).
Table 5. Linear regression when the dependent variable is Tobin’s Q.
VariablesOLSREFEGMM
Tobin’s Q = L, 0.494 ***
(0.0123)
IntA0.0493 *0.0493 *0.00584 **0.0252 ***
(0.0284)(0.0284)(0.0392)(0.0193)
IFA0.0931 ***0.0931 ***−0.508 ***−1.146 ***
(0.120)(0.120)(0.427)(0.209)
FL0.00940 ***0.009400.00474 ***−0.0502 ***
(0.00652)(0.00652)(0.00697)(0.000675)
WC0.007050.007050.00502 ***−0.00189 ***
(0.00704)(0.00704)(0.00753)(0.00130)
EPU−0.0151 ***−0.0151 ***−0.0168 ***0.00911 ***
(0.00378)(0.00378)(0.0242)(0.00282)
Age0.0107 ***0.0107 ***0.0234 ***−0.329 ***
(0.0136)(0.0136)(0.403)(0.0536)
Size0.0382 ***0.0382 ***−0.0230 ***−0.148 ***
(0.0587)(0.0587)(0.0704)(0.0467)
CFO0.0189 ***0.0189 ***−0.0136 ***−0.0722 ***
(0.147)(0.147)(0.148)(0.0178)
Constant−0.0305 ***−0.0305 ***10.55 ***
(1.485)(1.485)(11.97)
Diagnostic Tests
B&P LM test 20.19 ***
Hausman test 9.86 ***
Heteroscedasticity 76,570.34 ***
Autocorrelation46.056 ***
VIF2.78
Sargan Test p Value 4.56 (0.601)
Hansen test (p Value) 7.51 (0.353)
AR1 −0.67 (0.504)
AR2 −0.37 (0.715)
Standard errors in parentheses: *** p < 0.01, ** p < 0.05, * p < 0.1, IFA: This variable measures the amount of investment a firm makes in intangible assets such as patents, trademarks, and copyrights. INTA: This variable represents a firm’s investment in fixed assets such as land, buildings, and equipment. FL: Financial leverage indicates the degree to which a company uses debt to finance its operations. A higher value of FL suggests that the firm has taken on more debt than equity. WC: Working capital ratio measures a firm’s short-term liquidity. It is calculated as current assets minus current liabilities divided by current assets. EPU: Economic policy uncertainty measures the level of uncertainty firms face due to economic policies and regulations. Higher values of EPU indicate more significant uncertainty. AGE: This variable represents the firm’s age, calculated as the number of years since its inception. SIZE: Firm size is measured as the logarithm of total assets. CFO: Cash flow from operations indicates the amount of cash the firm generates. It is calculated by subtracting operating expenses from operating revenues. Tobin’s Q: This variable measures the market value of a company’s assets relative to their replacement cost. MPPS: Market price per share is the price at which a firm’s shares are trading.
Table 6. The nonlinear regression dependent variable is Tobin’s Q.
Models 1234
VariablesOLSREFEGMM
Tobin’s Q = L, 0.248 ***
(0.140)
IntA0.0915 ***0.0915 ***0.0388 ***0.0866 ***
(0.0855)(0.0855)(0.0911)(0.155)
IFA0.117 ***0.117 ***0.459 ***1.818 ***
(0.242)(0.242)(0.626)(0.603)
FL0.145 ***0.145 ***0.110 ***0.192 ***
(0.0358)(0.0358)(0.0403)(0.0551)
WC0.0183 ***0.0183 ***0.0247 ***0.0329 ***
(0.0234)(0.0234)(0.0242)(0.0339)
EPU−0.00184 ***−0.00184 ***0.0270 ***0.0762 ***
(0.0280)(0.0280)(0.0389)(0.0493)
Age0.00287 ***0.00287 ***−0.122 ***−0.0303 ***
(0.0107)(0.0107)(0.393)(0.0401)
Size0.0306 ***0.0306 ***0.00923 ***0.00827 ***
(0.0582)(0.0582)(0.0693)(0.105)
CFO0.0156 ***0.0156 ***0.0274 ***0.115 ***
(0.144)(0.144)(0.145)(0.178)
EPU × IFA−0.000161 ***−0.000161 ***−0.00174 ***−0.00470 ***
(0.00193)(0.00193)(0.00210)(0.00344)
EPU × INTA−0.000444 ***−0.000444 ***0.0000581 ***0.000724 ***
(0.000878)(0.000878)(0.000915)(0.00155)
EPU × FL−0.00112 ***−0.00112 ***−0.000884 ***−0.00176 ***
(0.000301)(0.000301)(0.000333)(0.000449)
EPU × WC−8.84 × 10⁻⁵ ***−8.84 × 10⁻⁵ ***−0.000182 ***−0.000227 ***
(0.000260)(0.000260)(0.000266)(0.000351)
Constant−1.262 ***−1.262 ***−2.729 ***
(3.203)(3.203)(13.60)
Diagnostic Tests
B&P LM test 12.15 ***
Hausman test 11.20 ***
Heteroscedasticity 0.00001310 ***
Autocorrelation30.148 ***
Sargan Test (p-value) 0.03 (0.983)
Hansen test (p-value) 0.79 (0.672)
AR1 −0.37 (0.714)
AR2 1.01 (0.314)
Standard errors in parentheses: *** p < 0.01, ** p < 0.05, * p < 0.1. Investment in fixed assets (IFA); investment in intangible assets (INTA); financial leverage (FL); working capital ratio (WC); economic policy uncertainty (EPU); firm age (AGE); firm size (log of total assets); cashflow from operations (CFO); Tobin’s Q Ratio (Tobin’s Q); market price per share (MPPS).
Table 7. The linear regression dependent variable is market price per share.
Model 1234
VariablesOLSREFEGMM
MPPS = L, 0.246 ***
(0.00145)
IntA−3.119 **−3.119 ***−1.579 ***3.843 ***
(2.822)(2.822)(3.362)(0.405)
IFA28.26 **28.26 **57.83 ***−2.876 ***
(20.19)(20.19)(36.58)(4.251)
FL−0.265 ***−0.265 ***−0.286 ***−0.00974 ***
(0.584)(0.584)(0.597)(0.0298)
WC−0.778 **−0.778 **−0.835 **−0.150 *
(0.632)(0.632)(0.646)(0.0905)
EPU0.0001300.000130 ***−0.497 ***2.368 ***
(0.386)(0.386)(2.072)(0.276)
Age−0.0517 **−0.0517 **9.087 **−47.48 ***
(3.640)(3.640)(34.57)(5.458)
Size3.368 ***3.368 ***5.242 **0.502 ***
(5.354)(5.354)(6.031)(0.581)
CFO0.0338 *0.0338 **1.440 **−2.914 **
(12.46)(12.46)(12.71)(1.316)
Constant−371.9 **−371.9 ***−1.109 ***
(319.7)(319.7)(1.026)
Diagnostic Tests
B&P LM test 210.05 ***
Hausman test 1.51 ***
Heteroscedasticity 3.4 × 10⁶ ***
Autocorrelation10,147.20 ***
VIF2.08
Sargan Test (p-value) 0.96 (0.61)
Hansen test (p-value) 9.22 (0.161)
AR1 −0.14 (0.886)
AR2 −1.11 (0.0265)
Standard errors in parentheses: *** p < 0.01, ** p < 0.05, * p < 0.1. Investment in fixed assets (IFA); investment in intangible assets (INTA); financial leverage (FL); working capital ratio (WC); economic policy uncertainty (EPU); firm age (AGE); firm size (log of total assets); cashflow from operations (CFO); Tobin’s Q Ratio (Tobin’s Q); market price per share (MPPS).
Table 8. The nonlinear regression dependent variable is market price per share.
VariablesOLSREDEGMM
MPPS = L, 0.998 ***
(0.0896)
IntA−1.840 ***−1.840 ***−6.158 ***29.23 **
(9.233)(9.233)(8.147)(12.02)
IFA20.81 ***20.81 ***88.11 ***−54.52 *
(29.24)(29.24)(56.05)(67.31)
FL−1.837 ***−1.837 ***−1.080 ***−1.348 ***
(4.031)(4.031)(3.603)(4.959)
WC−2.609 ***−2.609 ***−2.127 ***0.731 **
(2.461)(2.461)(2.163)(2.924)
EPU0.143 ***0.143 ***2.132 ***−4.745 *
(2.964)(2.964)(3.479)(4.261)
Age0.387 ***0.387 ***11.59 ***15.58 ***
(2.298)(2.298)(35.15)(11.91)
Size3.774 ***3.774 ***3.978 ***4.975 **
(6.428)(6.428)(6.197)(8.840)
CFO0.0278 ***0.0278 ***3.049 ***−7.098 **
(15.00)(15.00)(12.94)(14.95)
EPU × IFA−0.0205 ***−0.0205 ***−0.206 ***0.275 **
(0.205)(0.205)(0.188)(0.286)
EPU × INTA−0.0190 ***−0.0190 ***0.0474 ***−0.0572 **
(0.0948)(0.0948)(0.0819)(0.122)
EPU × FL0.0131 ***0.0131 ***0.00733 ***0.00907 **
(0.0334)(0.0334)(0.0298)(0.0422)
EPU × WC0.0219 ***0.0219 ***0.0158 ***−0.0111 ***
(0.0272)(0.0272)(0.0238)(0.0306)
Constant−253.3 ***−253.3 ***−1.585 ***
(403.8)(403.8)(1.217)
Diagnostic Tests
B&P LM test 157.61 ***
Hausman test −1.37 ***
Heteroscedasticity 1.6 × 10⁶ ***
Autocorrelation962.44 ***
Sargan Test (p-value) 0.10 (0.952)
Hansen test (p-value) 1.07 (0.585)
AR1 −0.35 (0.723)
AR2 −0.05 (0.959)
Standard errors in parentheses: *** p < 0.01, ** p < 0.05, * p < 0.1. Investment in fixed assets (IFA); investment in intangible assets (INTA); financial leverage (FL); working capital ratio (WC); economic policy uncertainty (EPU); firm age (AGE); firm size (log of total assets); cashflow from operations (CFO); Tobin’s Q Ratio (Tobin’s Q); market price per share (MPPS).
Disclaimer/Publisher’s Note: The statements, opinions and data contained in all publications are solely those of the individual author(s) and contributor(s) and not of MDPI and/or the editor(s). MDPI and/or the editor(s) disclaim responsibility for any injury to people or property resulting from any ideas, methods, instructions or products referred to in the content.

