
Technical and Economic Assessment of Energy Efficiency of Electrification of Hydrocarbon Production Facilities in Underdeveloped Areas

 ,
, 
 ,
, 
Abstract
1. Introduction
- A review of global experience in the application of modern technological directions of electrification of hydrocarbon production facilities, including the use of renewable energy sources, was carried out;
- We developed and justified the option of alternative technological solutions for the electrification of remote hydrocarbon production facilities on the basis of a hybrid automated system of renewable energy sources;
- The economic substantiation of alternative options for electrification projects, based on the assessment of the specific total capital and operating costs, was carried out.
2. Literature Review
2.1. An Overview of the Characteristics of Underdeveloped Areas in Russia
2.2. Main Problems of Electrification of Hydrocarbon Production Facilities in Underdeveloped Areas
- Principle I—permafrost soils are used in a frozen or freezing state, preserved during construction and throughout the operation of the structure;
- Principle II—permafrost soils are used in a thawed or thawing state (with preliminary thawing to the design depth prior to the construction of the structure or with the assumption of their thawing during the operation of the structure).
2.3. An Overview of Modern Technologies for the Electrification of Hydrocarbon Production Facilities in Poorly Developed or Hard-to-Reach Areas
3. Materials and Methods
- Assessment of the wind potential of the territory;
- Assessment of solar insolation level;
- Assessment of generation mix based on projected wind and solar power generation;
- Calculating the optimum storage capacity for balancing the output, increasing the generating capacity utilization factor, and eliminating power dips in the consumer’s supply;
- Minimizing the cost of the solution on the basis of specific total capital and operating costs.
4. Result
4.1. Natural Factors Assessment
4.2. Economic Justification of Alternative Electrification Projects
5. Discussion
- Safe transportation of liquid hydrocarbons through continuous monitoring of process parameters of the pipeline system and control of actuators on pipelines;
- Detection of possible leaks for the prompt shutdown of emergency sections;
- Control of scheduled technological operations for cleaning and diagnostics of pipelines;
- Control of the cathodic protection system;
- Power supply to controlled telemechanics points and connected equipment.
6. Conclusions
Author Contributions
Funding
Data Availability Statement
Conflicts of Interest
Appendix A


| Consumer | Components of Design Capacity | Annual Consumption Electricity, Thousand kWh | ||
|---|---|---|---|---|
| Pr, kW | Qr, kWAr | Sr, kWA | ||
| Well cluster No. 1. CTS 10/0.4 kW 2 × 100 kWA | ||||
| Radio communication | 10.53 | 3.718 | 11.18 | 18.98 |
| Incineration system for gas utilization | 24 | 2 | 24.5 | 160 |
| Flow line connectors | 2.4 | 0.7 | 2.5 | 9.6 |
| APCS equipment | 36.0 | 14.6 | 39.7 | 140.0 |
| Wellhead valve electric drive | 13.1 | 6.0 | 14.4 | 52.4 |
| Total for CTS without compensation, taking into account Kt = 0.8; Kr = 1; tgφ = 0.63: | 86.03 | 27.018 | 92.28 | 380.98 |
| Reactive power compensation at CTS: | −19 | |||
| Total for CTS with compensation, taking into account Kt = 0.8; Kr = 1; tgφ = 0.13: | 86.03 | 8.018 | 79.4 | 380.98 |
| Well cluster No. 2. CTS 10/0.4 kW 2 × 100 kWA | ||||
| Radio communication | 14.04 | 4.96 | 14.91 | 18.98 |
| Incineration system for gas utilization | 24.0 | 2.0 | 24.5 | 160.0 |
| Flow line connectors | 2.4 | 0.7 | 2.5 | 12.8 |
| APCS equipment | 40.0 | 15.0 | 42.7 | 146.0 |
| Wellhead valve electric drive | 13.1 | 6.0 | 14.4 | 69.87 |
| Total for CTS without compensation, taking into account Kt = 0.8; Kr = 1; tgφ = 0.63: | 93.54 | 28.66 | 99.01 | 407.65 |
| Reactive power compensation at CTS: | −23 | |||
| Total for CTS with compensation, taking into account Kt = 0.8; Kr = 1; tgφ = 0.13: | 93.54 | 5.66 | 84.17 | 407.65 |
| Total for the project, taking into account reactive power compensation: | 179.57 | 13.678 | 163.57 | 787.65 |
| Index | Formula | |
|---|---|---|
| Converting wind speed to tower height | (A1) | |
| —wind speed at tower height, m/c; Hm—height at which measurements were taken, m; —measured wind speed at altitude Hm, m/c; HT—tower height, m; —coefficient depending on the location of the object under study [73]. | ||
| Power of wind flow | (A2) | |
| —air density (standard value at a temperature of +15 °C and a pressure of 760 mm Hg), kg/m3; Sb—rotor swept area, m2. Taking into account that the rotor swept area is almost equal to the area of the circle, which is described by the edges of the wind turbine blades, which are the most distant from the axis of rotation when moving, we take: | ||
| (A3) | ||
| where d—wind wheel diameter, m. | ||
| Power generated by wind turbines | (A4) | |
| where NWF—power of wind flow, W; —wind energy utilization factor (depends on the characteristics of a particular wind generator), fractions of units. Taking into account Formulas (A2) and (A3), we have: | ||
| (A5) | ||
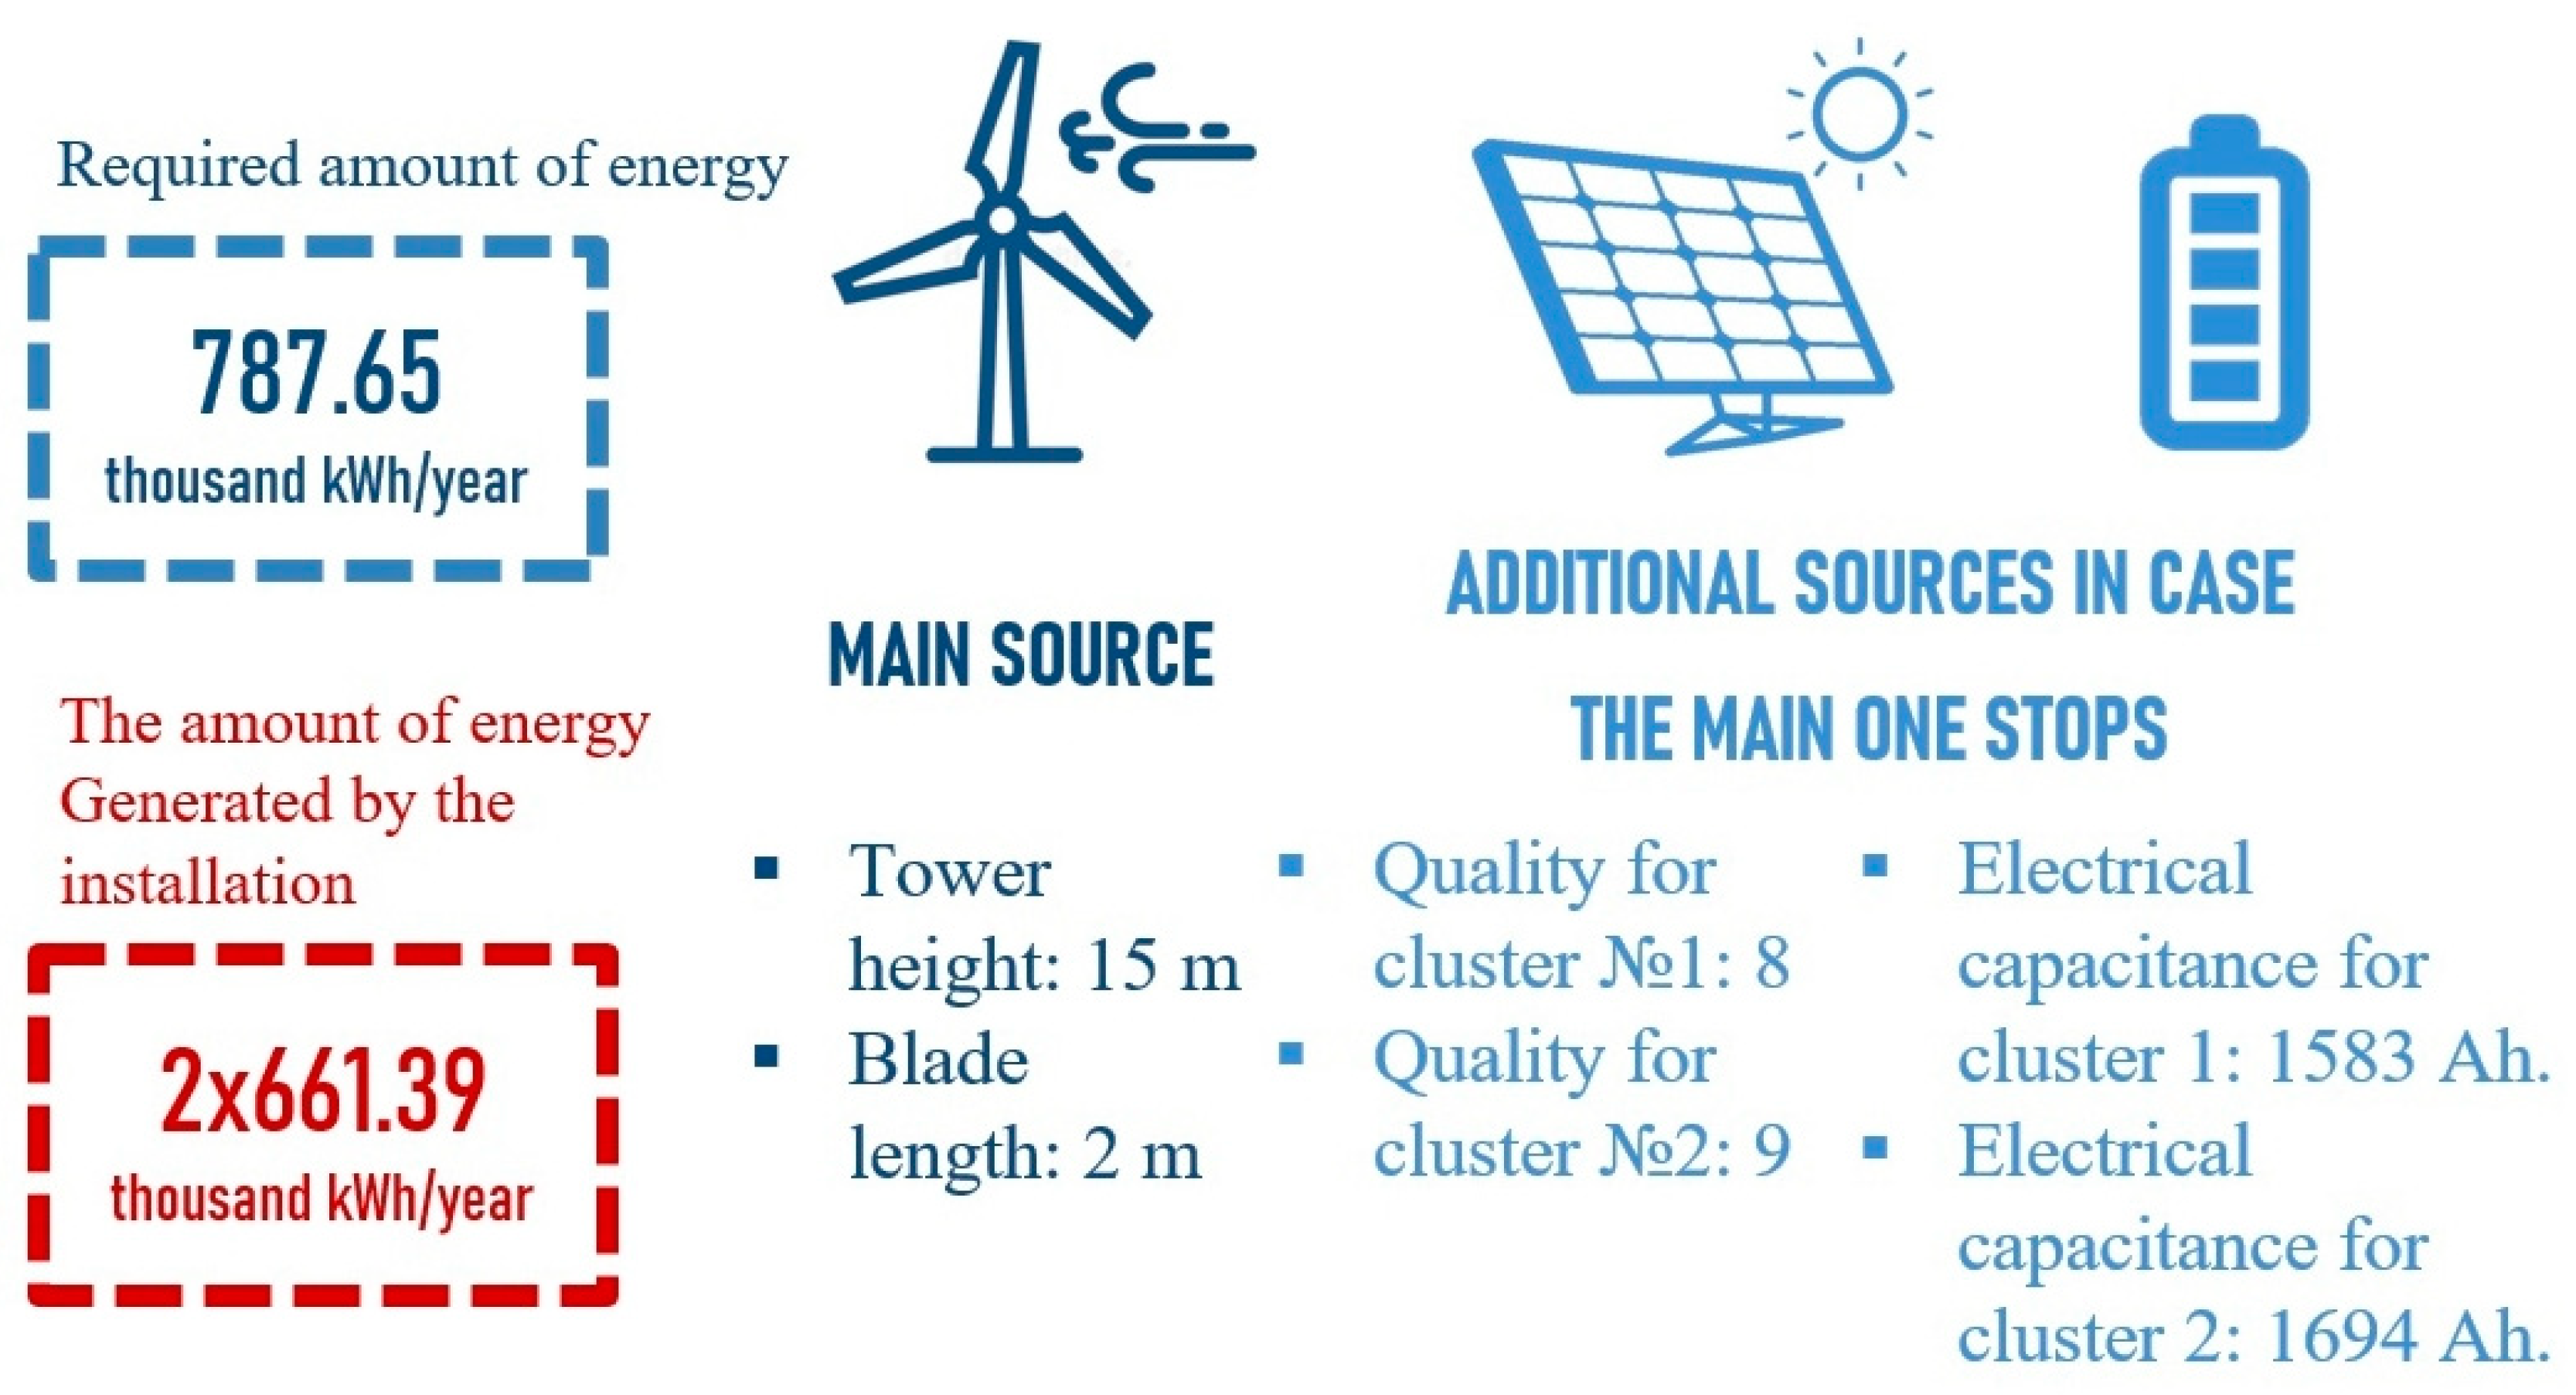
| Calculation of wind speed and wind flow power | Starting speed of the installation rotor—3.4 m/c [79]. According to climate data, in February, the wind speed can be below this mark. Therefore, the height of the wind turbine tower must be at least 15 m: | |
| (m/c). | (A6) | |
| Taking into account the given height of the tower, the most optimal diameter of the rotor blades d is 2 m. As an example of the calculation, we determine the power of the wind flow for February: | ||
| (A7) | ||
| Calculation of the required battery capacity | (A8) | |
| where P—available load, W; U—battery voltage, V; t—reservation time, h; k = 0.7—battery capacity utilization factor. Thus, the required battery capacity for two gas production facilities: | ||
| (A·h); | (A9) | |
| (A·h). | (A10) | |
| To increase the reliability of the system, we take batteries with an additional 20% capacity margin. A·h; A·h. | ||
| Energy of solar panels to install | (A11) | |
| where Eins—average monthly insolation level, kW·h/m2 per day; PSP—installed capacity of solar panels, W; Pins—insolation power on the earth’s surface per square meter (1000 W/m2); k = 1.2—loss factor per charge–discharge of batteries, conversion of direct voltage into alternating voltage. | ||
| Installed power for solar panels of this installation at a temperature of 25 °C | (A12) | |
| where n = 2…10—number of solar panels in the installation, pcs. | ||
| (A13) | ||
| where —energy generated by the battery, W·h. As a result, based on Formulas (A11)–(A13), we obtain: | ||
| (A14) | ||
| (pcs). | (A15) | |
| Change in the average annual power of the panels | , | (A16) |
| where PSC—solar cell power, W; P0 = 180—solar cell power at 25 °C, W; —thermal power factor, °C−1; —temperature change, °C. | ||
| (B) | (A17) | |
| Total number of solar panels for well clusters K-5 (gas) и K-4 (gas) | (pcs) | (A18) |
| (pcs) | (A19) | |
| Index | Cost |
|---|---|
| 1. Basic metal structures | 29,556.217 |
| 2. Equipment and materials for linear facilities | 3842.31 |
| 3. Logistics (services for the delivery of equipment and materials) | 3852 |
| 4. Preparation of the construction site | 1100.76 |
| 5. Construction work (costs of transport and units) | 2908.3 |
| Piling installation | 1608.98 |
| Installation of pile foundations | 1709 |
| Installation of power transmission towers | 5055 |
| 6. Construction, installation and commissioning | 4729.432 |
| 7. Environmental measures (including installation of bird protection devices) | 590.90 |
| 8. Other expenses | 1533.318 |
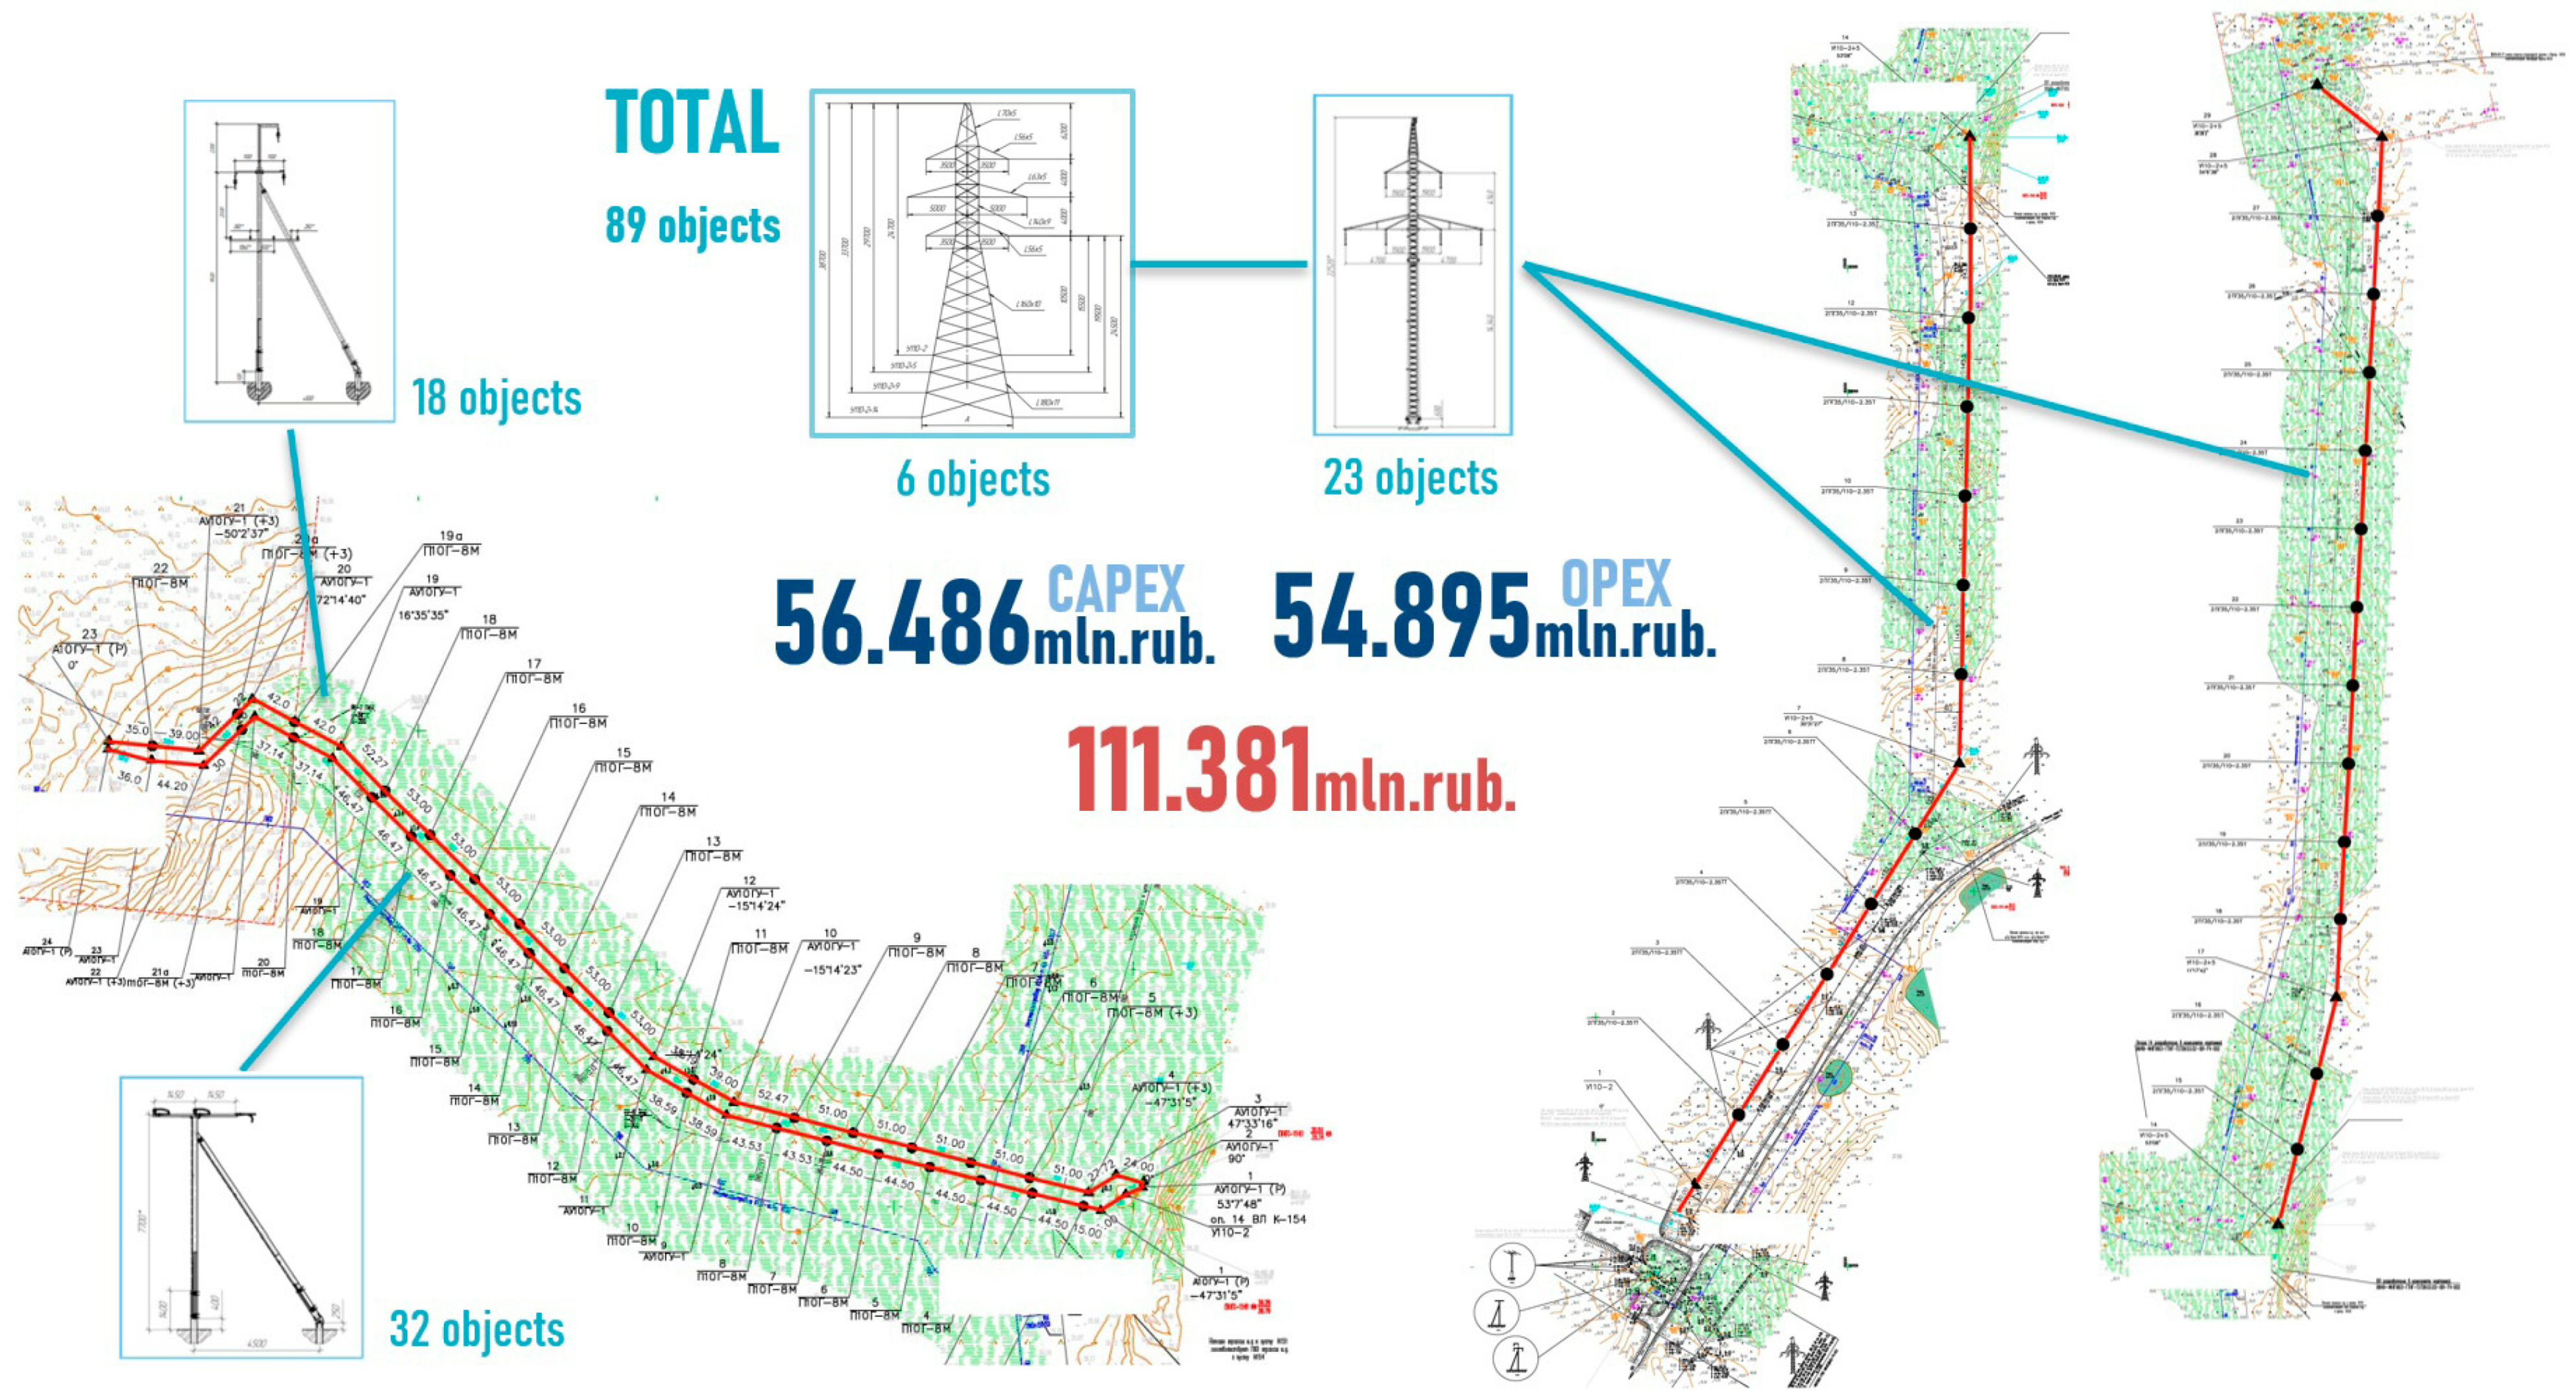
| TOTAL | 56,486.22 |
| Index | Quantity | Unit Price | Cost |
|---|---|---|---|
| 1. Equipment (selection services) | 964.6 | ||
| Wind monitor | 2 | 285.71 | 571.43 |
| Wind generator (rotor + blades) | 2 | 2512.63 | 5025.26 |
| Tower (15 m) | 2 | 300.72 | 601.44 |
| Energy module | 2 | 482.262 | 964.52 |
| Mounting module with battery pack | 2 | 664.26 | 1328.52 |
| Maintenance Trestle | 2 | 120.78 | 241.56 |
| Mounting module with electronics module | 2 | 613.59 | 1227.19 |
| Solar modules | 17 | 220.59 | 3750.13 |
| Mounting support for solar modules | 4 | 150.65 | 602.62 |
| Well piping technology module | 7 | 1018.58 | 7130.06 |
| 2. Transport and delivery services | 1389 | ||
| 3. Site preparation | 300 | ||
| Foundation for mounting modules | 2 | 97.38 | 194.76 |
| Pile foundation for a wind turbine tower | 8 | 28.4 | 227.2 |
| Piles under the wind turbine tower | 8 | 7.06 | 56.48 |
| 4. Construction and installation works | 2312.7 | ||
| 5. Commissioning works | 1484.53 | ||
| 6. Environmental measures | 153.07 | ||
| Bird scaring devices | 4 | 30 | 120 |
| 7. Other expenses | 1192.254 | ||
| TOTAL | 29,837.32 | ||
References
- Abraham-Dukuma, M. Sovereignty, trade, and legislation: The evolution of energy law in a changing climate. Energy Res. Soc. Sci. 2020, 59, 101305. [Google Scholar] [CrossRef]
- Zhang, L.; Ponomarenko, T. Directions for Sustainable Development of China’s Coal Industry in the Post-Epidemic Era. Sustainability 2023, 15, 6518. [Google Scholar] [CrossRef]
- Shestakova, I.G. The new role of the technological component in the social reality of the digital transition era. Vestn. St. Petersburg Univ. Philos. Confl. Stud. 2022, 38, 242–253. [Google Scholar] [CrossRef]
- Sullivan, R. Corporate Responses to Climate Change: Achieving Emissions Reductions through Regulation, Self-Regulation and Economic Incentives; Routledge: Oxford, UK, 2018. [Google Scholar] [CrossRef]
- Engen, O.A.; Simensen, E.O.; Thune, T. The evolving sectoral innovation system for upstream oil and gas in Norway. In Petroleum Industry Transformations; Thune, T., Engen, O.A., Wicken, O., Eds.; Beyond, Routledge: Oxford, UK, 2019; p. 23. ISBN 9780367518790. [Google Scholar]
- Al-Saadi, T.; Cherepovitsyn, A.; Semenova, T. Iraq Oil Industry Infrastructure Development in the Conditions of the Global Economy Turbulence. Energies 2022, 15, 6239. [Google Scholar] [CrossRef]
- Karmaker, S.C.; Chapman, A.; Sen, K.K.; Hosan, S.; Saha, B.B. Renewable Energy Pathways toward Accelerating Hydrogen Fuel Production: Evidence from Global Hydrogen Modeling. Sustainability 2023, 15, 588. [Google Scholar] [CrossRef]
- Hosan, S.; Karmaker, S.C.; Rahman, M.M.; Chapman, A.; Saha, B.B. Dynamic Links among the Demographic Dividend, Digitalization, Energy Intensity and Sustainable Economic Growth: Empirical Evidence from Emerging Economies. J. Clean. Prod. 2022, 330, 129858. [Google Scholar] [CrossRef]
- Katysheva, E. Analysis of the Interconnected Development Potential of the Oil, Gas and Transport Industries in the Russian Arctic. Energies 2023, 16, 3124. [Google Scholar] [CrossRef]
- Tsiglianu, P.; Romasheva, N.; Nenko, A. Conceptual Management Framework for Oil and Gas Engineering Project Implementation. Resources 2023, 12, 64. [Google Scholar] [CrossRef]
- Nevskaya, M.A.; Seleznev, S.G.; Masloboev, V.A.; Klyuchnikova, E.M.; Makarov, D.V. Environmental and Business Challenges Presented by Mining and Mineral Processing Waste in the Russian Federation. Minerals 2019, 9, 445. [Google Scholar] [CrossRef]
- The Arctic Future: Options for Development. Available online: https://goarctic.ru/ (accessed on 21 April 2023). (In Russian).
- Ivanov, A.V.; Skladchikov, A.A.; Khrennikov, A.Y. Development of the electric power industry in the Arctic regions of the Russian Federation, taking into account the use of renewable energy sources. Russ. Arct. 2021, 13, 62–80. [Google Scholar] [CrossRef]
- Pan’kov, I.A.; Frolov, V.Y. Increase of electric power quality in autonomous electric power systems. J. Min. Inst. 2017, 227, 563. [Google Scholar] [CrossRef]
- Litvinenko, V.S.; Petrov, E.I.; Vasilevskaya, D.V.; Yakovenko, A.V.; Naumov, I.A.; Ratnikov, M.A. Assessment of the role of the state in the management of mineral resources. J. Min. Inst. 2022, 259, 95–111. [Google Scholar] [CrossRef]
- Vasilenko, N.; Khaykin, M.; Kirsanova, N.; Lapinskas, A.; Makhova, L. Issues for Development of Economic System for Subsurface Resource Management in Russia through Lens of Economic Process Servitization. Int. J. Energy Econ. Policy 2019, 10, 44–48. [Google Scholar] [CrossRef]
- Romanov, M.T. Territorial organization of the economy of poorly developed regions (on the territory of the Russian Far East). In Thesis of the Dissertation of the Candidate of Geological Sciences; Pacific Institute of Geography Far Eastern Branch of the Russian Academy of Sciences (FEB RAS): Vladivostok, Russia, 2007; 51p. (In Russian) [Google Scholar]
- Surzhikova, O.A. Problems and Main Directions of Development of Power Supply for Remote and Sparsely Populated Consumers in Russia. Vectors Well-Being Econ. Soc. 2012, 3, 103–108. Available online: https://cyberleninka.ru/article/n/problemy-i-osnovnye-napravleniya-razvitiya-elektrosnabzheniya-udalennyh-i-malonaselennyh-potrebiteley-rossii (accessed on 21 April 2023). (In Russian).
- Kirsanova, I.Y. Assessment of territory’s provision with oil pipeline and oil product pipeline infrastructure. Sci. Technol. Oil Oil Prod. Pipeline Transp. 2021, 11, 652–659. [Google Scholar] [CrossRef]
- Sychev, Y.A.; Zimin, R.Y. Improving the quality of electricity in the power supply systems of the mineral resource complex with hybrid filter-compensating devices. J. Min. Inst. 2021, 247, 132–140. [Google Scholar] [CrossRef]
- Agarkov, S.A.; Bogoyavlensky, V.I.; Kozmenko, S.Y.; Masloboev, V.A.; Ulchenko, M.V. Monitoring the development of arctic energy resources. In Global Trends in the Development of Energy Resources in the Russian Arctic, Part II; Kola Scientific Center of the Russian Academy of Sciences: Apatity, Russia, 2019; 177p. [Google Scholar]
- Fadeev, A.M.; Vopilovskiy, S.S.; Fedoseev, S.V.; Zaikov, K.S.; Kuprikov, N.M.; Kuprikov, M.Y.; Avdonina, N.S. Industrial Support of the Energy Projects as a Part of the Blue Economy Development in the Arctic. Sustainability 2022, 14, 15346. [Google Scholar] [CrossRef]
- Blinova, E.; Ponomarenko, T.; Tesovskaya, S. Key Corporate Sustainability Assessment Methods for Coal Companies. Sustainability 2023, 15, 5763. [Google Scholar] [CrossRef]
- Sychev, Y.A.; Aladin, M.E.; Aleksandrovich, S.V. Developing a hybrid filter structure and a control algorithm for hybrid power supply. Int. J. Power Electron. Drive Syst. 2022, 13, 1625–1634. [Google Scholar] [CrossRef]
- Development of the Arctic in the Future (2020-03-12). Official Website of the CDU TEK. Available online: https://www.cdu.ru/tek_russia/issue/2020/1/705/ (accessed on 28 May 2022). (In Russian).
- We’ll Go North. Oil and Gas Vertical National Industry Journal. Available online: http://www.ngv.ru/magazines/article/my-poydem-na-sever/ (accessed on 28 May 2022). (In Russian).
- Decree of the Government of the Russian Federation of 09.06.2020 No. 1523-r “On approval of the Energy Strategy of the Russian Federation for the Period up to 2035”. Available online: http://www.consultant.ru (accessed on 28 May 2022). (In Russian).
- Official Website of Rosneft Oil Company. Available online: https://www.rosneft.com (accessed on 30 August 2022).
- The Russian Ministry of Energy Official Internet Site. Alexander Novak: 60% of Recoverable Hydrocarbon Resources in Russia Are Concentrated in the Arctic. 2019. Available online: https://minenergo.gov.ru/node/7327 (accessed on 30 August 2022). (In Russian)
- Stroykov, G.; Cherepovitsyn, A.Y.; Iamshchikova, E.A. Powering Multiple Gas Condensate Wells in Russia’s Arctic: Power Supply Systems Based on Renewable Energy Sources. Resources 2020, 9, 130. [Google Scholar] [CrossRef]
- Riboldi, L.; Cheng, X.; Farahmand, H.; Korpås, M.; Nord, L.O. Effective concepts for supplying energy to a large offshore oil and gas area under different future scenarios. Chem. Eng. Trans. 2017, 61, 1597–1602. [Google Scholar] [CrossRef]
- Control of Rules 25.13330.2020 “Soil Bases and Foundations on Permafrost Soils”. Available online: https://www.russiangost.com/p-366508-sp-25133302010.aspx (accessed on 21 April 2023). (In Russian).
- Tender Search System “Initpro”. Available online: https://initpro.ru/ (accessed on 30 August 2022). (In Russian).
- Arestova, A.; Frolova, I.; Sokol, E. Automated Power Distribution System Planning for Oil and Gas Industry. In Proceedings of the 2020 Ural Smart Energy Conference (USEC), Ekaterinburg, Russia, 13–15 November 2020; pp. 5–8. [Google Scholar] [CrossRef]
- Turysheva, A.V.; Baburin, S.V. Justification of Power Supply System’s Structure of Oil and Gas Facilities Using Backup Energy Sources with Associated Petroleum Gas as the Energy Carrier. Int. J. Appl. Eng. Res. 2016, 11, 749–755. [Google Scholar]
- Scheidler, A.; Leon, T.; Martin, B. Heuristic optimization for automated distribution system planning in network integration studies. IET Renew. Power Gener. 2018, 12, 530–538. [Google Scholar] [CrossRef]
- Ogunwolu, L.; Ero, O.; Ibadapo-Obe, O. Modeling and optimization of an electric power distribution network planning system using mixed binary integer programming. Niger. J. Technol. 2017, 36, 552–562. [Google Scholar] [CrossRef]
- Sandberg, M.; Mukkavaara, J.; Shadram, F.; Olofsson, T. Multidisciplinary Optimization of Life-Cycle Energy and Cost Using a BIM-Based Master Model. Sustainability 2019, 11, 286. [Google Scholar] [CrossRef]
- Nechitailo, A.R.; Marinina, O.A. Analysis of technological directions of electrification of hydrocarbon production facilities in poorly developed territories. Sev. I Rynok Form. Ekon. Poryadka [North Mark. Form. Econ. Order] 2022, 2, 45–57. [Google Scholar] [CrossRef]
- Petrochenkov, A.; Romodin, A.; Leyzgold, D.; Kokorev, A.; Kokorev, A.; Lyakhomskii, A.; Perfil’eva, E.; Gagarin, Y.; Shapranov, R.; Brusnitcin, P.; et al. Investigation of the Influence of Gas Turbine Power Stations on the Quality of Electric Energy in the Associated Petroleum Gas Utilization. Sustainability 2022, 14, 299. [Google Scholar] [CrossRef]
- Turysheva, A.V.; Gulkov, Y.V.; Krivenko, A.V. Improving energy performance of the oil and gas industry by applying technologies for the use of associated petroleum gas. In Proceedings of the Topical Issues of Rational use of Natural Resources, St. Petersburg, Russia, 17–19 May 2019; Volume 1, pp. 442–447. [Google Scholar] [CrossRef]
- Turysheva, A.; Voytyuk, I.; Guerra, D. Estimation of electricity generation by an electro-technical complex with photoelectric panels using statistical methods. Symmetry 2021, 13, 1278. [Google Scholar] [CrossRef]
- Shmelev, P.I. Use of Associated Petroleum Gas: World Experience. Sib. Oil Online J. 2018, 152. Available online: https://www.gazprom-neft.ru/press-center/sibneft-online (accessed on 30 August 2022). (In Russian).
- Mullakhmetova, L.I.; Cherkasova, E.I. Associated petroleum gas: Preparation, transportation and processing. Bull. Kazan Technol. Univ. 2015, 18, 83–90. (In Russian) [Google Scholar] [CrossRef]
- World Energy Outlook 2020. Part of World Energy Outlook. Flagship Report—October 2020. Available online: https://www.iea.org/reports/world-energy-outlook-2020?utm_campaign=IEA%20newsletters&utm_source=SendGrid&utm_medium=Email (accessed on 30 August 2022). (In Russian).
- Schulz, R.; McGlade, C.; Zeniewski, P. Putting Gas Flaring in the Spotlight. International Energy Agency: IEA. Available online: https://www.iea.org/commentaries/putting-gas-flaring-in-the-spotlight (accessed on 30 August 2022).
- Galiullina, L.I. Problems and prospects of integrated and efficient use of associated petroleum gas in Russia. Bull. Kazan Technol. Univ. 2013, 16, 346–348. Available online: https://cyberleninka.ru/article/n/problemy-i-perspektivy-komplesnogo-i-effektivnogo-ispolzovaniya-poputnogo-neftyanogo-gaza-v-rossii (accessed on 21 April 2023). (In Russian).
- Report on the Functioning and Development of the Russian Fuel and Energy Complex in 2020. Ministry of Energy of the Russian Federation. Available online: https://minenergo.gov.ru (accessed on 30 August 2022). (In Russian)
- Leusheva, E.L.; Morenov, V.A. Development of combined heat and power system with binary cycle for oil and gas enterprises power supply. Neft. Khozyaystvo Oil Ind. 2017, 7, 104–106. [Google Scholar] [CrossRef]
- Leusheva, E.L.; Morenov, V.A. Combined oilfield power supplying system with petroleum gas utilization as an energy carrier. Neft. Khozyaystvo—Oil Ind. 2015, 4, 96–100. [Google Scholar]
- Fetisov, V.; Ilyushin, Y.V.; Vasiliev, G.G.; Leonovich, I.A.; Müller, J.; Riazi, M.; Mohammadi, A.H. Development of the automated temperature control system of the main gas pipeline. Sci. Rep. 2023, 13, 3092. [Google Scholar] [CrossRef] [PubMed]
- Abramovich, B.N.; Bogdanov, I.A. Improving the efficiency of autonomous electrical complexes of oil and gas enterprises. J. Min. Inst. 2021, 249, 408–416. [Google Scholar] [CrossRef]
- Belsky, A.A.; Glukhanich, D.Y.; Carrizosa, M.J.; Starshaia, V.V. Analysis of specifications of solar photovoltaic panels. Renew. Sustain. Energy Rev. 2022, 159, 112239. [Google Scholar] [CrossRef]
- Jiménez Carrizosa, M.; Stankovic, N.; Vannier, J.-C.; Shklyarskiy, Y.E.; Bardanov, A.I. Multi-terminal dc grid overall control with modular multilevel converters. J. Min. Inst. 2020, 243, 357. [Google Scholar] [CrossRef]
- Oliveira-Pinto, S.; Rosa-Santos, P.; Taveira-Pinto, F. Assessment of the potential of combining wave and solar energy resources to power supply worldwide offshore oil and gas platforms. Energy Convers. Manag. 2020, 223, 113299. [Google Scholar] [CrossRef]
- Vasilev, Y.; Cherepovitsyn, A.; Tsvetkova, A.; Komendantova, N. Promoting Public Awareness of Carbon Capture and Storage Technologies in the Russian Federation: A System of Educational Activities. Energies 2021, 14, 1408. [Google Scholar] [CrossRef]
- Fostering Effective Energy Transition (2019 Edition). Insight Report of the World Economic Forum. Available online: https://www.weforum.org/reports/fostering-effective-energy-transition-2019 (accessed on 30 August 2022).
- Lazard’s Levelized Cost of Energy Analysis—Version 14.0 2020. Available online: https://www.lazard.com/media/451419/lazards-levelized-cost-of-energy-version-140.pdf (accessed on 30 August 2022).
- Zimin, R.Y.; Kuchin, V.N. Improving the efficiency of oil and gas field development through the use of alternative energy sources in the Arctic. In Proceedings of the 2020 International Multi-Conference on Industrial Engineering and Modern Technologies (FarEastCon 2020), Vladivostok, Russia, 6–9 October 2020; pp. 1–5. [Google Scholar] [CrossRef]
- Ostroukh, A.; Berner, L.; Karelina, M.; Kravchenko, P.; Evtiukov, S. Intelligent control system for distributed gas transport facilities. In Transportation Research Procedia; Elsevier: Amsterdam, The Netherlands, 2021; Volume 57, pp. 376–384. [Google Scholar] [CrossRef]
- Shklyarskiy, Y.; Starshaya, V. Autonomous complex for electro-thermal heating of oil wells fed by a photovoltaic installation. E3S Web Conf. 2021, 266, 04006. [Google Scholar] [CrossRef]
- Fedak, W.; Anweiler, S.; Ulbrich, R.; Jarosz, B. The Concept of Autonomous Power Supply System Fed with Renewable Energy Sources. J. Sustain. Dev. Energy Water Environ. Syst. 2017, 5, 579–589. [Google Scholar] [CrossRef]
- Kozhevnikov, D. “Vostok Ojl” Mozhet Stat’ Glavnym Potrebitelem Vetroenergetiki [“Vostok Oil” May Become the Main Consumer of Wind Energy]. 2020. Available online: https://www.gazetazp.ru/ (accessed on 6 April 2022). (In Russian).
- Shevchenko, A.; Bahtina, O. Rosneft’ Ozhidaet Kommercheskih Predlozhenij ot Kompanij iz Kitaya po VES dlya “Vostok Ojl” [Rosneft Expects Commercial Proposals from Companies from China on the WPP for “Vostok Oil”]. 2022. Available online: https://neftegaz.ru/ (accessed on 6 April 2022). (In Russian).
- Elistratov, V.; Kudryasheva, I. Regimes, management and economics of energy complexes on the basis of renewable energy sources for autonomous power supply. E3S Web Conf. 2021, 124, 04023. [Google Scholar] [CrossRef]
- Elistratov, V.; Konishchev, M.; Denisov, R.; Bogun, I.; Grönman, A.; Turunen-Saaresti, T.; Lugo, A.J. Study of the Intelligent Control and Modes of the Arctic-Adopted Wind–Diesel Hybrid System. Energies 2021, 14, 4188. [Google Scholar] [CrossRef]
- Gubanov, M.; Potemkin, V.; Morkovkin, D.; Shmanev, S. Assessment of rational options for energy supply to remote consumers of the Arctic zone in the context of the development of renewable energy. IOP Conf. Ser. Earth Environ. Sci. 2021, 723, 052042. [Google Scholar] [CrossRef]
- Alturki, F.A.; Farh, H.M.H.; Al-Shamma’a, A.A.; AlSharabi, K. Techno-Economic Optimization of Small-Scale Hybrid Energy Systems Using Manta Ray Foraging Optimizer. Electronics 2020, 9, 2045. [Google Scholar] [CrossRef]
- Sebastián, R.; Nevado, A. Study and Simulation of a Wind Hydro Isolated Microgrid. Energies 2020, 13, 5937. [Google Scholar] [CrossRef]
- Melo, I.B.; Torres, J.P.N. Economic Sustainability Study of São Miguel Island in the Azores Using Photovoltaic Panels and Wind Turbines. Sustainability 2019, 11, 4782. [Google Scholar] [CrossRef]
- Resolution of the Governor of the Yamalo-Nenets Autonomous Okrug Dated April 28, 2021 N 65-PG “On Approval of the Scheme and Program for the Prospective Development of the Electric Power Industry of the Yamalo-Nenets Autonomous Okrug for the Period 2022–2026”. Available online: https://oemz.ru/ru/katalog (accessed on 6 April 2022). (In Russian).
- Official Site of Vympel Group of Companies. Available online: https://vympel.group (accessed on 6 April 2022). (In Russian).
- Information Portal “GIS Renewable Energy Sources of Russia”. Available online: https://gisre.ru/ (accessed on 6 April 2022). (In Russian).
- NASA SSE. Available online: http://photovoltaic-software.com (accessed on 21 April 2023).
- RETScreen. Available online: http://canada.ca (accessed on 21 April 2023).
- Typical Power Supply Schemes. Available online: https://yandex.ru/images/search?text=Executive%20scheme%20support%20vl%20110%20kv&source=related-duck&lr=2 (accessed on 6 April 2022). (In Russian).
- Working Project for the Power Supply of Installations for Pumping Oil Wells. Available online: https://stroystandart.info/index.php?name=files&op=view&id=4757 (accessed on 6 April 2022). (In Russian).
- Power Supply of the OIL Industry. Available online: https://www.2d-3d.ru/2d-galereia/electro/7003-jelektrosnabzhenie-predprijatija-neftjanoj-promyshlennosti-variant-9.html (accessed on 6 April 2022). (In Russian).
- Control of Rules 20.13330.2016 “Loads and Actions”. Available online: http://docs.cntd.ru (accessed on 21 April 2023). (In Russian).


| Subject of the Russian Federation | Number of Tenders (from January 2020 to May 2022) | Total Amount, Million Rubles | Average Cost, Million Rubles per Tender |
|---|---|---|---|
| Yamalo-Nenets Autonomous District | 28 | 1544.485 | 55.160 |
| Khanty-Mansi Autonomous District | 34 | 1524.515 | 44.839 |
| Tomsk Region | 21 | 830.944 | 39.569 |
| Composition and Characteristics | Cluster No. 1 | Cluster No. 2 |
|---|---|---|
| Wind turbine: | ||
| - Tower height, m | 15 | 15 |
| - Diameter of rotor blades, m | 2 | 2 |
| - Generated energy, MWh/year | 661.39 | 661.39 |
| Solar panels: | ||
| - Quantity, pcs. | 8 | 9 |
| - Maximum power, W | 203.62 | 203.62 |
| Batteries: | ||
| - Capacity, Ah | 1583.06 | 1693.88 |
| - Voltage, V | 2 | 2 |
Disclaimer/Publisher’s Note: The statements, opinions and data contained in all publications are solely those of the individual author(s) and contributor(s) and not of MDPI and/or the editor(s). MDPI and/or the editor(s) disclaim responsibility for any injury to people or property resulting from any ideas, methods, instructions or products referred to in the content. |
© 2023 by the authors. Licensee MDPI, Basel, Switzerland. This article is an open access article distributed under the terms and conditions of the Creative Commons Attribution (CC BY) license (https://creativecommons.org/licenses/by/4.0/).
Share and Cite
Marinina, O.; Nechitailo, A.; Stroykov, G.; Tsvetkova, A.; Reshneva, E.; Turovskaya, L. Technical and Economic Assessment of Energy Efficiency of Electrification of Hydrocarbon Production Facilities in Underdeveloped Areas. Sustainability 2023, 15, 9614. https://doi.org/10.3390/su15129614
Marinina O, Nechitailo A, Stroykov G, Tsvetkova A, Reshneva E, Turovskaya L. Technical and Economic Assessment of Energy Efficiency of Electrification of Hydrocarbon Production Facilities in Underdeveloped Areas. Sustainability. 2023; 15(12):9614. https://doi.org/10.3390/su15129614
Chicago/Turabian StyleMarinina, Oksana, Anna Nechitailo, Gennady Stroykov, Anna Tsvetkova, Ekaterina Reshneva, and Liudmila Turovskaya. 2023. "Technical and Economic Assessment of Energy Efficiency of Electrification of Hydrocarbon Production Facilities in Underdeveloped Areas" Sustainability 15, no. 12: 9614. https://doi.org/10.3390/su15129614
APA StyleMarinina, O., Nechitailo, A., Stroykov, G., Tsvetkova, A., Reshneva, E., & Turovskaya, L. (2023). Technical and Economic Assessment of Energy Efficiency of Electrification of Hydrocarbon Production Facilities in Underdeveloped Areas. Sustainability, 15(12), 9614. https://doi.org/10.3390/su15129614