Review

Landolt Indicator Values in Modern Research: A Review

by
Natalya Ivanova
1,* and
Ekaterina Zolotova
2
1
Institute Botanic Garden Ural Branch of RAS, 8 Marta Street, 202a, 620144 Yekaterinburg, Russia
2
Zavaritsky Institute of Geology and Geochemistry, Ural Branch of Russian Academy of Sciences, 15 Akad. Vonsovsky Street, 620010 Yekaterinburg, Russia
*
Author to whom correspondence should be addressed.
Sustainability 2023, 15(12), 9618; https://doi.org/10.3390/su15129618
Submission received: 14 April 2023 / Revised: 12 June 2023 / Accepted: 13 June 2023 / Published: 15 June 2023
(This article belongs to the Special Issue Biodiversity Conservation and Environmental Sustainability)

Abstract

:
The conservation of biodiversity and ecosystem sustainability is essential for human well-being. An important tool for addressing this issue is ecological indicators. This overview document examines recent studies covering the period 2018–2022 that use the values of the Landolt indicator as one of the analysis methods. The total number of records examined was 8910. After excluding irrelevant, inconsistent and duplicate records, 91 records were selected. The selection criteria were the presence of the English abstract and a digital object identifier (DOI). We chose the VOSviewer software for data analysis and visualization. The analysis of research geography, types of plant communities under research, research topics, the network of co-authorship and relationship papers, as well as the publication activity and citation rate of the authors, is carried out. The results revealed that the geography of using Landolt indicator values is quite wide, while they are more often used in Switzerland, Italy and Russia. The most important and frequently cited studies were carried out in the context of large international projects, confirming the importance of scientific cooperation in the development of environmental indicators. The Landolt indicator values showed effectiveness in the study of forests, bogs, riparian vegetation, a coarse quarry waste dump, and in assessing the urban environment. At the same time, the vegetation dynamics and influence of various factors on plants were studied most often. It was revealed that Landolt indicator values can serve as an effective universal method that integrates many aspects of the environment and allows for a comprehensive multicriteria analysis of environmental factors, habitat stability, vegetation diversity and dynamics for different plant communities at different spatial scales over a wide geographical area. This is confirmed by the high citation rate of the papers. We recommend the Landolt indicator values for a wider use, including in the monitoring of ecosystems and individual species for their conservation and sustainable management. In order to achieve this goal, it is necessary to extend the network of relationships between the authors, which is not very well developed at the moment. The research results obtained are useful for the further successful development not only of the Landolt indicator values but also of environmental indicators in general.

1. Introduction

The anthropogenic impacts on natural ecosystems are constantly increasing and multiplying the effects of global climate warming, with serious and sometimes catastrophic consequences. The likelihood of local and global environmental crises is steadily increasing [1,2]. The biodiversity of natural ecosystems is decreasing every year. This is causing concern about the preservation of a favorable habitat for humanity [3,4]. Biodiversity conservation is becoming one of the most pressing issues of our time. To achieve this goal, large-scale studies of environmental sustainability, the drivers of ecosystem dynamics and multilevel monitoring of biodiversity are needed.
The compositions, structures and dynamics of plant communities are determined by a complex of environmental factors [5,6,7]. However, it is practically impossible to evaluate these factors by one-time accounting without long-term stationary studies, since daily, seasonal and year-to-year variability of indicators will not be taken into account. Ecological indicator values make it possible to assess the cumulative impact of factors, since they link the signs of vegetation and gradients of the leading environmental factors [8]. The assessment of habitats by ecological indicator values has a number of advantages. Firstly, this is not an economically costly method. Secondly, the assessment takes into account not only the total impact of the environment but also the influence of each factor on the vital activity of plants.
Dozens of different ecological indicator values have been developed to date and have a wide range of applications [8,9]. H. Ellenberg [10] and E. Landolt [11] were among the first to develop indicators for Europe. These indicators are still widely used for this region. The indicator values developed by L.G. Ramensky with others [12] and D.N. Tsyganov [13] are more used in Russia and the CIS countries. It is worth remembering that the accuracy of the habitat analysis based on the ecological indicator values is proportional to the percentage of species characterized by the selected ecological indicator.
The first version of the Landolt indicator values characterized more than 3000 species of flora in Switzerland according to 17 different ecological characteristics [11]. Over the next 30 years, he continued to collect information on the ecology of individual species from the literature and compare it with his own research. As a result, Landolt and his colleagues published the second edition of ecological indicator values—“Flora indicativa” [14]. More than 3400 species and intraspecific taxa of plants were characterized in relation to light availability (L), temperature (T), continentality (K), soil moisture/water availability (F), soil reaction/pH (R), soil nutrients/fertility (N), soil dispersion/aeration (D) and humus content (H). Each environmental factor is evaluated with five scores, where 1 means low, and 5 means high. In addition, Landolt and others [14] assigned plant species to eight different habitat groups: plants of fertile meadows, mountain plants, plants of dry and nutrient-poor meadows, pioneer plants at low elevation, moor and marsh plants, weeds and ruderal plants, forest plants and water plants.
Mean ecological indicator values are calculated at the community level by weighing the species values according to the width of their niche, that is, giving twice as much weight to species with narrow requirements [14] without taking into account the relative coverage of species. The calculation of the ecological indicator values can be carried out using Vegan and BiodiversityR packages in the free software environment R. For these purposes, the lvalue function in the vegan package [15] and the lindval function in the BiodiversityR package [16] are used. These functions calculate the Landolt indicator values for each species in a set of vegetation plots based on the method described by Landolt [11]. This method involves weighing the abundance of each species by its fidelity (i.e., the proportion of plots in which it occurs) and the average fidelity of the indicator group. Russian developers have also developed software for calculating environmental indicators [17,18].
Landolt indicator values are used less frequently than Ellenberg indicator values. The use of Landolt ecological indicators is particularly successful in the analysis of alpine communities [19], since many alpine plant species are included in them. The popularity of Landolt indicator values is due to the following positive qualities: numerous plant species are described, more (compared to Ellenberg indicator values) environmental parameters are included, and the availability of software for calculation. The negative qualities of using these indicators are that they are not suitable for all plant communities, and also that they need to be adapted for new regions where the flora is very different from that of the European Alps.
Some researchers carried out work on recalibrating the Landolt indicator values and adapting them for the use in new regions [20,21]. It was found that 2000 vegetation records are a sufficient basis for an optimal recalibration of vegetation types [20]. Recalibrated ecological indicator values and niche width increase ecological knowledge on plants. The research results show that the use of the Landolt indicator values is possible for such regions as the Caucasus [21]. The Landolt indicator values are used in Russia (often in combination with the Ellenberg indicators) to characterize habitats and study the dynamics of vegetation cover and other important environmental problems [22,23,24,25].
The Landolt indicator values are discussed. Researchers have proven that restrictions in the use of the mean indicator values’ species-based traits concern statistical tests (ANOVA, especially when using PCA scores) that assume statistical independence from species scores when there is none [26]. It was published that the analysis of habitats using these ecological indicator values can produce fairly reliable information regarding the thickness of the humified residue horizon and, thus, the humus form [27].
At the moment, there are no studies with a comprehensive analysis of the use of Landolt indicator values. The lack of this information complicates the development and practical application of the Landolt indicator values. Therefore, a comprehensive review of this method is necessary for the scientific community and important for the practical application of environmental indicators. The aim of our research was to analyze modern studies that use the Landolt indicator values. Our task was to answer the following questions: What issues are the Landolt indicator values used for? What is the geography of research? Which studies are of the greatest interest (citation)? The answers to these questions will show how the Landolt indicator values have developed, highlight new research directions and indicate its relevance in the scientific community. We will also undertake a research analysis of the role of the Landolt indicator values in assessing habitat, environmental sustainability and biodiversity conservation and identify areas of practical application.
Our research analysis also aims to identify the network of research relationships and the most important researchers in this scientific field. To accomplish this, we will conduct a paper relationship analysis based on the references, a co-authorship analysis, a published-by-author analysis and an author citation analysis. An analysis of the contribution of the sources will also be carried out. Our research analysis covers all aspects and areas of application of the Landolt indicator values. Therefore, the results of this research will help the researchers to navigate the level of modern development of the Landolt indicator values, understand the strengths of this method, make a reasonable decision about the feasibility of its use in research, find the scientific team for joint research and choose a scientific journal to publish the research results. We hope that our research will contribute to the continued successful development of not only the Landolt indicator values but environmental indicators in general.

2. Materials and Methods

2.1. Data Collection

Data collection was carried out for the period from 2018 to 2022. We used the PRISMA guidelines [28] and guidelines for environmental science studies [29] in conducting this research. “Landolt indicator values” was the search term. Google Scholar, ScienceDirect, Mendeley, SciProfiles were selected to search for information. This research stage was conducted in the period from December 2022 to January 2023. The total number of records examined was 8910. Schematic diagram of our research analysis is shown in Figure 1.

2.2. Selecting Studies to Include in a Systematic Review

When the authors of the paper did not indicate that they used Landolt indicator values, or indicator values developed on the basis of it, then these papers were not included in our research analysis. The presence of the English abstract and the digital object identifier (DOI) were a prerequisite for the record selection. Geographical location was not included in the list of criteria for excluding records. All abstracts were analyzed to decide whether to include or exclude the record. Despite the fact that “Landolt indicator values” was the search term, we found many records based on automatic search that related to other ecological indicators. These records were excluded from further research analysis. Duplicate records were excluded at the final stage. The number of records selected was 91. Figure 2 shows the distribution of the number of selected papers by year.

2.3. Data Extraction, Management, Analysis, and Visualization

The data were extracted manually and recorded in an Excel spreadsheet. The criteria used to extract the data are as follows: publication year 2018–2022; the presence of the English abstract and digital object identifier (DOI) for the articles; the use of Landolt indicator values in research.
We chose the VOSviewer software for data analysis and visualization. VOSviewer is currently widely used in modern research to analyze bibliographic data and visualize findings in a wide variety of scientific fields [30,31,32]. VOSviewer has been used to analyze the relationship between papers based on reference lists, co-authorship analysis, citation analysis of papers, authors and journals.
We provided a set of DOIs to download the data into the VOSviewer. Any text file containing a DOI can be used as a DOI file. VOSviewer identifies all DOIs contained in the DOI file. It then loads the data for all available documents with the corresponding DOI. VOSviewer was then used to analyze the relationship between papers based on references, co-authorship analysis, citation analysis of papers, authors and journals. For this aim, a cluster analysis was performed, and relevant relationship maps were constructed. The clustering technique used is based on recent developments in network science and bibliometric and is an alternative to multidimensional scaling [33,34]. In general, this technique yields more structured maps than multidimensional scaling [35]. In addition to VOSviewer, this clustering technique has also been used in other software products [36,37]. The method used in the VOSviewer allows for efficient clustering of large numbers of records, up to several millions, and for constructing visual maps of the relationship network. The disadvantage is that, due to the lack of direct relationships, some papers or authors cannot be correctly assigned to a cluster. When a map is created from bibliographic data, the map wizard offers a choice between two counting methods. We used full counting. We used citations as the main attribute weight. When dealing with co-authorship, citations or bibliographic coupling links, the Citations attribute indicates the number of citations received by a document or the total number of citations received by all documents published by a source, author, organization or country.
An important feature of VOSviewer is the ability to handle large maps. VOSviewer can easily create maps with several thousand elements and display maps with more than 10,000 elements. VOSviewer has zoom, scroll and search functions, making it easy to examine large maps in detail. When displaying a map, VOSviewer uses a special algorithm to determine which labels can and cannot be displayed, so that labels do not overlap each other. The further a particular map area is zoomed in, the more labels become visible [35].

2.4. Study Limitations

This scientific analysis was limited to articles with DOIs that were published between 2018 and 2022. However, the use of PRISMA guidelines [28] and guidelines for environmental science research [29], as well as the strict selection/quality criteria for reviewing papers, enabled us to conduct our research analysis at a high scientific level and to achieve the set aim.

3. Results

3.1. Frequency of Studies by Country

Most of the modern research using the Landolt indicator values is concentrated in the Alps. It should be clarified here that these indicator values were designed specifically for this region. Most of the research is conducted in Switzerland (Table 1). Italy and Russia are among the top three in terms of the number of studies over the past five years. Four studies were carried out in both Germany and France. Croatian scientists used the Landolt indicator values in only two studies [38,39]. Single studies cover plant communities of Georgia, Slovakia, Hungary, Bosnia and Herzegovina and the Czech Republic [38,40].

3.2. Type of Plant Community under Research

Studies based on Landolt indicator values can be divided into three groups: studies of the flora of large areas (21% of all articles), studies of various plant communities (68%) (Table 2) and studies of individual plant species (11%).
The study of flora was mainly carried out using modern methods and had a methodological character [41,42,43,44]. Over a five-year period, 19 articles were published. The study of individual plant species is the subject of 10 articles. Researchers studied Genus Saxifraga L. [45], Aristolochia pallida [46], Douglas fir [47], Alpine orchids [48], Nuphar pumila [49], European beech [50] and other species.
The largest number of studies was carried out on alpine meadows, mainly grasslands (Table 2). The share of such studies is 33%. Scientists studied grasslands in the Swiss Alps [51,52,53,54,55] and in the Bavarian Alps (Germany) [56], alpine pastures in Northwest Italy [57,58], Mediterranean alpine calcareous grasslands in the Central Apennines (Italy) [59], mountain hay meadows of high conservation value in the Jura Mountains and Vosges Mountains (France) [60] and grasslands in other areas. The impact of A. viridis encroachment on plant community composition and diversity was analyzed, and a map of the spatial distribution of Highland cattle in A. viridis-encroached pastures was compiled [61]. Separately, it is worth noting the article on the impact of alpine alder on nearby grass and dwarf shrub vegetation by the nitrogen supply from the symbiotic bacteria Frankia alni from Alnus viridis [62].
Eleven articles are devoted to the study of forest ecosystems (Table 2). Research was conducted on old-growth mesic broad-leaved forest [63,64,65], beech forests [66], Pinus nigra plantations [67], mixed mountain forests composed of Picea abies, Abies alba and Fagus sylvatica [68], old-growth spruce-fir forests [69] and others.
Plant communities of the spring-well beds of the Po Plain (Northern Italy) were characterized through phytosociological relevés and different ecological indexes [70]. Several articles were devoted to the study of mire communities [71,72], degraded alpine mountain bog [73] and riparian vegetation [74]. Scientists investigated wetlands of the canton of Zürich in the lowlands of Eastern Switzerland where a wetland loss of 90% occurred over the past 150 years [75].
The Landolt indicator values were used for subarctic vegetation [76], forest-steppe vegetation [77] and vegetation on mountain summits [78]. Part of the research is devoted to plant communities in landslide areas, abandoned quarries [79], as well as in a coarse quarry waste dump [80].

3.3. Characterization of Research Topics

The directions of modern research using the Landolt indicator values are diverse. The largest number of papers over the past five years is aimed at studying the dynamics of vegetation and assessing the impact of various factors on natural ecosystems (Table 3). Long-term dynamics of vegetation under the influence of various factors are given for the Swiss flora [44,81,82], subarctic vegetation [76], forest [66], wetland [75], grasslands [59], Alpine orchids [48] and for plant species richness on mountain summits [78]. The studies of climate-driven dynamics for various types of vegetation deserve special attention [66,76,83,84].
Scientists considered the recovery dynamics for the alpine mountain bog [73], bare slopes [79], forests [64,67,68,85] and grasslands [86]. Climatic, soil, plant and anthropogenic factors were assessed for grasslands [53,60,61]. The relationship between the grassland management and biodiversity was studied [51,87,88,89].
Over the past 5 years, 16 articles were devoted to the analysis of growing conditions and the study of ecological niches. Research topics are very diverse. We will mention only a few of them. A wide sample of 324 pastures in the northwestern Italian Alps was surveyed, and comprehensive vegetation and soil surveys were carried out [89]. The scientists traced the phylogenetic signal for this niche conservatism in the highly related and functionally contrasting groups of common soil protists (Bacillariophyta, Cercomonadida, Ciliophora, Euglyphida and Kinetoplastida) along the humid but increasingly cold altitude gradient in Switzerland [90]. Cold range limits of Carex curvula (Cyperaceae) and Nardus stricta (Poaceae) were defined on acidic soils of high-altitude habitats in the European Alps [91].
Methodological studies are always of scientists’ interest. Species distribution models (SDMs) were used in several papers [43,92]. Moreover, the researchers proposed a novel methodological approach that combines empirical knowledge on the determinants of soil seed bank characteristics with a modern, flexible statistical approach based on machine learning [93]. Interobserver error was analyzed in vegetation monitoring [42]. The main data on the “Database of anthropogenic vegetation of Urals and adjacent territories” registered in the Global Index of Vegetation-Plot Databases and the European Vegetation Archive are presented [24]. The Landolt indicator values helped to test the method of predicting habitat quality of protected dry grasslands using Landsat NDVI phenology [94], as well as verify the accuracy of estimates of illumination modes under the canopy using the on-board laser scanning [95].
Over the period of five years, only one work was aimed at calibrating the Landolt indicator values [96]. The researchers used an extensive database with floristic relevés from Southern France to recalibrate the indicator values using average values from co-occurring plants, which enabled them to develop indicator values for species that were not evaluated previously.
Three articles were published on each of the following scientific areas: ecology of individual species [45,46,97], vegetation classification and ordination of plant communities according to environmental factors [58,72,98] and the effect of nitrogen deposition on vegetation [55,62,99].
Single articles were aimed at the selection of plants for landscaping and recultivation of man-made landscapes. The conservation of biodiversity in urban areas is of great importance. The Landolt indicator values are applied in developing a feasible concept for a building envelope to promote biodiversity [100] and to identify the main plant species groups which are most suitable for the target green roof [101].

3.4. Analysis of the Relationship of Papers Based on References

We analyzed the reference lists of the selected papers using VOSviewer and visualized the relationships between the publications as a relationship network map (Figure 3). The dots represent individual papers. The dot size indicates the citation intensity of a given study. The lines show the relationship network based on the reference lists. The more lines connecting the dots, the stronger the relationship between the papers.
Seven fairly large clusters, containing 54 papers, were formed based on the similarity of the reference lists. The rest of the papers were either grouped by two or were not grouped at all. Each cluster has its own color. The lines reflecting the relationships within the cluster have the color of this cluster. The line color also shows intercluster interactions. In this case, the color of the line changes when moving from one cluster to the other. The distance between the clusters and the density of the network can be used to assess the cluster similarity. The closer the clusters are located in Figure 3a to each other, the greater is the similarity between the reference lists of the papers under study. Moreover, the denser the network of relationships, the greater the similarity of papers both within the cluster and between the clusters. As a result, we created a very visual Figure 3a, which allowed us to quickly and visually assess the degree of similarity of the papers and the relationship network. It is clear from this figure that most of the papers are grouped together in a dense cluster of clusters. This is an indication that the bibliographies of the papers in our study are quite similar. The authors use the same sources. This indicates a strong continuity in research, even if the scientific topics and geolocations are very different. This feature can be seen as a positive moment.
In order to identify the reasons for the clustering of papers, we analyzed Figure 3 in more detail. In particular, we focused on a group of clusters (Figure 3b). VOSviewer has the zoom functionality of the computer program, which allowed us to move easily from analyzing the global structure of the map to exploring the details. This figure clearly shows a dense network of relationships between the papers both within the clusters and between them.
Cluster 1 is highlighted in red. This is the largest cluster, which includes 13 papers. This cluster includes papers from 2019 and 2022. The studies were carried out mainly in Switzerland, less often in France, the Netherlands and Germany. The most-cited papers in this cluster are published by four Swiss authors [51,95,102,103]. Despite the largest cluster size, the most-cited papers were not included in this cluster.
The green cluster is the second largest in the number of papers. This cluster includes 12 papers. In addition, the special feature of Cluster 2 is that it contains the papers with the highest number of citations. In the center of this cluster is a paper by a large international team of authors published in the Nature journal in 2018 and dedicated to the problem of the changing plant diversity in the mountains due to the climate warming [78]. The total number of citations of this paper is 408 according to Crossref. This is an excellent example of the successful work of an international team that, through the joint efforts of researchers from various countries, obtained important results of both theoretical and practical significance. This cluster includes six other papers that also deal with the problem of climate change in the mountains and are of recognized importance to the scientific community. Two studies carried out by Austrian authors described in [83,104] have 94 and 38 citations, respectively. A study carried out by a team of authors from Germany [105] has 28 citations. Two studies carried out by a team of Italian researchers described in [106] and [48] have 25 and 13 citations, respectively. A study carried out by Swiss researchers [84] has 16 citations. A study carried out by an international team of authors from Germany and USA [107] has 10 citations. The rest of the papers in this cluster are also somehow related to climatic changes or mountain regions. Thus, it can be summarized that Cluster 2 combines studies on climate change in mountain regions (mainly in the Alps).
Cluster 3 is highlighted in blue and includes 10 papers. This cluster combines papers devoted to various aspects of the study of the floral composition of meadows and the peculiarities of the interaction of plant species. The central place in this cluster is occupied by three papers [94,108,109]. The first two of them use remote sensing as the main research method. This method made it possible to conduct large-scale research and obtain results of both theoretical and practical significance. These papers received the most recognition and are actively cited (35 and 27 Crossref citations, respectively). A study conducted by Dalle Fratte and co-authors [109] is devoted to the change in plant traits under the influence of global climatic shifts and is also actively cited (14 citations in Crossref).
Cluster 4 is highlighted in yellow and includes nine papers. This cluster combines papers by Italian authors devoted to plant diversity and the pastoral value of high-altitude pastures. The central place is occupied by the studies of Pittarello [87,88,110] and Perotti [53,111].
Cluster 5 contains four papers and is highlighted in purple. This cluster is very sparse. It combines mainly the research of German authors. The lead author is Rosbakh [56,93,112]. The sustainability of plants and plant communities is the main scientific topic in this cluster.
Cluster 6 contains three papers and is highlighted in turquoise. This cluster is also very sparse. It combines studies by Swiss authors on rare and endangered species [75,81,82].
Cluster 7 also contains three papers and is highlighted in orange. This cluster unites studies by Slovenian authors on the regeneration dynamics [67,68,85]. This is the only cluster dedicated to the study of forest ecosystems.
The remaining papers were grouped only by two, or not grouped at all. Of this group, five papers are of interest, which are located in Figure 3 most separately. The information about these papers is given in Table 4. Three studies from this list were carried out in Russia. The authors of these papers refer more to national studies, which increases their distance from other papers. One paper from this list belongs to the field of mathematics, which also explains its small similarity with other papers published within the framework of biological sciences.
Thus, we found that in most cases, clusters are formed according to the geographical principle. This is because authors often refer to national studies. However, pronounced intercluster interactions indicate the recognition of the importance and scientific contribution of a whole range of scientific research. Moreover, a rather interesting result is the identification of the most isolated papers away from the center of the clusters’ concentration. There could be two main reasons for the isolation. Firstly, the subject matter of the isolated papers differs sharply from the generally accepted direction of using the Landolt indicator values. Secondly, studies conducted by Russian researchers also often turn out to be isolated. This indicates the partial scientific isolation of the Russian Federation.
In general, the analysis not only revealed the peculiarities of combining papers into clusters but also established the most significant publications in the field of the Landolt indicator values for both the entire scientific community and researchers of individual countries. The information about the most-cited papers is summarized in Table 5. This table shows 15 top papers with the total number of citations accounting for 72% of all citations on this topic. Two papers on climate change received the largest number of citations. Next in terms of the number of citations are two papers devoted to predicting habitat quality and species distribution and two papers about the spatial aspects of grassland diversity. Also in the top 15 papers are papers on soils and mineral nutrition.

3.5. Authors’ Contribution to Research Based on Landolt Indicator Values

3.5.1. Published According to Author

The ranking of authors by the number of publications showed that the vast majority of the authors (334) published only one paper in the past 5 years (Figure 4). A significantly smaller number of authors, namely thirty-five, published two papers. Three and four papers were published seventeen and eight researchers, respectively. Four authors can be considered the leaders in terms of the number of publications. Lonati has the largest number of publications. He published eight papers in the past 5 years. Pittarello and Probe published six papers each, and Lombardi published five papers.

3.5.2. Authors’ Citation Analysis

The citation of authors is an important indicator of their contribution to the research of the problem. The results of the authors’ citation analysis using the VOSviewer are shown in Figure 5. This analysis made it possible to identify the most-cited authors and visualize their position in the network of relationships. A dense group of four clusters with the most influential authors with a high number of citations and a dense network of relationships was formed in the center of Figure 5. The small distance between the clusters indicates their similarity in terms of citations. We can interpret this as a single central cluster core. Moreover, numerous lines within the central cluster core also indicate strong relationships between the authors not only within the clusters, but also between them.
The red cluster unites the authors with the highest citation rate. Here, we can mention Lamprecht, Pauli, Steinbauer and Winkler. These authors have 511 citations each. Slightly less citation (446 citations) have Matteoda, Risen, Vittoz, Wipf and Dullinger. We consider it appropriate to also highlight such authors as Kulonen (436 citations), Erschbamer (420 citations) and Kapfer (414 citations). In total, 75 authors are included in this cluster, forming a dense network of interconnections among them.
The green cluster is the second in the number of combined authors. This cluster includes 52 authors. However, the authors of this cluster cannot be considered leaders in terms of the number of citations. Fischer has the largest number of citations (21). Also in this cluster are Graf and Dengler, who have 17 and 10 citations, respectively.
The blue cluster unites 32 authors. In this cluster, Zimmermann is the clear leader in terms of the number of citations. He was quoted 464 times. The citation rate of the other authors of this cluster is much lower. The following authors could be mentioned: Meuli (56 citations), Scherrer (36 citations), Baltensweiler (33 citations) and Ginzler (33 citations).
The lilac cluster unites 17 authors. In this cluster, two authors are distinguished by the number of citations. They are Dullinger and Steinbauer, who have 446 and 408 citations, respectively. The following authors can also be noted in this cluster: Semenchuk (94 citations) and Hülber (50 citations).
The yellow and turquoise clusters are located separately from the central cluster core. These are relatively small clusters. The yellow cluster includes 26 authors, and the turquoise cluster includes only 10 authors. In the yellow cluster, the leaders in citation are Lonati, Pittarello, Probo and Lombardi, who have 63, 57, 55 and 54 citations, respectively. In the turquoise cluster, three authors can be noted: Ecker, Schaepman-Strub and Weber. Each of them was quoted 35 times. The absence of connecting lines between the clusters indicates very weak relationships with the authors in other clusters. Thus, it can be concluded that the authors of these clusters work separately from the scientific community. Apparently, this is the reason for the lower citation rate of their papers.
The remaining clusters have small numbers of authors and do not include authors with a significant number of citations. The relationships with other authors are extremely weak.
Thus, our research citation analysis allowed us not only to identify the most influential authors who made the greatest contribution to research based on the use of the Landolt indicator values, but also to reveal the reasons why other authors were unable to achieve recognition of their research results. Probably, the isolation of the authors from the scientific community is the main reason for this. To verify this conclusion, we conducted an additional analysis, namely the co-authorship analysis.

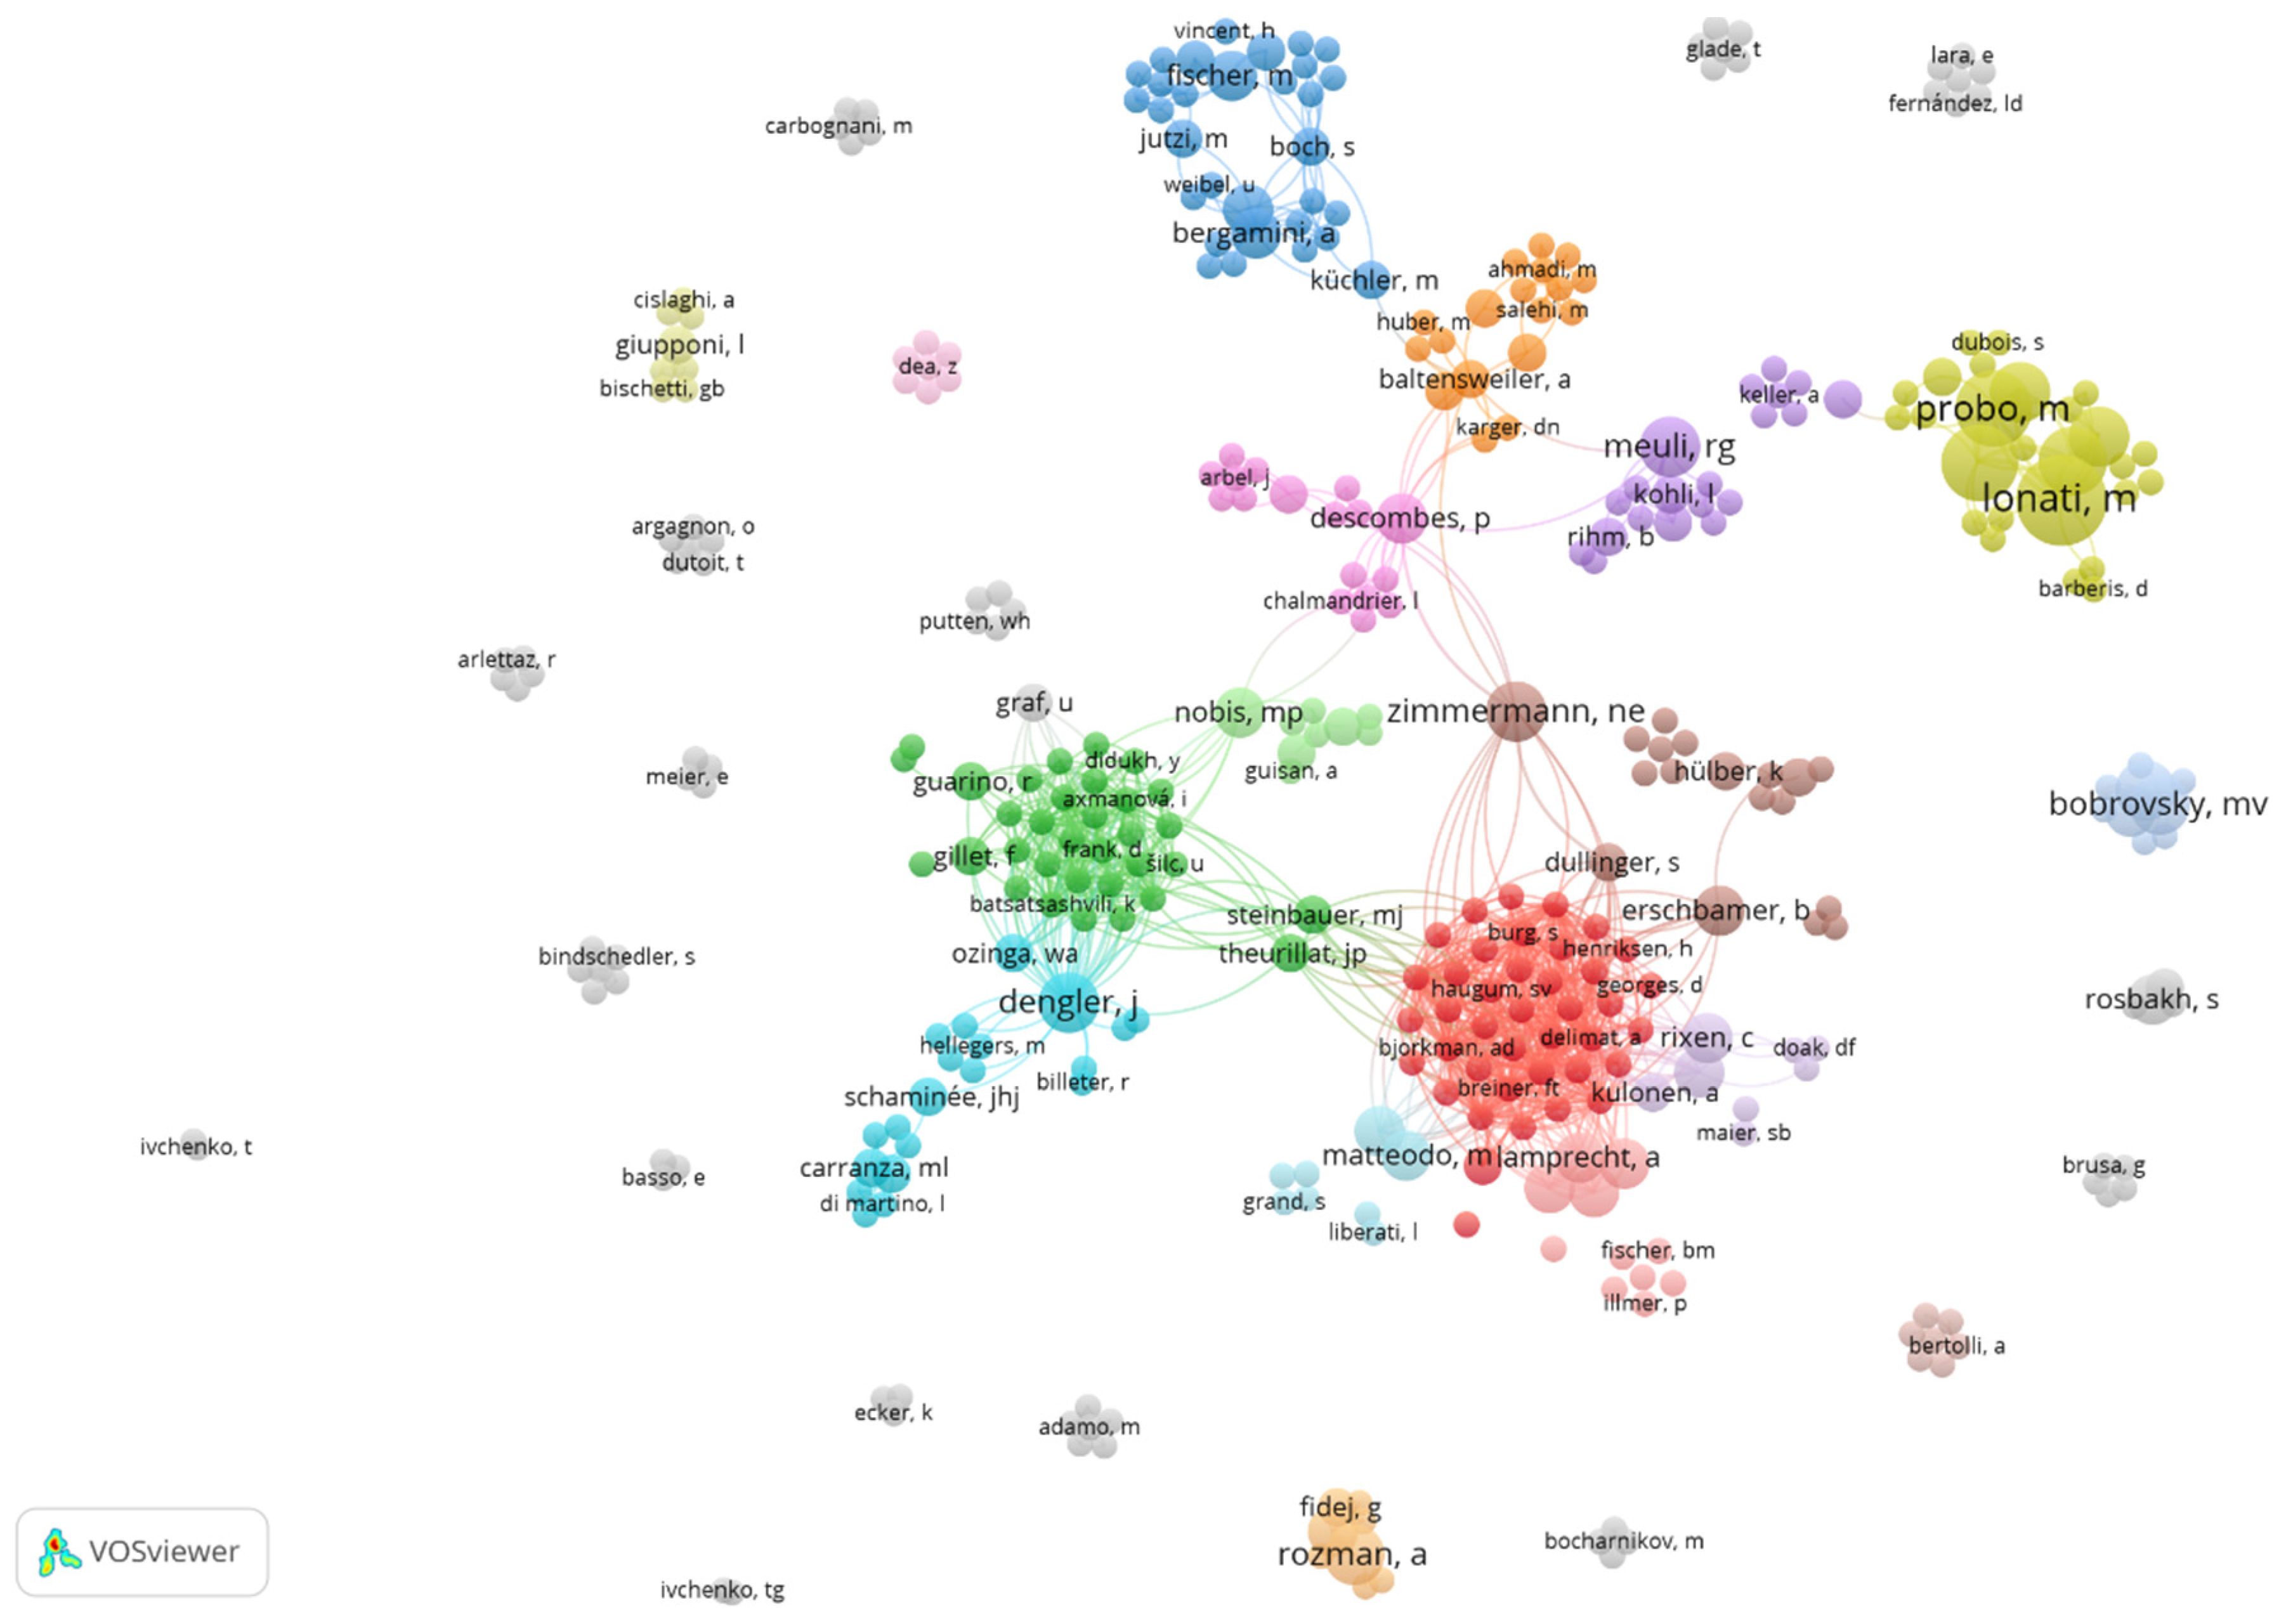
3.5.3. Co-Authorship Analysis

The level of research cooperation is one of the most effective indicators for assessing the current state in the research field. The results of this analysis are presented in Figure 6. This figure clearly shows large centers of cooperation highlighted in different colors. These centers correspond to large research projects with a very dense network of the authors’ relationships. Figure 6 also reflects a large number of small groups and individual authors who are practically not included in the cooperation network. In general, the network of relationships between the authors using the Landolt indicator values is not well developed, despite the presence of examples of active cooperation of researchers to perform tasks. Many authors work individually and do not cooperate with other researchers. This is perhaps the most significant problem in the studies based on the Landolt indicator values. At the same time, our analysis made it possible to identify the authors who are the leaders of cooperation, and who undoubtedly play an important role in this scientific direction. There are such authors-leaders of cooperation in many of the clusters we constructed. Understanding the importance of scientific cooperation, we will consider this aspect in more detail.
The red cluster is the largest and includes 40 authors. In addition, this cluster is very dense with a pronounced network of co-authorship within the cluster. Moreover, there are no pronounced leaders of cooperation in the red cluster. Almost all the authors of this cluster actively interact with each other. Intercluster interactions are developed satisfactorily. The green cluster includes 33 authors. It is also a very dense cluster with a dense network of interconnections. Almost all the authors of this cluster actively interact with each other. Intercluster interactions are developed satisfactorily. The blue cluster includes 31 authors. However, it is quite sparse. Relationships with the authors of other clusters are minimal. The yellow cluster is quite dense, but with weak relationships of the authors. This cluster includes 26 authors. The intercluster interactions are minimal. Lilac and turquoise clusters are sparse clusters with weak relationships of the authors. The remaining clusters are small in volume. The authors are poorly connected within the clusters, and the intercluster interactions are not expressed. Zimmermann, Steinbauer, Theux, Erschbamer, Dullinger, Rixen, Wipf, Matteodo, Vittoz, Dengler and Nobis are the leaders in the co-authorship and intercluster interactions.

3.6. Source Contribution to Research Based on Landolt Indicator Values

The results of the research conducted on the basis of the Landolt indicator values over the past 5 years were published in 65 scientific journals. We identified the top 15 in terms of the number of citations and papers and listed them in Table 6. Ecological Indicators, Ecology and Evolution and Applied Vegetation Science are the leaders in the number of papers. We can also mark Forest Ecology and Management that published four papers. However, despite having the largest number of papers, these journals are cited less frequently than Nature which published only one paper on the topic. In general, all the scientific journals listed in Table 6 are actively cited, which confirms the high scientific level of the papers and the interest of readers in them.

4. Discussion

Based on the papers published in the past 5 years, the Landolt indicator values are a widely used method in the scientific research. We found that the use of this methodology gives good results in the studies of different plant communities in different countries. The geography of the use of the Landolt indicator values is somewhat different from the geography of the use of the Ellenberg indicator values analyzed in our previous study [8]. If the maximum number of studies based on the Ellenberg indicator values is found in Germany, Poland and Slovakia, the maximum number of studies based on the Landolt indicator values is found in Switzerland, Italy and Russia.
The Ellenberg indicator values were developed in Germany and the Landolt indicator values in Switzerland. The research centers remain the same for both the Landolt and Ellenberg indicator values, despite the extension of the geographical application of these ecological indicators.
As with Ellenberg indicator values, we found no limitations to the use of Landolt indicator values when studying a wide range of plant communities. Although the Landolt indicator values were originally developed for the analysis of mountain vegetation in the Alps, studies demonstrated their effectiveness for the analysis of environmental factors in forests, fens, riparian vegetation, quarries, coarse quarry waste dumps, as well as for urban planting and landscaping. We assume that using the Landolt indicator values to study forest-meadow and forest-steppe ecotones, including the upper and northern Teeline, will give clearer results than the Ellenberg indicator values. We base this conclusion on the fact that the Landolt indicator values are specifically designed for the study of mountain areas. We therefore recommend their wider use in these plant communities. This recommendation aims to address the lack of information on environmental factors in a number of studies [116,117].
This study of the field of application of the Landolt indicator values showed that this methodology is useful for a wide range of current research problems, the solution of which is necessary to preserve diversity. The fields of application of the Landolt and Ellenberg indicator values are quite similar. The largest number of studies is devoted to vegetation dynamics and the impact of various factors on ecosystems. The focus of the Landolt indicator values on the study of mountain areas enhances the importance of these indicators for biodiversity conservation, since it is generally accepted that mountain ecosystems are the most vulnerable to both human impacts and climate change. Changes in mountain biodiversity in response to the climate change occur earlier and are more pronounced than in the plains. The heterogeneity of the mountain landscape results in high heterogeneity of habitats. Therefore, the determination of environmental factors requires a lot of effort and time. Data from weather stations, even from those located nearby, do not accurately reflect habitat conditions and cannot provide information on the heterogeneity of environmental factors. In this situation, the Landolt indicator values can be of practical help. This method allows us to record habitat heterogeneity and changes in environmental factors at the level of detail required for research and ecosystem management. The detailed identification of the mosaic of environmental factors can greatly contribute to the development of an optimal strategy for the management and conservation of mountain ecosystems, which are often used as pastures and are under increased stress. Such ecosystems require constant monitoring to prevent loss of stability and degradation of mountain pastures. Based on our research results, the Landolt indicator values can be recommended as an effective and relatively easy tool to determine the indicator of the stability of mountain communities.
The study of ecological niches is another important research field for biodiversity conservation. The Landolt indicator values are used in this research field as actively as the Ellenberg indicator values. The concept of ecological niche is central to ecology and biogeography and is therefore fundamental to the conservation of plant and animal species [118,119]. As we have written before [8], despite the importance of information about species’ ecological niches, niche characteristics are often compiled from incomplete data and are not accurate. The problem is exacerbated by the active transformation of ecological niches of some species under the influence of habitat changes. To obtain complete and accurate estimates of species’ ecological niches, large-scale studies are needed to cover the entire range of the species being studied. As a consequence, obtaining reliable and detailed data on environmental factors becomes a difficult task. In this case, the Landolt and Ellenberg indicator values can be combined to serve as an optimal research method. This also confirms the importance and effectiveness of these environmental indicators for biodiversity conservation. Recognizing the importance of the Landolt indicator values, we would like to emphasize the particular importance of research to improve the indicators themselves. Such studies are necessary to increase the effectiveness of the Landolt indicator values and expand the scope of their application. New indicator values will make the conservation of biodiversity more reasonable and effective.
We would also like to draw attention to other scientific applications of the Landolt indicator values, namely to the effectiveness of this method for assessing the urban environment, landscape design and for reclamation of disturbed territories. These scientific areas are extremely important for the creation and maintenance of a comfortable urban environment, which has a direct impact on people’s health, and sustainable development of the regions. Mining and mineral processing wastes occupy vast areas around the world and are pollution sources [120,121]. Therefore, it is very important to recycle industrial wastes and reclaim the disturbed landscapes. The result of successful reclamation is sustainable, productive and economically valuable ecosystems. We hope that our research analysis will contribute to the expansion of the use of the Landolt indicator values in this extremely important scientific field, and that they will be used more widely to create sustainable and favorable living conditions for people not only in rural areas but also in cities.
To conclude the discussion, we would like to point out that the improvement of the Landolt indicator values requires active cooperation of researchers both within and between countries. As our research showed, the current level of research collaboration is extremely low. We hope that this study will draw the attention of researchers to the Landolt indicator values and serve as an incentive to use these indicator values more actively and to seek a more effective cooperation within the scientific community.

5. Conclusions

The analysis of modern studies based on the Landolt indicator values revealed their effectiveness for solving a whole range of urgent problems, including for assessing environmental factors, habitat stability, vegetation dynamics, climate changes and ecological niches. All of these scientific fields are extremely important for solving the problems of sustainable nature management and biodiversity conservation. The range of plant communities for which the Landolt indicator values performed well is quite diverse and is not limited only to mountain meadows, for which they were originally developed. The Landolt indicator values showed effectiveness in the studies of forests, bogs, riparian vegetation, a coarse quarry waste dump and in assessing the urban environment and landscape design. For sustainable management of natural resources, monitoring of climate change and anthropogenic changes, this method is therefore important. The geography of using the Landolt indicator values is quite wide, while they are more often used in Switzerland, Italy and Russia. The active citation of the papers confirms the interest of researchers in the Landolt indicator values and their theoretical and practical importance. In general, our study revealed that the Landolt indicator values can serve as an effective universal method that integrates many aspects of the environment and allows for a comprehensive multicriteria analysis of environmental factors, habitat stability, vegetation structure and dynamics for different plant communities at different spatial scales over a wide geographical area. We recommend the Landolt indicator values for a wider use, including monitoring of the sustainability of habitats, ecosystems and individual species for their conservation and sustainable management.
Unfortunately, our findings reveal inadequate scientific collaboration among researchers using the Landolt indicator values. Only a few researchers actively interact with the scientific community and create centers of cooperation in the form of large scientific projects (including interdisciplinary projects), which attract researchers from different countries to working together. These centers create the most significant and highly cited works. We hope that our research will provide a new impetus for further development of the methodology of ecological indicators, foster its more extensive use and strengthen the understanding of the necessity and prospects of scientific collaboration. We also hope that the results obtained will be beneficial to young researchers in choosing their scientific paths in the development of sustainable natural resource management, biodiversity conservation and habitat preservation.

Author Contributions

Conceptualization, N.I. and E.Z.; methodology, N.I. and E.Z.; formal analysis, N.I. and E.Z.; investigation, N.I. and E.Z.; writing—original draft preparation, N.I. and E.Z.; writing—review and editing, N.I. and E.Z.; visualization, N.I. and E.Z. All authors have read and agreed to the published version of the manuscript.

Funding

The studies are carried out as a part of the state assignment of the Institute Botanic Garden, the Ural Branch of the Russian Academy of Sciences and a part of the IGG UB RAS State assignment (state registration No. NIOKTR 123011800011-2) using the “Geoanalitik” shared research facilities of the IGG UB RAS. The re-equipment and comprehensive development of the “Geoanalitik” shared research facilities of the IGG UB RAS is financially supported by the grant of the Ministry of Science and Higher Education of the Russian Federation (Agreement No. 075-15-2021-680).

Institutional Review Board Statement

Not applicable.

Data Availability Statement

Not applicable.

Conflicts of Interest

The authors declare no conflict of interest.

References

  1. Singh, A.; Mehta, S.; Yadav, S.; Nagar, G.; Ghosh, R.; Roy, A.; Chakraborty, A.; Singh, I.K. How to Cope with the Challenges of Environmental Stresses in the Era of Global Climate Change: An Update on ROS Stave off in Plants. Int. J. Mol. Sci. 2022, 23, 1995. [Google Scholar] [CrossRef]
  2. Krasowska, K.; Paszkowski, Z.W. The Need to Maintain Sustainability in the Dynamic Anthropogenic Changes in the Natural Landscape of the Bay of Pomerania in Poland. Sustainability 2023, 15, 1928. [Google Scholar] [CrossRef]
  3. Cowell, C.R.; Bullough, L.-A.; Dhanda, S.; Harrison Neves, V.; Ikin, E.; Moore, J.; Purdon, R.; Williams, C.; Willison, J.; Willoughby, S.J. Fortuitous Alignment: The Royal Botanic Gardens, Kew and the Sustainable Development Goals. Sustainability 2022, 14, 2366. [Google Scholar] [CrossRef]
  4. Lisner, A.; Konečná, M.; Blažek, P.; Lepš, J. Community biomass is driven by dominants and their characteristics—The insight from a field biodiversity experiment with realistic species loss scenario. J. Ecol. 2023, 111, 240–250. [Google Scholar] [CrossRef]
  5. Franklin, O.; Harrison, S.P.; Dewar, R.; Farrior, C.E.; Brännström, Å.; Dieckmann, U.; Pietsch, S.; Meron, E.; Schymanski, S.J.; Rovenskaya, E.; et al. Organizing principles for vegetation dynamics. Nat. Plants 2020, 6, 444–453. [Google Scholar] [CrossRef]
  6. De Pauw, K.; Meeussen, C.; Govaert, S.; Sanczuk, P.; Vanneste, T.; Bernhardt-Römermann, M.; De Frenne, P.; Bollmann, K.; Bollmann, J.; Calders, K.; et al. Taxonomic, phylogenetic and functional diversity of understorey plants respond differently to environmental conditions in European forest edges. J. Ecol. 2021, 109, 2629–2648. [Google Scholar] [CrossRef]
  7. Ivanova, N.; Petrova, I. Species abundance distributions: Investigation of adaptation mechanisms of plant communities. In E3S Web of Conferences; EDP Sciences: Hulis, France, 2021; Volume 254, p. 02003. [Google Scholar] [CrossRef]
  8. Zolotova, E.; Ivanova, N.; Ivanova, S. Global Overview of Modern Research Based on Ellenberg Indicator Values. Diversity 2023, 15, 14. [Google Scholar] [CrossRef]
  9. Dengler, J.; Jansen, F.; Chusova, O.; Hüllbusch, E.; Nobis, M.P.; Van Meerbeek, K.; Gillet, F. Ecological Indicator Values for Europe (EIVE) 1.0. Veg. Classif. Surv. 2023, 4, 7–29. [Google Scholar] [CrossRef]
  10. Ellenberg, H. Zeigerwerte der Gefässpflanzen Mitteleuropas. Scr. Geobot. 1974, 9, 1–166. [Google Scholar]
  11. Landolt, E. Okologische Zeigerwerts zur Sweizer Flora. Veroff. Geobot. Inst. ETH Zur. 1977, 64, 1–208. [Google Scholar]
  12. Ramensky, L.G.; Tsatsenkin, I.A.; Chizhikov, O.N.; Antipin, N.A. Ecological Assessment of Fodder Lands by Vegetation Cover; Sel’khozhiz: Moscow, Russia, 1956; pp. 1–472. [Google Scholar]
  13. Tsyganov, D.N. Phytoindication of Ecological Regimes in the Subzone of Coniferous-Deciduous Forests; Nauka: Moskow, Russia, 1983; 196p. [Google Scholar]
  14. Landolt, E.; Bäumler, B.; Erhardt, A.; Hegg, O.; Klötzli, F.; Lämmler, W.; Wohlgemuth, T. Flora indicative. In Ecological Indicator Values and Biological Attributes of the Flora of Switzerland and the Alps; Haupt-Verlag: Bern, Switzerland, 2010; 376p. [Google Scholar]
  15. Oksanen, J.; Blanchet, F.G.; Friendly, M.; Kindt, R.; Legendre, P.; Mcglinn, D.; Minchin, P.; O’hara, R.; Simpson, G.; Solymos, P.; et al. Vegan: Community Ecology Package. R package version 2.5-5. Available online: https://CRAN.R-project.org/package=vegan. Community Ecol. Package 2022, 2, 1–297. Available online: https://cran.r-project.org/web/packages/vegan/vegan.pdf (accessed on 30 March 2023).
  16. Kindt, R. Package ‘BiodiversityR’. Package for Community Ecology and Suitability Analysis; Version 2.15-1; World Agroforestry Centre (ICRAF): Nairobi, Kenya, 2023; pp. 1–178. Available online: https://cran.r-project.org/web/packages/BiodiversityR/BiodiversityR.pdf (accessed on 30 March 2023).
  17. Zubkova, E.V.; Khanina, L.G.; Grokhlina, T.I.; Dorogova, Y.A. Computer Processing of Geobotanical Descriptions on Ecological Scales Using the Program EcoScaleWin. Mar. State University; Pushchinsky State University: Yoshkar-Ola, Russia, 2008; pp. 1–96. [Google Scholar]
  18. Zverev, A. Methodological Aspects of Using Indicator Values in Biodiversity Analysis. Contemp. Probl. Ecol. 2020, 13, 321–332. [Google Scholar] [CrossRef]
  19. Reutimann, P.; Billeter, R.; Dengler, J. Effects of grazing versus mowing on the vegetation of wet grasslands in the northern Pre-Alps, Switzerland. Appl. Veg. Sci. 2023, 26, e12706. [Google Scholar] [CrossRef]
  20. Feldmeyer-Christe, E.; Ecker, K.; Küchler, M.; Graf, U.; Waser, L. Improving predictive mapping in Swiss mire ecosystems through re-calibration of indicator values. Appl. Veg. Sci. 2007, 10, 183–192. [Google Scholar] [CrossRef]
  21. Nakhutsrishvili, G.; Batsatsashvili, K.; Rudmann-Maurer, K.; Körner, C.; Spehn, E. New Indicator Values for Central Caucasus Flora. In Plant Diversity in the Central Great Caucasus: A Quantitative Assessment. Geobotany Studies; Nakhutsrishvili, G., Abdaladze, O., Batsatsashvili, K., Spehn, E., Körner, C., Eds.; Springer: Cham, Switzerland, 2017. [Google Scholar] [CrossRef]
  22. Mirkin, B.M.; Shirokikh, P.S.; Martynenko, V.B.; Naumova, L.G. Analysis of trends in the formation of species richness of plant communities using syntaxonomy and ecological scales. Russ. J. Ecol. 2010, 41, 279–283. [Google Scholar] [CrossRef]
  23. Ivchenko, T.G.; Znamenskiy, S.R. Ecological structure of plant communities on spring fens in the mountain taiga belt of the Southern Urals. Russ. J. Ecol. 2016, 7, 453–459. [Google Scholar] [CrossRef]
  24. Golovanov, Y.; Abramova, L. Database of anthropogenic vegetation of the Urals and adjacent territories. In BIO Web Conference; EDP Sciences: Hulis, France, 2021; Volume 38, p. 00037. [Google Scholar] [CrossRef]
  25. Shevchenko, N.; Geraskina, A. Structural and species diversity on North and South slopes in coniferous-deciduous forests of the North-Western Caucasus. Ecol. Quest. 2023, 34, 17–33. [Google Scholar] [CrossRef]
  26. Wildi, O. Why mean indicator values are not biased. J. Veg. Sci. 2016, 27, 40–49. [Google Scholar] [CrossRef]
  27. Anschlag, K.; Tatti, D.; Hellwig, N.; Sartori, G.; Gobat, J.-M.; Broll, G. Vegetation-based bioindication of humus forms in coniferous mountain forests. J. Mt. Sci. 2017, 14, 662–673. [Google Scholar] [CrossRef]
  28. Liberati, A.; Altman, D.G.; Tetzlaff, J.; Mulrow, C.; Gøtzsche, P.C.; Ioannidis, J.P.A.; Clarke, M.; Devereaux, P.J.; Kleijnen, J.; Moher, D. The PRISMA Statement for Reporting Systematic Reviews and Meta-Analyses of Studies That Evaluate Health Care Interventions: Explanation and Elaboration. PLoS Med. 2009, 6, e1000100. [Google Scholar] [CrossRef]
  29. Mengist, W.; Soromessa, T.; Legese, G. Method for conducting systematic literature review and meta-analysis for environ-mental science research. MethodsX 2020, 7, 100777. [Google Scholar] [CrossRef]
  30. Nobanee, H.; Al Hamadi, F.Y.; Abdulaziz, F.A.; Abukarsh, L.S.; Alqahtani, A.F.; AlSubaey, S.K.; Alqahtani, S.M.; Almansoori, H.A. A Bibliometric Analysis of Sustainability and Risk Management. Sustainability 2021, 13, 3277. [Google Scholar] [CrossRef]
  31. Okolie, C.C.; Danso-Abbeam, G.; Groupson-Paul, O.; Ogundeji, A.A. Climate-Smart Agriculture Amidst Climate Change to Enhance Agricultural Production: A Bibliometric Analysis. Land 2023, 12, 50. [Google Scholar] [CrossRef]
  32. Yang, K.; Thoo, A.C. Visualising the Knowledge Domain of Reverse Logistics and Sustainability Performance: Scientometric Mapping Based on VOSviewer and CiteSpace. Sustainability 2023, 15, 1105. [Google Scholar] [CrossRef]
  33. Waltman, L.; Van Eck, N.J. A new methodology for constructing a publication-level classification system of science. J. Am. Soc. Inf. Sci. Technol. 2012, 63, 2378–2392. [Google Scholar] [CrossRef] [Green Version]
  34. Waltman, L.; Van Eck, N.J. A smart local moving algorithm for large-scale modularity-based community detection. Eur. Phys. J. B 2013, 86, 471. [Google Scholar] [CrossRef]
  35. van Eck, N.J.; Waltman, L. Software survey: VOSviewer, a computer program for bibliometric mapping. Scientometrics 2010, 84, 523–538. [Google Scholar] [CrossRef] [Green Version]
  36. Boyack, K.W.; Klavans, R. Including cited non-source items in a large-scale map of science: What difference does it make? J. Informetr. 2014, 8, 569–580. [Google Scholar] [CrossRef]
  37. Small, H.; Boyack, K.W.; Klavans, R. Identifying emerging topics in science and technology. Res. Policy 2014, 43, 1450–1467. [Google Scholar] [CrossRef]
  38. Bódis, J.; Biro, E.; Nagy, T.; Takacs, A.; Molnár, V.A.; Lukács, B.A. Habitat preferences of the rare lizard-orchid Himantoglossum adriaticum H. Baumann= Habitatpräferenzen der seltenen Adria-Riemenzunge (Himantoglossum adriaticum H. Baumann). Tuexenia 2018, 38, 329–345. [Google Scholar] [CrossRef]
  39. Hruševar, D.; Siladi, P.; Justić, M.; Mitić, B. Vascular flora of a part of the planned Hrvatsko Zagorje regional park (Northwestern Croatia). Nat. Croat. 2018, 27, 271–292. [Google Scholar] [CrossRef]
  40. Tephnadze-Hoernchen, N.; Kikvidze, Z.; Nakhutsrishvili, G.; Abdaladze, O. Subalpine vegetation along the soil moisture gradient under the climate change conditions: Re-visitation approach (the Central Great Caucasus). Bocconea 2021, 29, 297–310. [Google Scholar] [CrossRef]
  41. Bystrova, D.; Poggiato, G.; Bektaş, B.; Arbel, J.; Clark, J.S.; Guglielmi, A.; Thuiller, W. Clustering species with residual covariance matrix in Joint Species Distribution models. Front. Ecol. Evol. 2021, 9, 601384. [Google Scholar] [CrossRef]
  42. Boch, S.; Küchler, H.; Küchler, M.; Bedolla, A.; Ecker, K.T.; Graf, U.H.; Moser, T.; Holderegger, R.; Bergamini, A. Observer-driven pseudoturnover in vegetation monitoring is context-dependent but does not affect ecological inference. Appl. Veg. Sci. 2022, 25, e12669. [Google Scholar] [CrossRef]
  43. Chauvier, Y.; Descombes, P.; Guéguen, M.; Boulangeat, L.; Thuiller, W.; Zimmermann, N.E. Resolution in species distribution models shapes spatial patterns of plant multifaceted diversity. Ecography 2022, 2022, e05973. [Google Scholar] [CrossRef]
  44. Scherrer, D.; Bürgi, M.; Gessler, A.; Kessler, M.; Nobis, M.P.; Wohlgemuth, T. Abundance changes of neophytes and native species indicate a thermophilisation and eutrophisation of the Swiss flora during the 20th century. Ecol. Indic. 2022, 135, 108558. [Google Scholar] [CrossRef]
  45. Margreiter, V.; Porro, F.; Mondoni, A.; Erschbamer, B. Recruitment Traits Could Influence Species’ Geographical Range: A Case Study in the Genus saxifraga L. Front. Plant Sci. 2022, 13, 827330. [Google Scholar] [CrossRef]
  46. Piccini, I.; Pittarello, M.; Di Pietro, V.; Lonati, M.; Bonelli, S. New Approach for Butterfly Conservation through Local Field-Based Vegetational and Entomological Data. Ecosphere 2022, 13, e4026. [Google Scholar] [CrossRef]
  47. Frei, E.R.; Moser, B.; Wohlgemuth, T. Competitive ability of natural Douglas fir regeneration in central European close-to-nature forests. For. Ecol. Manag. 2022, 503, 119767. [Google Scholar] [CrossRef]
  48. Geppert, C.; Perazza, G.; Wilson, R.J.; Bertolli, A.; Prosser, F.; Melchiori, G.; Marini, L. Consistent population declines but idiosyncratic range shifts in Alpine orchids under global change. Nat. Commun. 2020, 11, 5835. [Google Scholar] [CrossRef]
  49. Keller, S.; Babbi, M.; Widmer, S.; Gehler, J.; Hausmann, S.; Berg, C.; Landucci, F.; Schwager, P.; Šumberová, K.; Dengler, J. Determination of habitat requirements of the glacial relict Nuphar pumila as basis for successful (re-) introductions. Tuexenia 2020, 40, 309–326. [Google Scholar] [CrossRef]
  50. Salehi, M.; Walthert, L.; Zimmermann, S.; Waldner, P.; Schmitt, M.; Schleppi, P.; Liechti, K.; Ahmadi, M.; Zahedi Amiri, G.; Brunner, I.; et al. Leaf Morphological Traits and Leaf Nutrient Concentrations of European Beech Across a Water Availability Gradient in Switzerland. Front. For. Glob. Chang. 2020, 3, 19. [Google Scholar] [CrossRef]
  51. Klein, N.; Theux, C.; Arlettaz, R.; Jacot, A.; Pradervand, J.-N. Modeling the effects of grassland management intensity on biodiversity. Ecol. Evol. 2020, 10, 13518–13529. [Google Scholar] [CrossRef] [PubMed]
  52. van’t Veen, H.; Chalmandrier, L.; Sandau, N.; Nobis, M.P.; Descombes, P.; Psomas, A.; Hautier, Y.; Pellissier, L. A landscape-scale assessment of the relationship between grassland functioning, community diversity, and functional traits. Ecol. Evol. 2020, 10, 9906–9919. [Google Scholar] [CrossRef] [PubMed]
  53. Perotti, E.; Huguenin-Elie, O.; Meisser, M.; Dubois, S.; Probo, M.; Mariotte, P. Climatic, soil, and vegetation drivers of forage yield and quality differ across the first three growth cycles of intensively managed permanent grasslands. Eur. J. Agron. 2021, 122, 126194. [Google Scholar] [CrossRef]
  54. Boch, S.; Bedolla, A.; Ecker, K.T.; Graf, U.; Küchler, H.; Küchler, M.; Holderegger, M.; Bergamini, A. Mean indicator values suggest decreasing habitat quality in Swiss dry grasslands and are robust to relocation error. Tuexenia 2019, 39, 315–334. [Google Scholar] [CrossRef]
  55. Kammer, P.M.; Rihm, B.; Schöb, C. Decreasing nitrogen deposition rates: Good news for oligotrophic grassland species? Basic Appl. Ecol. 2022, 63, 25–138. [Google Scholar] [CrossRef]
  56. Rosbakh, S.; Poschlod, P. Plant community persistence strategy is elevation-specific. J. Veg. Sci. 2021, 32, e13028. [Google Scholar] [CrossRef]
  57. Ravetto Enri, S.; Petrella, F.; Ungaro, F.; Zavattaro, L.; Mainetti, A.; Lombardi, G.; Lonati, M. Relative Importance of Plant Species Composition and Environmental Factors in Affecting Soil Carbon Stocks of Alpine Pastures (NW Italy). Agriculture 2021, 11, 1047. [Google Scholar] [CrossRef]
  58. Colozza, F.; Fenoglio, E.; Barberis, D.; Lonati, M. A new association with Patzkea paniculata on serpentine substrates at low elevations in the western Alps (Italy). Plant Sociol. 2022, 59, 17–26. [Google Scholar] [CrossRef]
  59. Varricchione, M.; Carranza, M.L.; Di Cecco, V.; Di Martino, L.; Stanisci, A. Warmer and Poorer: The Fate of Alpine Calcareous Grasslands in Central Apennines (Italy). Diversity 2022, 14, 695. [Google Scholar] [CrossRef]
  60. Nicod, C.; Gillet, F. Recent changes in mountain hay meadows of high conservation value in eastern France. Appl. Veg. Sci. 2021, 24, e12573. [Google Scholar] [CrossRef]
  61. Svensk, M.; Pittarello, M.; Nota, G.; Schneider, M.K.; Allan, E.; Mariotte, P.; Probo, M. Spatial Distribution of Highland Cattle in Alnus viridis Encroached Subalpine Pastures. Front. Ecol. Evol. 2021, 9, 626599. [Google Scholar] [CrossRef]
  62. Kaltrina, R.; Kristi, B.; Dea, Z.; Lulezim, S.; René, H.; Jakob, S.; Reinhard, B. Alpine ecology, plant biodiversity and photosynthetic performance of marker plants in a nitrogen gradient induced by Alnus bushes. BMC Ecol. 2020, 20, 23. [Google Scholar] [CrossRef] [Green Version]
  63. Ivanova, N.V.; Smirnov, V.E.; Khanina, L.G.; Bobrovsky, M.V.; Shashkov, M.P. Changes in Vegetation and Earthworm Populations under Free Grazing European Bison (Bison bonasus) in Broad-Leaved Forests of the Kaluzhskie Zaseki State Nature Reserve. Biol. Bull. Russ. Acad. Sci. 2018, 45, 100–109. [Google Scholar] [CrossRef]
  64. Khanina, L.G.; Bobrovsky, M.V.; Zhmaylov, I.V. Vegetation diversity on the microsites caused by tree uprooting during a catastrophic windthrow in temperate broadleaved forests. Russ. J. Ecosyst. Ecol. 2019, 4, 1–17. [Google Scholar] [CrossRef] [Green Version]
  65. Khanina, L.; Bobrovsky, M. Value of large Quercus robur fallen logs in enhancing the species diversity of vascular plants in an old-growth mesic broad-leaved forest in the Central Russian Upland. For. Ecol. Manag. 2021, 491, 119172. [Google Scholar] [CrossRef]
  66. Staubli, E.; Dengler, J.; Billeter, R.; Wohlgemuth, T. Changes in biodiversity and species composition of temperate beech forests in Switzerland over 26 years. Tuexenia 2021, 41, 87–108. [Google Scholar] [CrossRef]
  67. Diaci, J.; Adamič, T.; Rozman, A.; Fidej, G.; Roženbergar, D. Conversion of Pinus nigra Plantations with Natural Regeneration in the Slovenian Karst: The Importance of Intermediate, Gradually Formed Canopy Gaps. Forests 2019, 10, 1136. [Google Scholar] [CrossRef] [Green Version]
  68. Diaci, J.; Rozman, J.; Rozman, A. Regeneration gap and microsite niche partitioning in a high alpine forest: Are Norway spruce seedlings more drought-tolerant than beech seedlings? For. Ecol. Manag. 2020, 455, 117688. [Google Scholar] [CrossRef]
  69. Smirnova, O.V.; Bobrovsky, M.V.; Khanina, L.G.; Smirnov, V.E.; Glukhova, E.M. Old-growth spruce-fir forests in the plain area of the Komi Republic. Russ. J. Ecosyst. Ecol. 2018, 3, 1–27. [Google Scholar] [CrossRef]
  70. Giupponi, L.; Borgonovo, G.; Leoni, V.; Zuccolo, M.; Battista Bischetti, G. Vegetation and water of lowland spring-wells in Po Plain (Northern Italy): Ecological features and management proposals. Wetl. Ecol. Manag. 2022, 30, 357–374. [Google Scholar] [CrossRef]
  71. Znamenskiy, S.; Ivchenko, T. From Mountains to Plains: Ecological Structure of the South Ural (Russia) Fen Vegetation. Wetlands 2018, 38, 1269–1283. [Google Scholar] [CrossRef]
  72. Ivchenko, T.G.; Znamenskiy, S.R. Main ecological-geographical factors of mire vegetation syntaxa differentiation in Southern Urals. IOP Conf. Ser. Earth Environ. Sci. 2022, 1093, 012015. [Google Scholar] [CrossRef]
  73. Graf, U.H.; Bergamini, A.; Bedolla, A.; Boch, S.; Küchler, H.; Küchler, M.; Ecker, K. Regeneration potential of a degraded alpine mountain bog: Complex regeneration patterns after grazing cessation and partial rewetting. Mires Peat 2022, 28, 24. [Google Scholar] [CrossRef]
  74. Fogliata, P.; Cislaghi, A.; Sala, P.; Giupponi, L. An ecological analysis of the riparian vegetation for improving the riverine ecosystem management: The case of Lombardy region (North Italy). Landsc. Ecol. Eng. 2021, 17, 375–386. [Google Scholar] [CrossRef]
  75. Jamin, A.; Peintinger, M.; Gimmi, U.; Holderegger, R.; Bergamini, A. Evidence for a possible extinction debt in Swiss wetland specialist plants. Ecol. Evol. 2020, 10, 1264–1277. [Google Scholar] [CrossRef] [Green Version]
  76. Kapfer, J.; Popova, K. Changes in subarctic vegetation after one century of land use and climate change. J. Veg. Sci. 2021, 32, e12854. [Google Scholar] [CrossRef] [Green Version]
  77. Lozbenev, N.; Smirnova, M.; Bocharnikov, M.; Kozlov, D. Digital Mapping of Habitat for Plant Communities Based on Soil Functions: A Case Study in the Virgin Forest-Steppe of Russia. Soil Syst. 2019, 3, 19. [Google Scholar] [CrossRef] [Green Version]
  78. Steinbauer, M.J.; Grytnes, J.A.; Jurasinski, G.; Kulonen, A.; Lenoir, J.; Pauli, H.; Rixen, C.; Winkler, M.; Bardy-Durchhalter, M.; Barni, E.; et al. Accelerated increase in plant species richness on mountain summits is linked to warming. Nature 2018, 556, 231–234. [Google Scholar] [CrossRef] [Green Version]
  79. Scotton, M.; Andreatta, D. Anti-erosion rehabilitation: Effects of revegetation method and site traits on introduced and native plant cover and richness. Sci. Total Environ. 2021, 776, 145915. [Google Scholar] [CrossRef] [PubMed]
  80. Scotton, M. Calcareous grassland restoration at a coarse quarry waste dump in the Italian Alps. Ecol. Eng. 2018, 117, 174–181. [Google Scholar] [CrossRef]
  81. Kempel, A.; Bornand, C.N.; Gygax, A.; Juillerat, P.; Jutzi, M.; Sager, L.; Bäumler, B.; Eggenberg, S.; Fischer, M. Nationwide revisitation reveals thousands of local extinctions across the ranges of 713 threatened and rare plant species. Conserv. Lett. 2020, 13, e12749. [Google Scholar] [CrossRef]
  82. Büttner, M.; Weibel, U.; Jutzi, M.; Bergamini, A.; Holderegger, R. A 150-year-old herbarium and floristic data testify regional species decline. Biol. Conserv. 2022, 272, 109609. [Google Scholar] [CrossRef]
  83. Lamprecht, A.; Semenchuk, P.R.; Steinbauer, K.; Winkler, M.; Pauli, H. Climate change leads to accelerated transformation of high-elevation vegetation in the central Alps. New Phytol. 2018, 220, 447–459. [Google Scholar] [CrossRef]
  84. Liberati, L.; Messerli, S.; Matteodo, M.; Vittoz, P. Contrasting impacts of climate change on the vegetation of windy ridges and snowbeds in the Swiss Alps. Alp. Bot. 2019, 129, 95–105. [Google Scholar] [CrossRef]
  85. Fidej, G.; Rozman, A.; Diaci, J. Drivers of regeneration dynamics following salvage logging and different silvicultural treatments in windthrow areas in Slovenia. For. Ecol. Manag. 2018, 409, 378–389. [Google Scholar] [CrossRef] [Green Version]
  86. Resch, M.C.; Schütz, M.; Graf, U.; Wagenaar, R.; van der Putten, W.H.; Risch, A.C. Does topsoil removal in grassland restoration benefit both soil nematode and plant communities? J. Appl. Ecol. 2019, 56, 1782–1793. [Google Scholar] [CrossRef]
  87. Pittarello, M.; Probo, M.; Perotti, E.; Lonati, M.; Lombardi, G.; Ravetto, E. Grazing Management Plans improve pasture selection by cattle and forage quality in sub-alpine and alpine grasslands. J. Mt. Sci. 2019, 16, 2126–2135. [Google Scholar] [CrossRef]
  88. Pittarello, M.; Lonati, M.; Ravetto Enri, S.; Lombardi, G. Environmental factors and management intensity affect in different ways plant diversity and pastoral value of alpine pastures. Ecol. Indic. 2020, 115, 106429. [Google Scholar] [CrossRef]
  89. Ravetto Enri, S.; Nucera, E.; Lonati, M.; Francesco Alberto, P.; Probo, M. The Biodiversity Promotion Areas: Effectiveness of agricultural direct payments on plant diversity conservation in the semi-natural grasslands of the Southern Swiss Alps. Biodivers. Conserv. 2020, 29, 4155–4172. [Google Scholar] [CrossRef]
  90. Fernández, L.D.; Seppey, C.V.W.; Singer, D.; Fournier, B.; Tatti, D.; Mitchell, E.A.D.; Lara, E. Niche Conservatism Drives the Elevational Diversity Gradient in Major Groups of Free-Living Soil Unicellular Eukaryotes. Microb. Ecol. 2022, 83, 459–469. [Google Scholar] [CrossRef] [PubMed]
  91. von Büren, R.S.; Hiltbrunner, E. Low winter temperatures and divergent freezing resistance set the cold range limit of widespread alpine graminoids. J. Biogeogr. 2022, 49, 1562–1575. [Google Scholar] [CrossRef]
  92. Hellegers, M.; Ozinga, W.A.; Hinsberg, A.; van Huijbregts, M.A.J.; Hennekens, S.M.; Schaminée, J.H.J.; Dengler, J.; Schipper, A.M. Evaluating the ecological realism of plant species distribution models with ecological indicator values. Ecography 2020, 43, 161–170. [Google Scholar] [CrossRef]
  93. Rosbakh, S.; Pichler, M.; Poschlod, P. Machine-learning algorithms predict soil seed bank persistence from easily available traits. Appl. Veg. Sci. 2022, 25, e12660. [Google Scholar] [CrossRef]
  94. Weber, D.; Schaepman-Strub, G.; Ecker, K. Predicting habitat quality of protected dry grasslands using Landsat NDVI phenology. Ecol. Indic. 2018, 91, 447–460. [Google Scholar] [CrossRef]
  95. Zellweger, F.; Baltensweiler, A.; Schleppi, P.; Huberet, M.; Küchler, M.; Ginzler, C.; Jonas, T. Estimating below-canopy light regimes using airborne laser scanning: An application to plant community analysis. Ecol. Evol. 2019, 9, 9149–9159. [Google Scholar] [CrossRef] [Green Version]
  96. Saatkamp, A.; Falzon, N.; Argagnon, O.; Noble, V.; Dutoit, T.; Meineri, E. Calibrating ecological indicator values and niche width for a Mediterranean flora. Plant Biosyst. 2022, 157, 301–311. [Google Scholar] [CrossRef]
  97. Bertel, C.; Rešetnik, I.; Frajman, B.; Erschbamer, B.; Hülber, K.; Schönswetter, P. Natural selection drives parallel divergence in the mountain plant Heliosperma pusillum s.l. Oikos 2018, 127, 1355–1367. [Google Scholar] [CrossRef]
  98. Lasen, C.; Tomaselli, M.; Scariot, A.; Garlato, A.; Carbognani, M. Floristic composition, site conditions and diversity of poet’s daffodil (Narcissus radiiflorus Salisb.) hay meadows in the Venetian Pre-Alps and outer Dolomites (N-Italy): Implications for conservation and restoration. Plant Biosyst. 2018, 152, 1236–1247. [Google Scholar] [CrossRef]
  99. Roth, T.; Kohli, L.; Bühler, C.; Rihm, B.; Meuli, R.G.; Meier, R.; Amrhein, V. Species turnover reveals hidden effects of decreasing nitrogen deposition in mountain hay meadows. PeerJ 2019, 7, e6347. [Google Scholar] [CrossRef] [PubMed]
  100. Durrer, B.; Perritaz, E.; Catalano, C. Designing for biodiversity: Conceptualization of a sustainable building envelope for a single-family house in Switzerland. Proceeding of the 14th Ecocity World Summit, Rotterdam, The Netherlands, 22–24 February 2022; Ecocity Builders: Oakland, CA, USA, 2022; pp. 157–169. [Google Scholar] [CrossRef]
  101. Catalano, C.; Pasta, S.; Guarino, R. A Plant Sociological Procedure for the Ecological Design and Enhancement of Urban Green Infrastructure. In Urban Services to Ecosystems; Catalano, C., Andreucci, M.B., Guarino, R., Bretzel, F., Leone, M., Pasta, S., Eds.; Future City; Springer: Cham, Switzerland, 2021; Volume 17. [Google Scholar] [CrossRef]
  102. Scherrer, D.; Guisan, A. Ecological indicator values reveal missing predictors of species distributions. Sci. Rep. 2019, 9, 3061. [Google Scholar] [CrossRef] [Green Version]
  103. Descombes, P.; Walthert, L.; Baltensweiler, A.; Meuli, R.G.; Karger, D.N.; Ginzler, C.; Zurell, D.; Zimmermann, N.E. Spatial modelling of ecological indicator values improves predictions of plant distributions in complex landscapes. Ecography 2020, 43, 1448–1463. [Google Scholar] [CrossRef]
  104. Rumpf, S.B.; Hülber, K.; Wessely, J.; Willner, W.; Moser, D.; Gattringer, A.; Klonner, G.; Zimmermann, N.E.; Dullinger, S. Extinction debts and colonization credits of non-forest plants in the European Alps. Nat. Commun. 2019, 10, 4293. [Google Scholar] [CrossRef] [PubMed] [Green Version]
  105. Kulonen, A.; Imboden, R.A.; Rixen, C.; Maier, S.B.; Wipf, S. Enough space in a warmer world? Microhabitat diversity and small-scale distribution of alpine plants on mountain summits. Divers. Distrib. 2018, 24, 252–261. [Google Scholar] [CrossRef] [Green Version]
  106. Frate, L.; Carranza, M.L.; Evangelista, A.; Stinca, A.; Schaminée, J.H.J.; Stanisci, A. Climate and land use change impacts on mediterranean high-mountain vegetation in the apennines since the 1950s. Plant Ecol. Divers. 2018, 11, 85–96. [Google Scholar] [CrossRef]
  107. Chardon, N.I.; Wipf, S.; Rixen, C.; Beilstein, A.; Doak, D.F. Local trampling disturbance effects on alpine plant populations and communities: Negative implications for climate change vulnerability. Ecol. Evol. 2018, 8, 7921–7935. [Google Scholar] [CrossRef] [Green Version]
  108. Stumpf, F.; Schneider, M.K.; Keller, A.; Mayr, A.; Rentschler, T.; Meuli, R.G.; Schaepman, M.; Liebisch, F. Spatial monitoring of grassland management using multi-temporal satellite imagery. Ecol. Indic. 2020, 113, 106201. [Google Scholar] [CrossRef]
  109. Dalle Fratte, M.; Brusa, G.; Pierce, S.; Zanzottera, M.; Cerabolini, B.E.L. Plant trait variation along environmental indicators to infer global change impacts. Flora Morphol. Distrib. Funct. Ecol. Plants 2019, 254, 113–121. [Google Scholar] [CrossRef]
  110. Pittarello, M.; Lonati, M.; Gorlier, A.; Perotti, E.; Probo, M.; Lombardi, G. Plant diversity and pastoral value in alpine pastures are maximized at different nutrient indicator values. Ecol. Indic. 2018, 85, 518–524. [Google Scholar] [CrossRef]
  111. Perotti, E.; Probo, M.; Pittarello, M.; Lonati, M.; Lombardi, G. A 5-year rotational grazing changes the botanical composition of sub-alpine and alpine grasslands. Appl. Veg. Sci. 2018, 21, 647–657. [Google Scholar] [CrossRef]
  112. Bucher, S.F.; Rosbakh, S. Foliar summer frost resistance measured via electrolyte leakage approach as related to plant distribution, community composition and plant traits. Funct. Ecol. 2021, 35, 590–600. [Google Scholar] [CrossRef]
  113. Feoli, E.; Ganis, P. The Use of the Evenness of Eigenvalues of Similarity Matrices to Test for Predictivity of Ecosystem Classifications. Mathematics 2019, 7, 245. [Google Scholar] [CrossRef] [Green Version]
  114. Matteodo, M.; Grand, S.; Sebag, D.; Rowley, M.C.; Vittoz, P.; Verrecchia, E.P. Decoupling of topsoil and subsoil controls on organic matter dynamics in the Swiss Alps. Geoderma 2018, 330, 41–51. [Google Scholar] [CrossRef]
  115. Adamo, M.; Chialva, M.; Calevo, J.; Bertoni, F.; Dixon, K.; Mammola, S. Plant scientists’ research attention is skewed towards colourful, conspicuous and broadly distributed flowers. Nat. Plants 2021, 7, 574–578. [Google Scholar] [CrossRef] [PubMed]
  116. Ivanova, N.; Tantsyrev, N.; Li, G. Regeneration of Pinus sibirica Du Tour in the Mountain Tundra of the Northern Urals against the Background of Climate Warming. Atmosphere 2022, 13, 1196. [Google Scholar] [CrossRef]
  117. Fomin, V.; Mikhailovich, A.; Golikov, D.; Agapitov, E. Reconstruction of the Expansion of Siberian Larch into the Mountain Tundra in the Polar Urals in the 20th—Early 21st Centuries. Forests 2022, 13, 419. [Google Scholar] [CrossRef]
  118. Peterson, A.T. Ecological niche conservatism: A time-structured review of evidence. J. Biogeogr. 2011, 38, 817–827. [Google Scholar] [CrossRef]
  119. Owens, H.L.; Ribeiro, V.; Saupe, E.E.; Cobos, M.E.; Hosner, P.A.; Cooper, J.C.; Samy, A.M.; Barve, V.; Barve, N.; Muñoz-R, C.J.; et al. Acknowledging uncertainty in evolutionary reconstructions of ecological niches. Ecol. Evol. 2020, 10, 6967–6977. [Google Scholar] [CrossRef]
  120. Zolotova, E.; Ryabinin, V. Elements Distribution in Soil and Plants of an Old Copper Slag Dump in the Middle Urals, Russia. Ecol. Quest. 2019, 30, 41–47. [Google Scholar] [CrossRef] [Green Version]
  121. Miler, M.; Bavec, Š.; Gosar, M. The environmental impact of historical Pb-Zn mining waste deposits in Slovenia. J. Environ. Manag. 2022, 308, 114580. [Google Scholar] [CrossRef] [PubMed]
Figure 1. Schematic diagram of the research analysis.
Sustainability 15 09618 g001
Figure 2. Distribution of the number of studies using Landolt indicator values by year.
Sustainability 15 09618 g002
Figure 3. Relationships between papers based on references: (a)—general view of relationship network map; (b)—enlarged central fragment of the relationship network map; steinbauer (2018)—[78]; scotton (2018)—[80]; resch (2019)—[86]; khanina (2021)—[65]; margreiter (2022)—[45]; ivanova (2018)—[63]; znamenskiy (2018)—[71]; ivchenko (2022)—[72]; scotton (2021)—[79]; bertel (2018)—[97]; scherrer (2019)—[102]; diaci (2020)—[68]; ravetto enri (2021)—[57]; svensk (2021)—[61]; piccini (2022)—[46]; perotti (2021)—[53]; frei (2022)—[47]; colozza (2022)—[58]; kempel (2020b)—[81]; bystrova (2021)—[41]; weber (2018)—[94]; golovanov (2021)—[24]; giupponi (2022)—[70]; fogliata (2021)—[74]; büttner (2022)—[82].
Sustainability 15 09618 g003
Figure 4. Authors’ contribution to research based on Landolt indicator values by the number of papers published over the past 5 years.
Sustainability 15 09618 g004
Figure 5. Authors’ citation analysis.
Sustainability 15 09618 g005
Figure 6. Co-authorship analysis.
Sustainability 15 09618 g006
Table 1. Top 5 countries by the number of conducted studies based on Landolt indicator values over the past 5 years.
CountryNumber of Studies
Switzerland39
Italy21
Russia10
Austria7
Slovenia5
Table 2. Main types of plant communities studied using Landolt indicator values over the past five years.
Plant CommunitiesNumber of PapersPercentage of Total Number of Papers
Meadows, grassland3134%
Forest1112%
Plant communities of the spring-well beds, bog, riparian vegetation67%
Plant communities on steep slopes, mountain summits, quarries, a coarse quarry waste dump67%
Urban plantings, landscaping22%
Table 3. Main directions of studies conducted over the past 5 years based on Landolt indicator values.
Research DirectionsNumber of Studies
Assessment of vegetation dynamics,
influence of various factors on plants
48
Analysis of growing conditions, ecological niches16
Improving ecosystem assessment methodologies13
Ecology of individual species3
Determination of ecological groups of species, vegetation classification and ordination of plant communities according to environmental factors3
Effect of nitrogen deposition on vegetation3
Table 4. Papers having the least similarity with other publications.
Authors, YearCountryResearch TopicsJournalNumber of Citations
Ivanova et al., 2018 [63]RussiaChanges in vegetation and earthworm populations under free-grazing European bisonBiology Bulletin3
Ivchenko, Znamenskiy, 2022 [72]RussiaMire vegetation syntaxa differentiation in the Southern UralsIOP Conf. Ser.: Earth Environ. Sci.0
Znamenskiy, Ivchenko, 2018 [71]RussiaFen vegetation of the Southern UralWetlands1
Bertel et al., 2018 [97]Austria
Croatia
Mountain plant Heliosperma pusillumOikos12
Feoli, Ganis, 2019 [113]ItalyTest for predictivity of ecosystem classificationsMathematics1
Table 5. Top 15 papers based on Landolt indicator values by the number of citations over the past 5 years.
Authors, YearCountryResearch TopicsJournalNumber of Citations
Steinbauer et al., 2018 [78]Germany, Norway, Switzerland, France, Austria,
Italy, Poland, Norway, Spain, Denmark, UK, Slovakia
Climate change and vegetation change in mountain regionsNature408
Lamprecht et al., 2018 [83]Austria Climate change and vegetation change in mountain regionsNew Phytologist94
Rumpf et al., 2019 [104]Austria, SwitzerlandClimate change and vegetation change in mountain regionsNature Communications38
Weber et al., 2018 [94]SwitzerlandPredicting habitat quality of grasslandsEcological Indicators35
Scherrer, Guisan, 2019 [102]SwitzerlandPredictors of species distributionsScientific Reports31
Kulonen et al., 2018 [105]SwitzerlandMicrohabitat diversity and small-scale distribution of alpine plants on mountain summitsDiversity and Distributions28
Stumpf et al., 2020 [108]Switzerland, Austria, GermanySpatial monitoring of grasslandsEcological Indicators27
Frate et al., 2018 [106]Italia, NetherlandsClimate change and vegetation change in mountain regionsPlant Ecology & Diversity25
Matteodo et al., 2018 [114]SwitzerlandOrganic matter dynamicsGeoderma22
Adamo et al., 2021 [115]Italy, Germany, Australia, FinlandColorful, conspicuous and broadly distributed flowersNature Plants17
Descombes et al., 2020 [103]SwitzerlandSpatial modelling of ecological indicator valuesEcography17
Resch et al., 2019 [86]Switzerland, NetherlandsTopsoil removal. Restoration of semi-natural grasslandsJournal of Applied Ecology17
Liberati et al., 2019 [84]SwitzerlandClimate change and vegetation change in mountain regionsAlpine Botany16
Zellweger et al., 2019 [95]SwitzerlandEstimating below-canopy light regimesEcology and Evolution16
Pittarello et al., 2018 [110]ItalyPlant diversity and nutrient indicator valuesEcological Indicators15
Table 6. Top 15 journals by the number of citations and papers based on Landolt indicator values over the past 5 years.
JournalNumber of PapersNumber of Citations
Nature1408
New Phytologist194
Ecological Indicators593
Nature Communications251
Ecology and Evolution550
Diversity and Distributions232
Scientific Reports131
Ecography327
Forest Ecology and Management426
Plant Ecology & Diversity125
Geoderma122
Journal of Applied Ecology217
Nature Plants117
Alpine Botany116
Applied Vegetation Science514
Disclaimer/Publisher’s Note: The statements, opinions and data contained in all publications are solely those of the individual author(s) and contributor(s) and not of MDPI and/or the editor(s). MDPI and/or the editor(s) disclaim responsibility for any injury to people or property resulting from any ideas, methods, instructions or products referred to in the content.

