Article

Research of Metro Stations with Varying Patterns of Ridership and Their Relationship with Built Environment, on the Example of Tianjin, China

1
School of Architecture, Tianjin University, Tianjin 300072, China
2
School of Urban Design, Wuhan University, Wuhan 430072, China
3
School of Architecture and Urban Planning, Shandong Jianzhu University, Jinan 250101, China
*
Authors to whom correspondence should be addressed.
These authors contributed equally to this work.
Sustainability 2023, 15(12), 9533; https://doi.org/10.3390/su15129533
Submission received: 30 April 2023 / Revised: 2 June 2023 / Accepted: 12 June 2023 / Published: 14 June 2023
(This article belongs to the Special Issue The Interactions between Urban Populations and Their Environments)

Abstract

:
The metro station ridership features are associated significantly with the built environment factors of the pedestrian catchment area surrounding metro stations. The existing studies have focused on the impact on total ridership at metro stations, ignoring the impact on varying patterns of metro station ridership. Therefore, the reasonable identification of metro station categories and built environment factors affecting the varying patterns of ridership in different categories of stations is very important for metro construction. In this study, we developed a data-driven framework to examine the relationship between varying patterns of metro station ridership and built environment factors in these areas. By leveraging smart card data, we extracted the dynamic characteristics of ridership and utilized hierarchical clustering and K-means clustering to identify diverse patterns of metro station ridership, and we finally identified six main ridership patterns. We then developed a newly built environment measurement framework and adopted multinomial logistic regression analysis to explore the association between ridership patterns and built environment factors. (1) The clustering analysis results revealed that six station types were classified based on varying patterns of passenger flow, representing distinct functional characteristics. (2) The regression analysis indicated that diversity, density, and location factors were significantly associated with most station function types, while destination accessibility was only positively associated with employment-oriented type stations, and centrality was only associated with employment-oriented hybrid type station. The research results could inform the spatial planning and design around metro stations and the planning and design of metro systems. The built environment of pedestrian catchment areas surrounding metro stations can be enhanced through rational land use planning and the appropriate allocation of urban infrastructure and public service facilities.

1. Introduction

As a crucial component of the urban public transportation system, the metro system boasts the advantages of superior efficiency, eco-friendliness and exceptional capacity. Prioritizing the development of metro systems as the primary mode of public transportation can effectively solve “big city problems” such as environmental pollution, carbon emissions, and traffic congestion. This approach promotes sustainable and healthy travel for residents while achieving sustainable urban development [1,2,3]. In recent decades, Transit-oriented development (TOD) has gradually become a cutting-edge model for urban community planning and a new direction for urban sustainable development. TOD could establish efficient linkages with public transportation and land use, enhance the operational efficiency of public transportation, and facilitate sustainable and coordinated development of urban transport and urban spatial layout [4]. However, there still exists the phenomenon of the uncoordinated degree of integration between urban rail transit hubs and urban functional areas in the process of urban development, causing a series of problems such as excessive flow during peak periods, unbalanced ridership at incoming and outgoing stations, and an unbalanced distribution of ridership [5,6]. The varying patterns of metro station ridership have a strong correlation with the built environment factors of the pedestrian catchment area surrounding metro stations [7,8], and the different types of metro stations with varying patterns of ridership are spatially heterogeneous due to the driving effect of built environment factors. In this context, this study classifies the stations based on the varying patterns of metro station ridership and clarifies the supply and demand situation and functional features of different types of metro stations. We further investigate the influence of built environment factors on different types of metro stations and identify the strategies for optimizing the built environment of different types of metro stations. This research investigated the impact of built environment features on passenger travel patterns and proposed an integrated urban renewal strategy that coordinates urban planning with metro system planning. This was aimed at improving the spatial vitality of pedestrian catchment areas around these stations and enhancing the operational efficiency of the metro system, ultimately contributing to sustainable development of urban public transportation [9].
The intricate relationship between metro station ridership and built environment factors has garnered significant attention from scholars in recent years. The advent of smart card data and open-source databases has facilitated the examination of this relationship through big data analysis. However, most studies have focused on the total ridership of metro stations [10,11], overlooking the different ridership patterns of stations. Additionally, some important factors, such as station centrality and location value have been ignored when evaluating the relationship between metro station ridership and built environment factors. In this context, this study aimed to bridge research gaps by investigating the relationship between the varying patterns of metro station ridership and built environment factors based on smart card data in Tianjin, China. There are two crucial questions in the present study: (1) What are the types of metro stations based on varying patterns of ridership and what are their distinctive characteristics? (2) What is the association between the varying patterns of metro station ridership and built environment factors? The answers to these questions can offer valuable insights for rail transit planning and urban renewal.
The remaining sections are structured as follows. Section 2 provides a review of the related literature, including identifying the varying patterns of metro station ridership, the evaluation dimensions of built environment factors, and the relationship between metro station ridership and built environment. In Section 3, the methodology and smart card data used in this study are presented. The results of the study are analyzed in Section 4. Finally, Section 5 provides discussions based on these findings.

2. Literature Review

2.1. Identification of the Varying Patterns of Metro Station Ridership

The role of mobility in shaping urban morphology and function partition has been recognized by urban scholars [12]. Smart card data, containing detailed information on passenger trip transactions, has been utilized to investigate resident trip characteristics and to describe transportation supply and demand [13], providing strategies for public transportation system operation and management [14]. The dynamic features of ridership in smart card data have been analyzed using clustering methods to identify the varying patterns of metro station ridership [15,16]. For example, researchers have adopted methods such as K-means clustering, two-stage clustering, and self-organizing maps (SOM) to classify metro stations [17,18,19]. Among these methods, K-means clustering was one of the most widely used clustering methods due to its high computational efficiency and interpretability [17]. However, the K-means method cannot effectively choose the initial K value. To address this issue, we developed a new method that combines hierarchical clustering with K-means clustering to classify the different patterns of metro station passengers.

2.2. Measurements of Built Environment Factors

Studies have shown that built environment factors have a significantly heterogeneous impact on metro station ridership [20]. The ‘3Ds’ framework developed by Cervero and Kockelman was widely used to describe built environment factors, namely diversity, density, and design [21]. Among them, diversity includes indicators such as land-use mix entropy, percentage of land use type, and POI functional mix; density usually includes indicators such as population density, employment density, and floor area ratio; and design usually includes road network density and intersection density. Ewing and Cervero later expanded the framework to include distance to transit and destination accessibility, forming the “5Ds” framework [22], which has been widely used for its effectiveness in TOD studies [23,24]. Moreover, new indicators have been gradually introduced into the “5Ds” framework as the research deepens, including fine-scale land use types [25], architectural features [26], and street tree inventory [27].
In terms of evaluating the built environment of metro station areas, some researchers also utilized complex networks theory and location theory to investigate the spatial characteristics of metro networks [28,29], and the commonly adopted indicators include network betweenness centrality, network closeness centrality, and location value. In order to provide a comprehensive evaluation of the built environment’s impact on the varying patterns of metro station ridership, this study introduced the centrality and location factors to form the “5D + C + L” framework.

2.3. Association between Metro Station Ridership and Built Environment

In recent years, several studies have analyzed built environment factors affecting metro station ridership [30,31,32,33]. Most studies focused on investigating the association between built environment factors and the total ridership of metro stations. For example, the dependent variables in previous studies usually contained average daily inbound and outbound ridership [30], morning-peak and evening-peak ridership on weekdays [31], average weekday boardings [32], and station-to-station ridership [33]. These studies usually adopted global or local regression models to analyze the multiple linear regression relationship between built environment factors and total ridership of metro stations [34,35,36,37,38,39]. For example, in terms of global regression model applications, Loo [34] utilized the Ordinary least squares (OLS) model to investigate the influencing factors of rail transit ridership in New York City and Hong Kong, and Sohn [35] utilized the Structural equation model (SEM) to investigate the influencing factors of rail transit ridership in the Seoul metropolitan area. In terms of local regression model applications, Zhou [38] utilized the Multiscale geographically weighted regression (MGWR) model to investigate the spatial heterogeneity of built environment factors on “bike-subway scenario” usage, while Fu [37] and Liu [39] utilized the Geographically and temporally weighted regression (GTWR) model to explore the spatiotemporal heterogeneity of metro ridership by built environment factors.
Overall, existing studies mainly investigated metro station ridership as a continuous variable, lacking investigation of the relationship between the varying patterns of ridership and built environment factors. To fill this gap, we adopted multinomial logistic regression analysis in this study to explore the association between the varying patterns of metro station ridership and built environment factors.

3. Materials and Methods
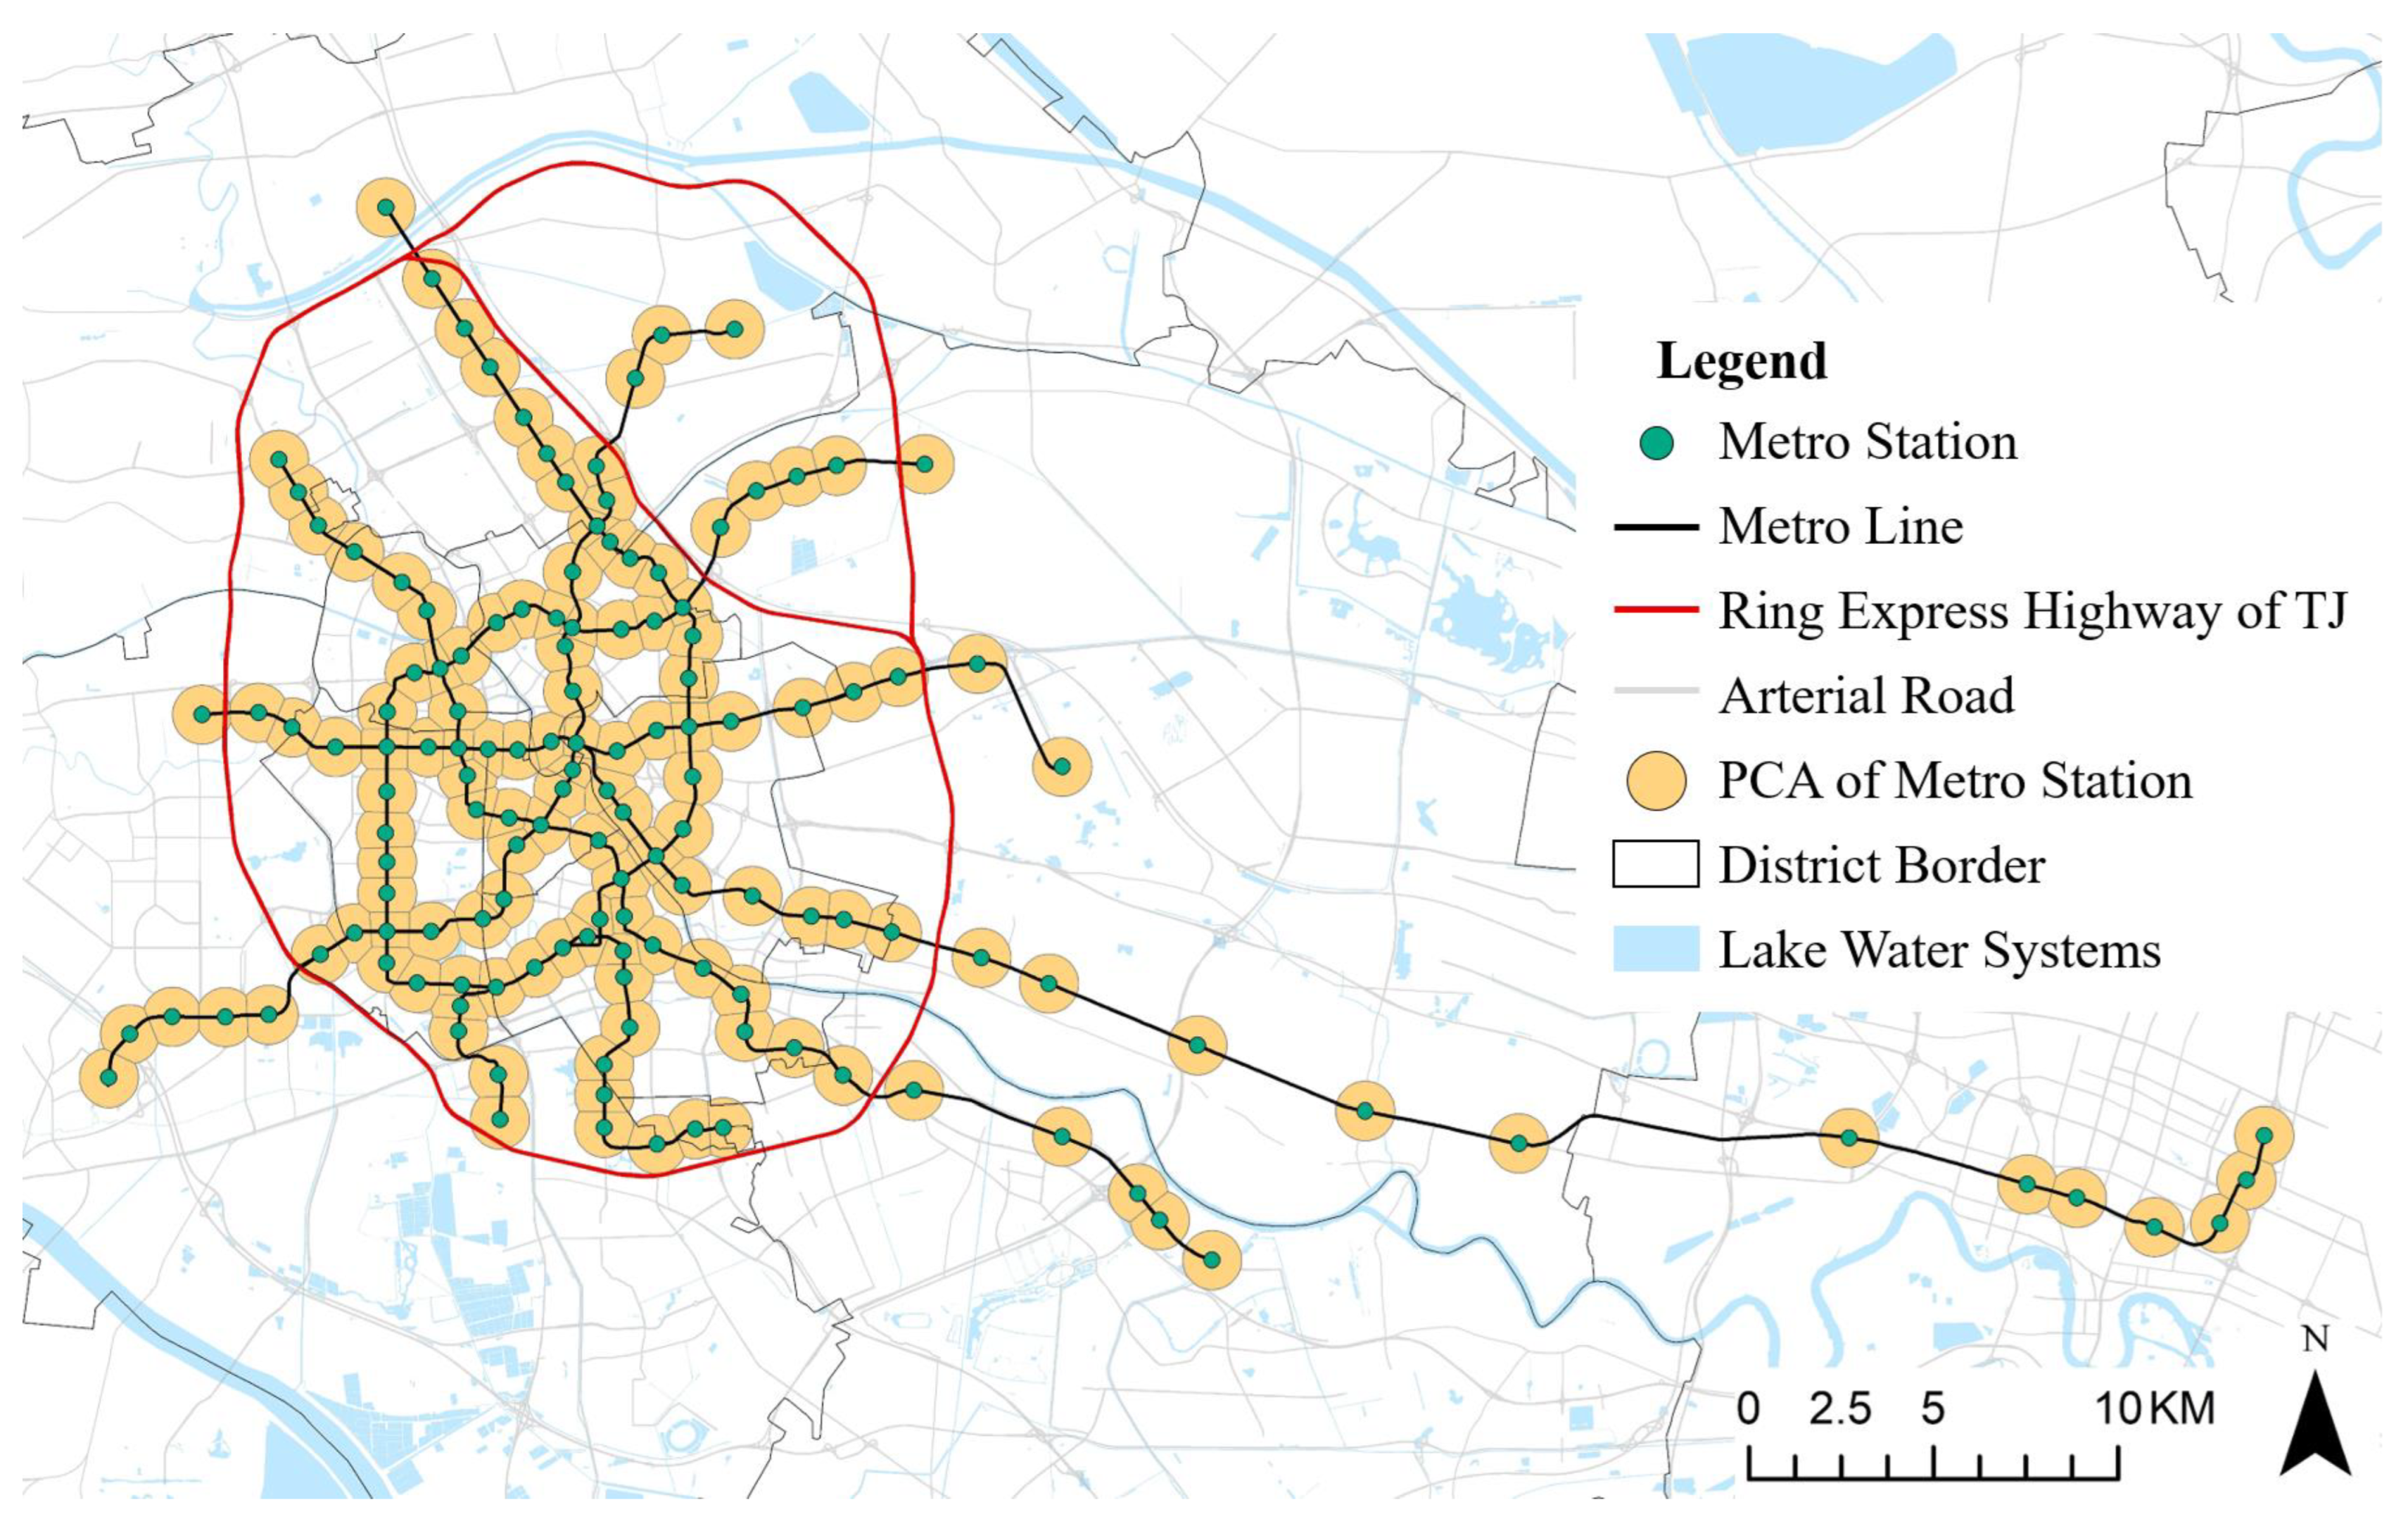
3.1. Study Area

The study area for this research is Tianjin, one of the four municipalities directly under the Central Government of China, covering a total area of 1100 km2 and having a resident population of more than 13 million. Tianjin’s metro system was established in 1970, making it the second Chinese city to build a metro system after Beijing. As of December 2020, the Tianjin metro system had six lines and 143 operational stations.
In previous studies, researchers usually utilized an 800 m buffer zone as the pedestrian catchment area (PCA) of metro stations [32]. However, the 800 m distance could result in overlapping catchment areas, especially in the central urban area. To resolve this issue, the Thiessen polygon method was adopted [31], as illustrated in Figure 1, to define the pedestrian catchment areas (PCA) of metro stations without any overlap. The study area’s relevant built environment factors were assessed within this range.

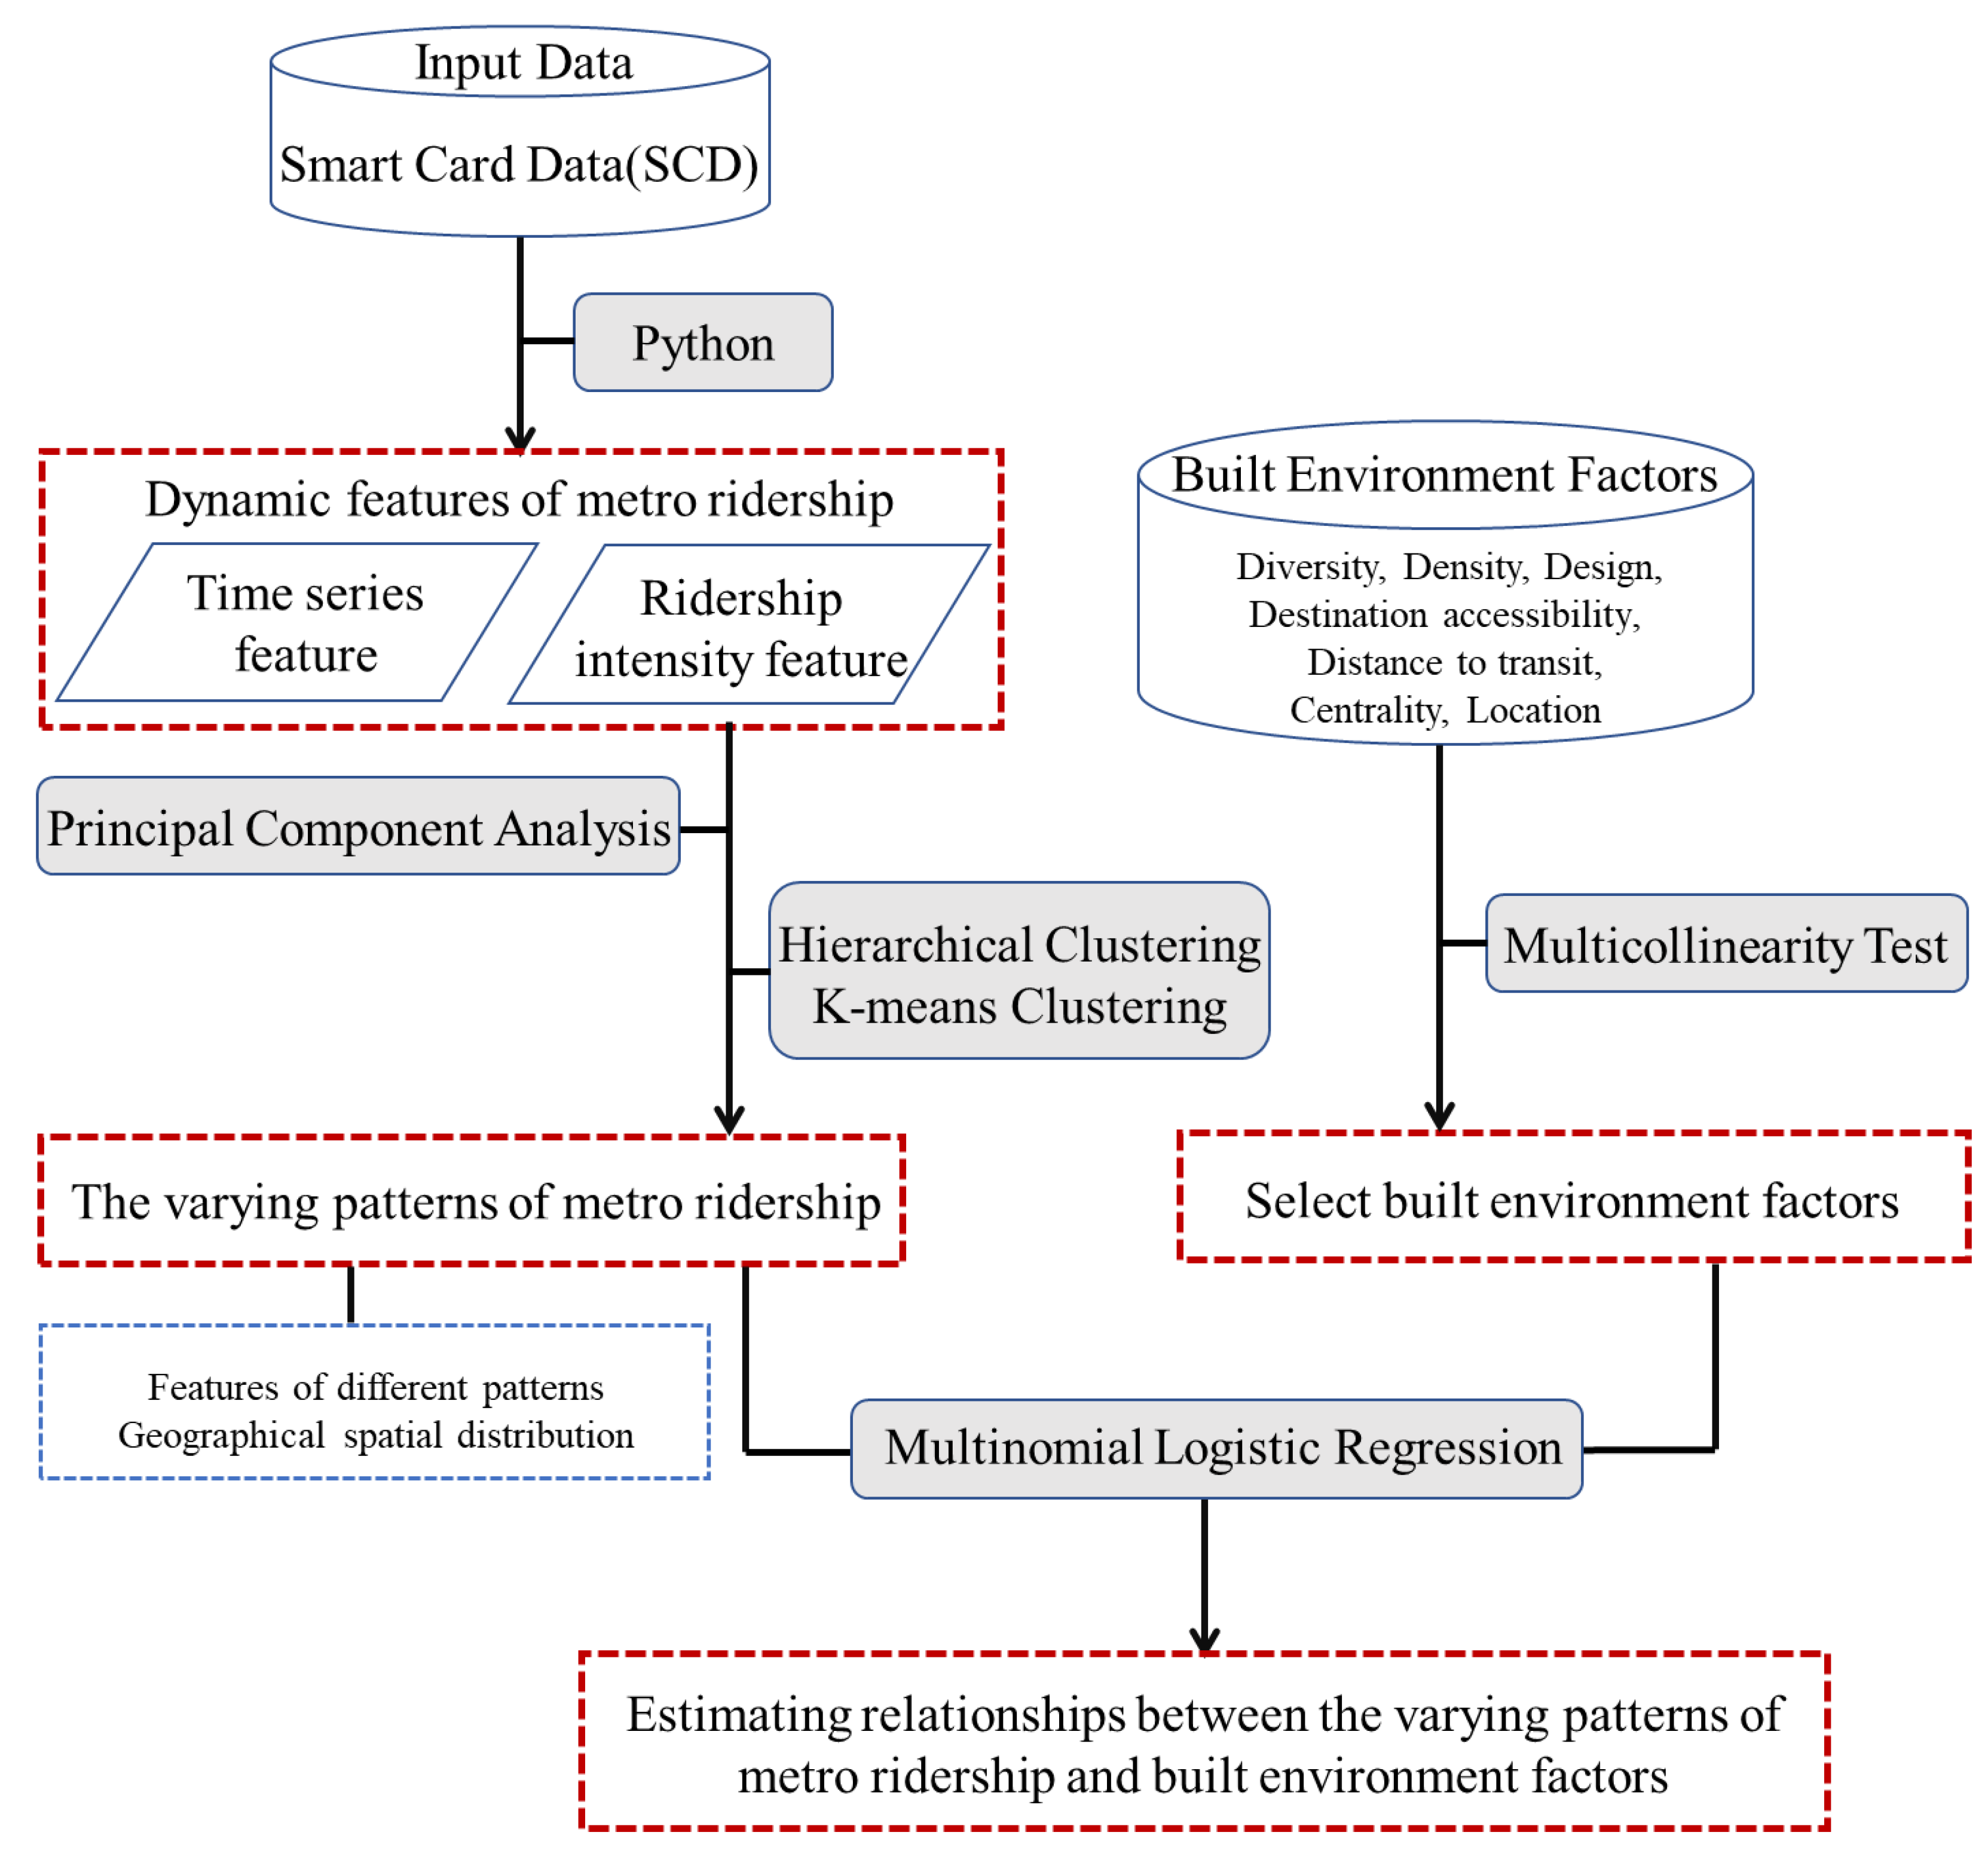
3.2. Research Framework

Figure 2 presents the methodological framework of this study, which includes four primary steps: (1) extracting dynamic features of metro ridership, (2) classifying the varying patterns of metro ridership using K-means clustering and hierarchical clustering methods, (3) selecting multidimensional built environment factors, and (4) estimating the relationship between built environment factors and varying patterns of metro station ridership based on multinomial logistic regression analysis.

3.2.1. The Measurement of Dynamic Features of Metro Ridership

The smart card data used in this study were obtained from the Tianjin Metro Group and spanned from 12 to 16 December 2020. We employed Python to segregate and consolidate the unprocessed data on metro station ridership. The ridership data for five days, with hourly intervals, were extracted, consolidated and averaged. During the operational hours of 6 a.m. to 24 p.m., the raw ridership data was bifurcated into two datasets—inflows and outflows. To ensure comparability among various stations, we standardized the average hourly inflows and outflows using the z-score method [40]. The dynamic feature index of metro ridership was derived from the datasets, encompassing a time series feature and a ridership intensity feature. This research employed a set of metrics previously proposed, including the number of peaks (K1), skewness (K2), kurtosis (K3), peak hour factor (K4), morning peak hour factor (K5), evening peak hour factor (K6), and the equilibrium coefficient of ridership (K7) [41]. Table 1 outlines the corresponding calculation formulas and detailed explanations for each indicator.
The smart card data comprised two datasets of inflows and outflows, from which we derived a total of 14 indicators (K1–K7 for each dataset), with the standardized values represented as X1 to X14. To mitigate the issue of high correlation amongst these indicators, we executed a principal component analysis for dimensionality reduction. The principal component analysis results show that there were four latent roots greater than one in the model (λ1 = 4.667, λ2 = 4.271, λ3 = 1.712, λ4 = 1.039). The cumulative contribution rate of the four principal components was 83.492% (w1 = 33.34%, w2 = 30.51%, w3 = 12.23%, w4 = 7.42%). The composite score of the ith principal component can be calculated as follows:
Y i = w i a 1 i X 1 + a 2 i X 2 + + a 14 i X 14
where Yi refers to the composite score of the ith principal component, wi denotes the contribution rate of the ith principal component, and ani is the score coefficient of the nth index of the ith principal component. The principal component score coefficient matrix is shown in Supplementary Table S1.

3.2.2. The Hierarchical Clustering Method and K-Means Clustering Method

The composite score of the extracted principal components was used to classify the varying patterns of metro station ridership using a combination of hierarchical clustering and K-means clustering. Firstly, hierarchical clustering was employed to assess the differences in the varying patterns of station ridership, and the appropriate number of clusters was determined. Next, the initially determined number of clusters was set as the K value of K-means clustering. Finally, the final classification results of the stations were determined using K-means clustering.
Hierarchical clustering is a method that involves sorting and grading nodes by measuring their correlation and creating a tree hierarchy of network nodes using single or complete link clustering [42]. In this study, the inter-group association method was used for hierarchical clustering, and the square Euclidean distance was used as the metric. The square Euclidean distance can be calculated using the following formula:
d x , y = i = 1 k ( x k y k ) 2 ,
where d(x, y) refers to the distance between the two cluster of x(x1, x2, …, xn) and y(y1, y2, …, yn). xk and yk are the kth index of x and y, respectively.
K-means clustering is an iterative clustering analysis algorithm that involves randomly selecting k objects as the initial clustering center, calculating the distance between each object and each initial clustering center, and assigning each object to the nearest clustering center [43]. In this study, the square of the error was used as the standard measure function, and the Euclidean distance was used as the metric standard. The calculation formulas for the error and Euclidean distance are shown as follows:
S S E = i = 1 k p D i x x ¯ i 2 ,
d x , y = k = 1 n ( x k y k ) 2 ,
where SSE represents the error squared sum of all objects in the set and the center of its subset, x is a point in the object, xi is the mean of cluster Di. d(x, y) donates the distance between the two cluster of x(x1, x2, …, xn) and y(y1, y2, …, yn), xk and yk are the kth index of x and y, respectively.

3.2.3. The Measurement of Built Environment Factors

In this study, the diversity dimension was evaluated using the entropy score of the land-use mix [44] and the proportion of land-use type [45]. The land use data were obtained from the third land use survey in Tianjin, where eight land-use categories were identified, including residential, commercial services facilities, public services facilities, industrial and logistics warehouse, green space, transport facilities, other construction land, and unsuitable construction land.
We adopted population density, employment density, building coverage ratio, and floor area ratio as proxies for density in this study [46,47,48]. Population distribution data of Tianjin were sourced from WorldPop Project.
Two indicators of road density and intersection density, which were retrieved from OpenStreetMap, were adopted as design dimensionality [49]. The destination accessibility dimension was evaluated using the density of bus stops and the number of entrances and exits of metro stations. The distance to transit was assessed using the average distance from bus stops [23,50]. The data on bus stops were obtained through Baidu Map (http://map.baidu.com, accessed on 1 December 2020), and metro station data were sourced from the Tianjin rail transit website (http://www.tjgdjt.com, accessed on 30 December 2020).
Additionally, this study introduced three external influencing factors, namely network betweenness centrality, network closeness centrality, and location value. Some scholars have utilized topological structural characteristics of metro networks to evaluate the centrality features of stations [28,29]. Betweenness centrality quantifies the number of shortest paths traversing a node within a network, thereby denoting its role as an intermediary. Closeness centrality denotes the proximity of a node to all others in a network, with elevated values suggesting enhanced accessibility to other nodes [9]. According to the previous literature, location is considered a main determinant to estimate housing prices [51]. In this study, we adopted the average house price to measure the location value. The house pricing data were crawled through https://tj.lianjia.com/, accessed on 15 October 2020. We utilized the regular expression matching method in Python to crawl second-hand house information, and extracted all types that met the criteria of room size, orientation, and floor. The scraped data were subjected to an initial cleaning process to eliminate null values and duplicate entries. Subsequently, we converted the unit price of each house offering into a numeric format. Based on the names of residential communities, we employed Python to fetch the corresponding spatial coordinate information, which was then associated with the house price data. These data were first aggregated to the station catchment areas and then calculated as indicators. Table 2 summarizes the built environment indicators used in this study. Table 3 presents the descriptive statistics of the built environment indicators.
The study conducted a multicollinearity test on all the independent variables before the regression analysis to ensure that the variance inflation factor (VIF) of the independent variables was less than five [20,49]. As a result, indicators such as floor area ratio and road density were eliminated from the analysis. The test results of VIF values of independent variables are presented in Table 4.

3.2.4. Multinomial Logistic Regression Model

To measure the correlation between the built environment and different ridership patterns at metro stations, we utilized a multinomial logistic regression (MLR) model. The model had built environment factors as independent variables and metro station cluster results as the dependent variable. Prior research has established that the MLR model is a reliable approach for analyzing multi-category issues concerning public transportation [52,53]. The MLR model requires one basic category to be identified among all categories to enable comparisons with the other categories. The parameters of each independent variable are relative to the basic category. The probability (P) of a metro station being classified into a particular ridership pattern is expressed as follows:
P y i = j X i = e X i β j | b j e X i β j | b ,
where yi = j indicates the metro station i being classified into category j in comparison with the basic category b, X is the independent variables, and β is the maximum likelihood coefficient.

4. Results

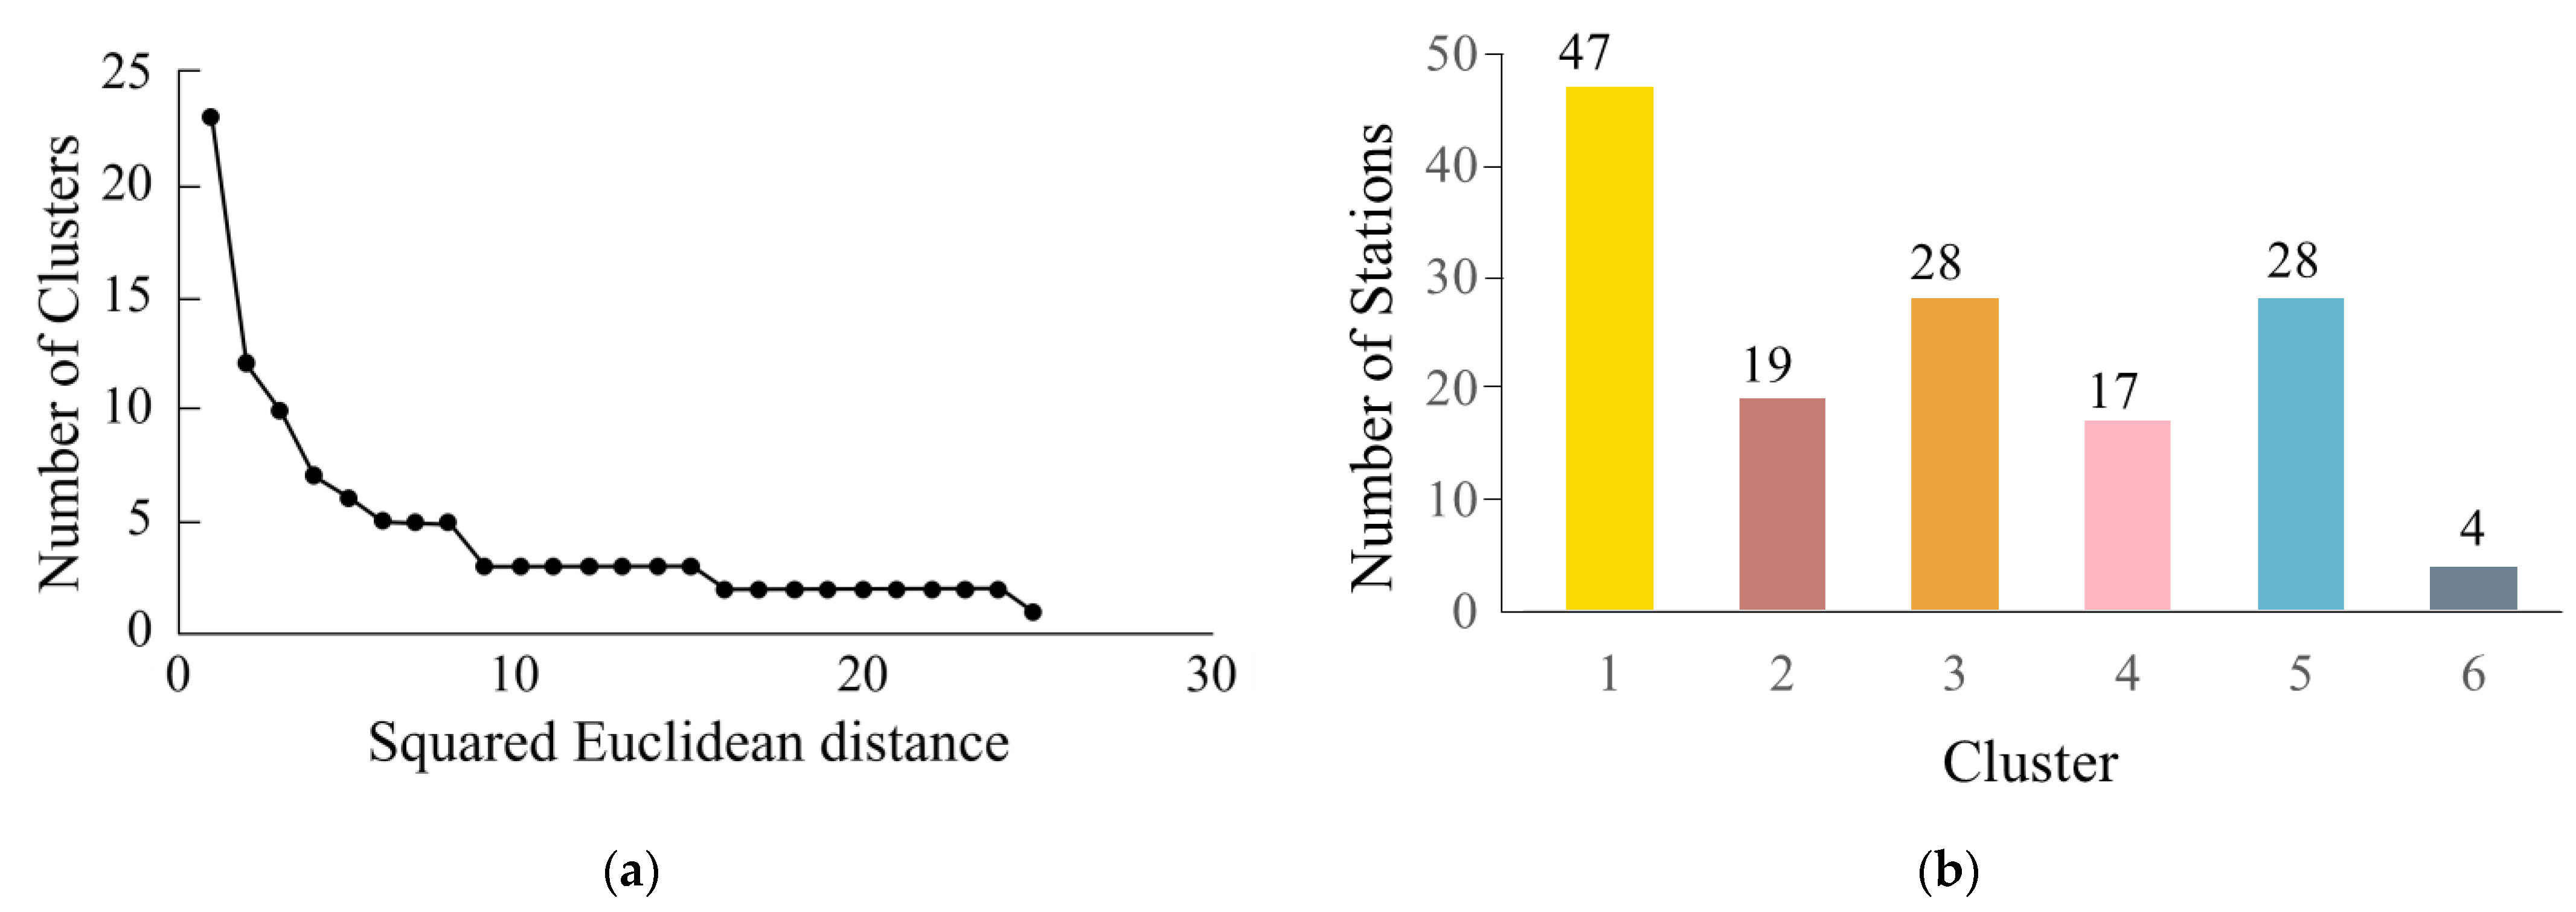
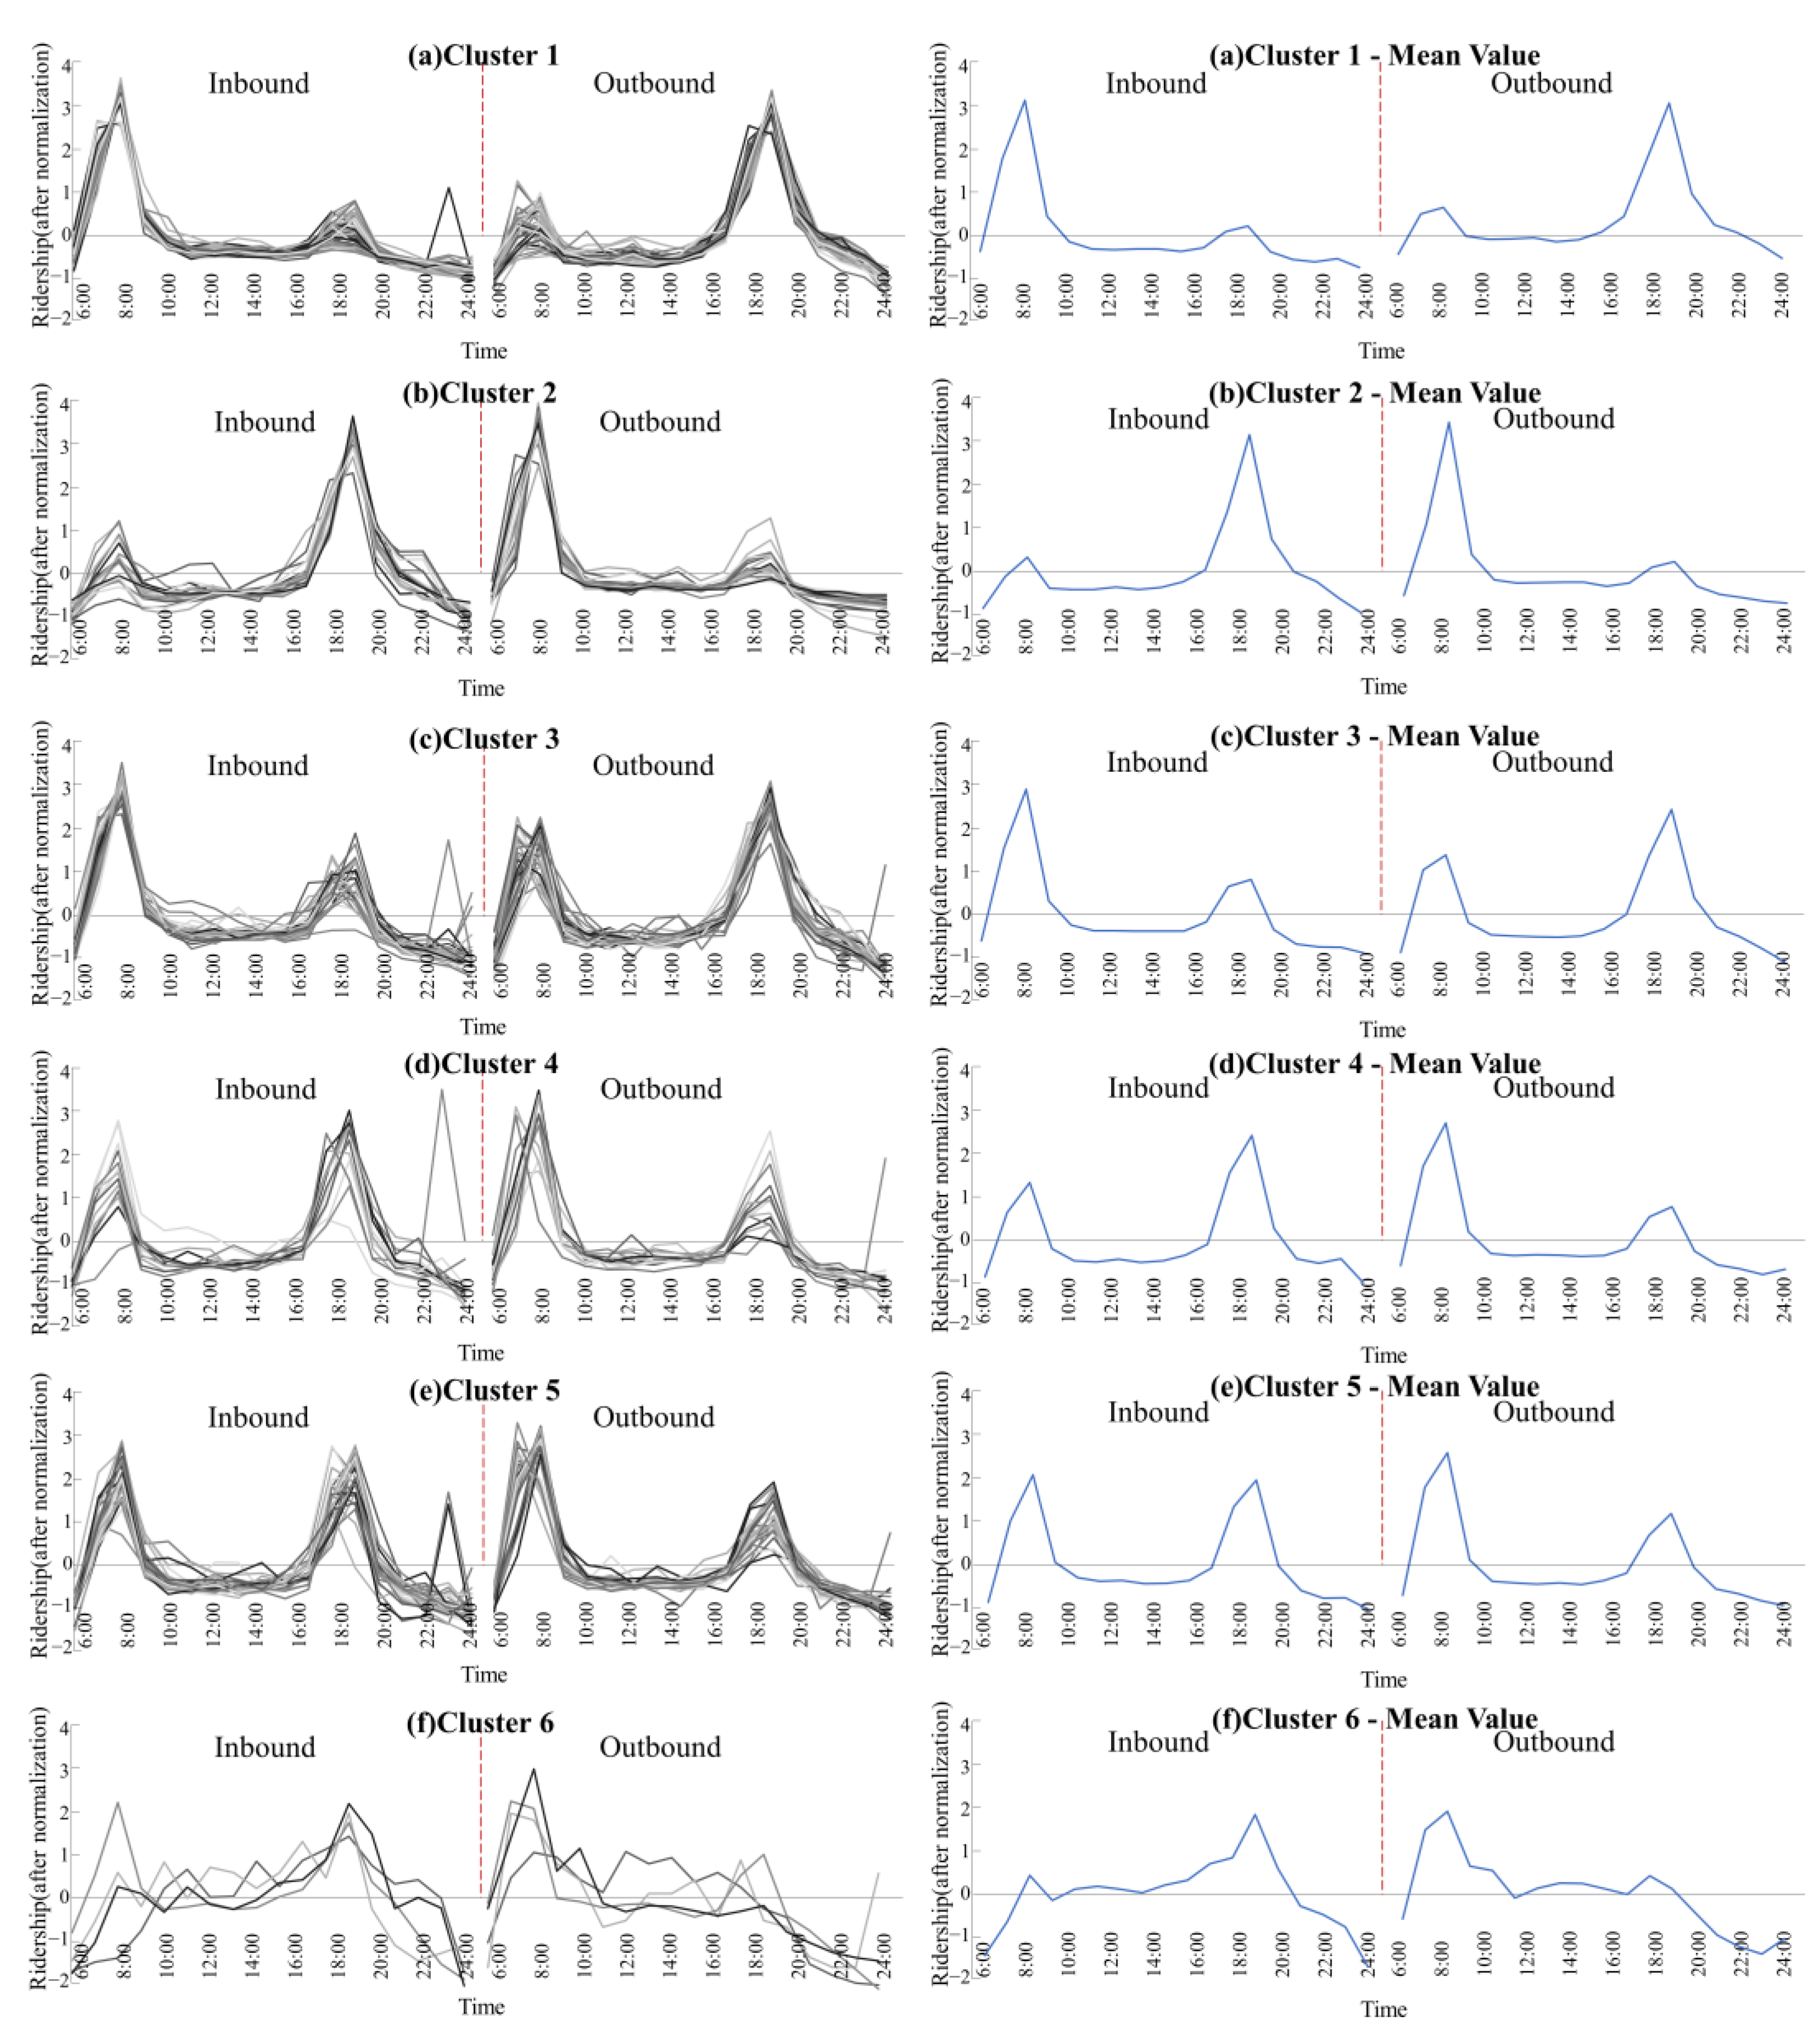
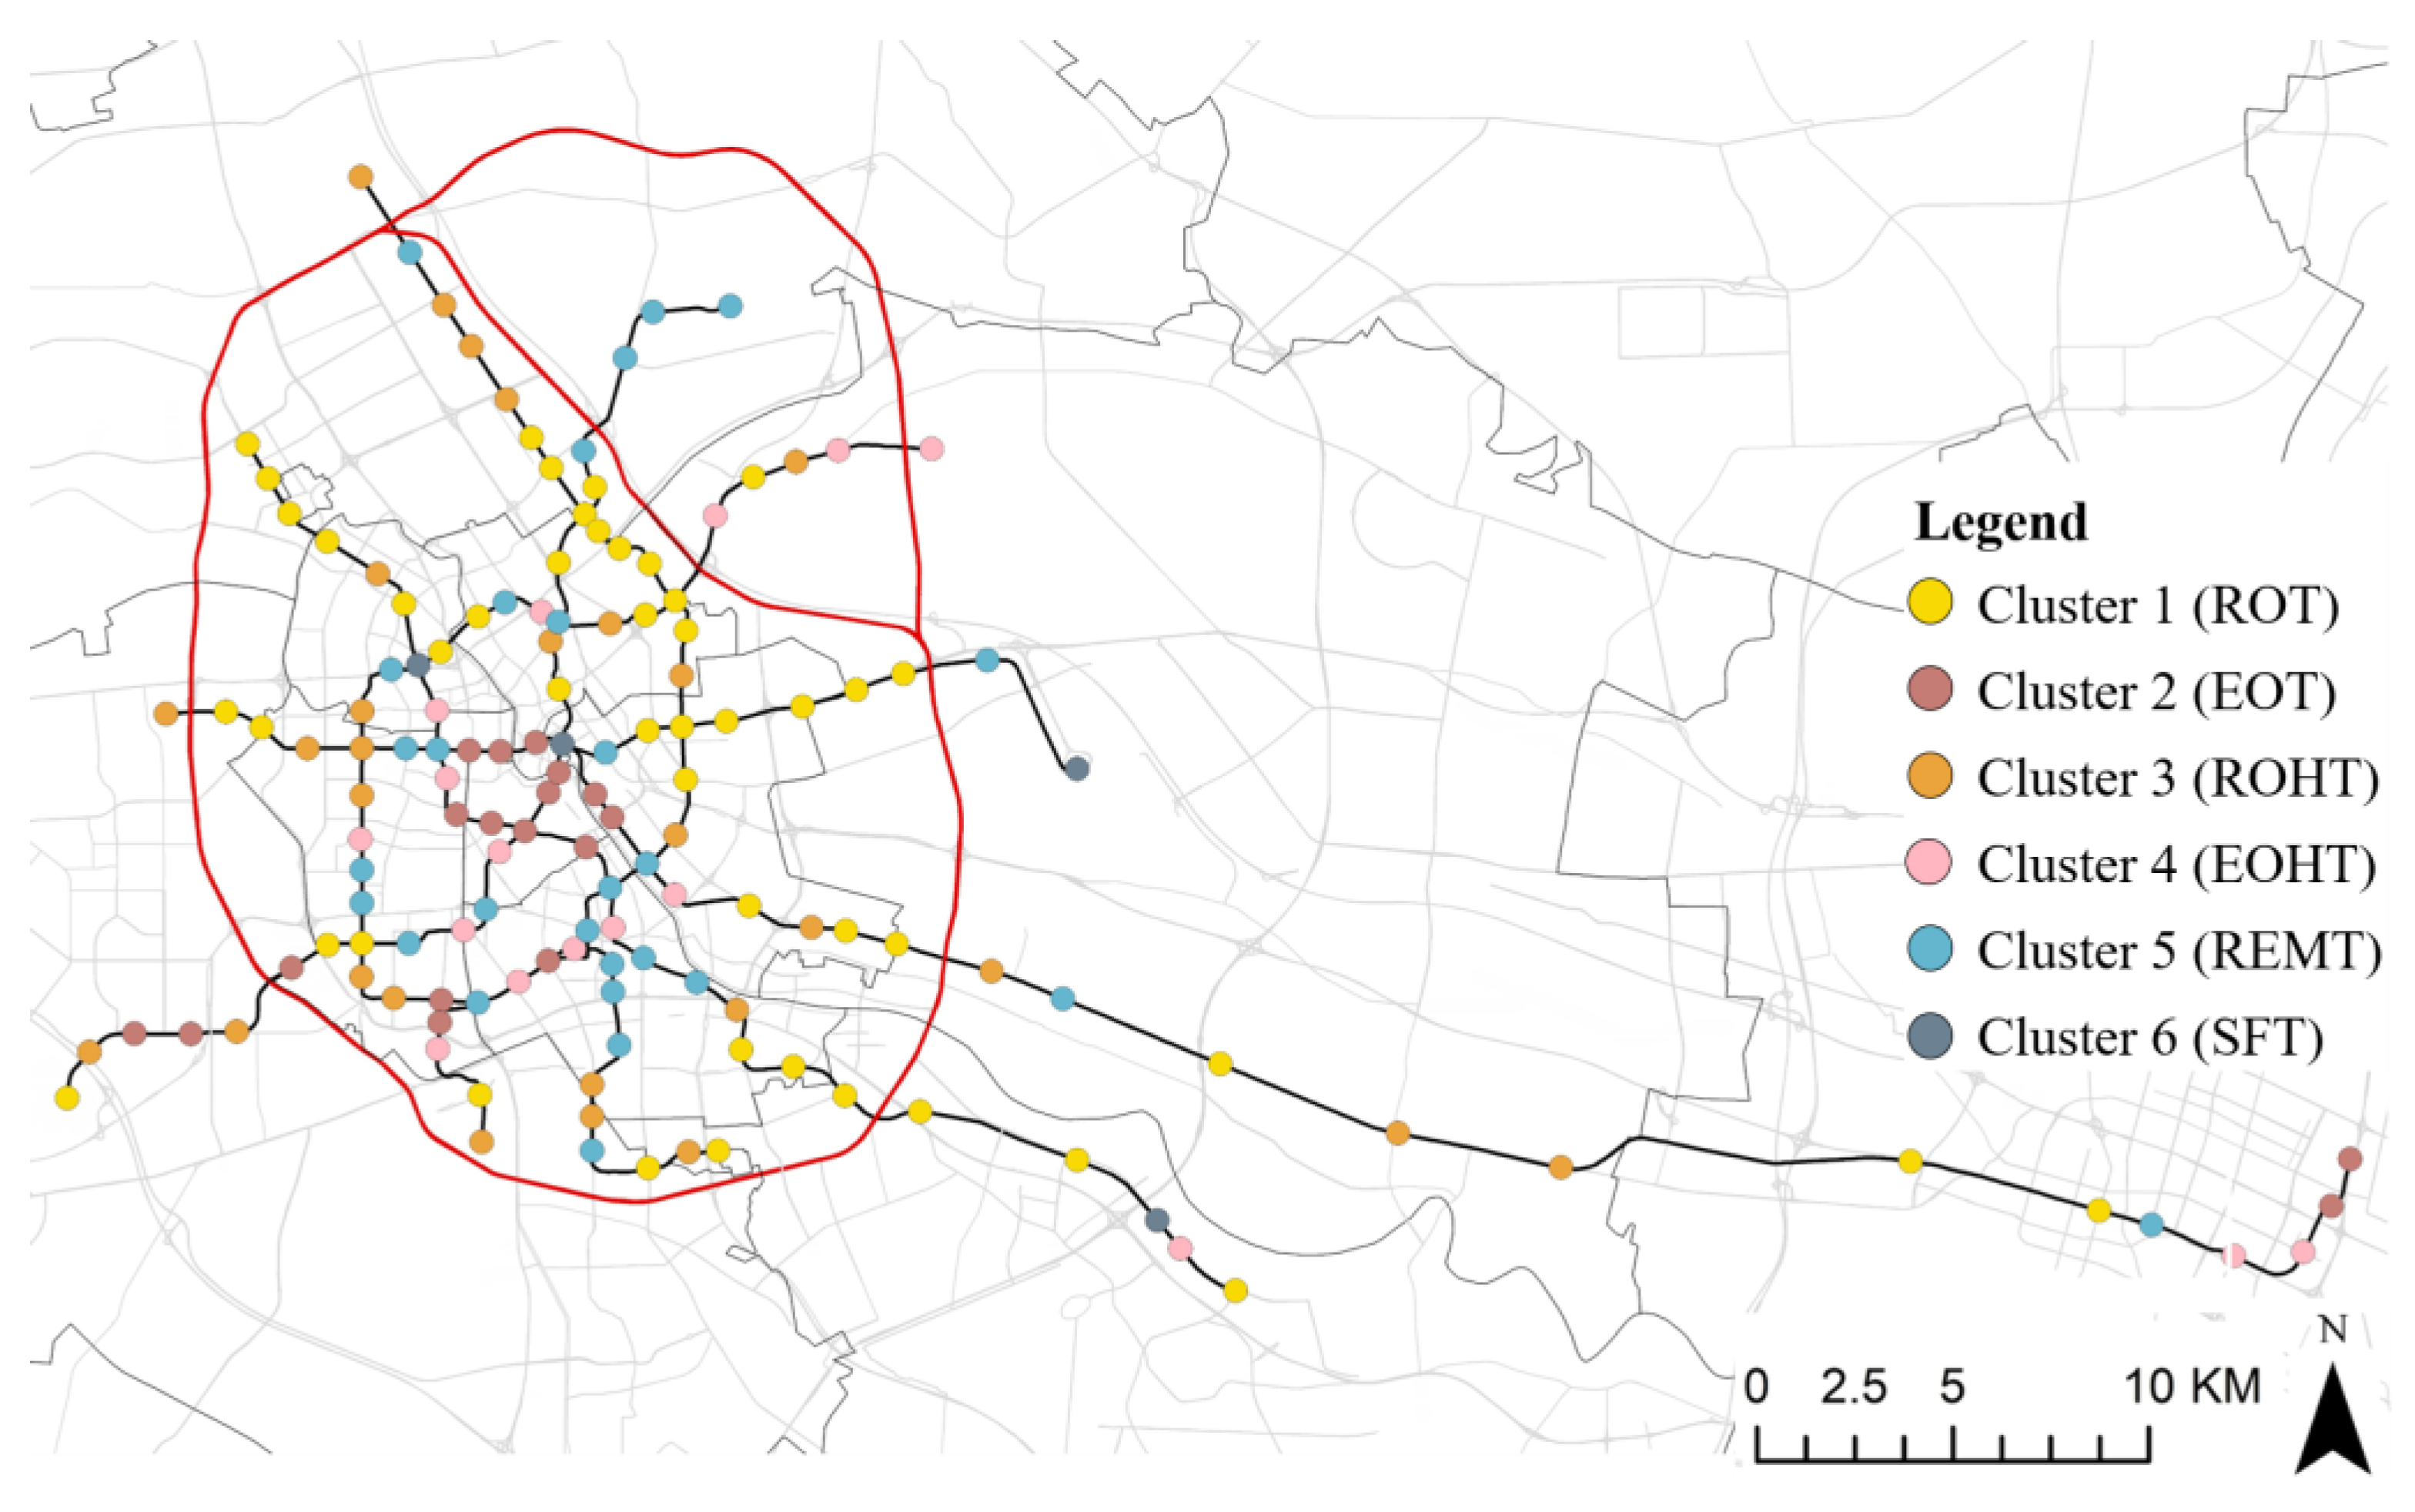
4.1. The Clustering Result of Varying Patterns of Metro Station Ridership

The hierarchical clustering analysis produced a clustering diagram as shown in Figure 3a. It is evident that the frequency variation in the number of clusters slowed down when the number of clusters reached seven, with an increase in Euclidean square distance. The curve flattened out when the number of clusters reached five or three. However, when the clustering coefficient was three, the classification of groups was not detailed enough. Therefore, the number of clusters was preliminarily selected as five, six, and seven in sequence. The K value of K-means clustering analysis was set to the preliminarily selected cluster number. The clustering result was better when the cluster number was six, and the feature difference between different patterns was obvious. The details of the metro station classification are presented in Supplementary Table S2, and the clustering results of varying patterns of metro station ridership are shown in Figure 3b. Cluster 1 contains the highest number of stations, accounting for 33% (47), followed by Cluster 3 and Cluster 5, both with a share of 20% (28). This is attributed to the primary function of metro systems in addressing residents’ commuting needs, which necessitates their proximity to residential areas. Additionally, residential land typically accounts for the highest proportion of urban construction land at approximately 30%, surpassing commercial service facilities, administrative offices, and industrial warehouses. Although the metro system can enhance accessibility to areas of employment concentration, there are still relatively few such locations. Cluster 6 contains only four stations because of their special function as the external transportation hub of the city.
The study presented the characteristics of six varying patterns of metro station ridership corresponding to six station function types, as shown in Figure 4. Cluster 1 displayed a unimodal distribution, with inbound and outbound ridership manifesting pronounced tidal attributes in temporal distribution. These metro stations witnessed an elevated inbound ridership during the morning peak, and a reduced outbound ridership during the evening peak, yielding a peak difference of approximately 2.5 units. Given these tidal characteristics, we labeled Cluster 1 as the residence-oriented type (ROT). Cluster 2 also exhibited a unimodal distribution but with a different peak distribution compared to Cluster 1. The morning peak primarily comprised outbound ridership, while the evening peak consisted largely of inbound ridership. These metro stations observed high outbound ridership during the morning peak and elevated inbound ridership during the evening peak, juxtaposed with a relatively lower inbound ridership during the morning peak and outbound ridership during the evening peak. The differential between these peaks can amount to three units. We classify Cluster 2 as the employment-oriented type (EOT).
Both Cluster 3 and Cluster 4 display a bimodal distribution, distinguished by one prominent peak and a less noticeable peak, with the maximal variation between peaks spanning between one and two units. Specifically, Cluster 3 registered a considerably higher inbound ridership during the morning peak compared to the evening peak, while recording a lower outbound ridership during the morning peak compared to the evening peak. Conversely, for Cluster 4, the inbound ridership during the morning peak was significantly less than that during the evening peak, while its outbound ridership during the morning peak was significantly greater than that during the evening peak. It was evident that Cluster 3 exhibited certain similarities to the characteristics of Cluster 1, while Cluster 4 showed certain resemblances to the traits of Cluster 2. Accordingly, we have categorized Cluster 3 and Cluster 4 as the residence-oriented hybrid type (ROHT) and the employment-oriented hybrid type (EOHT), respectively.
Cluster 5 also showed a bimodal distribution but with less distinct disparities between the two peaks as compared to Clusters 3 and 4. The inbound ridership during the morning peak nearly mirrored that of the evening peak, whereas the disparity in outbound ridership between these two periods was approximately one unit. Hence, Cluster 5 was classified as the residence-employment mixed type (REMT). The diverse ridership patterns in Cluster 6 displayed irregular and ongoing multiband characteristics. On closer examination, this cluster was found to comprise Tianjin Station, Tianjin West Station, Tianjin South Station, and Binhai International Airport. These stations primarily function as urban transportation hubs, leading us to classify Cluster 6 as the special function type (SFT).
As illustrated in Figure 5, the stations classified under Cluster 1 and 3 were predominantly located in the urban periphery, indicating a spatial relationship between the ROT station and the suburbanization process. In contrast, the stations in Cluster 2 were primarily situated in the urban core, which reflected the concentration of EOT stations in the central business district. Furthermore, the stations in Cluster 4 and 5 were dispersed throughout the main urban area, which was consistent with the EOHT station and REMT station, respectively.

4.2. The Result of Multinomial Logistic Regression

The MLR analysis set cluster 1 (i.e., ROT) as the reference cluster. The MLR results showed that the Pseudo R2 is 0.78, indicating the model had excellent goodness-of-fit (Table 5) and strong explanatory ability.
Table 5 presents the MLR outcomes for multiple metro stations, showing substantial correlations between built environment characteristics and various station clusters, aside from the special functional station clusters. The SFT stations, functioning as the city’s external transportation hubs, are primarily encompassed by transportation-oriented land, with no immediate presence of residential populations or other functional structures. The study results were assessed using ROT as the benchmark. With respect to diversity, the composition of land-use exhibited a negative correlation with the REMT station. Contrasted with the ROT station, the REMT station resided nearer to the central urban region, illustrating an even distribution of employment and residential functionalities. The predominant land use in the immediate vicinity was commercial and residential, offering minimal variety in other land categories. The share of residential areas held a negative association with both EOT and REMT stations. Conversely, the proportion attributed to commercial service facilities was positively linked with four additional station types, with the most substantial regression coefficients observed at EOT and EOHT stations. The fraction of public service facilities was also positively related to ROHT and EOHT stations. To conclude, the portion of land designated for industrial and logistics-warehouse functions had a positive relationship with EOT and REMT stations. This finding suggests a connection between the functional category of land use and the corresponding metro station’s functional type.
In relation to density, population density showed a positive correlation with four other types of stations in comparison to ROT station. EOHT station yielded the highest regression coefficients, followed by REMT, EOT, and ROHT stations. This is likely because these stations were closer to urban centers and therefore had higher population densities than the ROT stations. Conversely, the building coverage ratio was negatively linked to the four aforementioned stations, with the lowest regression coefficients observed at EOT and EOHT stations. Interestingly, no substantial correlation was found between intersection density and station types. Additionally, both the density of bus stops and the count of entrances and exits were positively associated with the EOT station. This may be attributed to the high concentration of workers around the EOT stations, necessitating more public transportation.
In terms of centrality, network betweenness centrality showed a negative correlation with the EOHT station when compared to the ROT station. However, network closeness centrality demonstrated a positive correlation. This may be due to the fact that most EOHT stations were not hubs but were situated closer to the center than ROT stations. Further, location value exhibited a positive correlation with the four other station types relative to ROT stations. Regression coefficients were found in descending order for the EOT station, EOHT station, REMT station, and ROHT station. This trend indicates that proximity to the city center tends to increase the location’s value.

5. Discussion

5.1. Classification of Urban Rail Transit Stations

Previous research has predominantly examined the correlation between the built environment and the overall ridership of metro stations [32,52], limited studies have been conducted on the association between the built environment and the diverse patterns of ridership. In this study, we established a data-driven analysis framework that integrated smart card data and built environment data to investigate the relationship between the built environment and varying patterns of metro station ridership.
The present study employed a combination method of hierarchical clustering and K-means clustering to identify different clusters according to the ridership of metro stations. All stations were divided into six clusters, i.e., residence-oriented type (ROT), employment-oriented type (EOT), residence-oriented hybrid type (ROHT), employment-oriented hybrid type (EOHT), residence-employment mixed type (REMT), and special functional type (SFT). The findings were in line with earlier research conducted by Zhang [17] and Li [41], which indicated that the thematic functional categories of metro stations can be evaluated not only by analyzing the environmental factors around them, such as land use types [54], POI types [53], and pedestrian accessibility [43], but also by considering the different ridership patterns.

5.2. Differences in Impact of Built Environment Factors

Furthermore, the study revealed that stations of the same cluster exhibited similar features in geospatial distribution, while stations in different clusters display heterogeneous features, which is consistent with the findings of previous studies [19,53]. These findings have implications for shaping the thematic patterns of urban functions, such as creating commercial and financial centers in the core of the city through the distribution of EOT stations [24,55], and evacuating the population to the peripheral areas through the distribution of ROT and ROHT stations [56].
To further investigate the relationship between built environment factors and the varying patterns of station ridership, this study employed multinomial logistic regression analysis. The findings suggested that built environments can partially explain the heterogeneous features of varying patterns of ridership, with a more significant relationship observed between most station clusters and built environment factors [19]. Specifically, (1) the proportion of land-use types was closely related to the thematic function of the station. Research by Woo [43] and Liu [54] supported this finding. For instance, commercial service facilities, and industrial and logistics storage land were found to be positively associated with EOT stations, EOHT stations, and REMT stations when compared to ROT stations [53]. (2) Population density was positively associated with most station types, mainly because most ROT stations are distributed in the suburbs. Residents usually prioritized factors such as residence location, surrounding services and facilities, and house price when choosing dwellings, as these factors were directly related to commuting time, medical facilities services, and income level [57]. (3) The factors of the destination accessibility were only positively associated with EOT stations, primarily because such stations were located in areas that provide numerous commercial, financial, and office jobs. These areas required more transportation services to improve accessibility and walkability [24,55]. (4) The location value was positively associated with most station types, and the regression coefficient magnitude was related to the geographic distribution of stations, which was a common phenomenon in large cities [58], i.e., house prices showed a significant decreasing trend with distance from the CBD. (5) Network betweenness centrality was only negatively associated with EOHT stations, and network closeness centrality was only positively associated with such stations, primarily because these stations were mostly distributed at the periphery of the core and were closer to other stations. Moreover, these stations were rarely located on network shortcuts where metro stations were interconnected [53]. Overall, compared to other dimensions of built environment factors, the factors of diversity, density, and location had a more significant association with the varying patterns of metro station ridership.

5.3. Policy Implications

Urban rail transit stations serve as the pivotal nodes of urban public transportation systems, and the pedestrian catchment areas around metro stations are high-density zones of urban socioeconomic activities where residents and workplaces congregate [31,32]. Our study in Tianjin, China, reveals that distinct patterns of ridership can be linked to different station thematic functions, and there are variations in land use structure, population density, and accessibility among various station types. Investigating the connection between ridership patterns and built environment factors can provide valuable insights for urban renewal and transit planning. For instance, in the peripheral regions of major cities, ROT and ROHT stations typically have a relatively single land-use function, which impedes the formation of comprehensive regional centers or town centers. In this regard, these stations should focus on developing integrated communities and compound commerce at the station core, which can enhance the livability of the areas by creating a regional center. This strategy could attract more residents from the city center to migrate to the suburbs [56], thereby mitigating issues related to residential and traffic congestion in urban centers, optimizing the layout and spatial structure of urban land use, promoting integration between urban and rural areas, and facilitating sustainable development across both regions.

5.4. Limitations

Future studies should address the limitations of this study. Firstly, the lack of smart card data for weekends prevented the analysis of varying patterns of ridership at metro stations during weekends. Metro stations with a higher volume of weekend passengers tend to be situated in city areas densely populated with commercial and entertainment facilities, which attract a substantial number of residents [53]. As a result, metro stations in these zones witness a higher frequency of leisure trips during weekends. On the contrary, when metro stations are surrounded by businesses, companies, or primary and secondary schools, they may experience a significantly lower weekend morning peak outgoing volume and evening peak inbound volume. This is due to the decreased demand from individuals who refrain from working or attending school over the weekend. Hence, future studies incorporating weekend smart card data could facilitate a more comprehensive classification of station types, such as commercial entertainment stations or office-centric stations, among others. Secondly, the absence of longitudinal data acquisition limited existing studies to cross-sectional data analysis, which can only show the correlation between the built environment and varying patterns of metro station ridership. Future research should collect longitudinal data to better understand the cause-and-effect relationship. Thirdly, due to limited conditions, we lack data on public bike-sharing, employment data in industrial concentration areas and other built environment factors. Future studies should aim to collect these built environment data in order to enhance and refine measures of built environment characteristics [59].

6. Conclusions

This study identifies six types of metro stations based on their ridership patterns, each with unique functional characteristics. Various built environment factors have different associations with these ridership patterns. Residential-oriented (ROT) stations were used as the reference point for comparison. The proportion of commercial service facilities, industrial and logistics-warehouse areas, population density, and location value have significant positive effects on employment-oriented type (EOT) stations, residence-oriented hybrid type (ROHT) stations, employment-oriented hybrid type (EOHT) stations, and residence-employment mixed type (REMT) stations. However, the building coverage ratio has a significant negative effect on these stations. Notably, different built environment indicators have varying degrees of effect on different types of stations. The density of bus stations and the number of station entrances and exits have a significant positive effect only on employment-oriented type stations. Network betweenness centrality and network closeness centrality have a significant effect only on employment-oriented hybrid type (EOHT) stations. According to different types of metro stations, the operational efficiency of the metro can be improved and sustainable and coordinated development of public transportation and land use can be achieved through reasonable land use planning and rational allocation of urban infrastructure and public service facilities.

Supplementary Materials

The following supporting information can be downloaded at: https://www.mdpi.com/article/10.3390/su15129533/s1, Table S1: Principal component score coefficient matrix; Table S2: Results of metro station classification.

Author Contributions

Conceptualization, L.P. and L.R.; methodology, L.P.; formal analysis, L.P. and Y.J.; investigation, L.P. and Y.J.; data curation, J.W., X.X. and X.H.; writing—original draft preparation, L.P. and Y.J.; writing—review and editing, L.R., J.W., N.Q. and X.H.; supervision, L.R. All authors have read and agreed to the published version of the manuscript.

Funding

This research was funded by the National Natural Science Foundation of China (Grant No. 52278070).

Institutional Review Board Statement

Not applicable.

Informed Consent Statement

Not applicable.

Data Availability Statement

The data cannot be made available due to confidentiality reasons.

Acknowledgments

The authors sincerely thank the editors and anonymous reviewers for their kind views and constructive suggestions.

Conflicts of Interest

The authors declare no conflict of interest.

References

  1. Kim, C.; Kim, S.W.; Kang, H.J.; Song, S.-M. What Makes Urban Transportation Efficient? Evidence from Subway Transfer Stations in Korea. Sustainability 2017, 9, 2054. [Google Scholar] [CrossRef] [Green Version]
  2. Li, X.; Yan, Q.; Ma, Y.; Luo, C. Spatially Varying Impacts of Built Environment on Transfer Ridership of Metro and Bus Systems. Sustainability 2023, 15, 7891. [Google Scholar] [CrossRef]
  3. Wang, J.; Lu, Y.; Yang, Y.; Peng, J.; Liu, Y.; Yang, L. Influence of a new rail transit line on travel behavior: Evidence from repeated cross-sectional surveys in Hong Kong. J. Transp. Geogr. 2023, 106, 103526. [Google Scholar] [CrossRef]
  4. Xia, J.; Zhang, Y. Where Are Potential Areas for Transit-Oriented Development (TOD) & mdash; Exploring the Demands for Built Environment for TOD Planning. Sustainability 2022, 14, 8364. [Google Scholar]
  5. Jiang, Y.; Chen, L.; Grekousis, G.; Xiao, Y.; Ye, Y.; Lu, Y. Spatial disparity of individual and collective walking behaviors: A new theoretical framework. Transp. Res. Part D Transp. Environ. 2021, 101, 103096. [Google Scholar] [CrossRef]
  6. Sung, H. Causal impacts of the COVID-19 pandemic on daily ridership of public bicycle sharing in Seoul. Sustain. Cities Soc. 2023, 89, 104344. [Google Scholar] [CrossRef]
  7. Wang, D.; Zhou, M. The built environment and travel behavior in urban China: A literature review. Transp. Res. Part D Transp. Environ. 2017, 52, 574–585. [Google Scholar] [CrossRef]
  8. Vale, D.S.; Viana, C.M.; Pereira, M. The extended node-place model at the local scale: Evaluating the integration of land use and transport for Lisbon’s subway network. J. Transp. Geogr. 2018, 69, 282–293. [Google Scholar] [CrossRef]
  9. Shi, Z.; Zhang, N.; Liu, Y.; Xu, W. Exploring Spatiotemporal Variation in Hourly Metro Ridership at Station Level: The Influence of Built Environment and Topological Structure. Sustainability 2018, 10, 4564. [Google Scholar] [CrossRef] [Green Version]
  10. Chen, E.; Ye, Z.; Wang, C.; Zhang, W. Discovering the spatio-temporal impacts of built environment on metro ridership using smart card data. Cities 2019, 95, 102359. [Google Scholar] [CrossRef]
  11. Aston, L.; Currie, G.; Kamruzzaman, M.; Delbosc, A.; Brands, T.; van Oort, N.; Teller, D. Multi-city exploration of built environment and transit mode use: Comparison of Melbourne, Amsterdam and Boston. J. Transp. Geogr. 2021, 95, 103136. [Google Scholar] [CrossRef]
  12. Xia, F.; Wang, J.; Kong, X.; Wang, Z.; Li, J.; Liu, C. Exploring Human Mobility Patterns in Urban Scenarios: A Trajectory Data Perspective. IEEE Commun. Mag. 2018, 56, 142–149. [Google Scholar] [CrossRef]
  13. Zhao, P.; Hu, H. Geographical patterns of traffic congestion in growing megacities: Big data analytics from Beijing. Cities 2019, 92, 164–174. [Google Scholar] [CrossRef]
  14. Sun, F.; Wang, X.-L.; Zhang, Y.; Liu, W.-X.; Zhang, R.-J. Analysis of Bus Trip Characteristic Analysis and Demand Forecasting Based on GA-NARX Neural Network Model. IEEE Access 2020, 8, 8812–8820. [Google Scholar] [CrossRef]
  15. Kim, K. Exploring the difference between ridership patterns of subway and taxi: Case study in Seoul. J. Transp. Geogr. 2018, 66, 213–223. [Google Scholar] [CrossRef]
  16. Kandt, J.; Leak, A. Examining inclusive mobility through smartcard data: What shall we make of senior citizens’ declining bus patronage in the West Midlands? J. Transp. Geogr. 2019, 79, 102474. [Google Scholar] [CrossRef]
  17. Zhang, L.; Pei, T.; Meng, B.; Lian, Y.; Jin, Z. Two-Phase Multivariate Time Series Clustering to Classify Urban Rail Transit Stations. IEEE Access 2020, 8, 167998–168007. [Google Scholar] [CrossRef]
  18. Pieroni, C.; Giannotti, M.; Alves, B.B.; Arbex, R. Big data for big issues: Revealing travel patterns of low-income population based on smart card data mining in a global south unequal city. J. Transp. Geogr. 2021, 96, 103203. [Google Scholar] [CrossRef]
  19. Liu, Y.; Singleton, A.; Arribas-Bel, D. Considering context and dynamics: A classification of transit-orientated development for New York City. J. Transp. Geogr. 2020, 85, 102711. [Google Scholar] [CrossRef]
  20. Wang, J.; Zhang, N.; Peng, H.; Huang, Y.; Zhang, Y. Spatiotemporal Heterogeneity Analysis of Influence Factor on Urban Rail Transit Station Ridership. J. Transp. Eng. Part A Syst. 2022, 148, 04021115. [Google Scholar] [CrossRef]
  21. Cervero, R.; Kockelman, K. Travel demand and the 3Ds: Density, diversity, and design. Transp. Res. Part D Transp. Environ. 1997, 2, 199–219. [Google Scholar] [CrossRef]
  22. Ewing, R.; Cervero, R. Travel and the Built Environment. J. Am. Plan. Assoc. 2010, 76, 265–294. [Google Scholar] [CrossRef]
  23. Higgins, C.D.; Kanaroglou, P.S. A latent class method for classifying and evaluating the performance of station area transit-oriented development in the Toronto region. J. Transp. Geogr. 2016, 52, 61–72. [Google Scholar] [CrossRef]
  24. Su, S.; Zhang, H.; Wang, M.; Weng, M.; Kang, M. Transit-oriented development (TOD) typologies around metro station areas in urban China: A comparative analysis of five typical megacities for planning implications. J. Transp. Geogr. 2021, 90, 102939. [Google Scholar] [CrossRef]
  25. Li, S.; Lyu, D.; Huang, G.; Zhang, X.; Gao, F.; Chen, Y.; Liu, X. Spatially varying impacts of built environment factors on rail transit ridership at station level: A case study in Guangzhou, China. J. Transp. Geogr. 2020, 82, 102631. [Google Scholar] [CrossRef]
  26. Boarnet, M.G.; Forsyth, A.; Day, K.; Oakes, J.M. The Street Level Built Environment and Physical Activity and Walking: Results of a Predictive Validity Study for the Irvine Minnesota Inventory. Environ. Behav. 2011, 43, 735–775. [Google Scholar] [CrossRef]
  27. Liu, D.; Jiang, Y.; Wang, R.; Lu, Y. Establishing a citywide street tree inventory with street view images and computer vision techniques. Comput. Environ. Urban Syst. 2023, 100, 101924. [Google Scholar] [CrossRef]
  28. Meng, Y.; Tian, X.; Li, Z.; Zhou, W.; Zhou, Z.; Zhong, M. Comparison analysis on complex topological network models of urban rail transit: A case study of Shenzhen Metro in China. Phys. A Stat. Mech. Its Appl. 2020, 559, 125031. [Google Scholar] [CrossRef]
  29. Yang, L.; Chau, K.W.; Szeto, W.Y.; Cui, X.; Wang, X. Accessibility to transit, by transit, and property prices: Spatially varying relationships. Transp. Res. Part D Transp. Environ. 2020, 85, 102387. [Google Scholar] [CrossRef]
  30. Sun, L.S.; Wang, S.W.; Yao, L.Y.; Rong, J.; Ma, J.M. Estimation of transit ridership based on spatial analysis and precise land use data. Transp. Lett.—Int. J. Transp. Res. 2016, 8, 140–147. [Google Scholar] [CrossRef]
  31. Li, S.; Lyu, D.; Liu, X.; Tan, Z.; Gao, F.; Huang, G.; Wu, Z. The varying patterns of rail transit ridership and their relationships with fine-scale built environment factors: Big data analytics from Guangzhou. Cities 2020, 99, 102580. [Google Scholar] [CrossRef]
  32. Zhao, J.; Deng, W.; Song, Y.; Zhu, Y. What influences Metro station ridership in China? Insights from Nanjing. Cities 2013, 35, 114–124. [Google Scholar] [CrossRef]
  33. Choi, J.; Lee, Y.J.; Kim, T.; Sohn, K. An analysis of Metro ridership at the station-to-station level in Seoul. Transportation 2012, 39, 705–722. [Google Scholar] [CrossRef]
  34. Loo, B.P.Y.; Chen, C.; Chan, E.T.H. Rail-based transit-oriented development: Lessons from New York City and Hong Kong. Landsc. Urban Plan. 2010, 97, 202–212. [Google Scholar] [CrossRef]
  35. Sohn, K.; Shim, H. Factors generating boardings at Metro stations in the Seoul metropolitan area. Cities 2010, 27, 358–368. [Google Scholar] [CrossRef]
  36. Sung, H.; Oh, J.-T. Transit-oriented development in a high-density city: Identifying its association with transit ridership in Seoul, Korea. Cities 2011, 28, 70–82. [Google Scholar] [CrossRef]
  37. Fu, X.; Zhao, X.-X.; Li, C.-C.; Cui, M.-Y.; Wang, J.-W.; Qiang, Y.-J. Exploration of the spatiotemporal heterogeneity of metro ridership prompted by built environment: A multi-source fusion perspective. Iet Intell. Transp. Syst. 2022, 16, 1455–1470. [Google Scholar] [CrossRef]
  38. Zhou, X.; Dong, Q.; Huang, Z.; Yin, G.; Zhou, G.; Liu, Y. The spatially varying effects of built environment characteristics on the integrated usage of dockless bike-sharing and public transport. Sustain. Cities Soc. 2023, 89, 104348. [Google Scholar] [CrossRef]
  39. Liu, X.; Wu, J.; Huang, J.; Zhang, J.; Chen, B.Y.; Chen, A. Spatial-interaction network analysis of built environmental influence on daily public transport demand. J. Transp. Geogr. 2021, 92, 102991. [Google Scholar] [CrossRef]
  40. Lv, Y.; Zhi, D.; Sun, H.; Qi, G. Mobility pattern recognition based prediction for the subway station related bike-sharing trips. Transp. Res. Part C Emerg. Technol. 2021, 133, 103404. [Google Scholar] [CrossRef]
  41. Li, W.; Zhou, M.; Dong, H. CPT Model-Based Prediction of the Temporal and Spatial Distributions of Passenger Flow for Urban Rail Transit under Emergency Conditions. J. Adv. Transp. 2020, 2020, 8850541. [Google Scholar] [CrossRef]
  42. Yin, Q.; Meng, B.; Zhang, L. Classification of subway stations in Beijing based on passenger flow characteristics. Prog. Geogr. 2016, 35, 126–134. [Google Scholar]
  43. Woo, J.H. Classification of TOD Typologies Based on Pedestrian Behavior for Sustainable and Active Urban Growth in Seoul. Sustainability 2021, 13, 3047. [Google Scholar] [CrossRef]
  44. Shannon, C.E. A mathematical theory of communication. Bell Syst. Tech. J. 1948, 27, 623–656. [Google Scholar] [CrossRef]
  45. Guo, Y.; He, S.Y. The role of objective and perceived built environments in affecting dockless bike-sharing as a feeder mode choice of metro commuting. Transp. Res. Part A Policy Pract. 2021, 149, 377–396. [Google Scholar] [CrossRef]
  46. Guo, Y.; Yang, L.; Chen, Y. Bike Share Usage and the Built Environment: A Review. Front. Public Health 2022, 10, 848169. [Google Scholar] [CrossRef]
  47. Thompson, G.; Brown, J.; Bhattacharya, T. What Really Matters for Increasing Transit Ridership: Understanding the Determinants of Transit Ridership Demand in Broward County, Florida. Urban Stud. 2012, 49, 3327–3345. [Google Scholar] [CrossRef]
  48. Cheng, L.; Huang, J.; Jin, T.; Chen, W.; Li, A.; Witlox, F. Comparison of station-based and free-floating bikeshare systems as feeder modes to the metro. J. Transp. Geogr. 2023, 107, 103545. [Google Scholar] [CrossRef]
  49. Jiang, Y.; Wang, S.; Ren, L.; Yang, L.; Lu, Y. Effects of built environment factors on obesity risk across three types of residential community in Beijing. J. Transp. Health 2022, 25, 101382. [Google Scholar] [CrossRef]
  50. Guo, Y.; Yang, L.; Lu, Y.; Zhao, R. Dockless bike-sharing as a feeder mode of metro commute? The role of the feeder-related built environment: Analytical framework and empirical evidence. Sustain. Cities Soc. 2021, 65, 102594. [Google Scholar] [CrossRef]
  51. Heyman, A.V.; Sommervoll, D.E. House prices and relative location. Cities 2019, 95, 102373. [Google Scholar] [CrossRef]
  52. Jun, M.-J.; Choi, K.; Jeong, J.-E.; Kwon, K.-H.; Kim, H.-J. Land use characteristics of subway catchment areas and their influence on subway ridership in Seoul. J. Transp. Geogr. 2015, 48, 30–40. [Google Scholar] [CrossRef]
  53. Yu, Z.; Zhu, X.; Liu, X. Characterizing metro stations via urban function: Thematic evidence from transit-oriented development (TOD) in Hong Kong. J. Transp. Geogr. 2022, 99, 103299. [Google Scholar] [CrossRef]
  54. Liu, S.; Rong, J.; Zhou, C.; Bian, Y. Probability -based typology for description of built environments around urban rail stations. Build. Environ. 2021, 205, 108193. [Google Scholar] [CrossRef]
  55. Cucuzzella, C.; Owen, J.; Goubran, S.; Walker, T. A TOD index integrating development potential, economic vibrancy, and socio-economic factors for encouraging polycentric cities. Cities 2022, 131, 103980. [Google Scholar] [CrossRef]
  56. Liu, Y.; Nath, N.; Murayama, A.; Manabe, R. Transit-oriented development with urban sprawl? Four phases of urban growth and policy intervention in Tokyo. Land Use Policy 2022, 112, 105854. [Google Scholar] [CrossRef]
  57. Li, H.; Wei, Y.D.; Wu, Y.; Tian, G. Analyzing housing prices in Shanghai with open data: Amenity, accessibility and urban structure. Cities 2019, 91, 165–179. [Google Scholar] [CrossRef]
  58. Shi, D.; Fu, M. How Does Rail Transit Affect the Spatial Differentiation of Urban Residential Prices? A Case Study of Beijing Subway. Land 2022, 11, 1729. [Google Scholar] [CrossRef]
  59. Ji, Y.; Ma, X.; Yang, M.; Jin, Y.; Gao, L. Exploring Spatially Varying Influences on Metro-Bikeshare Transfer: A Geographically Weighted Poisson Regression Approach. Sustainability 2018, 10, 1526. [Google Scholar] [CrossRef] [Green Version]
Figure 1. Research areas.
Sustainability 15 09533 g001
Figure 2. Workflow of this study.
Sustainability 15 09533 g002
Figure 3. (a) Number of hierarchical clusters at different squared Euclidean distances; (b) Clustering results of metro stations. This reflects that the maximum number of stations are residential-oriented type stations, providing direct evidence for the backbone effect played by TOD in terms of resident activities.
Sustainability 15 09533 g003
Figure 4. The varying patterns of metro ridership. (a) The variation of inbound and outbound passengers of residence-oriented type (ROT) station. (b) The variation of inbound and outbound passengers of employment-oriented type (EOT) station. (c) The variation of inbound and outbound passengers of residence-oriented hybrid type (ROHT) station. (d) The variation of inbound and outbound passengers of employment-oriented hybrid type (EOHT) station. (e) The variation of inbound and outbound passengers of residence-employment mixed type (REMT) station. (f) The variation of inbound and outbound passengers of special functional type station. Using standard deviation metric to quantitative the intensity of metro station ridership.
Sustainability 15 09533 g004
Figure 5. Geographic distribution of different clusters.
Sustainability 15 09533 g005
Table 1. Dynamic ridership features indicators explanation.
IndicatorExplanationCalculation FormulaFormula Description
Number of peaks (K1)The peak is the vertex on a certain segment of the ridership time series.————
Skewness
(K2)
Describe the symmetry of the overall distribution of the ridership time series. K 2 = 1 n 1 i = 1 n ( x i μ ) 3 / σ 3 xi is the time series; μ is the sample mean; σ is the standard deviation.
Kurtosis
(K3)
Describe the steepness of the overall value distribution pattern of the ridership time series. K 3 = 1 n 1 i = 1 n ( x i μ ) 4 / σ 4 3
Peak hour factor (K4)Ratio of peak hour ridership to full day ridership K 4 = Q i Q d Qi is the peak hour ridership; Qm and Qe are the average hourly ridership at the morning peak or evening peak, respectively; Qd is the full day ridership.
Morning peak hour factor (K5)Ratio of the average hourly ridership at the morning peak to the full day ridership K 5 = Q m Q d
Evening peak hour factor (K6)Ratio of the average hourly ridership at the evening peak to the full day ridership K 6 = Q e Q d
Equilibrium coefficient of ridership
(K7)
Ratio of the average morning peak and evening peak hour factor to the average hourly ridership at the flat peak K 7 = K 5 + K 6 / 2 Q f Qf is the average hourly ridership at the flat peak.
Note: The morning peak is between 7:00 and 9:00; the evening peak is between 17:00 and 19:00; the flat peak is between10:00 and 16:00.
Table 2. Built environment indicators explanation.
DimensionIndicatorExplanation
DiversityLand-use mix entropy E = i = 1 n P i ln P i ln ( n ) , where Pi is the proportion of the land use type i, n is the number of land types, n = 8.
Proportion of residential areaRatio of residential area to PCA
Proportion of commercial services facilities areaRatio of commercial services facilities area to PCA
Proportion of public services facilities areaRatio of public services facilities area to PCA
Proportion of industrial and logistics-warehouse areaRatio of industrial and logistics-warehouse area to PCA
DensityPopulation densityRatio of persons to PCA
Building coverage ratioRatio of building footprint to PCA
Floor area ratioRatio of total gross floor area to PCA
DesignRoad densityRatio of road length to PCA
Intersection densityRatio of intersection number to PCA
Destination accessibilityBus stops densityRatio of bus stops number to PCA
Number of entrances and exitsThe number of entrances and exits in each metro station
Distance to transitAverage route distance from the metro station to bus stopsAverage walking route distance from metro station to bus stops
CentralityNetwork betweenness centrality B i = i s t V d m i n , s t i d m i n , s t , Bi is the ratio between the number d m i n , s t i of shortest paths that run through node i and the total number d m i n , s t of the shortest paths between two nodes.
Network closeness centrality C i = N 1 j = 1 , i j N d i j , N is the total number of nodes; dij is the distance between node i and j.
LocationLocation valueAverage price of all housing within PCA
Note: PCA means the pedestrian catchment areas of rail stations.
Table 3. Descriptive statistics of the built environment indicators.
IndicatorMinimumMaximumMeanStd. Deviation
Land-use mix entropy0.220.950.670.12
Proportion of residential area (%)0.0070.0032.3215.87
Proportion of commercial services facilities area (%)0.0063.0010.069.33
Proportion of public services facilities area (%)0.0044.009.219.25
Proportion of industrial and logistics-warehouse area (%)0.0078.007.9112.89
Population density (10k person/km2)0.027.841.951.89
Building coverage ratio0.000.470.200.10
Floor area ratio0.003.661.120.73
Road density (km/km2)0.4415.096.522.59
Intersection density (n/km2)2.1588.4621.3314.69
Bus stops density (n/km2)0.0013.674.493.12
Number of entrances and exits (n)1.0010.002.991.42
Average route distance from the metro station to bus stops (m)30.61800.00494.13150.33
Network betweenness centrality0.000.410.080.07
Network closeness centrality0.040.130.090.02
Location value (10k RMB/m2)0.006.242.521.15
Note: n represents the number of objects.
Table 4. Test results of VIF values of independent variables.
IndicatorVIF-Initial ValueVIF
Land-use mix entropy1.811.63
Proportion of residential area2.462.33
Proportion of commercial services facilities area1.661.54
Proportion of public services facilities area1.571.51
Proportion of industrial and logistics-warehouse area1.821.80
Population density2.242.21
Floor area ratio6.70-
Building coverage ratio3.923.22
Road density12.42-
Intersection density9.891.87
Bus stops density2.672.40
Number of entrances and exits1.391.38
Average route distance from the metro station to bus stops1.171.17
Network betweenness centrality2.402.27
Network closeness centrality4.524.06
Location value3.902.93
Table 5. The result of multinomial logistic regression model.
VariableEOTROHTEOHTREMTSFT
BWaldBWaldBWaldBWaldBWald
Constant term−15.40 4.57 −11.46 5.50 −17.917.57 4.27 1.51 1.54 0.00
Land-use mix entropy4.40 0.57 5.71 1.88 −2.40 0.34 −8.83 *5.14 −21.68 0.00
Proportion of residential area−0.20 ***6.65 0.05 1.83 −0.03 0.46 −0.06 *2.29 −1.00 0.00
Proportion of commercial services facilities area0.44 ***15.81 0.31 ***11.19 0.44 ***17.57 0.39 ***17.09 1.00 0.00
Proportion of public services facilities area0.10 2.15 0.11 ***5.96 0.12 **4.40 0.040.67 −1.45 0.00
Proportion of industrial and logistics-warehouse area0.18 ***8.10 0.18 ***12.04 0.20 ***12.84 0.13 ***6.94 −0.56 0.00
Population density0.78 *2.94 0.62 *3.55 1.18 ***9.48 1.00 ***8.51 −2.50 0.00
Building coverage ratio−29.64 **5.10 −27.89 ***13.00 −40.01 ***13.87 −14.78 *3.35 161.770.00
Intersections density−0.02 0.28 −0.04 1.11 −0.06 1.46 −0.06 1.98 −0.72 0.00
Bus stops density0.46 *2.38 −0.01 0.00 0.02 0.01 −0.18 0.88 3.61 0.00
Number of entrances and exits0.55 *1.29 −0.04 0.01 0.431.25 −0.51 1.69 5.17 0.00
Average route distance from the metro station to bus stops0.00 1.07 0.00 0.84 0.016.34 0.00 0.34 −0.02 0.00
Network betweenness centrality−22.84 2.57 −7.671.05 −22.24 *3.33 4.01 0.33 86.17 0.00
Network closeness centrality35.20 0.50 23.70 0.53 93.69 **4.10 −5.21 0.03 −140.89
Average housing prices3.34 ***11.25 1.39 ***6.57 2.37 ***9.38 1.53 ***6.57 −8.35 0.00
Pseudo R2: 0.78
ln L ( 0 ) : 464.94
ln L ( β ^ ) : 247.96
L R : 433.96
Note: * Significant at 0.1 level; ** Significant at 0.05 level; *** Significant at 0.01 level; B is the regression coefficient; Wald is the chi-square value.
Disclaimer/Publisher’s Note: The statements, opinions and data contained in all publications are solely those of the individual author(s) and contributor(s) and not of MDPI and/or the editor(s). MDPI and/or the editor(s) disclaim responsibility for any injury to people or property resulting from any ideas, methods, instructions or products referred to in the content.

