1. Introduction
In the past several decades, seismic research on structural components has significantly advanced [
1,
2,
3,
4]; however, there has been limited attention paid to seismic research on nonstructural components (NSCs) that are more vulnerable to damage. In hospitals and other important structures, the pipeline system is an essential nonstructural component for maintaining fire protection and other operations, and these systems can sustain increasingly severe damage in consecutive earthquakes. Due to the growing proportion of economic investment in nonstructural systems in buildings, especially in significant buildings, the seismic resilience of NSCs has become a fundamental concern for functional and economic losses in such buildings. According to FEMA E-74 Reducing the Risks of Nonstructural Earthquake Damage [
5], structural components of commercial buildings generally account for 15–25% of construction expenditures, while NSCs (mechanical, electrical, and plumbing) account for 75–85% of the remaining expenses (
Figure 1). After the 1971 San Fernando earthquake, a survey of 25 damaged commercial buildings revealed the following breakdown of economic losses: structural damage, 3%; electrical and mechanical damage, 7%; external finishes, 34%; and interiors, 56%. A similar survey of 50 damaged high-rise buildings found that while no significant structural damage occurred to the main structure, 43 of the buildings had damaged gypsum board partitions, 18 had damaged elevators, 15 had broken windows, and 8 had damaged air conditioning systems [
6]. Consequently, during earthquakes, NSCs are often more sensitive to damage than structural components.
If the building’s main structure stays substantially intact during an earthquake, the building’s capacity to continue normal operations frequently depends on the integrity of the piping system, ceiling system, partition walls, and other nonstructural components (NSCs). Especially in hospitals, airports, and other important buildings, the ability of the building to maintain normal operations is a prerequisite for efficient post-earthquake rescue and restoration.
The Sichuan province county health center lost basic function after the 2013 Lushan Ms 7.0 earthquake due to substantial damage to the piping and ceiling systems [
7]. Even if the primary structure can be used immediately after an earthquake, damage to NSCs, particularly the piping system, can reduce or eliminate the building’s functionality. The damage to piping systems under earthquake action can be typically divided into three categories: (1) failure of supports such as suspension, lateral, or longitudinal in piping systems; (2) failure of piping systems due to collision with the main structure or other NSCs that may cause large displacements in earthquakes; and (3) failure of piping systems due to uncoordinated deformation that may result from setting unreasonable restraints. Although there are existing relevant codes for the seismic design of pipe systems, past earthquakes demonstrate that the seismic performance of piping systems must be improved.
Pipeline systems generally consist of pipeline structures, fluids, valves, other accessories, and system support systems. Chen S, Xu, and Ye [
8,
9,
10] studied the performance of underground pipeline systems. Numerous researchers have studied flow transmission pipes [
11,
12], but less attention has been paid to water supply systems, which are functional under normal conditions but easily damaged by earthquakes.
Tian et al. [
13] conducted dynamic tests on three groups of fire-extinguishing sprinkler piping systems using different supports, and their results proved that seismic bracing can considerably improve the seismic resistance of piping systems. Tian et al. [
14] conducted monotonic and reciprocal loading experiments on 48 tee joints of varied diameters, materials, and connections to assess the rotational capability of such specimens following initial leakage. Hoehler et al. [
15] conducted shaking table tests on pipe systems installed in seven-story reinforced concrete structures to determine their damage modes at varying seismic intensities and analyzed the test data to determine the accuracy of the acceleration calculation method for NSCs in the ASCE 7-05 code [
16]. Daniele et al. [
17] conducted a series of quasi-static tests on various types of seismic bracing systems using different types of portal seismic bracing systems (braces are screws and channels) with the actuator loaded in the direction of the tube and perpendicular to the tube; their results concluded that the effective ductility factor in FEMA P-795 [
18] is more conservative as an engineering demand parameter. Numerous Chinese scholars have also conducted research on seismic pipe system topics. Shang Qingxue et al. [
19] conducted multiple sets of quasi-static tests on three types of seismic supports, namely, the screw type, the steel cable type, and the beam clamp type, but the tests did not account for the influence of pipe clamps, pipes, etc., and only evaluated the seismic performance of the bracing. Wu Houli et al. [
20] evaluated the performance of water supply pipes in full-scale masonry constructions by using shaking table tests.
Ensuring the basic functionality of the water supply pipeline system after an earthquake is a fundamental prerequisite for important buildings such as hospitals to achieve their basic functions. Currently, research on the seismic resilience of buildings has become increasingly in depth, and FEMA P 58 provides a large database of NSC fragility based on U.S. standards. However, seismic bracings, as a commonly used seismic restraint device for pipeline systems, have various structural forms, and there are certain differences in the seismic bracings used in important buildings in different countries [
21]. Therefore, assessing the seismic resilience of pipeline systems in important buildings requires data on the fragility of seismic braces that comply with U.S. standards. Nevertheless, there is little research on seismic bracing, and no research has been conducted on the four types of seismic bracing systems used in this study. The expansion of the NSC fragility database still requires a large number of experiments. Meanwhile, determining appropriate engineering demand parameters remains a worthy exploration in relevant research. Daniele et al. [
17] studied seismic bracings with small differences in two mechanical properties using the equivalent ductility coefficient as the engineering demand parameter. Whereas the equivalent ductility coefficient only considers the deformation capacity of the components, without including the load-bearing capacity, which is also an important measure. For a situation where a test specimen has low load-bearing capacity but strong deformation capacity, the reasonableness of using the equivalent ductility coefficient as the engineering demand parameter is questionable.
Currently, the research on the seismic performance of pipeline systems mainly relies on shaking table tests as the primary method. In addition, there exist significant differences in the construction of pipeline systems tested by different scholars. As a result, insufficient understanding still exists regarding the seismic damage mechanism of different pipeline systems, especially those that use new seismic bracings. Therefore, this study conducted quasi-static tests on four typical types of new seismic bracing systems with energy values (force–displacement envelope area) that simultaneously considered the bearing capacity and deformation capacity of seismic bracings as engineering demand parameters. Moreover, the fragility of each specimen was obtained based on the energy values, and the damage mechanisms of each specimen were analyzed through the experiment. Finally, improvement suggestions were proposed for the weaknesses of each type of specimen.
4. Test Result
Due to the diverse types of specimens tested in this study, this chapter will provide a detailed introduction to S1−X type specimens, while the other specimens will only be briefly described for significant phenomena.
4.1. S1 Test Specimen
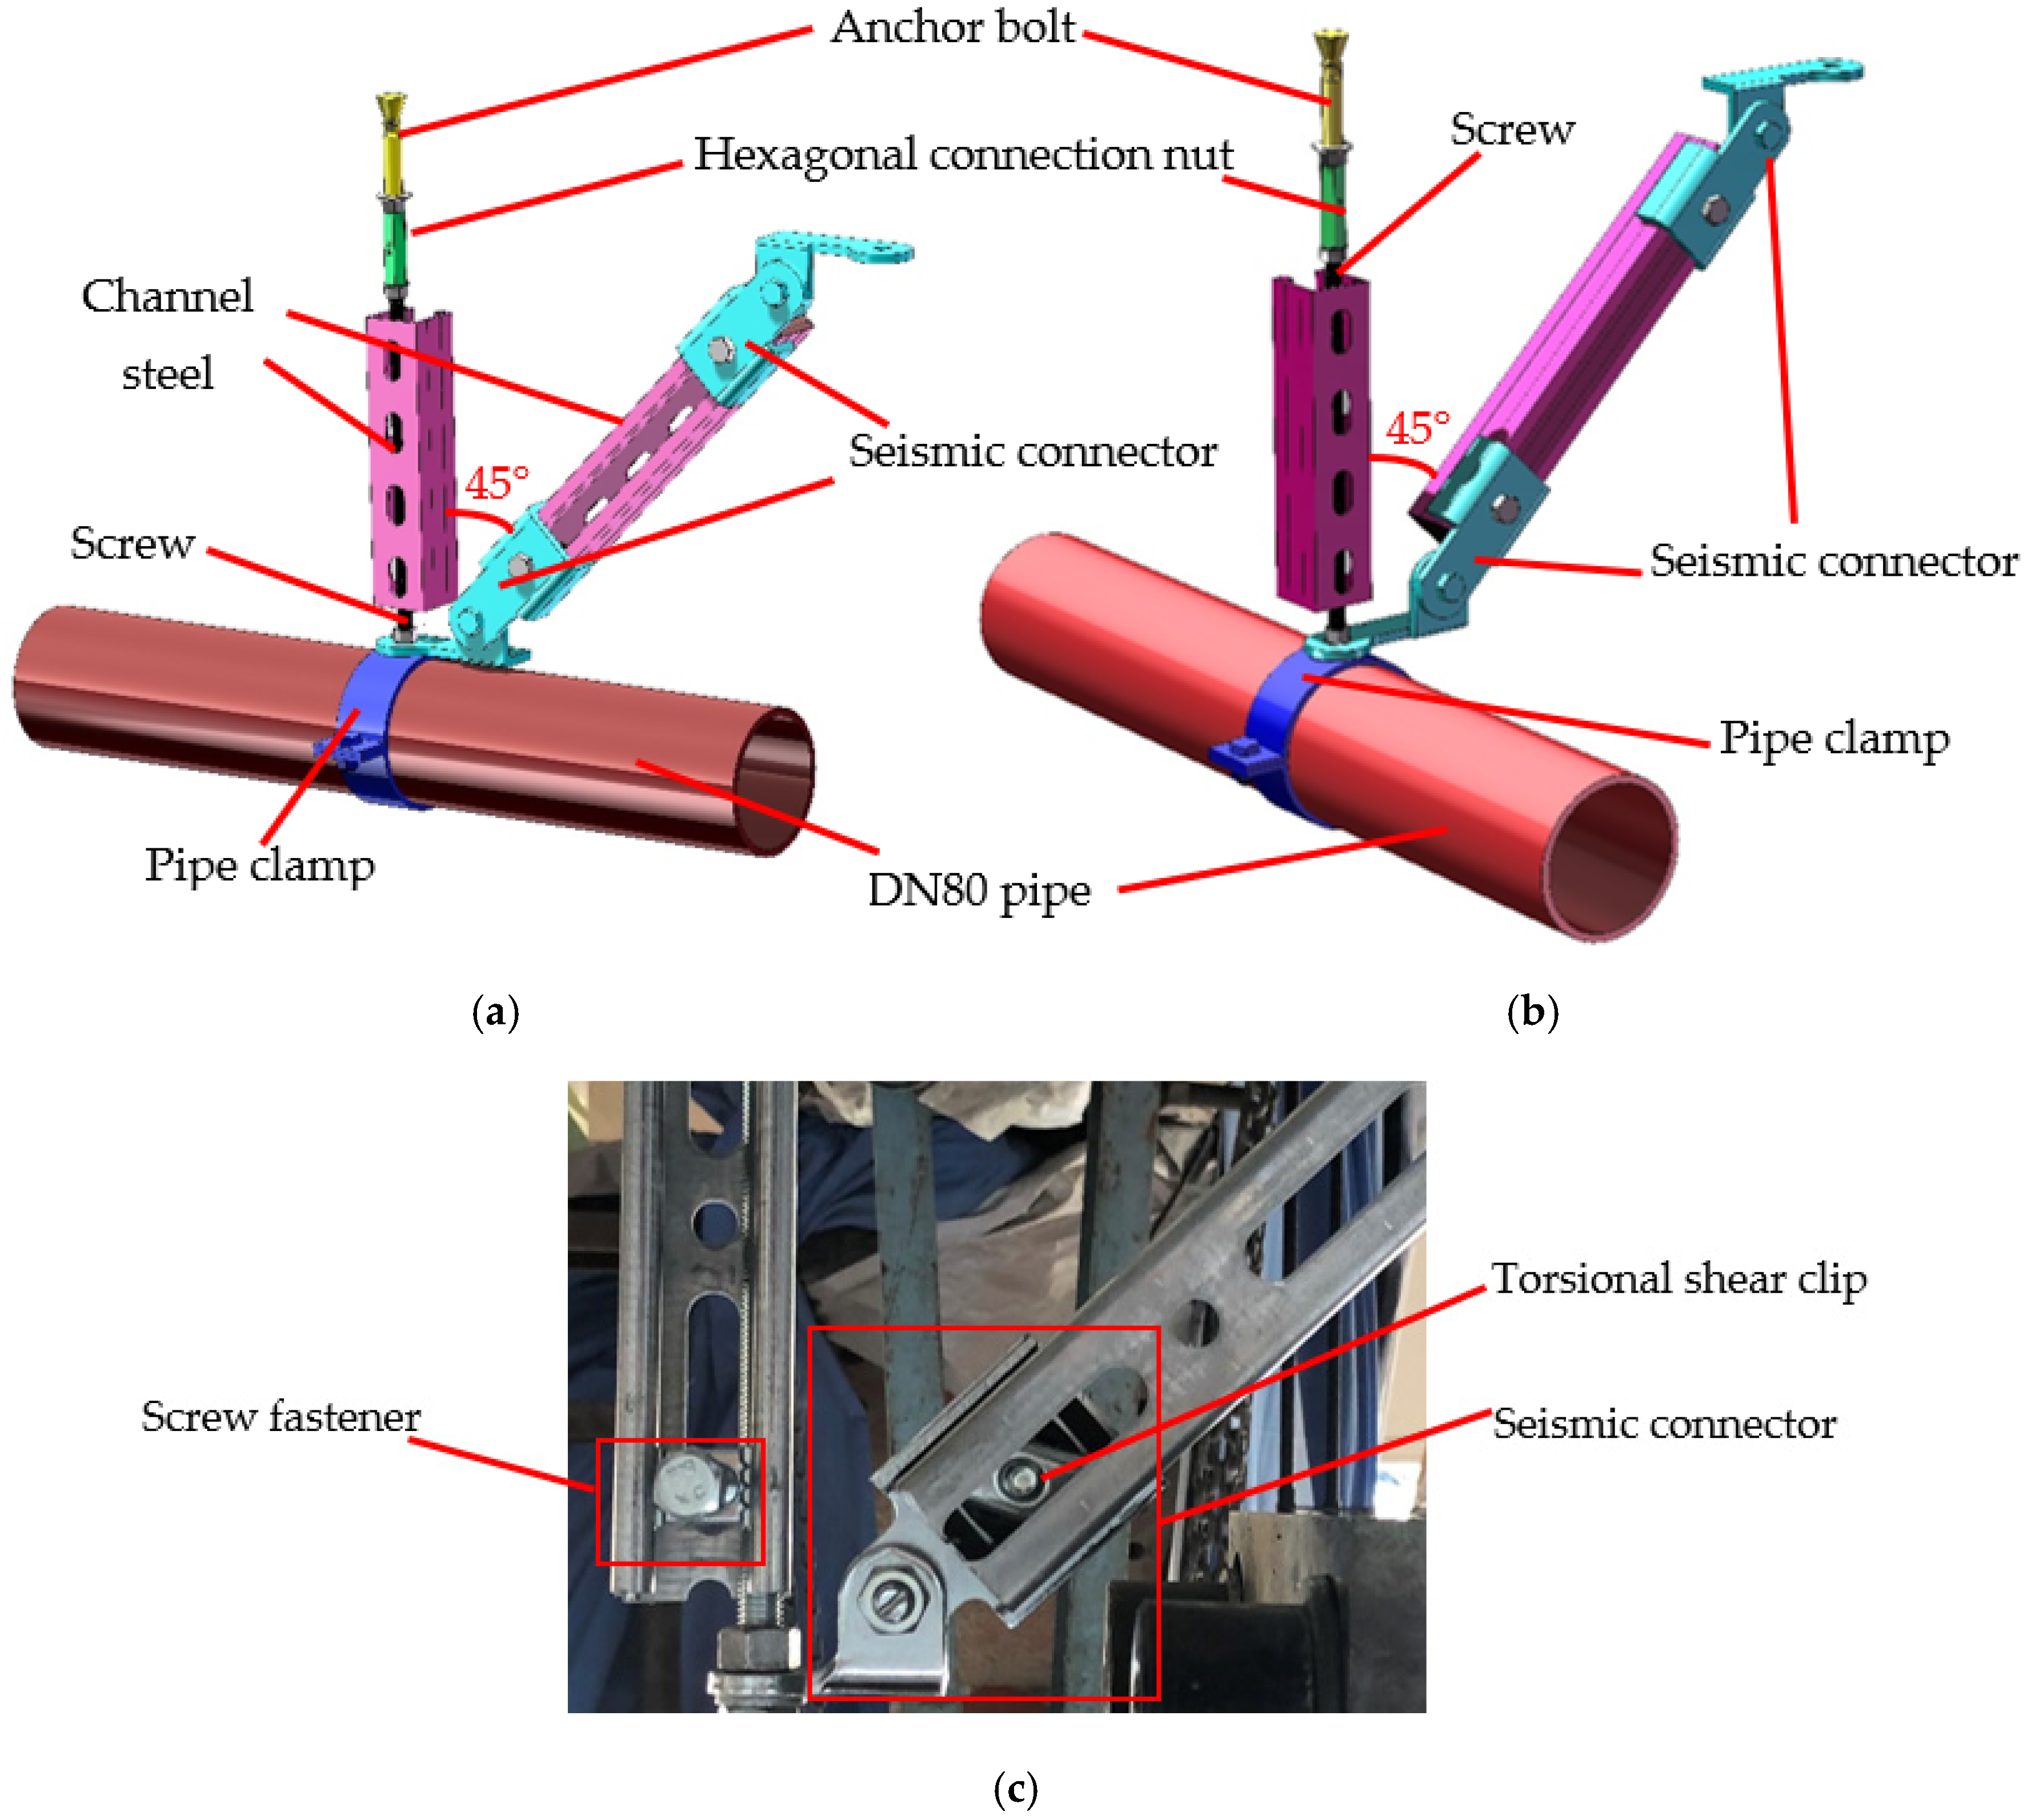
According to the code of “Dimensions, shapes, masses, and tolerances of seamless steel tubes” [
23], the nominal diameter of the DN 80 uninsulated pipe in the test should be 80 mm, and the outside diameter should be 89 mm. Due to the overall stiffness of the seismic bracing, the S1−X monotonic loading specimen was required primarily to reduce friction between the pipe and the pipe clamp. The force increased fast between 0 and 25 mm of loading displacement, although the diagonal brace showed no obvious deformation. As the pipe’s displacement increased, the component’s force remained practically constant at 2.4 kN. This type of seismic bracing was unable to arrest the pipe’s movement despite the fact that the component incurred no obvious damage.
The connection of the pipe clamp to the pipe are weak spots for the S1−X component when subjected to ground motion. Due to its significant stiffness, the seismic bracing diagonal brace of the S1−X fails first. To avoid this issue, the transmission line should be strengthened, for example, by reducing the rigidity of the S1−X component diagonal brace so that it can aid in the dissipation of energy during an earthquake. In this study, the S1−X specimen was used to examine the hysteresis performance and damage process of this type of seismic bracing without considering the effect of pipe clamps.
Figure 8 depicts the installation diagram of the specimen.
To investigate the hysteresis behavior and failure modes of the seismic bracing, the S1−X specimen in the following text does not consider the influence of the pipe clamp, and the specimen of this type is studied. The installation diagram of the specimen is shown in
Figure 9. The displacement amplitude of the test loading is determined based on the monotonic loading test, and in this paper, the displacement amplitude is defined as the displacement value corresponding to 0.85 times the peak force after the peak force.
The maximum force of specimen 1 (numbered S1−X−C−1) (
Figure 10a) in the cyclic loading test was 12.89 kN and −7.94 kN, respectively. Additionally, the type of seismic bracing was primarily dissipated through the sliding of the torsional shear clips in the diagonal brace. When the loading displacement reached 40.92 mm, the upper torsional shear clip in the diagonal brace was nearly ripped out, and the test was terminated due to the severe loss in bearing capacity. As the loading displacement rose in the following cases, the relative displacement of the upper torsional shear clip and diagonal brace channel steel gradually increased. The test of specimen S1−X−C−2 (
Figure 10b) was terminated at 40.92 mm when the diagonal brace’s torsional shear clip nearly came undone. When S1−X−C−3 (
Figure 10c) was loaded to 56.52 mm, the specimen was damaged and the seismic connector was split from the channel steel.
The installation sizes of the three groups of specimens were identical, and the torsional shear clip of each group met the minimum requirement of 40 N*m. The three groups of specimens indicated three separate types of damage, but it was evident that combining both the upper and lower seismic connections in energy dissipation at the same time could greatly boost the seismic bracing carrying capacity.
Specimen S1−Y was subjected to quasi−static loading with a displacement amplitude of 165.7 mm. Three cyclic tests were conducted on S1−Y. In the cyclic loading test, the positive and negative peak forces for specimen 1 were 8.15 kN and −7.38 kN, respectively. When the loading displacement was between 0–22.01 mm, the deformation mainly occurred in the pipe clamp. There was slight sliding in the upper seismic connector. At the second cycle of the 83.16 mm, the load−carrying capacity was basically lost. During the 118.36 mm loading condition, the threaded rod in the lower vertical suspension support fractured, and the test ended. The test phenomena of S1−Y−C−2 and S1−Y−C−3 are similar to S1−Y−C−1.
The test photos and hysteresis curve of the specimens are shown in
Figure 11 and
Figure A1, respectively.
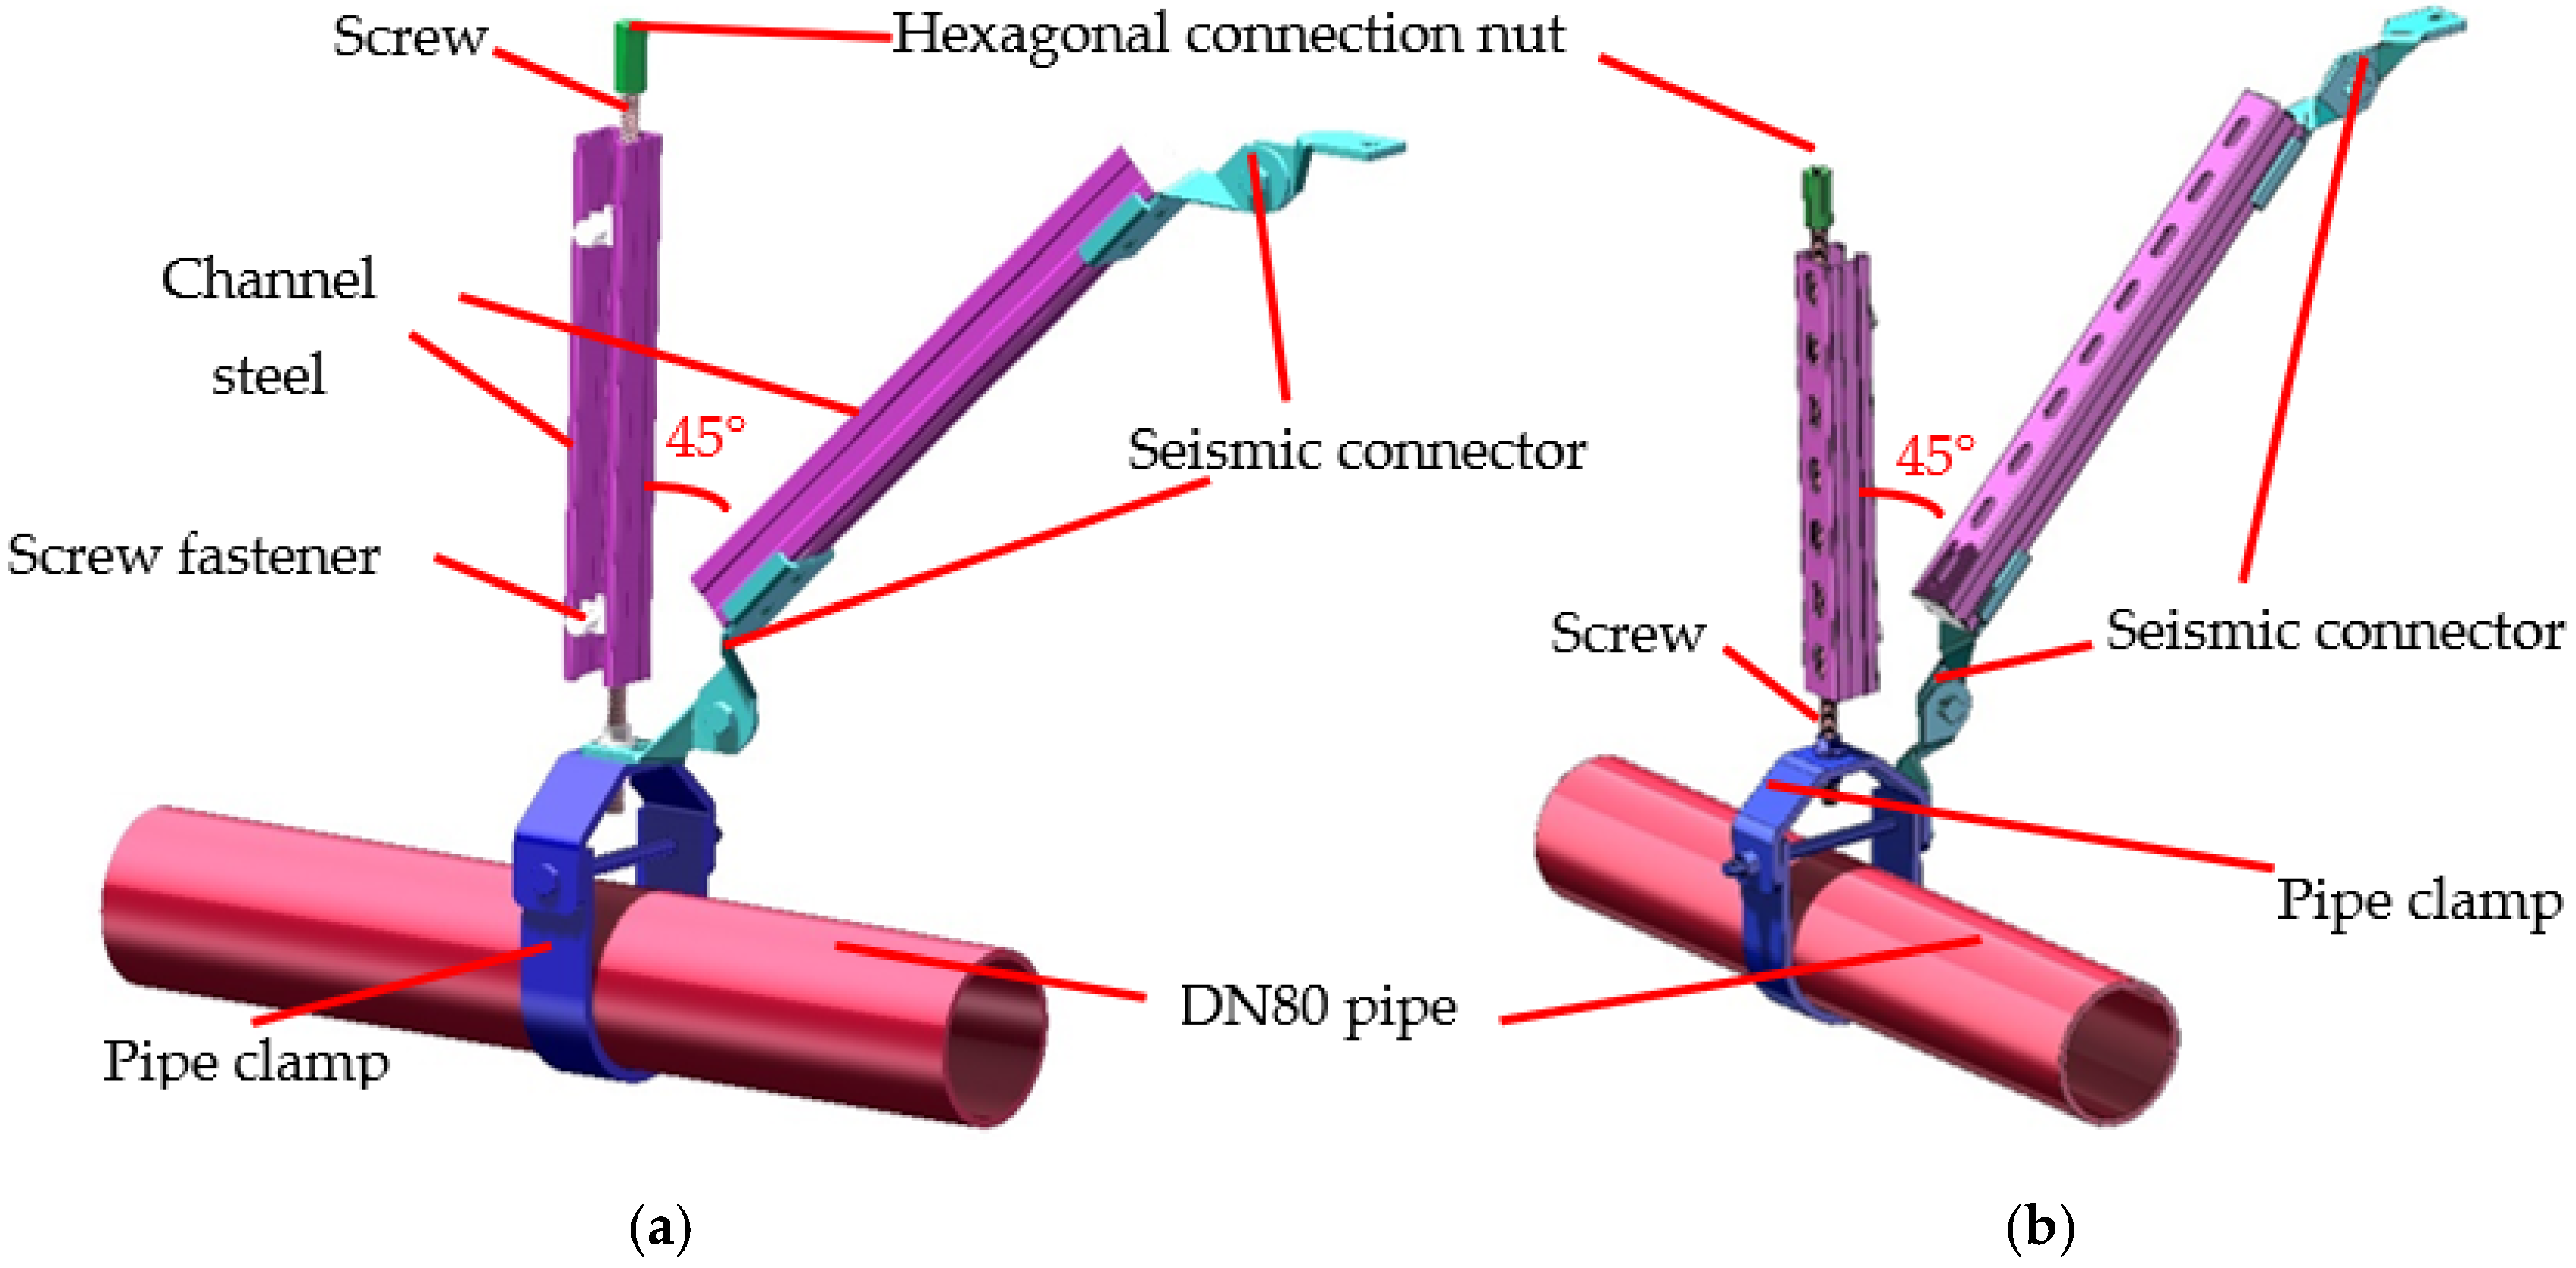
4.2. S2 Test Specimen
The clamp of the S2−X specimen does not provide basic restraining capability. Therefore, in this section, the clamp is removed for quasi−static tests of the specimen, with a quasi−static loading amplitude of 61.89 mm.
Three sets of cyclic tests were conducted on the S2−X specimen. For specimen 1, the peak positive and negative forces were 4.24 kN and −4.40 kN, respectively. When the displacement reached 16.1 mm, the upper seismic connector buckled, then the lower seismic connector began to buckle, and its deformation continued to increase in subsequent cases. Significant relative sliding occurred between the torsional shear clip of the upper seismic connector and the channel steel of the diagonal brace. At the 22.9 mm case, the pre−tensioned bolt rotated, the lower seismic connector underwent significant deformation, and it contacted the suspended support channel steel, which increased its bearing capacity. The lower part of the suspended support began to buckle and absorb energy, and the lower seismic connector underwent slight sliding. Finally, the lower seismic connector underwent out−of−plane bending, and the test ended. The test phenomena of S2−Y−C−2 and S2−Y−C−3 were similar to S2−Y−C−1, the difference is the torsional shear clip of the lower connector was pulled out, and specimen S2−Y−C−3 was destroyed.
The test photos and hysteresis curve of the specimens are shown in
Figure 12 and
Figure A2, respectively.
The quasi−static loading amplitude for specimen S2−Y is 74.46 mm. During the cyclic loading test, the maximum force of specimen 1 (S2−Y−C−1) was 3.03 kN and −4.26 kN, respectively. The pipe clamp distorted the greatest between 0 and 10 mm of loading displacement. Upper and lower seismic connectors exhibited flexural deformation as the loaded displacement increased. When the loaded displacement reached 27 mm, the vertical suspension support in the lower screw exhibited plastic deformation. During the test, the lower seismic connectors and pipe clamps that contacted the position of the lower connector slowly pulled out. The test was terminated once the bottom connector and pipe clamps at the screw were removed. Specimen 2 (S2−Y−C−2) had a maximum force of 2.80 kN, −4.58 kN, whereas specimen 3 (S2−Y−C−3) exhibited a maximum force of 2.39 kN, −4.47 kN. Comparing specimen 1 (S2−Y−C−1) to specimen 2 (S2−Y−C−2), the specimens did not demonstrate the same lower connection failure and screw connection failure.
The test photos and hysteresis curves of the specimens are shown in
Figure 13 and
Figure A3, respectively.
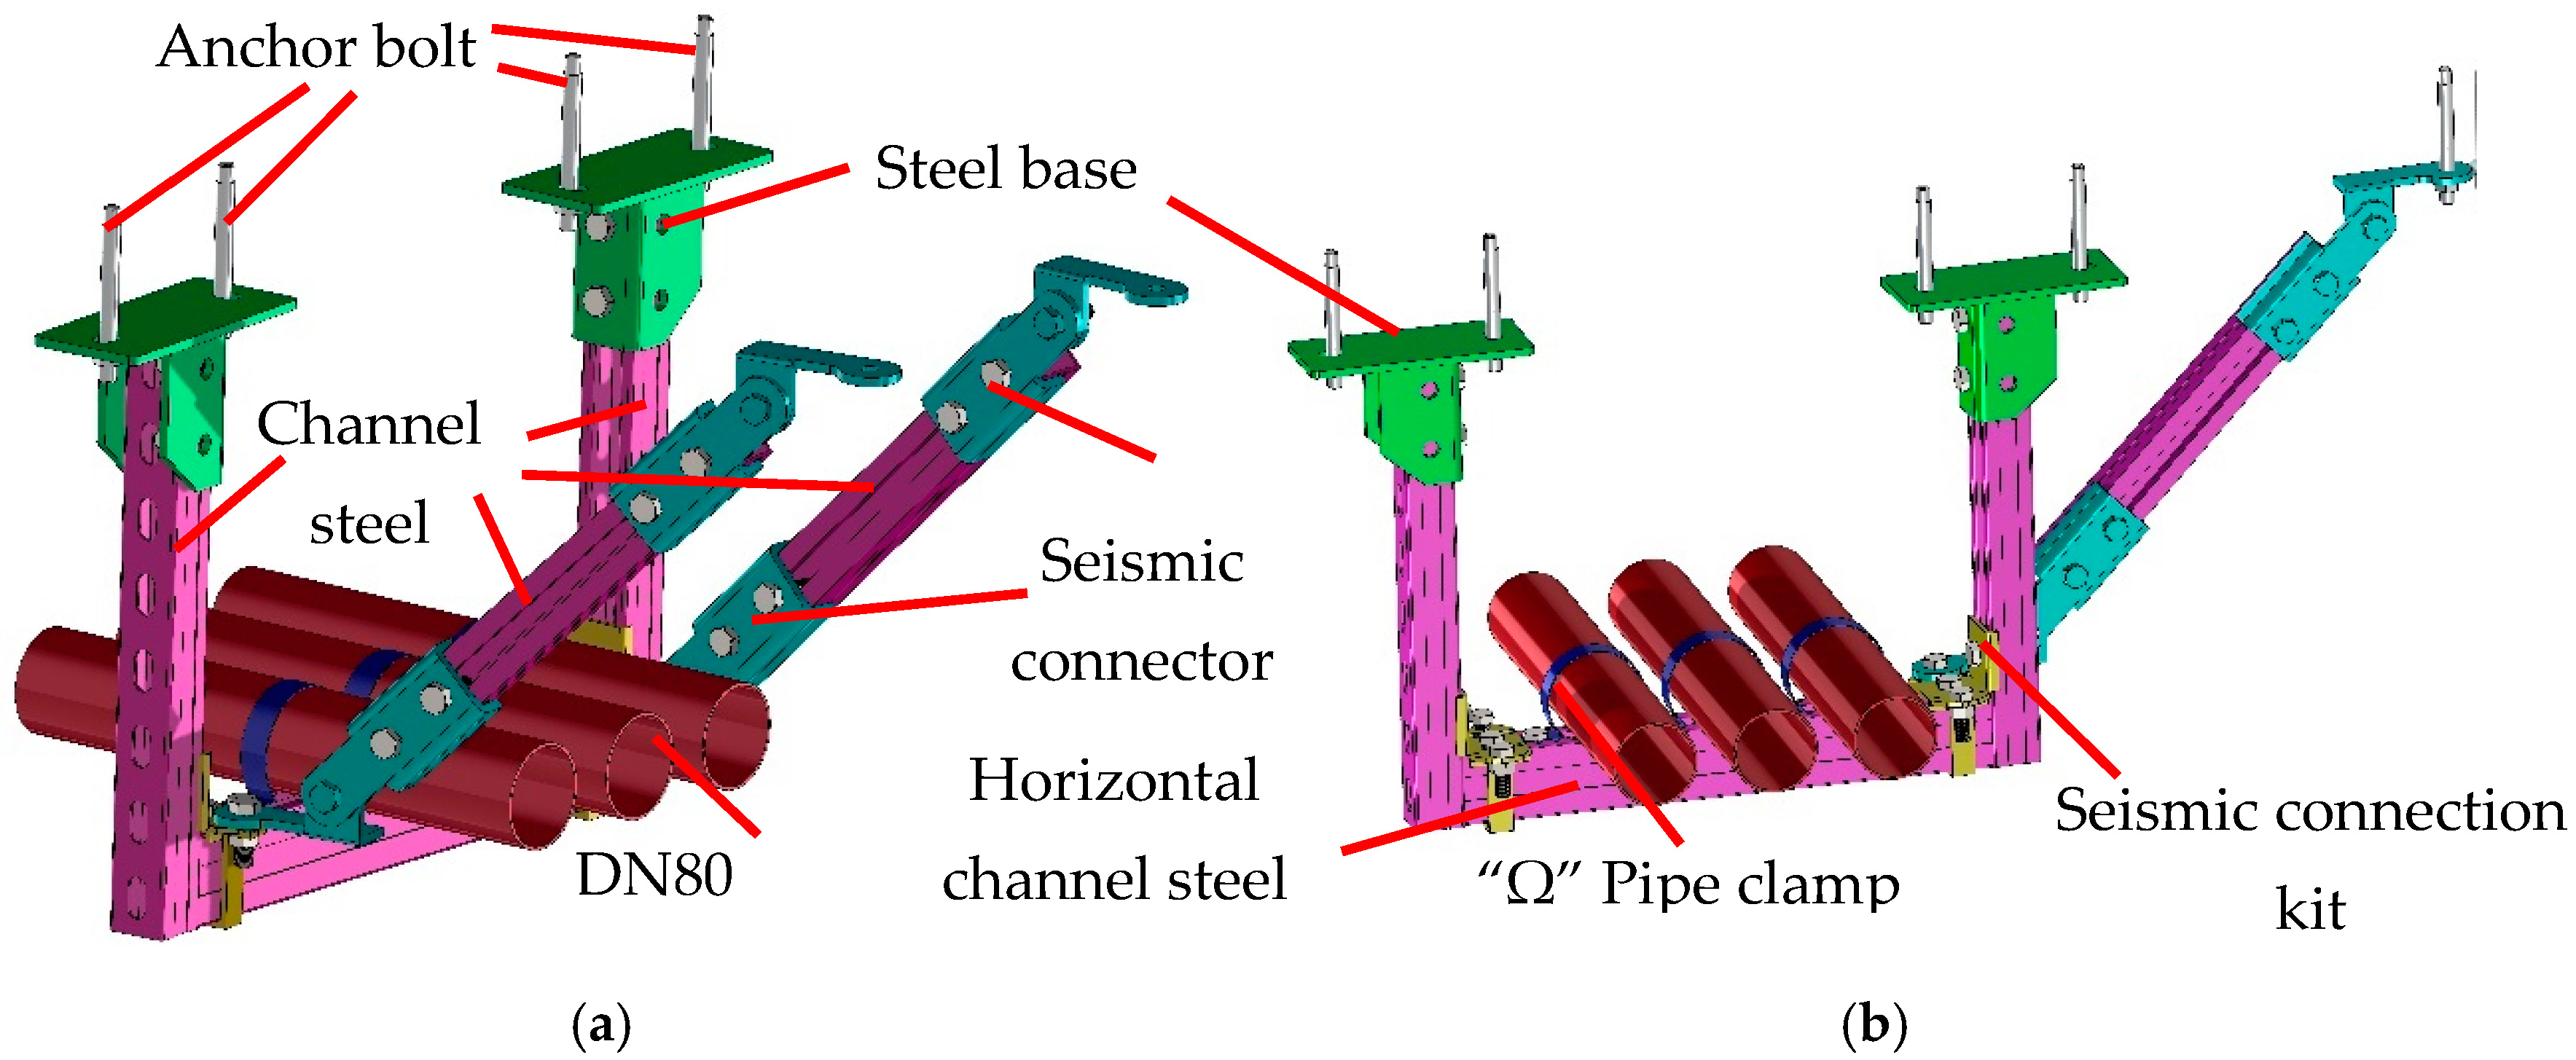
4.3. M1 Test Specimen
The M1−X specimen is a three−pipe seismic bracing, similar to the S1−X specimen. During monotonic loading tests, when the displacement reached 36 mm, the force remained basically constant at 6.3 kN as the displacement increased. Although the entire system did not fail, this type of seismic bracing was unable to limit the pipe displacement. In order to investigate the hysteretic performance and failure mode of this type of seismic bracing system, the influence of the clamp on the M1−X specimen is not considered in the quasi−static loading tests, and the displacement amplitude is set to 69.57 mm.
Three cyclic loading tests were performed on the M1−X specimen. In the cyclic loading tests, the peak positive and negative forces of specimen 1 were 22.59 kN and −24.08 kN, respectively. When the loading reached 35.72 mm, a significant rotation occurred at the hinge of the lower seismic connector. When the displacement reached 50.22 mm, the lower seismic connector on one side buckled and failed, and the test was terminated. Before the 50.22 mm case, the test phenomena of M1−X−C−2 and M1−X−C−3 were basically the same as that of M1−X−C−1; however, M1−X−C−2 and M1−X−C−3 both failed in the 69.57 mm case.
The test photos and hysteresis curves of the specimens are shown in
Figure 14 and
Figure A4, respectively.
The quasi−static amplitude of the M1−Y specimen is 73.13 mm. The peak forces of specimen 1 in the positive and negative directions were 10.82 kN and −13.44 kN, respectively. When the loading displacement was 0–19.04 mm, the deformation mainly occurred in the pipe clamp. As the loading displacement increased, in the 26.7 mm loading case, the torsional shear clip began to slide, and the pre−tensioned bolts of the lower seismic connector began to rotate. In the 52.3 mm case, the pipe clamp underwent severe deformation. When loaded to 73.13 mm, the seismic connector of the lower part of the diagonal brace buckled and bent out of plane, and the test ended. The test phenomena of the last two sets of specimens were basically the same as that of M1−Y−C−1, and all resulted in the buckling of the seismic connector in the diagonal brace, causing a decrease in bearing capacity.
The test photos and hysteresis curves of the specimens are shown in
Figure 15 and
Figure A5, respectively.
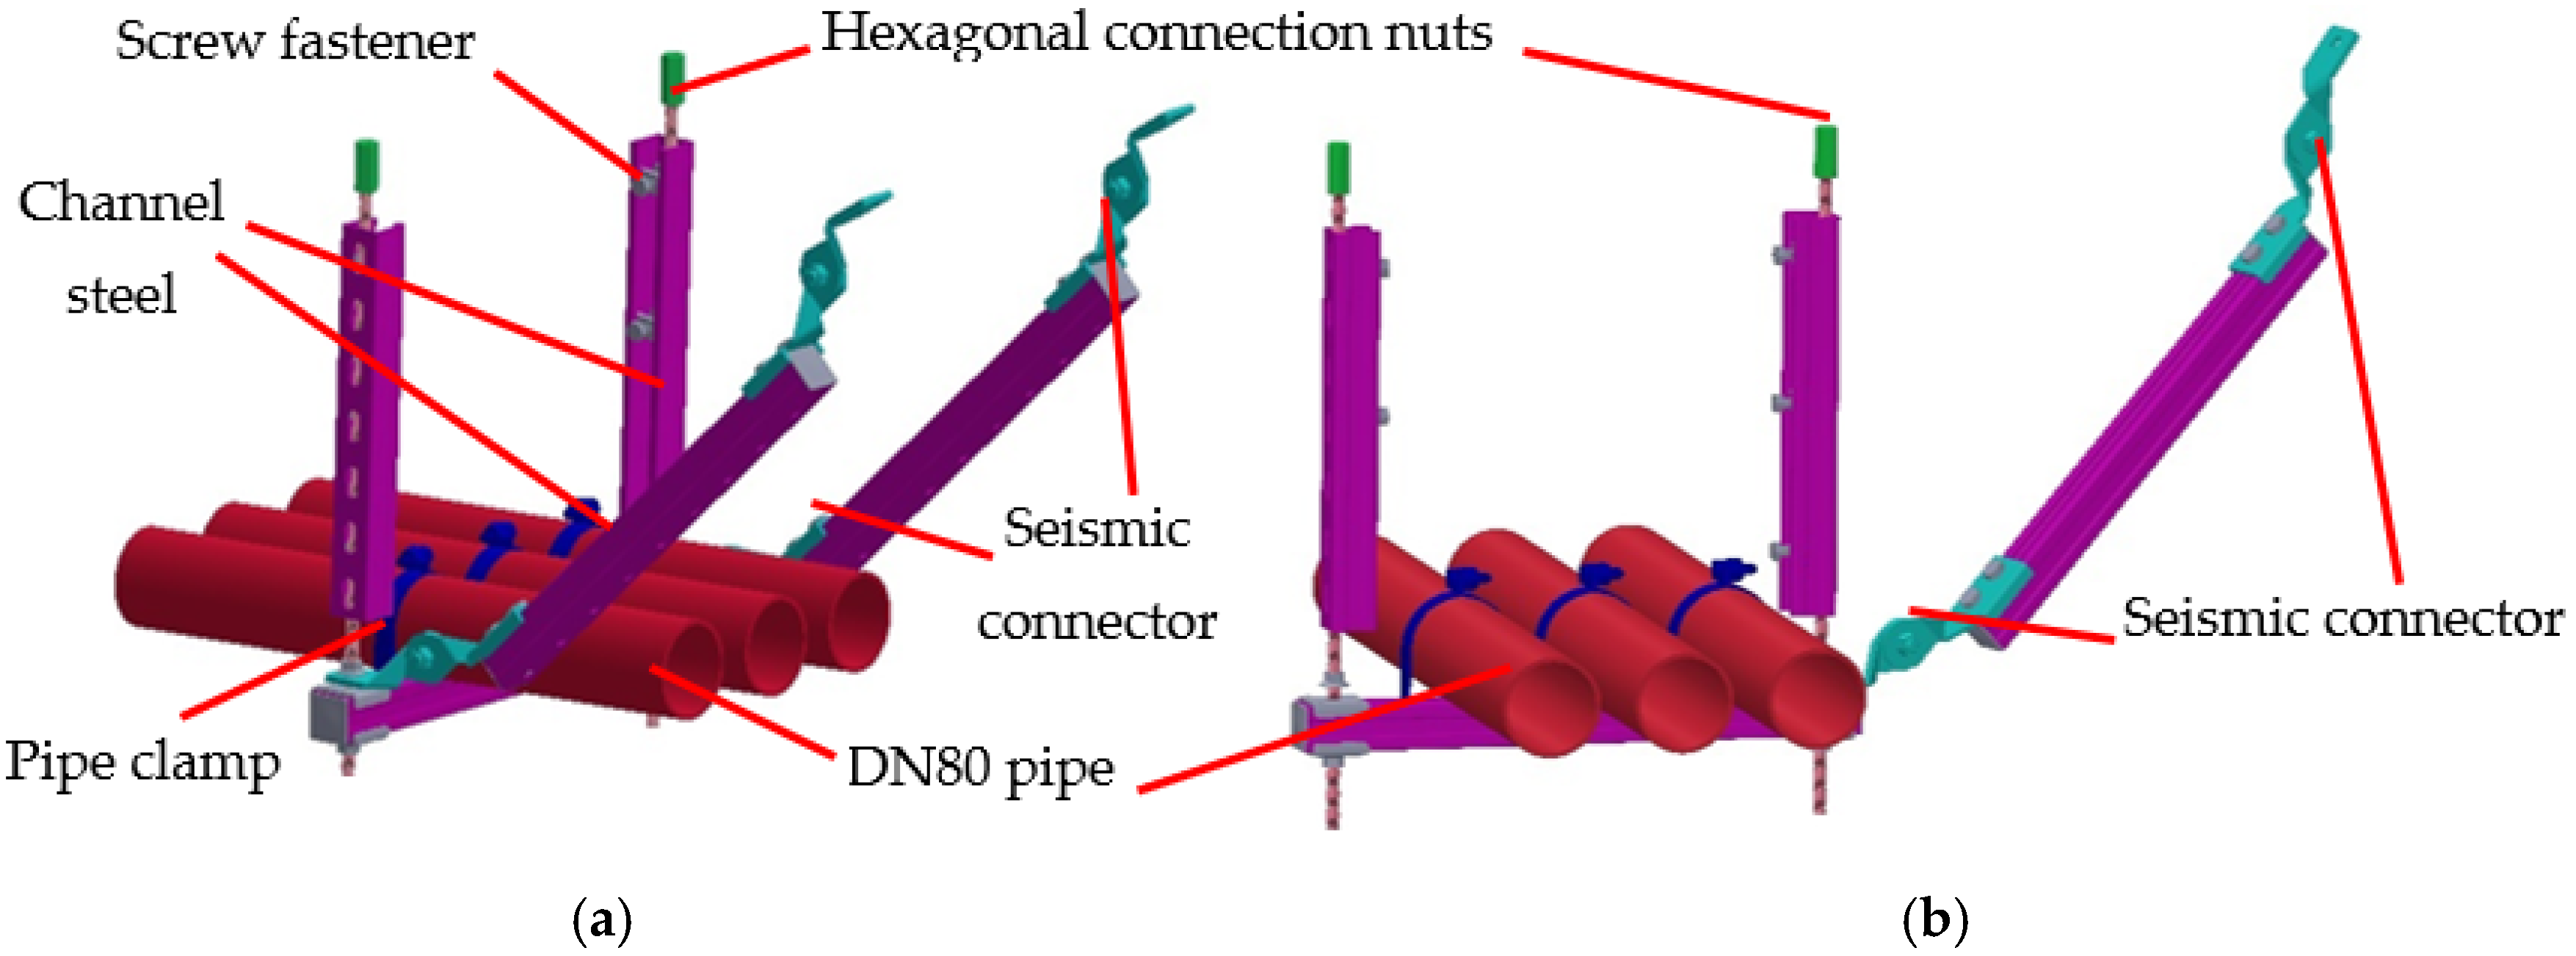
4.4. M2 Test Specimen
The quasi−static loading displacement amplitude of M2−X is 155.0 mm. Three cyclic tests were conducted on M2−X. For M2−X−C−1, the peak positive and negative forces were 8.68 kN and −9.67 kN, respectively. At the beginning of the test, all parts except for the lower seismic connector began to cooperate to dissipate energy. As the displacement increased, the upper seismic connector and the horizontal channel steel deformed more and more. When loaded to 40.4 mm, the lower seismic connector began to yield and dissipate energy. In the next test cycle (56.5 mm), the pre−tensioned bolt of the lower seismic connector started to rotate and undergo significant deformation, while the torsional shear clip of the upper seismic connector and the channel steel underwent minor relative deformation. Finally, the specimen failed at the 155 mm displacement case, with the pipe and clamp connection failing and the bearing capacity rapidly decreasing. Significant permanent deformation of the horizontal channel steel was observed during the test.
For the specimens M2−X−C−2 and M2−X−C−3, the test phenomena were basically the same as that of M2−X−C−1.
Figure 16 displays the photograph of the specimen during the test, and
Figure A6 shows the hysteresis curve of the specimen.
The M2−Y test specimen was subjected to quasi−static test with a displacement amplitude of 135 mm. The maximum positive and negative peak loads for specimen 1 were 5.63 kN and −5.90 kN, respectively. When the loading displacement was 0–17.9 mm, the main energy dissipation was due to the deformation of the pipe clamp and the buckling of the upper seismic connector. At the loading case of 25.1 mm, the upper part of the channel steel in the diagonal brace contacted the top steel plate, and the lower seismic connector began to undergo small deformation. At the loading case of 68.88 mm, the lower seismic connector had undergone significant deformation and began to undergo out−of−plane bending, and the bearing capacity started to decrease. Finally, at the loading case of 96.4 mm, the lower seismic connector disconnected from the vertical suspension support screw, and the specimen was destroyed, ending the test.
The test phenomena for the last two groups of specimens were different from that of M2−Y−C−1. For M2−Y−C−1, the out−of−plane displacement of the lower seismic connector occurred at 68.88 mm; however, for M2−Y−C−2 and M2−Y−C−3, buckling and decreased bearing capacity occurred when loaded to 49 mm.
The test photos and hysteresis curves for the specimens are shown in
Figure 17 and
Figure A7, respectively.
5. Seismic Performance Comparison of Various Specimens
NSC seismic design, as one of the important research topics in the field of scientific and integrated sustainable development, can ensure the functionality of building structures during natural disasters such as earthquakes, thereby safeguarding people’s lives and property and contributing to post−earthquake seismic relief efforts. Seismic research on NSCs is important to human sustainable development. The water supply pipeline system, as an important NSC, plays a significant role in ensuring the integrity of building functionality. The following experimental results were discussed and analyzed.
5.1. Fragility Theory
Fragility refers to the likelihood that a component or system would suffer damage beyond a predetermined damage state when exposed to seismic events of varied intensities. Typically, this probability is assumed to follow a log−normal distribution. The FEMA P−58 [
24] document describes the specific methodology of fragility analysis. Fragility function can be expressed as:
where
is the cumulative function of the standard normal distribution; m is the number of specimens.
and
are calculated using Equations (2) and (3), respectively:
where
and
are the mean value of engineering demand parameters (EDPs) and its logarithmic standard deviation, respectively. M is the total number of specimens considered.
i represents the sample number.
is the specific value of the EDPs associated with the damage of specimen i.
is the correction factor of
, which can be assumed to equal 0.25 if all specimens have the same loading process.
5.2. Engineering Demand Parameters
It is generally important to specify a variety of EDPs to aid in the performance−based design and seismic hazard evaluation of NSCs. On the basis of the structural component theory of the Standard for Seismic Test of Buildings JGJ/T 101−1996 [
25], the EDPs can be calibrated using monotonic and cyclic loading tests of seismic bracing.
In the previous literature, some scholars used the ductility factor as an engineering demand parameter to calculate the fragility of pipeline systems. Whereas the ductility factor usually indicates the deformation capacity of the system, and the bearing capacity which is closely related to the performance of the pipeline systems was not considered. In order to simultaneously improve the bearing capacity and deformation capacity of the seismic bracing, this study selects the area under the cyclic envelope at a displacement value in the cyclic test (E, shown in
Figure 18) as the engineering demand parameter for seismic bracing. The GB 50011−2010 code [
26] highlights that the seismic fortification objectives of non−structural components are coordinated with the three−level fortification objectives of the main structure, allowing the damage of non−structural components of the building to be slightly greater than the main structure but not life−threatening. The three−level fortification objectives are, respectively, “frequent earthquake is not damage, fortification earthquake is repairable, and rare earthquake is not collapse”. Therefore, the component can be divided into three damage levels, which correspond to the three performance objectives in the specification.
(1) The components basically remain elastic without damage. Since JGJ/T 101−1996 (1997) defines cracks in concrete as the beginning of the specimen to enter the yield state, which obviously does not apply to non−structural components, this article quotes FEMA P−795 (2011) to define the displacement value corresponding to the first reaching 0.4 times of the peak force as the yield displacement Dy, and the corresponding component envelope curve area at the yield displacement is related to DL 1 (damage level). The corresponding EDPs is E1.
(2) The component is partially elastic−plastic, but can be repaired by replacing accessories. Generally, in the cyclic loading test, when the test piece reaches the peak force, the existing fittings in the component appear partially elastic−plastic, so the displacement value corresponding to the peak force (DFmax) is taken as the key parameter to evaluate whether the test specimen reaches DL 2. The corresponding EDPs is E2.
(3) The reduced bearing capacity of the components can not completely guarantee the safety of human life. According to JGJ/T 101−1996, when the bearing capacity of the component is reduced to 0.85 times of the peak force, it is judged that the member is seriously damaged. Therefore, the deformation corresponding to 0.85 Fmax within the range after the peak value can be defined as the ultimate displacement Du. By determining the displacement value, the corresponding energy value can be solved. The corresponding EDPs is E3.
Because the envelope curve contains positive peak force and negative peak force, the smaller of the absolute value of the peak force is taken as the actual bearing capacity of the component in this paper. The yield displacement, the displacement corresponding to the peak force, and the ultimate displacement mentioned above all correspond to the actual bearing capacity area of the component.
5.3. Fragility of Test Specimens
In this section, the fragility of various specimens to damage will be studied using the EDP determined in the previous section.
For example, the fragility study of S1−X was conducted in accordance with the FEMA P58 fragility theory, with the resulting engineering criteria listed in
Table 2. As mentioned in
Section 5.2, if the performance objective of “no damage in frequent earthquake” is attained, the energy value is 15.90 J. Similarly, if the performance objective of “repairable in fortification earthquake” and “no collapse in the rare earthquake“ are attained, the energy values are 165.07 J and 275.55 J, respectively.
Figure 19d demonstrates the relationship between energy and the probability of exceeding the energy capacity.
The peak force parameters of the S1 specimens are shown in
Table 2, and the fragility calculation parameters are shown in
Table 3 (
are the mean value of engineering demand parameters). The peak force parameters of the S2, M1, and M2 specimens are shown in
Table 4,
Table 5 and
Table 6, with fragility parameters shown in
Table 3. The fragility curves of specimens S1−X to M2−Y are shown in
Figure 19a–h.
5.4. Performance of Various Specimens
According to the test information obtained above, this section summarizes and evaluates the bearing capacity of the above types of test specimens, the engineering demand parameters corresponding to each damage level, the damage mode of the components, and the evaluation of the components (
Table 7). Finally, the disadvantages of various test specimens in the test are analyzed and some suggestions for improvement are put forward.
For example, the bearing capacities of the S1−Y and S2−Y specimens are far greater than that of the S2−Y specimens. When the damage state of the component reaches DL 1, the corresponding engineering demand parameters of S1−Y and S2−Y specimens are 26.74 J and 3.45 J, respectively. It can be seen that the performance of the S1−Y specimens is much better than that of the S2−Y specimens. The bearing capacity of the S2−Y test specimen is too low and the seismic connector can easily fall off.
The above table summarizes the bearing capacity and deformation capacity of various test specimens, and analyzes the advantages and disadvantages of various test specimens. The following improvement suggestions are proposed to address the problems exposed by the test results:
(1) For the S1−X and M1−X specimens, the seismic bracing itself has a strong bearing capacity, but the connection between the pipes and the pipe clamp is weak and is very easy to damage. Therefore, it should be strengthened by improving the connection strength between the pipe clamp and the pipe.
(2) For the S2−X specimens, due to design defects, the restraint capacity of the pipeline is basically absent. To solve this problem, the solution shown in the
Figure 20 is proposed in this paper.
(3) S2−Y, M2−X, and M2−Y specimens exposed the problem of low initial stiffness of seismic connections in the test, resulting in lower bearing capacity than the S1 and M1 specimens. The hinges in the seismic connections used in the S2 and M2 specimens form an angle by themselves. Long distances may cause the pre−tensioned bolts in the seismic connector to rotate very easily and lead to the specimens being prone to out−of−plane deformation, which leads to further damage to the specimens. It is recommended that seismic connections be shortened and made appropriately thicker. Secondly, the gap between the lower seismic connector and the pipe clamp or the screw connection can easily lead to the separation of the seismic connector from the vertical suspension. It is recommended that this gap be eliminated.
6. Conclusions
This paper conducted a total of 34 sets of monotonic and cyclic loading tests on four types of seismic bracing systems in important buildings and analyzed the fragility of various seismic bracing types based on the test results. The conclusions obtained are as follows:
(1) Except for the S1−Y test specimen, other test specimens did not lose the vertical bearing capacity at the end of the test.
(2) Although some issues still exist in determining the engineering demand parameters (EDPs) for seismic bracing discussed in previous studies, this paper discusses the EDPs used in the pipeline system and takes the envelope area of the force and displacement envelope curve at a certain displacement value obtained from the cyclic loading test that can comprehensively reflect the bearing capacity and ductility of the components as the engineering demand parameters. This study matched the performance target specified by the Chinese code for non−structural components, and took the yield displacement, the displacement corresponding to the peak force, and the energy value corresponding to the limit displacement as the representative values of the three types of damage levels, respectively, to analyze the fragility of the pipeline system.
(3) Due to the reasonable design of the S1 and M1 specimens, including diagonal bracing and seismic connectors, the S1 and M1 specimens are generally stronger than the S2 and M2 specimens, including the properties of bearing capacity and energy dissipation capacity. For example, the peak bearing capacities of the S1−Y and S2−Y test specimens are 7.27 kN and 2.74 kN, respectively. When the test specimen reaches the DL 1 failure level, the engineering demand parameters (energy value) are 3.45 J and 26.74 J, respectively. It can be seen that the seismic connectors play a vital role in the seismic performance of seismic bracing.
(4) Although the seismic bracings of the S1−X and M1−X test specimens have strong bearing capacity, the connection between the pipes and the pipe clamps is extremely weak. The connections between the pipes and the pipe clamps of the S1−X and M1−X test specimens are damaged when they reach 2.4 kN and 6.3 kN, respectively. It is necessary to focus on improving this problem in order to strengthen the force transmission mode between pipes and pipe clamps or continue to increase their friction. There are still some problems in the practical application of the seismic connectors used for the S2 and M2 test specimens. For example, the connection position of the lower seismic connector and the suspension screw is designed with a gap for convenient installation, but the gap easily causes the seismic connector and the vertical suspension screw to fall off during extremely adverse conditions. In addition, the S2 and M2 seismic connectors easily rotate and loosen at the pre−tensioned bolts, which leads to the yielding of the seismic connectors. These problems are the result of the overall low bearing capacity of these seismic bracing systems. It is recommended to shorten the manufacturing length of the seismic connectors of this type of test specimen and optimize its force transmission path, thus achieving better seismic effect.
(5) Expansion of the NSC fragility database may make the resilience assessment of important buildings more accurate after earthquakes.


