Article

An Analysis of Rural-Based Universities’ Faculty Members’ Satisfaction with E-Learning: The Case of Developing Countries

Department of Mathematics, Science and Technology Education, Faculty of Education, University of Zululand, Richards Bay 3900, South Africa
*
Authors to whom correspondence should be addressed.
Sustainability 2023, 15(12), 9522; https://doi.org/10.3390/su15129522
Submission received: 25 April 2023 / Revised: 2 June 2023 / Accepted: 8 June 2023 / Published: 14 June 2023

Abstract

:
The COVID-19 pandemic brought about considerable detrimental effects on higher education, especially in developing countries. Ironically, it also contributed positively towards one sustainable development goal (SDG4) through advancement in technology, particularly the implementation and use of digital technology among academics and students. This study focused on the analysis of rural-based universities’ faculty members’ satisfaction with e-learning by seeking answers to two research questions: (1) what are the factors that influence faculty members’ satisfaction with e-learning, and (2) is there a significant difference between instructors’ and students’ satisfaction with e-learning? A combination of the expectation confirmation model (ECM) and the technology acceptance model (TAM) was employed to develop the users’ satisfaction model (USM). A survey design was used in which quantitative data were gathered using a 7-point Likert scale questionnaire. The data were analysed using partial least squares–structural equation modelling, with the help of SmartPLS3. The results showed that 81.9% of the variance in faculty members’ satisfaction with e-learning can be attributed to the seven factors of the model. Multigroup analysis also showed that the USM may be used to predict and explain faculty members’ subgroups’ satisfaction with e-learning.

1. Introduction

Unquestionably, the COVID-19 pandemic has had a significant and global impact on social, economic, and cultural life. Most industries, including higher education, were severely impacted, except for essential services such as healthcare, military, and policing. The higher education sector experienced significant challenges due to the pandemic, causing adverse impacts [1], but this has also contributed towards the sustainable development goals (SDGs), particularly in developing nations. These circumstances provided a critical window of opportunity for the reformulation of higher education teaching, particularly with the implementation and use of digital technology among academics and students [2]. By using digital technology in education, developing countries can fulfil SDG 4, which calls for “ensuring inclusive, equitable, and quality education and promoting opportunities for lifelong learning for everyone” [3]. Digital technology can help to increase access to education [4], especially for people living in remote or underserved areas. Online learning platforms, educational applications, and other digital tools can provide educational resources to anyone with an Internet connection regardless of their location [3]. Moreover, digital technology can help to improve the quality of education by providing interactive and engaging learning experiences [3]. Furthermore, digital technology can help to promote inclusivity by making education more accessible to students with disabilities [4]. Assistive technologies such as screen readers, speech recognition software, and closed captioning can help to remove barriers to learning for students with disabilities. Additionally, digital technology can help to promote lifelong learning by making education more flexible and accessible [5]. Online courses and self-paced learning modules can allow people to continue learning throughout their lives, even after they have completed formal education [3].
Without warning or training sessions, lecturers and students were forced to abruptly convert from face-to-face to e-learning [6,7]. This abrupt change led universities in developing countries that had previously resisted or been sceptical about e-learning to adopt it [1]. For most developing countries, the COVID-19 pandemic provided a chance to advance sustainable teaching and learning in higher education through e-learning. E-learning is viewed as the future of education and has established itself in higher education to support face-to-face instruction and encourage self-directed learning [6,8]. It has therefore become a fundamental component of higher education systems in developing countries [8]. Furthermore, universities in developing countries have realised the benefits that e-learning brings; therefore, it should continue to be used even after the pandemic [7].
However, whether universities in developing countries will continue using e-learning after the pandemic or not has yet to be seen. While initial acceptance is critical for the success of any information system [9], its long-term viability and ultimate success depends more on continued use than on initial adoption. Post-adoption intentions of users are the critical indicators of e-learning success [7,10]. User satisfaction and continuous use of the system are good measures of system success [11]. Studies suggest that user satisfaction is a crucial factor that determines the continuous use of educational technologies, with satisfaction seen as the key to attracting and retaining a foundation of devoted, long-term users of these technologies [8,12]. Based on these findings, it can be concluded that user satisfaction is essential for the continued use and success of educational technologies. Consequently, in the post-COVID-19 pandemic era, discussing how satisfied faculty members are with e-learning encourages its continued use, which in turn helps developing countries achieve their SDGs.
The universities in developing countries adopted e-learning to cover course material and continuous assessments [7]. Some of these universities’ primary goals are to provide students with worthwhile learning experiences and to increase their satisfaction [13]. Students’ satisfaction, staff members’ satisfaction, accessibility, learning efficacy, and cost effectiveness are the five pillars of excellence in e-learning [14]. As a result, faculty members’ satisfaction must be taken into account when evaluating how effective an e-learning is because it will increase levels of involvement, motivation, learning, and achievement. Additionally, faculty members’ satisfaction with e-learning is an indicator of the technology’s success [11]; yet, very few studies have focused on their satisfaction with e-learning. Previous research on e-learning has mainly focused on the technical aspects of information technology, neglecting the social and perceptual dimensions of the phenomenon [12]. In particular, the attitudes and beliefs of faculty members towards e-learning have received scant attention. However, a thorough understanding of the important factors impacting faculty members’ satisfaction with e-learning from multiple angles can assist, build, and improve e-learning environments and the effective and successful usage of these environments.
Although some researchers have investigated the factors that affect instructors’ [15,16] and students’ [17,18] satisfaction with e-learning, this approach tends to limit cross-group comparisons and overlook the potential insights that could be gained from analysing multiple groups together. As a result, the overall understanding of e-learning could be incomplete. Furthermore, rather than considering the entire ecosystem and all relevant stakeholders, previous researchers have tended to oversimplify the complex technological intervention of e-learning by focusing on a single stakeholder within the university context. It should be noted that the majority of these studies were conducted in developed countries, which limits the generalisability of the findings to developing countries. To address this gap in the literature, the present study aims to address the following research questions:
  • What are the factors that influence faculty members’ satisfaction with e-learning?
  • Is there a significant difference between instructors’ and students’ satisfaction with e-learning?

2. Literature Review

2.1. E-Learning

In broad terms, e-learning is learning facilitated and supported by information communication technologies. E-learning is defined as the use of electronic media for a variety of learning purposes that range from add-on functions in conventional classrooms to full substitution of the face-to-face meetings by online encounters [19]. E-learning can also be defined as “… technology-based learning in which learning materials are delivered electronically to remote learners via a computer network” [20]. E-learning is “… learning experiences in synchronous or asynchronous environments using different electronic devices (e.g., mobile phones, laptops, etc.) with internet access” [21]. Under these environments, students can be anywhere (independent) to learn and interact with instructors and other students. From these definitions, we can learn two main types of e-learning: synchronous or asynchronous. Synchronous e-learning is one that allows students to take advantage of real-time learning possibilities and communicate with their instructors right away in a scheduled, live virtual class using software such as Zoom, Google Meet, Microsoft Teams, etc. [19]. Faculty members need to be online at the same time. On the other hand, in asynchronous e-learning, students can learn and download pre-loaded course materials at any time [20]. Therefore, there is no requirement for faculty members to log in at the same time. In all these definitions, we can also learn that access to the Internet and devices plays important role in enabling e-learning.
Instructors consider several essential elements as necessary for e-learning, such as delivering the learning material, managing the lesson, engaging with students, motivating learners, monitoring progress, and evaluating outcomes [19]. The need to support teaching and learning online popularised e-learning in developing countries during the COVID-19 pandemic, where national lockdowns were the order of the day. Reduced education expenses, timely and high-quality information, flexible accessibility, and the versatility of education for everyone’s convenience are all benefits of e-learning that universities in developing countries realised during the COVID-19 pandemic [1,19]. By utilising modern technologies, e-learning creates passion, inspiration, motivation, and a willingness to learn [20]. Similarly, utilising e-learning in developing nations promotes continuous learning, involves students, and grants them access to educational resources they may not have [22]. This contributes to lifelong learning. Universities have also realised that through the use of e-learning, they can attain SDG4 by providing students with inclusive, equitable, and quality education [1].

2.2. Challenges of E-Learning Adoption in Developing Countries

Prior to the pandemic, developing countries were struggling to catch up with their developed counterparts in terms of e-learning adoption. Several studies have identified unsupportive government as a barrier to e-learning adoption in developing countries [17,19,23]. In Tanzania, for example, insufficient government backing and a lack of infrastructure were identified as the key barriers to e-learning implementation [23]. Similar concerns were also reported in Bangladesh [19] about the slow adoption of e-learning as linked to insufficient technological resources and the unwillingness of the government to prioritise digital transformation. The government’s ambivalent commitment to enhancing education is to blame for the country’s delayed acceptance of e-learning [17].
Some studies consider the lack of technological skills that can support e-learning as a hindrance to the adoption of e-learning [17,23,24,25]. For instance, in Yemen, one significant factor that affects teachers’ usage of e-learning in a blended learning context is their lack of experience in online education [25]. Poor teacher training is a contributing factor to the sluggish uptake of e-learning [24]. E-learning requires technology capabilities from both teachers and students, which are currently lacking [17,24,25].
Another factor limiting the adoption of e-learning in developing nations is the lack of devices and unreliable Internet access [22,25,26]. In rural areas of South Africa, most students do not have laptops and/or tablets that can support e-learning [22]. In Libya, most students have smartphones that have smaller screens and low storage capabilities, making it difficult to effectively support e-learning [26]. Erratic Internet connectivity has been blamed for the snail-pace adoption of e-learning in developing countries [25]. Additionally, in most rural areas, the Internet is too weak to download documents [22,25].
Culture and conflicts are barriers to the adoption of e-learning in developing countries [17,27]. In Nigeria, the menace of Boko Haram, ethnic crises, and clashes between herdsmen and farmers may be a stumbling block for the adoption of e-learning [17]. Additionally, different cultural backgrounds and languages contribute to the resistance of e-learning adoption [17]. These observations confirmed the results of a prior study [27] that the biggest obstacles to implementing e-learning in Tanzania include culture, uneven information literacy levels, and unfavourable e-learning environments.
Researchers studying the factors influencing teachers and students in South Africa to use technology in the classroom came to the conclusion that the attitudes of the teachers and students play a significant role [28]. The adoption of educational technologies is not entirely dependent on the technology, government support, availability of resource, and culture but also on teachers’ and learners’ attitudes towards its use [28]. Based on the challenges discussed thus far, one might draw the conclusion that developing nations should not slavishly copy developed countries’ technology adoption strategies due to the enormous technological divide, disparate attitudes, and diverse cultures.

2.3. Factors That Influence Instructors’ Satisfaction with E-Learning

Studies have shown that teachers’ satisfaction with technology in the classroom is influenced be their self-efficacy [29]. The ability of instructors to deal with technological challenges and a validation of their confidence in employing technology in their teaching have been found to be key factors in their satisfaction with the utilisation of technology [30]. Perceived usefulness and perceived ease of use were also reported to be among the factors that influence instructors’ satisfaction with e-learning [29]. These include information quality, system quality, and service quality, which all influence lecturers’ satisfaction [31].
The technology acceptance model (TAM) and the theory of planned behaviour were combined to explain lecturers’ satisfaction with e-learning [32]. The results showed that lecturers’ satisfaction with e-learning was significantly influenced by their attitude towards e-learning, subjective norms, perceived behavioural control, and e-learning system features. The expectation confirmation model (ECM) was extended to explain lecturers’ continuous use of e-learning [30]. The results showed that lecturers’ expectations, perceived ease of use, and preparedness had a direct influence on satisfaction. Culture was also found to correlate strongly with lecturer’s satisfaction with e-learning [33]. Perceived enjoyment was also reported to have a significant influence on satisfaction [32]. The effort needed to learn to use e-learning played a very important role on instructors’ satisfaction [16]. Intrinsic and subject norms had strong positive influence on lecturers’ satisfaction with e-learning [15].

2.4. Factors That Influence Students’ Satisfaction with E-Learning

In Serbia, the perceived satisfaction of students in an e-learning framework under the headings of “teacher, course, technology, and environment” was examined [34]. The study discovered that rapid teacher responses, high-quality technology, reliable Internet, a variety of assessments, and user interaction within the online environment are the key factors that significantly influence students’ satisfaction with e-learning [34]. Constructs were combined from the TAM [31,35] and information systems success model [36] to develop with a hybrid model to explain students’ actual use of the Sakai learning management model. The results showed that system quality, information quality, and service quality are antecedents of satisfaction [31].
A novel model was developed using constructs such as computer self-efficacy, metacognitive strategies, goal setting, environment structuring, and social dimension to describe students’ satisfaction with e-learning [13]. According to the findings, goal setting, environment structuring, social dimension, and metacognitive strategies are all effective predictors of student satisfaction [13]. Computer self-efficacy was found to not have a direct effect on students’ satisfaction [13]. Students’ satisfaction was found to be well predicted by perceived attitude towards e-learning, perceived usefulness, confirmation, achievement value, intrinsic worth, perceived social impact, utility value, perceived simplicity of use, and task–technology fit [37].
To explain students’ continuous use of e-learning, the ECM with the constructs of the TAM and the theory of planned behaviour was extended [38]. The findings corroborated another study [9] that indicated that consumers’ satisfaction with an information system is predicted by confirmation and perceived usefulness [38]. The ECM was also extended to explain student nurses’ continuous use of blended e-learning [39]. The findings revealed that information quality, system quality, support service quality, and instructor quality all significantly contribute to perceived usefulness, confirmation, and flow, which together explain nurses’ satisfaction with the use of the blended e-learning system [39].

2.5. Difference between Instructors’ and Students’ Satisfaction with E-Learning

During the COVID-19 pandemic in South Korea, the ECM was extended to explain instructors’ and students’ satisfaction with e-learning [10]. The researchers added constructs such as risk perception, social distancing intention, social distancing attitude, and attitude toward the ECM. The results showed that there was a significant difference between instructors’ and students’ path coefficients on the following paths: risk perception to satisfaction, social distancing intention to satisfaction, and perceived usefulness to satisfaction [10]. The study found no significant difference between students’ and instructors’ path coefficients on the following paths: confirmation to satisfaction and attitude to satisfaction [10].
In another study [37], a qualitative approach was used to find factors that influence instructors and students to continue utilising e-learning. The results indicated that the main factors influencing the instructors’ satisfaction with e-learning are information quality, task–technology fit, system quality, confirmation, usefulness, attainment value, and utility value. The students’ satisfaction was influenced by information quality, task–technology fit, system quality, utility value, and ease of use. Since the study was qualitative in nature, it was not possible to establish if there was any significant difference between students’ and instructors’ satisfaction.

3. Theoretical Framework

This study used a combination of the ECM and the TAM to explain faculty members’ satisfaction with e-learning. Some of the constructs used to extend this combination were also borrowed from the information systems success model and the community of inquiry theory. Such combinations were meant to strengthen the explanatory power of the developed model in this study.

3.1. Expectation Confirmation Model

The ECM was developed to explain users’ continuous use of information systems. The model is composed of four constructs, namely perceived usefulness, confirmation, satisfaction, and continuous use intention [9]. Confirmation is defined as “users’ perception of the congruence between expectation of online banking division use and its actual performance” [9]. Perceived usefulness is defined as “users’ perception of the expected benefits of online banking division use” [9]. Satisfaction is described as “users’ affect with (feelings about) prior online banking division use”, while continuous use intention was described as “users’ intention to continue using online banking division” [9]. The ECM posits that confirmation predicts satisfaction and perceived usefulness. Perceived usefulness has a direct effect on continuous use intention and satisfaction. Satisfaction is an antecedent of continuous use intention.
This study used the ECM because it was confirmed by prior studies to be robust in explaining users’ satisfaction and continuous use intention in different contexts [6,8,9,10,13]. For example, Ansong-Gyimah [8] extended the ECM to explain students’ satisfaction and continuous use intention of Google Classroom. Bhattacherjee [9] used the ECM to explain users’ continuous use intention of online banking division. Jo [10] and Puška and Puška [13] used the ECM to explain students’ satisfaction and continuous use of e-learning. The ECM was also used to explain users’ satisfaction and continuous use of online learning [6]. The ECM also offers the foundations for post-adoption behaviour, into which context-related constructs can be incorporated to create context-related models, which can be used to explain users’ satisfaction and continued use of the technology in question [7,38,40].

3.2. Technology Acceptance Model

The TAM was developed to explain an individual’s acceptance of an information system [35]. Actual use, behavioural intention, perceived attitude, perceived usefulness, and perceived ease of use are the five primary constructs that make up this framework [35]. The two fundamental pillars (perceived usefulness and perceived ease of use) of users’ acceptance of a new technology are influenced by outside factors [22]. The TAM does not provide these external variables. The TAM is considered robust and is the most-used model to explain the pre-acceptance behaviour of users towards a new system [22,28].

4. Conceptual Framework

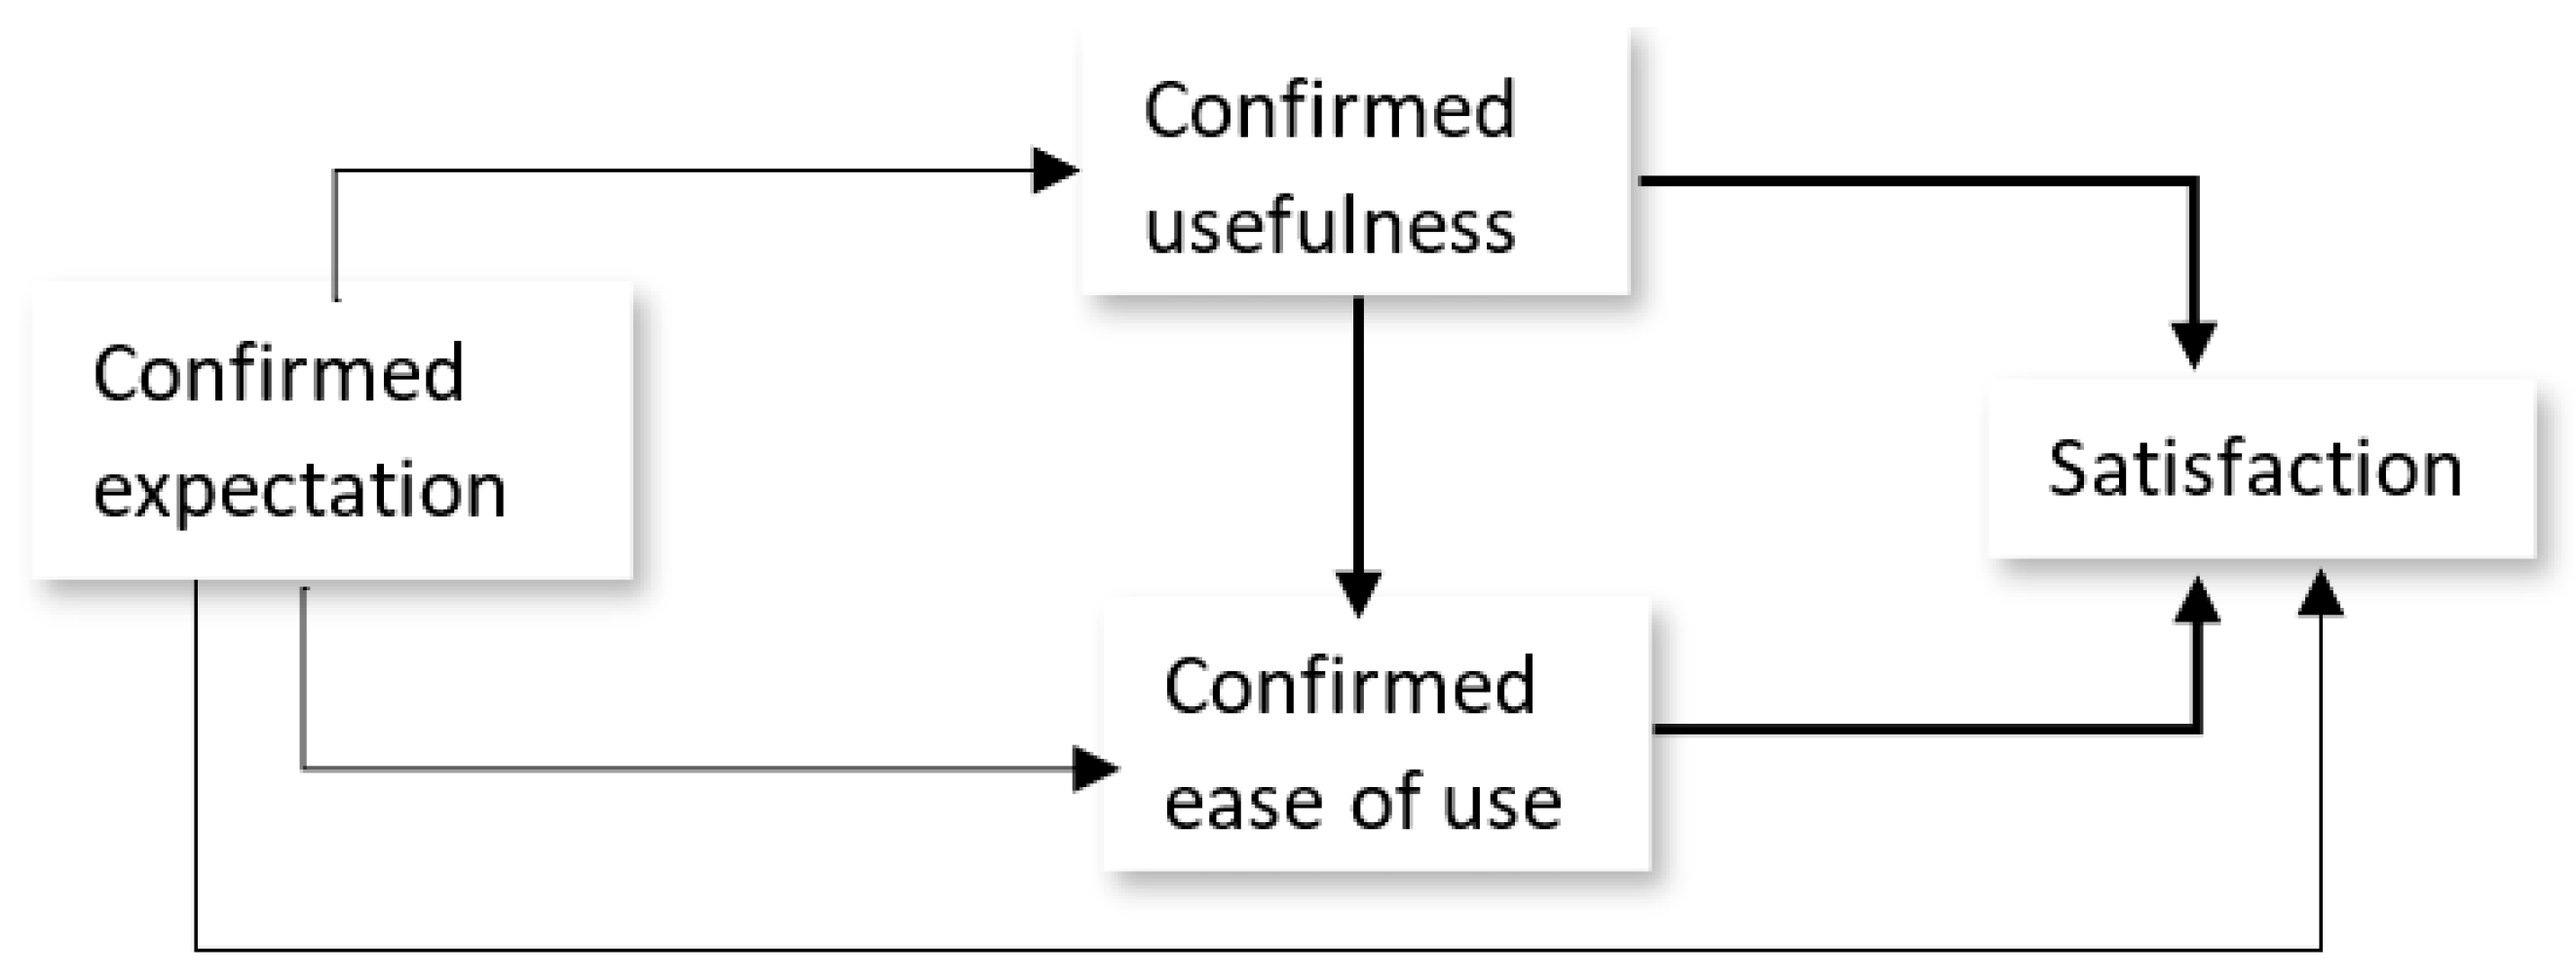
This study is based on a hypothesised model called the user satisfaction model (USM), which is based on the combination of the ECM and the TAM. However, the construct of continuous use (found in the ECM) is not included in USM because the goal of the USM is to explain users’ satisfaction and not their continuous use. From the ECM, this study adapted perceived usefulness and satisfaction. However, our point of departure is the construct confirmation found in the ECM. In our hypothetical model, i.e., the USM (Figure 1), the construct confirmation (found in ECM) is replaced by a number of pre-adoption factors. These pre-adoption factors are selected TAM variables, namely perceived ease of use and perceived usefulness, together with some external factors.
In making a decision, i.e., either a positive or negative confirmed expectation, users go through the following five steps: First, prior to use, users of educational technologies establish their initial expectations for a given tool (perceived expectation). Initial expectation offers the baseline, which users again evaluate to determine their evaluative response. Second, they put the technology to work for a while. Third, they form a perception of what the system can actually deliver (actual “performance”). Fourth, they make a comparison between what they had expected (perceived expectation) and what the educational technology actually provides (actual “performance”). The response might be positive, neutral, or negative. For instance, students have expectations on how well the e-learning system functions (perceived system quality expectation). After using e-learning for some time, they develop a perception of the quality of the system (actual system quality). If the actual system quality is better than their perceived expectations, then there is a positive confirmed system quality; otherwise, there is a negative confirmed system quality.
Positive confirmed system quality = actual system quality—perceived system quality expectations (where actual system quality > perceived system quality expectations), and the opposite is true.
Fifth, the level of confirmed expectation influences the usefulness, ease of use, and satisfaction with the educational technology.
This study proposed that the USM is comprised of four constructs: confirmed usefulness (post adoption), confirmed ease of use, confirmed expectations (external factors), and satisfaction. In this study, the construct of confirmed expectations (Figure 1) was replaced by specific confirmed context-related pre-adoption factors, namely confirmed institutional support, confirmed social presence, confirmed teaching presence, confirmed system quality, and confirmed cognitive presence. The USM posits that confirmed expectations influence confirmed ease of use, confirmed usefulness, and satisfaction. Confirmed ease of use positively influences confirmed usefulness, and they both have a direct effect on satisfaction. Figure 1 depicts the USM.

4.1. Confirmed Usefulness

Confirmed usefulness is defined as faculty members’ belief that e-learning improves their performance. Confirmed usefulness emphasises the instrumentality of e-learning use. Prior studies confirmed the positive influence of post-acceptance perceived usefulness (confirmed usefulness) on satisfaction [9,11,38]. This study postulates that faculty members will have a positive confirmed usefulness, which will influence their satisfaction. Therefore, we hypothesise the following:
H1. 
Confirmed usefulness positively influences satisfaction.

4.2. Confirmed Ease of Use

In this study, confirmed ease of use is defined as the degree to which a faculty member perceives using e-learning to be free of cognitive effort. The lesser the effort needed to learn to use the system, the higher the degree of adoption [35]. Although the effort required to utilise the system is a barrier to its adoption, views of perceived ease of use will only be well formed after actual use [41]. Before having any hands-on experience, users’ views of ease of use could be tied to a variety of basic ideas about using computers [22]. After having a direct experience, one’s judgments of the ease of use of the system would be modified to take into account the experience [16]. One study found a positive influence of post-acceptance perceived ease of use on satisfaction [42]. If e-learning systems are complicated, faculty members may choose not to use them even if they perceived them useful. This study posits that confirmed ease of use influences satisfaction and confirmed usefulness of the system. Therefore, we hypothesise the following:
H2. 
Confirmed ease of use positively influences satisfaction.
H3. 
Confirmed ease of use positively influences confirmed usefulness.

4.3. Confirmed Institutional Support

Confirmed institutional support is defined as a faculty member’s belief that the institution has the infrastructure and technical help to facilitate the usage of e-learning. The infrastructure that institutions need to support e-learning includes fast and reliable Internet connection (Wi-Fi), backup generators (in case there are electricity interruptions), and devices such as laptops and computers that can support e-learning. This is viewed as a crucial part of one’s ability to control the use of information systems. Intention and the usage of information system are frequently theorised to be directly impacted by institutional support [41]. However, prior research indicates that the impact of various beliefs (such as attitudinal, normative, and control beliefs) may overlap and influence those various beliefs [41]. In cases where the facilitating factors function as an inhibitor, it can be hypothesised based on dissonance theory [43] that people may modify their attitudes adversely to be compatible with that situation. Contrarily, if resources are sufficient, people are likely to adopt a positive attitude because there is less disincentive to engage in the behaviour [43]. Studies have confirmed the positive effect of institutional support on post-adoption usefulness [11] and satisfaction [41]. This study posits that faculty members’ confirmed institutional support influences their satisfaction and confirmed usefulness. Therefore, we hypothesize the following:
H4. 
Confirmed institutional support has a positive influence on satisfaction.
H5. 
Confirmed institutional support has a positive influence on confirmed usefulness.
H6. 
Confirmed institutional support has a positive influence on confirmed ease of use.

4.4. Confirmed System Quality

System quality refers to how well an information system functions as a whole [36]. This includes accuracy, convenience, access speed, ease of use, navigation, efficiency, flexibility, dependability, security, and responsiveness [44]. This study defines confirmed system quality as the perception a faculty member has on how well e-learning functions. Studies have confirmed the strong, positive influence of system quality on satisfaction [42] and perceived usefulness [39,44,45]. This study hypothesises that faculty members’ confirmed system quality influences their satisfaction and confirmed usefulness. Therefore, we generated the following hypotheses:
H7. 
Confirmed system quality positively influences satisfaction.
H8. 
Confirmed system quality positively influences confirmed usefulness.
H9. 
Confirmed system quality positively influences confirmed ease of use.

4.5. Confirmed Cognitive Presence

In this study, confirmed cognitive presence refers to the level of engagement and interaction between faculty members and the learning materials or activities in an e-learning environment. Cognitive presence has been identified as a significant predictor of student satisfaction and confirmed usefulness in e-learning environments [42,46,47]. The findings show that cognitive presence significantly affected student satisfaction, as students who felt they had a deeper understanding of course content were more satisfied with the e-learning experience [47]. Additionally, researchers found that cognitive presence positively affects the confirmed usefulness of e-learning, and students who felt that e-learning enabled them to improve their critical thinking, problem solving, and reflective learning found it to be more useful [46]. Other studies have emphasised the importance of cognitive presence in fostering student engagement and participation in e-learning [48]. Overall, the literature suggests that cognitive presence plays a crucial role in determining student satisfaction and confirmed usefulness in e-learning, underscoring the importance of designing e-learning environments that promote cognitive engagement.
Therefore, we hypotheses the following:
H10. 
Confirmed cognitive presence positively influences satisfaction.
H11. 
Confirmed cognitive presence positively influences confirmed usefulness.
H12. 
Confirmed cognitive presence positively influences confirmed ease of use.

4.6. Confirmed Social Presence

Social presence is “the ability of participants to identify with the community, communicate purposefully in a trusting environment, and develop inter-personal relationships by way of projecting their individual personalities” [48]. Additionally, social presence comprises emotional expression, open communication, and group cohesion [46]. Social presence helps to create a learning environment that supports a higher level of learning outcomes. Social presence can improve student satisfaction by fostering a sense of community and interpersonal connection [48], it has a positive influence on learners’ satisfaction [49,50]. Similarly, social presence can enhance perceived usefulness, with students who feel more connected to their peers and instructors finding the e-learning experience more valuable [49]. Furthermore, the importance of social presence in promoting student engagement and collaboration in e-learning is emphasised [50]. Therefore, the generated hypotheses include the following:
H13. 
Confirmed social presence positively influences satisfaction.
H14. 
Confirmed social presence positively influences confirmed usefulness.
H15. 
Confirmed social presence positively influences confirmed ease of use.

4.7. Confirmed Teaching Presence

Teaching presence is “the design, facilitation, and direction of cognitive and social processes for the purpose of realising personally meaningful and educationally worthwhile learning outcomes” [51], and teaching presence consists of “design and organisation, facilitation of discourse and direct instruction” [47]. Teaching presence is a key factor in promoting student satisfaction and perceived usefulness in e-learning, with students reporting higher levels of satisfaction when they feel that their instructors are actively involved and engaged in the course [47]. Similarly, research has found that teaching presence is positively related to student engagement and perceived usefulness, and students who feel that their instructors are responsive and available are more engaged in the e-learning experience [46]. We assume that faculty members’ confirmed cognitive presence positively influences satisfaction, confirmed ease of use, and confirmed usefulness. Therefore, we hypothesise the following:
H16. 
Confirmed teaching presence positively influences satisfaction.
H17. 
Confirmed teaching presence positively influences confirmed usefulness.
H18. 
Confirmed teaching presence positively influences confirmed ease of use.

4.8. Satisfaction

In this study, satisfaction is defined as the degree to which a faculty member feels that their needs, wants, and goals have been met by an educational technology. Satisfaction can also be defined as a mental or emotional condition that is connected to and produced by a cognitive assessment of the expectation–performance difference (confirmed expectations). Lower expectation and/or higher performance results in positive confirmed expectations, which in turn improves customer satisfaction [9]. The reverse causes negative confirmed expectation, which leads to dissatisfaction. Several academics have confirmed that satisfaction is the primary indicator of information system success [12,38,40]. While educational technologies are important learning tools, their usage will be lessened if users are not satisfied.

5. Methodology

5.1. Research Design

To investigate the factors influencing faculty members’ satisfaction with e-learning, a survey design was used. The data were collected using a 7-point Likert scale questionnaire. Survey design refers to the process of creating a set of questions or items that are used to collect data from a sample of individuals or groups [52]. A survey was chosen since it is affordable and can gather a great amount of data in a small period.

5.2. Sampling Method

This study was carried out after the peak of the COVID-19 pandemic. It used a stratified sampling technique to choose participants from one institution in a developing nation after receiving an ethical clearance certificate from the university research council. Using their faculties, the students were divided to form strata. To reduce estimation errors, homogeneous elements are clustered together when students from the same faculty are placed in a stratum [52]; four strata were created because there were four faculties at the university. Simple random sampling was utilised to choose 100 third-year students from each faculty. Third-year students were selected in this study because they had used e-learning. A total of 400 questionnaires were administered to the selected 400 students. Out of 400 questionnaires administered, 356 valid responses were collected.
Simple random sampling was then used to select 120 instructors from across the university to participate in this study. From the sample of instructors, 98 valid responses were gathered. A reflective model’s sample size should be at least ten times more than the number of indicators on a construct with the greatest number of indicators [53]. The construct in this model with the greatest number of indicators was confirmed usefulness. Confirmed usefulness had five indicators, indicating that the recommended minimum sample size of this study should be 50. The sample size for each group (students and instructors) was higher than the advised minimum of 50 [53].

5.3. Measurement Instrument

The measurement instrument items were adapted from prior studies. The items of confirmed usefulness and satisfaction were adapted from previously validated and reliable instruments [9,10]. The indicator of confirmed ease of use was adopted [28]. The items of confirmed system quality and confirmed institutional support were adopted from the prior studies [41,42,44,54]. The indicators of confirmed social presence, confirmed cognitive presence, and confirmed teaching presence were adapted [55]. Indicators of the constructs shown in Section 4 constituted the questionnaire. All the indicators were then adapted to suit the needs of this study.

5.4. Analysis Technique

To predict faculty members’ satisfaction with e-learning and determine whether there was a statistically significant difference between the students’ and instructors’ satisfaction, partial least squares–structural equation modelling methodology was used. The data were analysed using the SmartPLS3 software. Model analysis was performed in two steps [53]. The first step was measurement model assessment, followed by the assessment of the structural model [56]. In order to determine whether there was a significant difference between the satisfaction of students and instructors, multigroup analysis was utilised after the structural model assessment.

6. Results

6.1. The Measurement Model

The relationship between constructs and their indicators is explained by the measurement model. Convergent and discriminant validity are used to assess the goodness of fit of the measurement model [56]. Convergent validity checks how effectively a latent variable measures what it is intended to measure [53]. It assesses the degree of high correlation between theoretically equivalent measurements [56]. Alternatively, discriminant validity assesses how successfully a construct sets itself apart from other constructs [53].

6.1.1. Convergent Validity

Convergent validity is evaluated by examining the average variance extracted (AVE), internal consistency, and indicator reliability of the constructs [53]. Outer loadings are used to assess indicator reliability. The outer loadings should, as a general rule, be more than 0.7 [56]. The findings in Table 1 show that almost all constructs had outer loadings greater than 0.7, with the exception of CTP1 (0.686). The indicator CTP1 was retained because of its positive contribution to content validity [53]. These results indicate acceptable indicator reliability.
The Cronbach’s alpha test (CA) and composite reliability (CR) are used to assess the internal consistency [56]. The rule of thumb is that the CA and CR values should be greater than 0.7 [53]. The results in Table 1 show that all the CA and CR values were greater than 0.7, indicating satisfactory internal consistency. The threshold value of average variance extracted (AVE) is 0.5 [53]. Table 1 shows that all the AVE values were greater than 0.5. These results confirm the convergent validity of the measurement model.

6.1.2. Discriminant Validity

This study used the Fornell–Larcker criterion to assess the discriminant validity of the model. It compares the square roots of the AVE values of each construct with its correlation with other constructs. The square root of the AVE values of each construct should be greater than its highest correlation with other constructs [53]. The findings in Table 2 demonstrate that each construct’s square root of the AVE value (numbers in bold) is higher than its highest correlation with other constructs. These findings suggest adequate discriminant validity.
The convergent and discriminant validity assessments of the measurement model were satisfactory overall. The measurement model demonstrated the reliability and validity required to evaluate the structural model.

6.2. Structural Model

To assess the structural model, this study followed a five-step analysis suggested by ref. [53]. In step 1, the structural model must first be assessed for multicollinearity using the variance inflation factor (VIF). A potential multicollinearity issue is indicated if the VIF values are larger than 4 [53]. The results in Table 3 show that all the VIF values were less than 4, demonstrating the absence of multicollinearity issues.
Step 2 involves assessing the significance of path coefficients, following the bootstrapping procedure, in which 5000 subsamples were used to test the model hypotheses [53]. The t-values and p-values were used to assess the significance of the path coefficients. For the p-value to be 0.05 and below, the calculated t-value should be greater than the critical value of 1.96.
The results of the path coefficients are summarised in Table 3.
Step 3 includes the assessment of the effect size (f2). The effect size (f2) of 0.02, 0.15, and 0.35 suggest small, medium, and large effect size, respectively [57]. The results in Table 3 show that CU to SAT (0.319) and CSP to SAT (0.293) had medium effect sizes, while the rest had small effect sizes.
Step 4 is the assessment of the coefficient of determination (R2). The coefficient of determination displays the total amount of variance in the dependent latent variable that is explained by the independent latent variables (R2) [53]. The more accurate the structural model’s predictions, the higher the coefficient of determination [56]. R2 values of 0.67, 0.33, and 0.19 are categorised as being significant, moderate, and modest, respectively [58]. Figure 2 shows that the R2 of CU (0.682) and SAT (0.819) are considered significant, while that of CEOU (0.611) is considered moderate. Figure 2 shows that CCP, CSP, CTP, CIS, and CSQ are predictors of CEOU, CU, and SAT. CEOU is an antecedent of CU, and they both predict SAT.
Step 5 is the assessment of predictive relevance (Q2). To assess the predictive relevance of the user satisfaction model, we followed the blindfolding guidelines given by Hair, Jr. [53]. The Q2 values of the dependent variables (CEOU = 0.396, CU = 0.521, and SAT = 0.614) were all above zero, indicating that the user satisfaction model can be used to explain faculty members’ satisfaction with e-learning.

6.3. Multigroup Analysis

Multigroup analysis refers to a statistical method used to examine whether a relationship or pattern observed between variables is consistent across multiple groups. Multigroup analysis was used to test if there is a statistically significant difference between university students’ and instructors’ path coefficients.
The results of multigroup analysis are shown in Table 4.
The results show that three paths had statistically different path coefficients. These paths are CSP to SAT (β = −0.247; p < 0.05), CEOU to SAT (β = 0.221; p < 0.05), and CCP to SAT (β = 0.304; p < 0.05). The paths CEOU to SAT (β = 0.221; p < 0.05) and CCP to SAT (β = 0.304; p < 0.05) had positive betas, implying that the path coefficients of the instructors were higher than those of the students’. CSP to SAT (β = −0.247; p < 0.05) had a negative beta, indicating that the students’ path coefficient was higher than that of the instructors’.

7. Discussion

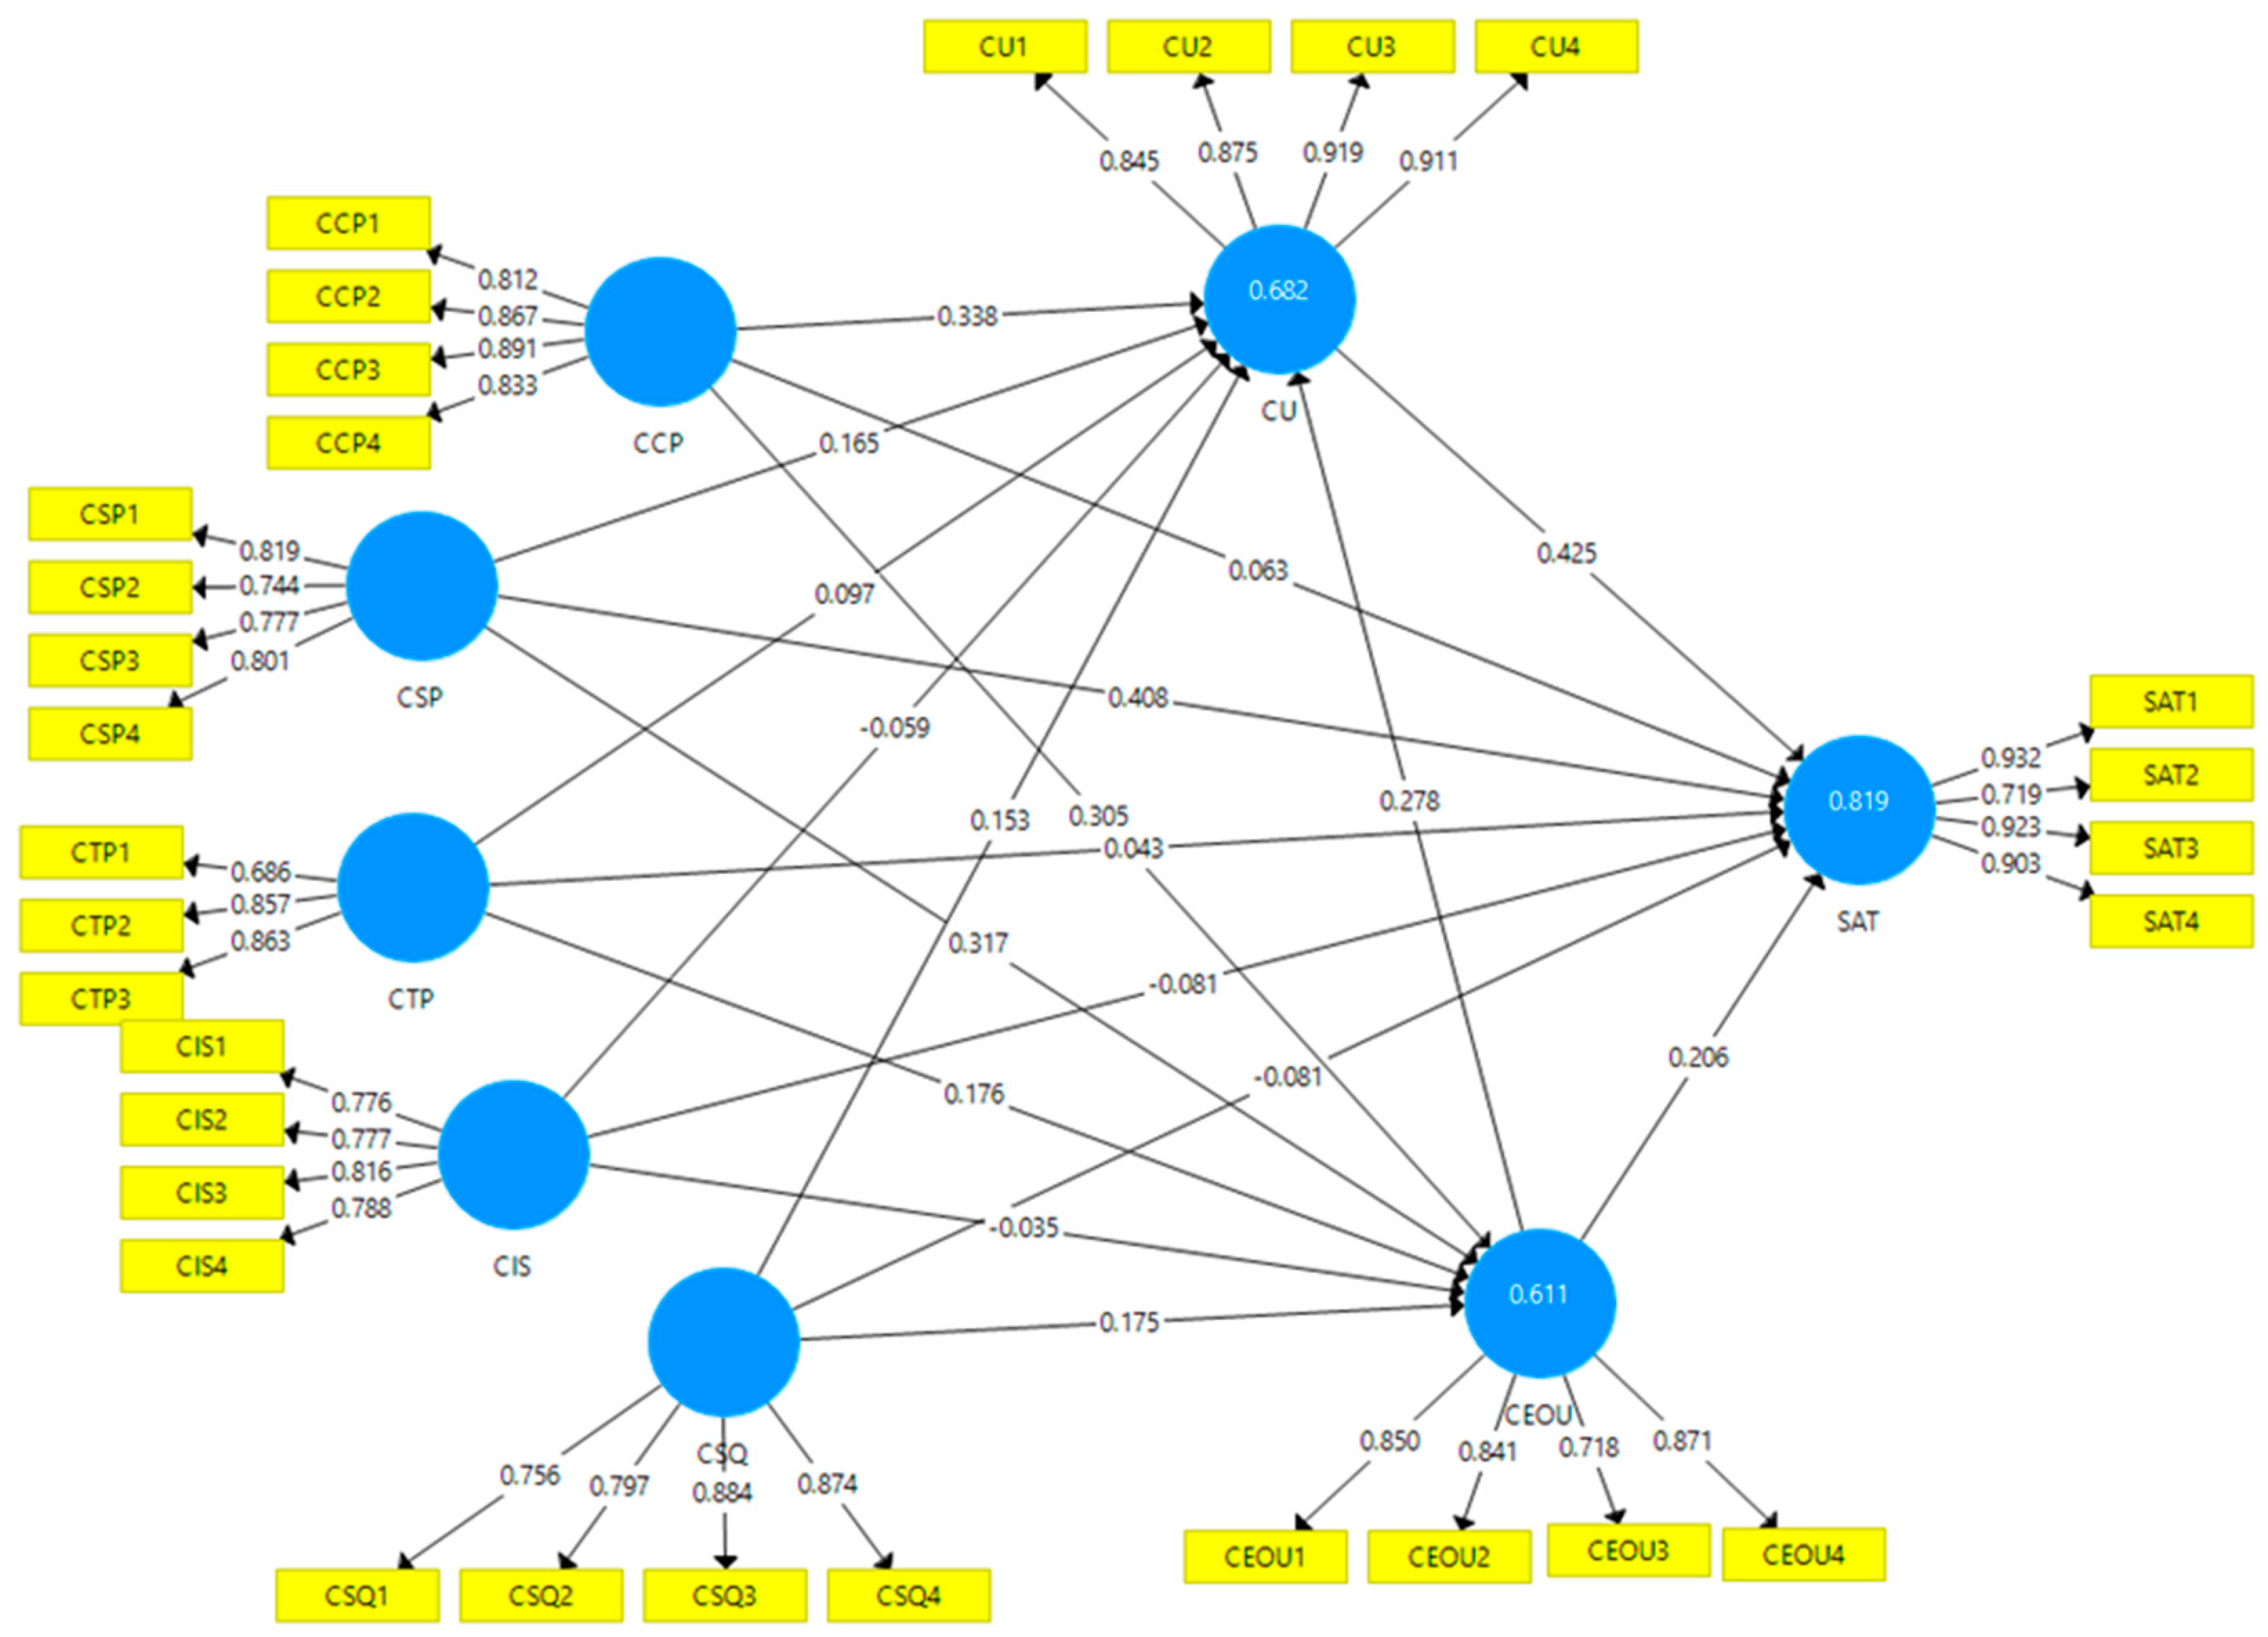
Concerning research aim 1, namely “to find the factors that influence faculty members’ satisfaction with e-learning”, this study proposed and evaluated a new model known as the user satisfaction model by extending the expectation confirmation model. The R2 score for the user satisfaction model was 0.819. This R2 is considered substantial, implying the model’s higher predictive accuracy [53]. According to this finding, 81.9% of the variance in faculty members’ satisfaction with e-learning can be attributed to factors such as confirmed cognitive presence, confirmed social presence, confirmed teaching presence, confirmed institutional support, confirmed system quality, confirmed ease of use, and confirmed usefulness. The findings are positive since they show that faculty members are satisfied with e-learning. The fact that all the Q2 values were greater than zero demonstrated the user satisfaction model’s predictive relevance.
Contrary to the findings of other studies [46,47], our results show no positive influence of confirmed cognitive presence on satisfaction. These results imply that instructors are not yet convinced by their ability to create an e-learning environment that enables students to further their knowledge through sustained communication. A possible reason for this finding might be that faculty members were forced to switch to e-learning because of the COVID-19 pandemic without training and proper planning. It is therefore important for universities to train instructors to effectively create e-learning environments that foster knowledge creation. This can be achieved by making use of both synchronous and asynchronous e-learning strategies to minimise the shortfall of using only a single approach. For example, studies have revealed that due to time constraints in synchronous e-learning, the resolution phase, which is very important for knowledge creation, is not reached [59]. To overcome this barrier, asynchronous e-learning can be used where students can engage with each other and their instructors without being limited by time.
Additionally, the asynchronous and mostly written communication of asynchronous e-learning appear to create the conditions that encourage, if not demand, reflection, in contrast to the spontaneous speech communication of synchronous e-learning engagement [47]. The permanent and exact nature of written communication not only allows for reflection but also necessitates reflection to interpret and construct knowledge [46]. However, since this result was not expected, it is important for researchers to continue exploring the relationship between cognitive presence and satisfaction in future research.
In line with other results [42], confirmed cognitive presence influences confirmed usefulness. Our results also highlighted that confirmed cognitive presence influences confirmed ease of use. These results imply that faculty members believe that using e-learning improves their performance, and it is free of cognitive effort. Instructors are encouraged to use all of the tools that e-learning provides to ask questions and monitor students as they further their knowledge. Furthermore, to comprehend and choose tactics, activities, and e-learning tools, instructors need be aware of the phases of e-learning. The instructors are urged to begin their lessons by giving students thought-provoking problems that allow them to explore for important information, put together an insightful justification or solution, and then put their justifications into practice to address the dissonance. The use of many e-learning tools reinforces students’ cognitive presence, which in turn influences the usefulness of e-learning.
Congruent to the results of prior studies [48,49], faculty members’ confirmed social presence was found to influence their confirmed usefulness, confirmed ease of use, and satisfaction. These results did not come as a surprise considering that several studies have highlighted the importance of social presence in an e-learning environment [50,55,59]. These findings suggest that it is crucial for students to be able to relate to their peers, communicate effectively in a safe setting, and form interpersonal connections by reflecting their unique characteristics. For students to be satisfied with e-learning, it is important for instructors to create learning environments that encourage collaboration as students socially construct their knowledge. This can be achieved by designing activities that encourage teamwork and focused and directed discussions.
Furthermore, the finding that faculty members’ confirmed social presence influences their confirmed usefulness, confirmed ease of use, and satisfaction in e-learning environments is highly relevant to the achievement of quality education (SDG4). By promoting social presence among faculty members, e-learning environments can become more engaging, collaborative, and supportive, enhancing the overall quality of the educational experience. Furthermore, by promoting confirmed usefulness and ease of use, e-learning can help students to develop the skills and knowledge required to succeed in the workforce, contributing to SDG4’s objective of ensuring inclusive, equitable, and quality education for all.
The finding that faculty members’ satisfaction is also influenced by their confirmed social presence suggests that investing in faculty development and support in e-learning can contribute to greater job satisfaction and retention, ultimately benefitting students and the broader educational community. Overall, these findings underscore the importance of investing in social presence among faculty members in e-learning environments to promote high-quality education and contribute to the achievement of SDG4.
Confirmed teaching presence was found to influence confirmed ease of use but not satisfaction and confirmed usefulness. These results contradict those of other studies [46,47] that found a positive influence of teaching presence on satisfaction and confirmed usefulness. The results may mean that while confirmed teaching presence is an important factor in promoting engagement and interaction among students and instructors, it may not necessarily translate into increased satisfaction or usefulness. However, the finding that confirmed that teaching presence influences confirmed ease of use suggests that instructors who are actively present and engaged in e-learning environments can help to reduce barriers to learning, making it easier for students to engage with the course content and complete assignments.
These results may also imply that university students are not satisfied by the way their instructors facilitate, direct, and design e-learning material. A possible reason for these findings is that instructors, in the heat of the pandemic, they were not trained on how to use e-learning. Being a good teacher in face-to-face classroom does not automatically translate into being a good e-learning teacher [23]. The finding that confirmed teaching presence only influences confirmed ease of use and not satisfaction and confirmed usefulness may suggest that there is still much to learn about how best to design and implement e-learning programmes; it also underscores the important role that instructors can play in promoting engagement and reducing barriers to learning in online environments. Therefore, it is important for universities in developing countries to train their lecturers to effectively use e-learning for students to benefit from it and be satisfied with it.
This is in line with the results of studies [13,42] that independently found that ease of use influences both the satisfaction with and the usefulness of e-learning. These results imply that faculty members, after using e-learning for some time, perceive it to be user-friendly, and they are satisfied with it. This supports the observation [22] that users will not use a system that they perceive to be difficult even though they perceive it useful. It is important for e-learning platform developers to develop platforms that require less cognitive effort to use. These results highlight the importance of investing in the design and development of e-learning platforms that are easy to use and engaging, as this can have significant benefits for students and the broader educational community.
The results also showed that faculty members’ confirmed system quality influences their confirmed ease of use and confirmed usefulness but not their satisfaction. These results imply that even though there was no direct influence of confirmed system quality on satisfaction, it had an indirect one through confirmed usefulness and confirmed ease of use. These results contradict those of ref. [42], which reported a strong correlation between confirmed system quality and satisfaction. However, our results do support the results of studies [44,45] that reported a positive impact of system quality on ease of use and usefulness. It is important for e-learning developers to develop e-learning platforms that are flexible, easy to navigate, and dependable to improve faculty members’ satisfaction with e-learning.
Aligning this finding with Sustainable Development Goal (SDG4)—Quality Education, investing in system quality can help to ensure that e-learning is accessible and equitable for all students regardless of their location or circumstances. By providing a reliable and efficient platform, students can have access to high-quality educational opportunities that can help them to achieve their goals and aspirations, contributing to the overall objective of ensuring inclusive and equitable quality education for all.
The findings revealed that confirmed that institutional support had no effect on confirmed ease of use, confirmed usefulness, or satisfaction. These findings contradict the findings that institutional support has a positive influence on perceived usefulness, satisfaction, and perceived ease of use [41,43]. The finding that confirmed institutional support has no effect on confirmed ease of use, confirmed usefulness, or satisfaction in e-learning environments is a concerning one, which might mean that faculty members may not be receiving adequate support from their institution in order to implement effective e-learning. This supports observations that rural institutions are underfunded, resulting in a lack of infrastructure that can effectively support e-learning [1]. Furthermore, there is unreliable electrical supply in rural areas, and the study location had no backup equipment for when there are power outages [23]. Furthermore, the information and technology department at the study site is understaffed, so they solely deal with network challenges rather than assisting instructors. Without adequate institutional support, students may struggle to access the resources and support they need to engage with course content effectively, leading to lower levels of engagement, achievement, and satisfaction.
Our findings are congruent with studies [7,9] that found a substantial association between post-adoption perceived usefulness and satisfaction. On one hand, the results imply that instructors perceived e-learning to be useful for their teaching, research, and administrative tasks, and they are satisfied with their experience of using it. On the other hand, students also used e-learning platforms and found that they help them access course materials, communicate with instructors, and complete assignments more easily, so they perceive the platforms useful. This perception of usefulness can lead to greater satisfaction with the platform and their overall learning experiences. Understanding faculty members’ perceptions of usefulness can help universities and e-learning platform developers to create and implement tools that better meet their needs, ultimately leading to greater satisfaction and engagement with their teaching and learning experiences.
Concerning research aim 2, namely “to determine whether there was a statistically significant difference in instructors’ and students’ satisfaction with e-learning”, a multigroup analysis was conducted. Only three paths showed a statistically significant variation in path coefficients between instructors and students (Table 4). The majority of the differences in path coefficients were not statistically significant. These results are not in line with other studies [10,37] showing that students’ and instructors’ satisfaction with e-learning is influenced by different factors. These findings show that students and instructors are equally satisfied with e-learning. Furthermore, the findings show that the same model (user satisfaction model) may be used to explain and predict the satisfaction with e-learning for both subgroups (instructors and students).
The paths whose coefficients were statistically different are CSP to SAT (β = −0.247, p < 0.05), CCP to SAT (β = 0.304, p < 0.05), and CEOU to SAT (β = 0.221, p < 0.05). The CSP–SAT path exhibited a negative beta, indicating that students’ beta was greater than that of instructors. In other words, social presence has a greater impact on students’ satisfaction than on that of instructors. This means that students’ satisfaction with e-learning is more influenced by the degree of social interaction and communication among themselves than their instructors. This supports the idea that in an e-learning environment, students might quickly feel lonely, alienated, and anxious if instructors and peers do not provide emotional and social support [13]. Another possible explanation for this finding is that students may feel more comfortable and motivated to interact with their peers, which can enhance their sense of belonging and engagement in the learning process. Furthermore, students learn more effectively from one another; therefore, for students, the capacity to communicate purposefully in a trusting environment and create inter-personal relationships by projecting their individual personalities is more vital than it is for their instructors. Social presence is an important aspect of e-learning that can significantly impact students’ satisfaction with their e-learning experience. Universities and instructors should strive to create an e-learning environment that fosters social interaction and communication among students and that supports their sense of connection and engagement in the learning process. This leads to developing countries achieving their goal of providing quality and inclusive education (SDG4).
Positive coefficients were found for the paths CCP to SAT and CEOU to SAT, indicating that instructors’ betas were greater than those of their students. This is because instructors are responsible for designing and delivering course content and for facilitating the learning process. Therefore, their own cognitive presence can significantly impact the quality of the learning experience for students. These findings may hint to instructors’ doubts about their ability to properly teach through utilising e-learning due to a lack of sufficient training. Instructors with weak cognitive presence may struggle to create effective learning experiences that meet students’ needs and expectations. This can lead to lower levels of satisfaction among both instructors and students.
While cognitive presence is important for both instructors and students, it is particularly critical for instructors in promoting a high-quality e-learning experience. Therefore, universities should provide support and resources for instructors to develop and enhance their cognitive presence in e-learning environments. This can include training in instructional design, pedagogy, and facilitation skills as well as access to tools and technologies that support effective e-learning practices.

8. Theoretical Implications

This research resulted in two major theoretical contributions to the body of knowledge. First, the developed user satisfaction model was proposed and verified in this study. This study found that confirmed usefulness, confirmed ease of use, and confirmed expectations (confirmed institutional support, confirmed social presence, confirmed teaching presence, confirmed system quality, and confirmed cognitive presence) influence user satisfaction. Second, confirmed expectations develop in four stages: perceived expectations before using the system (1), using the system (2), forming a perception of what the system can actually deliver (actual ‘performance’) (3), and comparison between perceived expectation and actual ‘performance’) to form a positive or negative confirmed expectation (4).

9. Practical Implications

This study has four practical implications. First, it has training and professional development implications for instructors. Since e-learning was embraced as an emergent measure in developing nations to continue teaching and learning in the face of the COVID-19 pandemic, it is critical for universities to train instructors on how to effectively establish e-learning environments that support knowledge creation. Instructors should be provided with training in instructional design, pedagogy, and facilitation skills to enhance their cognitive presence and create effective learning experiences for students. By doing so, universities can contribute to the aim of ensuring inclusive, equitable, and quality education that promotes lifelong learning opportunities for all (SDG4).
Second, it has implications for student engagement and motivation: The results suggest that promoting social presence can enhance students’ engagement and motivation in e-learning environments. Universities and instructors should create opportunities for students to interact and collaborate with each other and to receive support and feedback from their peers.
Third, the results underscore the importance of institutional support for e-learning environments. Universities should provide resources and support for faculty members to promote teaching and social and cognitive presence. The presences manifest through access to tools, technologies, training, and professional development for instructors as well as support services for students. Universities are encouraged to create e-learning support studios whose job is to design and create learning materials to support faculty members.
Additionally, universities are encouraged to partner with cellular network providers to allow educational websites and learning management systems to be zero-rated, thereby reducing the cost of e-learning to students. Furthermore, educational institutions can partner with other organisations and stakeholders to promote e-learning and contribute to SDG17, which aims to strengthen global partnerships for sustainable development.
Universities located in rural areas of developing countries are encouraged to invest in backup-power systems. This can be accomplished by installing solar systems or purchasing generators for usage during power outages. There is no e-learning without power. Making use of solar systems in rural-based universities will make e-learning sustainable since it is renewable (SDG7).
Fourth, the results suggest that the design and use of e-learning should focus on enhancing social and cognitive presence to improve satisfaction among faculty members. Universities and e-learning platform developers should design and implement e-learning platforms that foster social interaction and communication among students as well as support critical thinking and reflection.
The majority of students in rural-based universities originate from surrounding rural areas, which are characterised by a lack of employment opportunities, people surviving on government grants, and children-headed families [22]. The majority of these students cannot afford electronic devices that can effectively support e-learning. It is critical for these universities to provide students with these devices. Providing devices and power-backup systems will ensure that no one is left behind, thus providing stakeholders with opportunities for lifelong learning. This helps the developing countries to reach SGD4. Furthermore, rural-based universities should establish a help desk for faculty members to ensure that e-learning runs smoothly.

10. Conclusions

The purpose of this study was to identify the factors that influence faculty members’ satisfaction with e-learning as well as to determine whether there was a substantial difference between students’ and instructors’ satisfaction with e-learning. The study developed and validated the user satisfaction model. This model explained 81.9% of the variance in faculty members’ e-learning satisfaction. The study discovered that confirmed usefulness and confirmed ease of use influence satisfaction.
The findings also revealed that certain confirmed expectations (confirmed social presence, confirmed teaching presence, and confirmed system quality) had a direct impact on confirmed usefulness and confirmed ease of use. Confirmed social presence was the only confirmed expectations construct that had a direct influence on satisfaction. Confirmed institutional support had no effect on confirmed usefulness, confirmed ease of use, and satisfaction. Rural-based universities are encouraged to provide support to faculty members for them to be satisfied with e-learning. Except for the paths of confirmed social presence to satisfaction, confirmed ease of use to satisfaction, and confirmed cognitive presence to satisfaction, the rest of the path coefficients of students and instructors showed no statistically significant difference. This shows that the user satisfaction model may be used to explain and predict the satisfaction of both instructors and students with e-learning.

11. Limitations and Future Studies

This study was conducted at a single rural-based university, and therefore, generalising the findings to other universities should be undertaken with caution.
Future research should investigate other factors affecting faculty members’ satisfaction with e-learning. It will be fascinating to examine the outcomes of comparable studies conducted in urban-based universities of developing countries. Additional research is needed to validate the user satisfaction model.

Author Contributions

Conceptualization, D.M.; Methodology, A.C.; Validation, A.C. All authors have read and agreed to the published version of the manuscript.

Funding

This research received no external funding.

Institutional Review Board Statement

The study was commissioned by the institution at which the study took place with ethical number UZREC171110-030 Dept2021/16 for the period from 2021.

Informed Consent Statement

Informed consent was obtained from all subjects involved in the study.

Data Availability Statement

The research was commissioned by the institution the data is under ethical restrictions for a period of 2 years.

Conflicts of Interest

The authors declare no conflict of interest.

References

  1. Mulenga, E.M.; Marbán, J.M. Is COVID-19 the Gateway for Digital Learning in Mathematics Education? Contemp. Educ. Technol. 2020, 12, ep269. [Google Scholar] [CrossRef] [PubMed]
  2. Sá, M.J.; Serpa, S. The COVID-19 pandemic as an opportunity to foster the sustainable development of teaching in higher education. Sustainability 2020, 12, 8525. [Google Scholar] [CrossRef]
  3. Rieckmann, M. Education for Sustainable Development Goals: Learning Objectives; UNESCO Publishing: Paris, France, 2017. [Google Scholar]
  4. McGreal, R. Special report on the role of open educational resources in supporting the sustainable development goal 4: Quality education challenges and opportunities. Int. Rev. Res. Open Distrib. Learn. 2017, 18, 293–305. [Google Scholar] [CrossRef]
  5. Elfert, M. Lifelong learning in Sustainable Development Goal 4: What does it mean for UNESCO’s rights-based approach to adult learning and education? Int. Rev. Educ. 2019, 65, 537–556. [Google Scholar] [CrossRef] [Green Version]
  6. Ye, J.-H.; Lee, Y.-S.; Wang, C.-L.; Nong, W.; Ye, J.-N.; Sun, Y. The Continuous Use Intention for the Online Learning of Chinese Vocational Students in the Post-Epidemic Era: The Extended Technology Acceptance Model and Expectation Confirmation Theory. Sustainability 2023, 15, 1819. [Google Scholar] [CrossRef]
  7. Mutambara, D.; Chibisa, A. Analysing the Determinants of Learners’ Continuous use of Mobile Learning During and After the COVID-19 Pandemic. J. Educ. Stud. 2022, 21, 126–146. [Google Scholar]
  8. Ansong-Gyimah, K. Students’ Perceptions and Continuous Intention to Use E-Learning Systems: The Case of Google Classroom. iJET 2020, 15, 236–244. [Google Scholar] [CrossRef]
  9. Bhattacherjee, A. Understanding information systems continuance: An expectation-confirmation model. MIS Q. 2001, 25, 351–370. [Google Scholar] [CrossRef]
  10. Jo, H. Determinants of continuance intention towards e-learning during COVID-19: An extended expectation-confirmation model. Asia Pac. J. Educ. 2022, 1–21. [Google Scholar] [CrossRef]
  11. Chiu, W.; Cho, H.; Chi, C.G. Consumers’ continuance intention to use fitness and health apps: An integration of the expectation–confirmation model and investment model. Inf. Technol. People 2020, 34, 978–998. [Google Scholar] [CrossRef]
  12. Alzahrani, L.; Seth, K.P. Factors influencing students’ satisfaction with continuous use of learning management systems during the COVID-19 pandemic: An empirical study. Educ. Inf. Technol. 2021, 26, 6787–6805. [Google Scholar] [CrossRef] [PubMed]
  13. Puška, A.; Puška, E.; Dragić, L.; Maksimović, A.; Osmanović, N. Students’ satisfaction with E-learning platforms in Bosnia and Herzegovina. Technol. Knowl. Learn. 2021, 26, 173–191. [Google Scholar] [CrossRef]
  14. Basuony, M.A.; EmadEldeen, R.; Farghaly, M.; El-Bassiouny, N.; Mohamed, E.K. The factors affecting student satisfaction with online education during the COVID-19 pandemic: An empirical study of an emerging Muslim country. J. Islam. Mark. 2021, 12, 631–648. [Google Scholar] [CrossRef]
  15. Jiménez-Bucarey, C.; Acevedo-Duque, Á.; Müller-Pérez, S.; Aguilar-Gallardo, L.; Mora-Moscoso, M.; Vargas, E.C. Student’s satisfaction of the quality of online learning in higher education: An empirical study. Sustainability 2021, 13, 11960. [Google Scholar] [CrossRef]
  16. Jiang, H.; Islam, A.A.; Gu, X.; Spector, J.M. Online learning satisfaction in higher education during the COVID-19 pandemic: A regional comparison between Eastern and Western Chinese universities. Educ. Inf. Technol. 2021, 26, 6747–6769. [Google Scholar] [CrossRef]
  17. Kuliya, M.; Usman, S. Perceptions of E-learning among undergraduates and academic staff of higher educational institutions in north-eastern Nigeria. Educ. Inf. Technol. 2021, 26, 1787–1811. [Google Scholar] [CrossRef]
  18. Alkhwaldi, A.F.; Abdulmuhsin, A.A. Crisis-centric distance learning model in Jordanian higher education sector: Factors influencing the continuous use of distance learning platforms during COVID-19 pandemic. J. Int. Educ. Bus. 2022, 15, 250–272. [Google Scholar] [CrossRef]
  19. Alam, S.; Mahmud, I.; Hoque, S.S.; Akter, R.; Rana, S.S. Predicting students’ intention to continue business courses on online platforms during the COVID-19: An extended expectation confirmation theory. Int. J. Manag. Educ. 2022, 20, 100706. [Google Scholar] [CrossRef]
  20. Dhawan, S. Online learning: A panacea in the time of COVID-19 crisis. J. Educ. Technol. Syst. 2020, 49, 5–22. [Google Scholar] [CrossRef]
  21. Singh, V.; Thurman, A. How many ways can we define online learning? A systematic literature review of definitions of online learning (1988–2018). Am. J. Distance Educ. 2019, 33, 289–306. [Google Scholar] [CrossRef]
  22. Mutambara, D.; Bayaga, A. Rural-based Science, Technology, Engineering and Mathematics teachers’ and learners’ acceptance of mobile learning. SA J. Inf. Manag. 2020, 22, 10. [Google Scholar] [CrossRef]
  23. Kisanga, D.; Ireson, G. Barriers and strategies on adoption of e-learning in Tanzanian higher learning institutions: Lessons for adopters. Int. J. Educ. Dev. Using ICT 2015, 11, 126–137. [Google Scholar]
  24. Awidi, I.T.; Cooper, M. Using management procedure gaps to enhance e-learning implementation in Africa. Comput. Educ. 2015, 90, 64–79. [Google Scholar] [CrossRef]
  25. Aldowah, H.; Al-Samarraie, H.; Ghazal, S. How course, contextual, and technological challenges are associated with instructors’ individual challenges to successfully implement E-learning: A developing country perspective. IEEE Access 2019, 7, 48792–48806. [Google Scholar] [CrossRef]
  26. Maatuk, A.M.; Elberkawi, E.K.; Aljawarneh, S.; Rashaideh, H.; Alharbi, H. The COVID-19 pandemic and E-learning: Challenges and opportunities from the perspective of students and instructors. J. Comput. High. Educ. 2022, 34, 21–38. [Google Scholar] [CrossRef]
  27. Mwandosya, G.; Suero Montero, C.; Mbise, E.R. (Eds.) Introducing mobile technology for enhancing teaching and learning at the college of business education in Tanzania: Teachers and students’ perspectives. In Information Systems and Technologies to Support Learning: Proceedings of EMENA-ISTL; Springer: Berlin/Heidelberg, Germany, 2018; Volume 2, p. 2019. [Google Scholar]
  28. Mutambara, D.; Bayaga, A. Determinants of Mobile Learning Acceptance for STEM Education in Rural Areas. Comput. Educ. 2021, 160, 104010. [Google Scholar] [CrossRef]
  29. Akbarilakeh, M.; Razzaghi, A.; Moghaddam, H.D.P. Attitudes of faculty members towards using e-learning. Res. Dev. Med. Educ. 2019, 8, 12–19. [Google Scholar] [CrossRef] [Green Version]
  30. Tena, R.R.; Almenara, J.C.; Osuna, J.B. E-Learning of Andalusian University’s Lecturers. Gender. TOJET 2016, 15, 25–37. [Google Scholar]
  31. Opoku, D. Determinants of e-learning system adoption among ghanaian university lecturers: An application of information system success and technology acceptance models. Am. J. Soc. Sci. Humanit. 2020, 5, 151–168. [Google Scholar] [CrossRef]
  32. Zardari, B.A.; Hussain, Z.; Arain, A.A.; Rizvi, W.H.; Vighio, M.S. Development and validation of user experience-based e-learning acceptance model for sustainable higher education. Sustainability 2021, 13, 6201. [Google Scholar] [CrossRef]
  33. Al-Shamali, S.; Al-Shamali, A.; Alsaber, A.; Al-Kandari, A.; AlMutairi, S.; Alaya, A. Impact of Organizational Culture on Academics’ Readiness and Behavioral Intention to Implement eLearning Changes in Kuwaiti Universities during COVID-19. Sustainability 2022, 14, 15824. [Google Scholar] [CrossRef]
  34. Stefanovic, D.; Drapsin, M.; Nikolic, J.; Scepanovic, D.; Radjo, I.; Drid, P. Empirical study of student satisfaction in e-learning system environment. Tech. Technol. Educ. Manag. 2011, 6, 1152–1164. [Google Scholar]
  35. Davis, F.D.; Bagozzi, R.P.; Warshaw, P.R. User acceptance of computer technology: A comparison of two theoretical models. Manag. Sci. 1989, 35, 982–1003. [Google Scholar] [CrossRef] [Green Version]
  36. DeLone, W.H.; McLean, E.R. The DeLone and McLean model of information systems success: A ten-year update. J. Manag. Inf. Syst. 2003, 19, 9–30. [Google Scholar]
  37. Al-Samarraie, H.; Teng, B.K.; Alzahrani, A.I.; Alalwan, N. E-learning continuance satisfaction in higher education: A unified perspective from instructors and students. Stud. High. Educ. 2018, 43, 2003–2019. [Google Scholar] [CrossRef]
  38. Lee, M.-C. Explaining and predicting users’ continuance intention toward e-learning: An extension of the expectation–confirmation model. Comput. Educ. 2010, 54, 506–516. [Google Scholar] [CrossRef]
  39. Cheng, Y.-M. Extending the expectation-confirmation model with quality and flow to explore nurses’ continued blended e-learning intention. Inf. Technol. People 2014, 27, 230–258. [Google Scholar] [CrossRef]
  40. Soria-Barreto, K.; Ruiz-Campo, S.; Samed Al-Adwan, A.; Zuniga-Jara, S. University Students Intention to Continue Using Online Learning Tools and Technologies: An International Comparison. Sustainability 2021, 13, 13813. [Google Scholar] [CrossRef]
  41. Venkatesh, V.; Thong, J.Y.; Chan, F.K.; Hu, P.J.H.; Brown, S.A. Extending the two-stage information systems continuance model: Incorporating UTAUT predictors and the role of context. Inf. Syst. J. 2011, 21, 527–555. [Google Scholar] [CrossRef]
  42. Roca, J.C.; Chiu, C.-M.; Martínez, F.J. Understanding e-learning continuance intention: An extension of the Technology Acceptance Model. Int. J. Hum. Comput. Stud. 2006, 64, 683–696. [Google Scholar] [CrossRef] [Green Version]
  43. Morvan, C.; O’Connor, A.J. An Analysis of Leon Festinger’s A Theory of Cognitive Dissonance; Macat Library: London, UK, 2017. [Google Scholar]
  44. Cheng, Y.-M. Which quality determinants cause MOOCs continuance intention? A hybrid extending the expectation-confirmation model with learning engagement and information systems success. Library Hi Tech 2022. [Google Scholar] [CrossRef]
  45. Alarabiat, A.; Hujran, O.; Soares, D.; Tarhini, A. Examining students’ continuous use of online learning in the post-COVID-19 era: An application of the process virtualization theory. Inf. Technol. People 2021, 36, 21–47. [Google Scholar] [CrossRef]
  46. Garrison, D.R. E-Learning in the 21st Century: A Community of Inquiry Framework for Research and Practice; Routledge: New York, NY, USA, 2016. [Google Scholar]
  47. Guo, P.; Saab, N.; Wu, L.; Admiraal, W. The Community of Inquiry perspective on students’ social presence, cognitive presence, and academic performance in online project-based learning. J. Comput. Assist. Learn. 2021, 37, 1479–1493. [Google Scholar] [CrossRef]
  48. Kozan, K.; Caskurlu, S. On the Nth presence for the Community of Inquiry framework. Comput. Educ. 2018, 122, 104–118. [Google Scholar] [CrossRef]
  49. Türel, Y.K. Relationships between students’ perceived team learning experiences, team performances, and social abilities in a blended course setting. Internet High. Educ. 2016, 31, 79–86. [Google Scholar] [CrossRef]
  50. Richardson, J.C.; Maeda, Y.; Lv, J.; Caskurlu, S. Social presence in relation to students’ satisfaction and learning in the online environment: A meta-analysis. Comput. Hum. Behav. 2017, 71, 402–417. [Google Scholar] [CrossRef]
  51. Garrison, D.R.; Anderson, T.; Archer, W. Critical inquiry in a text-based environment: Computer conferencing in higher education. Internet High. Educ. 1999, 2, 87–105. [Google Scholar] [CrossRef] [Green Version]
  52. Creswell, J.W.; Creswell, J.D. Research Design: Qualitative, Quantitative, and Mixed Methods Approaches; Sage Publications: Thousand Oaks, CA, USA, 2017. [Google Scholar]
  53. Hair, J.F., Jr.; Hult, G.T.M.; Ringle, C.M.; Sarstedt, M. A Primer on Partial Least Squares Structural Equation Modeling (PLS-SEM); Sage Publications: Thousand Oaks, CA, USA, 2021. [Google Scholar]
  54. Chen, M.; Wang, X.; Wang, J.; Zuo, C.; Tian, J.; Cui, Y. Factors affecting college students’ continuous intention to use online course platform. SN Comput. Sci. 2021, 2, 114. [Google Scholar] [CrossRef]
  55. Shea, P.; Bidjerano, T. Community of inquiry as a theoretical framework to foster “epistemic engagement” and “cognitive presence” in online education. Comput. Educ. 2009, 52, 543–553. [Google Scholar] [CrossRef]
  56. Garson, G.D. Partial Least Squares: Regression and Structural Equation Models; Statistical Associates Publishers: Asheboro, NC, USA, 2016. [Google Scholar]
  57. Cohen, L.; Manion, L.; Morrison, K. Research Methods in Education; Routledge: Abingdon-on-Thames, UK, 2013. [Google Scholar]
  58. Chin, W.W. The partial least squares approach to structural equation modeling. Mod. Methods Bus. Res. 1998, 295, 295–336. [Google Scholar]
  59. Kilis, S.; Yildirim, Z. Posting patterns of students’ social presence, cognitive presence, and teaching presence in online learning. Online Learn. 2019, 23, 179–195. [Google Scholar] [CrossRef]
Figure 1. Conceptual Framework for The User Satisfaction Model.
Sustainability 15 09522 g001
Figure 2. User Satisfaction Model.
Sustainability 15 09522 g002
Table 1. Measurement model.
ConstructIndicatorsLoadingsCACRAVE
Confirmed cognitive
presence
CCP10.8120.8730.9130.725
CCP20.867
CCP30.891
CCP40.833
Confirmed ease of useCEOU10.8500.839250.8920.676
CEOU20.841
CEOU30.718
CEOU40.871
Confirmed institutional supportCIS10.7760.7990.8690.623
CIS20.777
CIS30.816
CIS40.788
Confirmed social
presence
CSP10.8190.8120.898650.618
CSP20.744
CSP30.777
CSP40.801
Confirmed system
quality
CSQ10.7560.8490.8490.68789
CSQ20.797
CSQ30.884
CSQ40.874
Confirmed teaching
presence
CTP10.6860.7290.8470.650
CTP20.857
CTP30.863
Confirmed usefulnessCU10.8450.9100.9370.789
CU20.875
CU30.919
CU40.911
SatisfactionSAT10.9320.8930.9270.763
SAT20.719
SAT30.923
SAT40.903
Table 2. Discriminant Validity.
CCPCEOUCISCSPCSQCTPCUSAT
CCP0.851
CEOU0.6900.822
CIS0.5990.5510.789
CSP0.6760.6680.7470.786
CSQ0.4990.5640.4340.4350.829
CTP0.5900.6220.5130.5350.6510.806
CU0.7400.7360.5360.6540.5880.6270.888
SAT0.7320.7710.5900.7540.4870.6000.8260.874
Table 3. Structural model.
PathStd Betat-Valuep-ValueDecisionf2VIF
CCP → CEOU0.3055.1690.000Accepted0.1092.199
CCP → CU0.3385.0010.000Accepted0.1472.439
CCP → SAT0.0631.1700.243Rejected0.0082.797
CEOU → CU0.2784.5600.000Accepted0.0942.573
CEOU → SAT0.2064.3320.000Accepted0.0832.815
CIS → CEOU−0.0350.5440.587Rejected0.0012.408
CIS → CU−0.0590.9440.346Rejected0.0052.412
CIS → SAT−0.0811.3850.167Rejected0.0152.423
CSP → CEOU0.3174.7690.000Accepted0.0922.806
CSP → CU0.1652.6280.009Accepted0.0283.065
CSP → SAT0.4086.6020.000Accepted0.2933.150
CSQ → CEOU0.1752.8330.005Accepted0.0431.812
CSQ → CU0.1532.6030.010Accepted0.0391.891
CSQ → SAT−0.0811.9520.051Rejected0.0181.965
CTP → CEOU0.1762.6240.009Accepted0.0372.160
CTP → CU0.0971.8430.066Rejected0.0132.240
CTP → SAT0.0430.7930.428Rejected0.0052.269
CU → SAT0.4258.7960.000Accepted0.3193.140
Table 4. Multigroup analysis results.
PathPath Coefficients-Diff (Instructors—Students)p-Value Original 1-Tailed (Instructors vs. Students)p-Value New (Instructors vs. Students)Decision
CCP → CEOU0.0170.4400.880Rejected
CCP → CU−0.0590.6620.676Rejected
CCP → SAT0.3040.0020.003Accepted
CEOU → CU−0.0200.5500.901Rejected
CEOU → SAT0.2210.0130.025Accepted
CIS → CEOU−0.0240.5590.883Rejected
CIS → CU−0.0230.5660.868Rejected
CIS → SAT0.0730.2620.525Rejected
CSP → CEOU0.0360.4140.828Rejected
CSP → CU−0.1640.8870.225Rejected
CSP → SAT−0.2470.9830.033Accepted
CSQ → CEOU−0.0050.5190.963Rejected
CSQ → CU0.1560.1170.234Rejected
CSQ → SAT−0.0770.8370.326Rejected
CTP → CEOU−0.0250.5570.886Rejected
CTP → CU0.0730.2590.519Rejected
CTP → SAT−0.0680.7450.510Rejected
CU → SAT−0.1850.9640.072Rejected
Disclaimer/Publisher’s Note: The statements, opinions and data contained in all publications are solely those of the individual author(s) and contributor(s) and not of MDPI and/or the editor(s). MDPI and/or the editor(s) disclaim responsibility for any injury to people or property resulting from any ideas, methods, instructions or products referred to in the content.

