Article

Potential Effects of Climate Change on Agricultural Water Resources in Riyadh Region, Saudi Arabia

1
Civil Engineering Department, Faculty of Engineering, Minia University, Minia 61111, Egypt
2
Civil Engineering Department, College of Engineering, Shaqra University, Dawadmi 11911, Saudi Arabia
3
College of Design and Architecture, Jazan University, Jazan 45142, Saudi Arabia
4
Department of Hydrology and Hydraulic Engineering, Vrije Universiteit Brussel, Pleinlaan 2, 1050 Brussels, Belgium
5
Abdullah Alrushaid Chair for Earth Science Remote Sensing Research, Geology and Geophysics Department, College of Science, King Saud University, Riyadh 11451, Saudi Arabia
6
Civil Engineering Department, Higher Institute for Engineering and Technology, Ministry of High Education, New Damietta 34512, Egypt
*
Authors to whom correspondence should be addressed.
Sustainability 2023, 15(12), 9513; https://doi.org/10.3390/su15129513
Submission received: 10 May 2023 / Revised: 1 June 2023 / Accepted: 6 June 2023 / Published: 13 June 2023
(This article belongs to the Special Issue Sustainable Water Resource Management and Agriculture Development)

Abstract

:
The water supply in Saudi Arabia is already depleted. Climate change will exacerbate the demand for these resources. This paper examines how climate change affects the water demands of Saudi Arabia’s most important food crops: wheat, clover, vegetables, and dates. To reduce the adverse climate change impacts on these crops’ productivity, as well as their irrigation water requirements (IWR), a number of adaptation techniques were investigated. The study was carried out for the Ar Riyadh region, Saudi Arabia, with a cultivated area of 179,730 ha. In this study, five climate models from the Coupled Model Intercomparison Project Phase 6 (CMIP6) for two Shared Socio-economic Pathways (SSPs), SSP2-4.5 and SSP5-8.5, were used to forecast and investigate the potential impacts of climate change on agricultural water resources in the Al-Riyadh Region of Saudi Arabia. To simulate IWRs under the present and projected climate change scenarios, CROPWAT8.0 was used. The results showed that the maximum increase ratio in 2100 under SSP2-4.5 and SSP5-8.5, respectively, will be 4.46% and 12.11% higher than in the current case (2020). The results showed that the projected maximum temperatures in 2100 will be increased by 4.46% and 12.11%, respectively, under SSP2-4.5 and SSP5-8.5, compared to the current case (2020), supporting past research on the Arabian Peninsula that revealed that both short- and long-term temperature increases are anticipated to be considerable. Under SSP2-4.5 and SSP5-8.5, the projected ETo was found to be increased by 2.18% and 6.35% in 2100, respectively. Given that evapotranspiration closely mirrors the temperature behavior in the study region from June to August, our data suggest that crop and irrigation demand may increase in the mid to long term. The findings indicate that Riyadh, Saudi Arabia’s capital and commercial hub, will require more water to irrigate agricultural land because of the expanding ETo trend. Under SSP2-4.5 and SSP5-8.5, the projected growth irrigation water requirement (GIWR) will be increased by 3.1% and 6.7% in 2100, respectively. Under SSP5-8.5, crop areas of wheat, clover, dates, maize, citrus, tomato, potato, and other vegetables in Ar Riyadh will decrease by 6.56%, 7.17%, 5.90%, 6.43%, 5.47%, 6.99%, 5.21%, and 5.5%, respectively, in 2100. Conversely, under SSP2-4.5, the crop areas will decrease by 3.10%, 3.67%, 2.35%, 3.83%, 2.32%, 4.18%, 1.72%, and 2.38% in 2100, respectively. This research could aid in clarifying the adverse climate change impacts on GIWR in Ar Riyad, as well as improving water resource management planning.

1. Introduction

In arid and semi-arid locations such as Saudi Arabia, climate change has taken on significant importance in water resource management. Rapid population growth, limited water resources, and seasonal weather fluctuations are the primary factors affecting Saudi Arabia’s self-sufficiency in many key crops [1,2]. Climate change, both directly and indirectly, is increasing the pressure on achieving self-sufficiency, food security, and safe food [3]. According to Schwartz [4], experts estimate a temperature rise of 1.5 to 4.5 °C in the next 40 years as a result of carbon dioxide levels, tripling since preindustrial times. A group of scientists has now narrowed the temperature spread to among 2.6 and 4.1 °C.
Climate change may exacerbate current dangers in water-scarce locations while opening up new opportunities in other areas. Agricultural water management necessitates the development of adaptation techniques that take advantage of the recognition of these threats, and adaptation strategies have been developed by Iglesias and Garrote [5]. According to Ritchie and Roser [6], climate change is one of the world’s most pressing issues. Global temperatures have risen roughly 1 °C from pre-industrial times as a result of man-caused greenhouse gas emissions. Among them are carbon dioxide (CO2), methane (CH4), and other gases. CO2 emission rates amount to more than 36 billion tons per year around the world, while CO2 concentrations in the atmosphere consistently exceed more than 400 parts per million. This is the highest level in 800,000 years. China has displaced the United States as the world’s largest CO2 emitter (about 25% of emissions).
Kaini et al. [7] investigated the limits of previous research on the choice of global climate models (GCMs) and methods for bringing fresh climate knowledge to the area. They went on to state that selecting GCMs with high competency to reflect the past and predicted future climate for a specific location is an important stage when evaluating the climate change effects on various industries. The average yearly temperature is expected to climb, but at a quicker rate during the winter than during the monsoon season, according to the data. Schilling et al. [8] investigated and compared Egypt, Algeria, Tunisia, Morocco, and Libya’s vulnerability to climate change and the socioeconomic consequences. The results show that due to climate change, all nations are susceptible to considerable rises in temperatures and a severe risk of droughts. The already hazardous water situation in North Africa is extremely likely to get worse due to climate change and the region’s fast population expansion. The characteristics of climate were investigated by Almazroui et al. [9] in different climatic regions and different seasons over Saudi Arabia for 43 years using two methods: (i) fixed threshold and (ii) the standard metrics. According to the data, rainfall occurs more frequently during the rainy season in the northern, coastal, and interior areas and less frequently during the dry season in the highland and southern regions. The measures used to monitor the frequency of warm days reveal a growing tendency throughout all seasons and locales. Moreover, Haque and Khan [10] analyzed variations in temperature and rainfall in the kingdom during a 50-year period. According to the findings, the air is very dry, and powerful convection carries massive amounts of dust into the lower atmosphere, resulting in impaired visibility and often foggy circumstances. Depressions in this air mass commonly track through northern Saudi Arabia’s desert plains, and agricultural losses will be greater under all emission scenarios by the end of the twenty-first century. Chowdhury and Al-Zahrani [11] estimated a 15–25 mm/year rise in rainfall over Saudi Arabia by 2050, while Al-Zawad [12] projected a 26–35 mm/year increase from 2070 to 2100. While Chowdhury and Al-Zahrani [11] projected a rainfall rise of 109.7–130.4 mm/year in the southwest, Al-Zawad [12] forecasted a 96.7 mm/year increase. The west coast of Saudi Arabia saw an extraordinary temperature pattern, according to Rehman and Al-Hadrami [13]. This study shows an increase in temperatures during the summer and the number of hot days annually, probably as a result of the cumulative impact of higher summer temperatures and lower summer rainfall. Potentially more quickly than the average annual minimum temperature is the mean annual maximum temperature rising. Almazroui [14] reported a 0.65 °C rise in temperature per decade. Conversely, increased extreme rainfall events would affect the central region to the Red Sea coast. The regional climate model (PRECIS) was used to make predictions in this study. The temperature rises, evapotranspiration rises, variable rainfall patterns rise, and other climatic elements interact to affect crop water requirements (CWR). Understanding CWR, the state of the water supply today, and the anticipated effects of climate change are crucial for better management of the available resources and agricultural productions. Several methods can be used to forecast the CWR. The Food and Agriculture Organization (FAO) [15] proposed using CROPWAT to properly determine CWR under different climate change scenarios. CROPWAT has been frequently employed in agricultural crop scheduling and CWR assessment [16,17].
The productivity of agriculture and the availability of food will be significantly impacted by these climate changes [3]. The impact of increasing temperatures on crops may be very manifest [18]. The results indicated that a rise in temperature of +1 degree during the growing season may result in a 3–10% reduction in wheat productivity [18]. According to the findings of the [19] study, predicted climate change will, in the best-case scenario, result in an increase in CWR over the following 30 years. Feng et al. [20] demonstrated that climate change was a contributing cause to oscillations in grain output using climate data and grain yield records from 1978 to 2021. Conversely, the authors of [21] reported the losses in irrigation water supplies were expected to reach 9% in the best-case scenario (year 2080). According to Yin et al. [22], by 2071–2100, the risks of bivariate drought hazards would have increased 10-fold, owing primarily to increases in heat extremes. Shen et al. [23] stated that both day and night temperatures had different impacts on the yearly net primary productivity of wetlands on the Qinghai–Tibet Plateau.
This study used five different climate models to look at how climate change may affect Ar Riyadh’s annual mean temperature in the years 2040, 2060, 2080, and 2100. Forecasting the effects of climate change on the irrigation water requirements for the main crops farmed in Ar Riyadh is also important. According to the aforementioned, no research has been done to predict how climate change could affect the quantity of water required for agriculture in the Ar Riyadh region. To achieve these objectives, (i) we collected the current climate, soil, and crop data in Ar Riyadh; (ii) the future weather data (maximum temperature (Tmax), minimum temperature (Tmin), and rainfall) for the years 2040, 2060, 2080, and 2100 under SSP2-4.5 and SSP5-8.5 emission scenarios for five climatic models were obtained from the Coupled Model Intercom-parison Project Phase 6 (CMIP6) database (https://pcmdi.llnl.gov/CMIP6/) (accessed on 3 October 2022); (iii) the CROPWAT 8 Model was utilized to estimate the evapotranspiration (ETo) and crop water requirements; (iv) the deficit in crop areas (%) due to the climate change scenarios were computed; and (v) different solutions were discussed.

2. Materials and Methods

2.1. Study Area Description

In Saudi Arabia, the Ar Riyadh region is located in the country’s geographic center. It has a 404,240 km2 total area and an estimated 8.5 million inhabitants. It is the second-largest region in terms of both land and population, after only the Eastern Province and the Mecca Region (Figure 1). Ar Riyadh is the region’s and kingdom’s most populous city, with slightly less than two-thirds of the region’s people residing there. The average monthly temperature of Ar Riyadh varies from 3.5 °C in winter to 39 °C in summer, making it dry [24]. With an average daily evapotranspiration rate of 7 mm, there is roughly 58 mm of rainfall per year on average. The humidity varies from a minimum of 20% in the dry months to as high as 58% in the winter, with the average wind speed being 6 to 10 km/h. In this region, rainfall has a negligible impact on agriculture [25]. Al-Mutaz [26] reports that the city receives fresh water from a variety of reverse osmosis units, with a combined daily output of roughly 192,000 m3. The Minjur aquifer, a sandstone aquifer with nearly 1200 m of thickness, is the main source of water in Ar Riyadh. Ar Riyadh has 15 wastewater treatment plants in Ar Riyad processing 504.11 MCM per year, at a rate of 137,575 m3/day used for irrigation [16].
The main cultivated crops in Ar Riyadh are wheat, maize, tomato, potato, other vegetables, clover, dates, and citrus, with a cultivated area of 178,666 ha. The net irrigation water requirements (NIWR) and growth irrigation water requirements (GIWR) for these eight main crops in Ar Riyadh are determined in this study. Modern irrigation (sprinkler and drip) systems are applicable. Table 1 summarizers the crop planting and harvested dates for Ar Riyadh. The soil in the Ar Riyadh cultivated area is a medium soil (silty sand), with the total available soil moisture, maximum infiltration rate, maximum infiltration rate, maximum rooting depth, initial soil moisture depletion, and initial available soil moisture of 200 mm m−1, 40 mm day−1, 250 cm, 0%, and 0%, respectively.

2.2. Climate Data

Future weather data (maximum temperature (Tmax), minimum temperature (Tmin), and rainfall) for the years 2040, 2060, 2080, and 2100 under SSP2-4.5 and SSP5-8.5 emission scenarios for five climatic models were obtained from the Coupled Model Intercomparison Project Phase 6 (CMIP6) database (https://pcmdi.llnl.gov/CMIP6/) (accessed on 3 October 2022). Five CMIP6 models were used: CAMS-CSM1-0 [27], ACCESS-CM2 [28], BCC-CSM2-MR [29], CNRM-CM6-1 [30], and MRI-ESM2-0 [31]. Figure 2 depicts the average weather data for the Ar Riyad region from 1991 to 2020 (current case). Ar Riyadh station is located at Latitude 24.71° N, Longitude 46.71° E, and Altitude 615 m.

2.3. CROPWAT 8 Model Description

CROPWAT 8 is a set of parts based on the Penman–Monteith technique that combines numerous models for predicting CWR, IWR, and crop scheduling [32]. It is based on the FAO-approved Penman–Monteith method for predicting reference evapotranspiration (ETo), crop evapotranspiration (ETc), and irrigation water management [21]. It should be emphasized that ETc denotes the amount of water lost to evapotranspiration by the crop, whereas CWR denotes the water quantity to be provided.

3. Results

Five climatic models were used to generate meteorological data for the Ar Riyadh weather station for the SSP2-4.5 and SSP5-8.5 emission scenarios. The results obtained were as follows:

3.1. Temperature and Rainfall Changes

Temperature and rainfall changes were compared for averages of current condition (year 2020) with the future changes for the years 2040, 2060, and 2100. Table 2 shows the variation in Tmax and Tmin (°C) and rainfall (mm) for the five models. The data are in line with historical records of precipitation and temperature over most of Saudi Arabia, which have been primarily warm and hot.
In SSP2-4.5, the average temperatures for 2040, 2060, 2080 and 2100 were in the ranges of 18.91–32.91, 19.57–33.20, 20.19–34.10, and 20.72–34.23 °C, respectively. Showing an accumulation increasing compared to the current 2020 temperature range (19.7–32.77 °C), also in SSP5-8.5, the data showed an increase with ranges of 18.91–32.58, 20.23–34.18, 21.74–35.27, and 22.87–36.73 °C, respectively.
The average annual rainfall in this area showed an oscillating trend through time, across the first twenty-year period (2040), at 8.15 and 7.85 for the two scenarios. The two middle periods (2060 and 2080) showed small decreasing trends, being 7.63 mm and 7.16 mm, respectively, in SSP2-4.5, while higher values were found in SSP5-8.5, being 7.51 mm and 7.61 mm, respectively. During the last period (2100s), the highest values will reach 8.25 mm and 9.20 mm under the two scenarios.

3.2. Reference Evapotranspiration (ETo) Variation

Increased reference evapotranspiration (the indirect CO2 impact) is mainly connected by higher temperature, depending on the crop type and the growth stage of the plant [33]. The ETo was estimated for Ar Riyadh weather station under SSP2-4.5 and SSP5-8.5 scenarios for the periods of 2040, 2060, 2080, and 2100. The change of ETo was compared with the average of the current period 2020. Table 3 summarizes the daily ETo for the five models.
The mean daily ETo in the current period is 3.66 mm/day. However, in the future periods, the mean daily ETo predicted a very slight decrease from the present with approximately −0.66% and −0.48% in SSP2-4.5 and SSP5-8.5, respectively. These outcomes appear to be consistent with previous research that found increased ETo to be associated to temperature and humidity in most of Saudi Arabia [34,35]. During the last period (2100s), the highest ETo variability will be 2.18% and 6.35% for SSP2-4.5 and SSP5-8.5 scenarios, respectively, as indicated by Table 3. In general, the intensity of ETo is expected to gradually rise in the 2060s and 2080s before becoming drastic in the 2100s, and even more so in the most serious scenario (SSP5-8.5).

3.3. Crop Water Requirement

The NIWR and GIWR were calculated only for large-area crops, such as wheat, clover, other vegetables, and dates in Ar Riyadh under SSP2-4.5 and SSP5-8.5 scenarios for 2040, 2060, 2080, and 2100. The changes of NIWR and GIWR were compared with the average in the current period 2020. According to Brouwer [36], the irrigation efficiency of the sprinkler irrigation system utilized in this study for the cultivation of wheat, clover, various vegetables, maize, tomato, and potato was 75%, whereas the irrigation efficiency of the drip irrigation system used for the cultivation of dates and citrus was 90%. Table 4 summarizes NIWR and GIWR in million m3 (MCM) for the five models under SSP2-4.5 and SSP5-8.5 scenarios and the current case (2020). A significant difference can be seen between the values of changes of GIWR in scenario SSP5-8.5 compared to SSP2-4.5, as it almost doubled after 2040, with variability increased by 1.5, 1.6, 2.9, and 3.1% for 2040, 2060, 2080, and 2100, respectively, compared to the current 2020 GIWR 1634.9 MCM under the least changed scenario (SSP2-4.5); however, the SSP5-8.5 scenario also showed a rise in GIWR for 2040, 2060, 2080, and 2100 by 0.7, 2.3, 4.6, and 6.7%, respectively.

4. Discussion

4.1. Maximum Temperature Changes

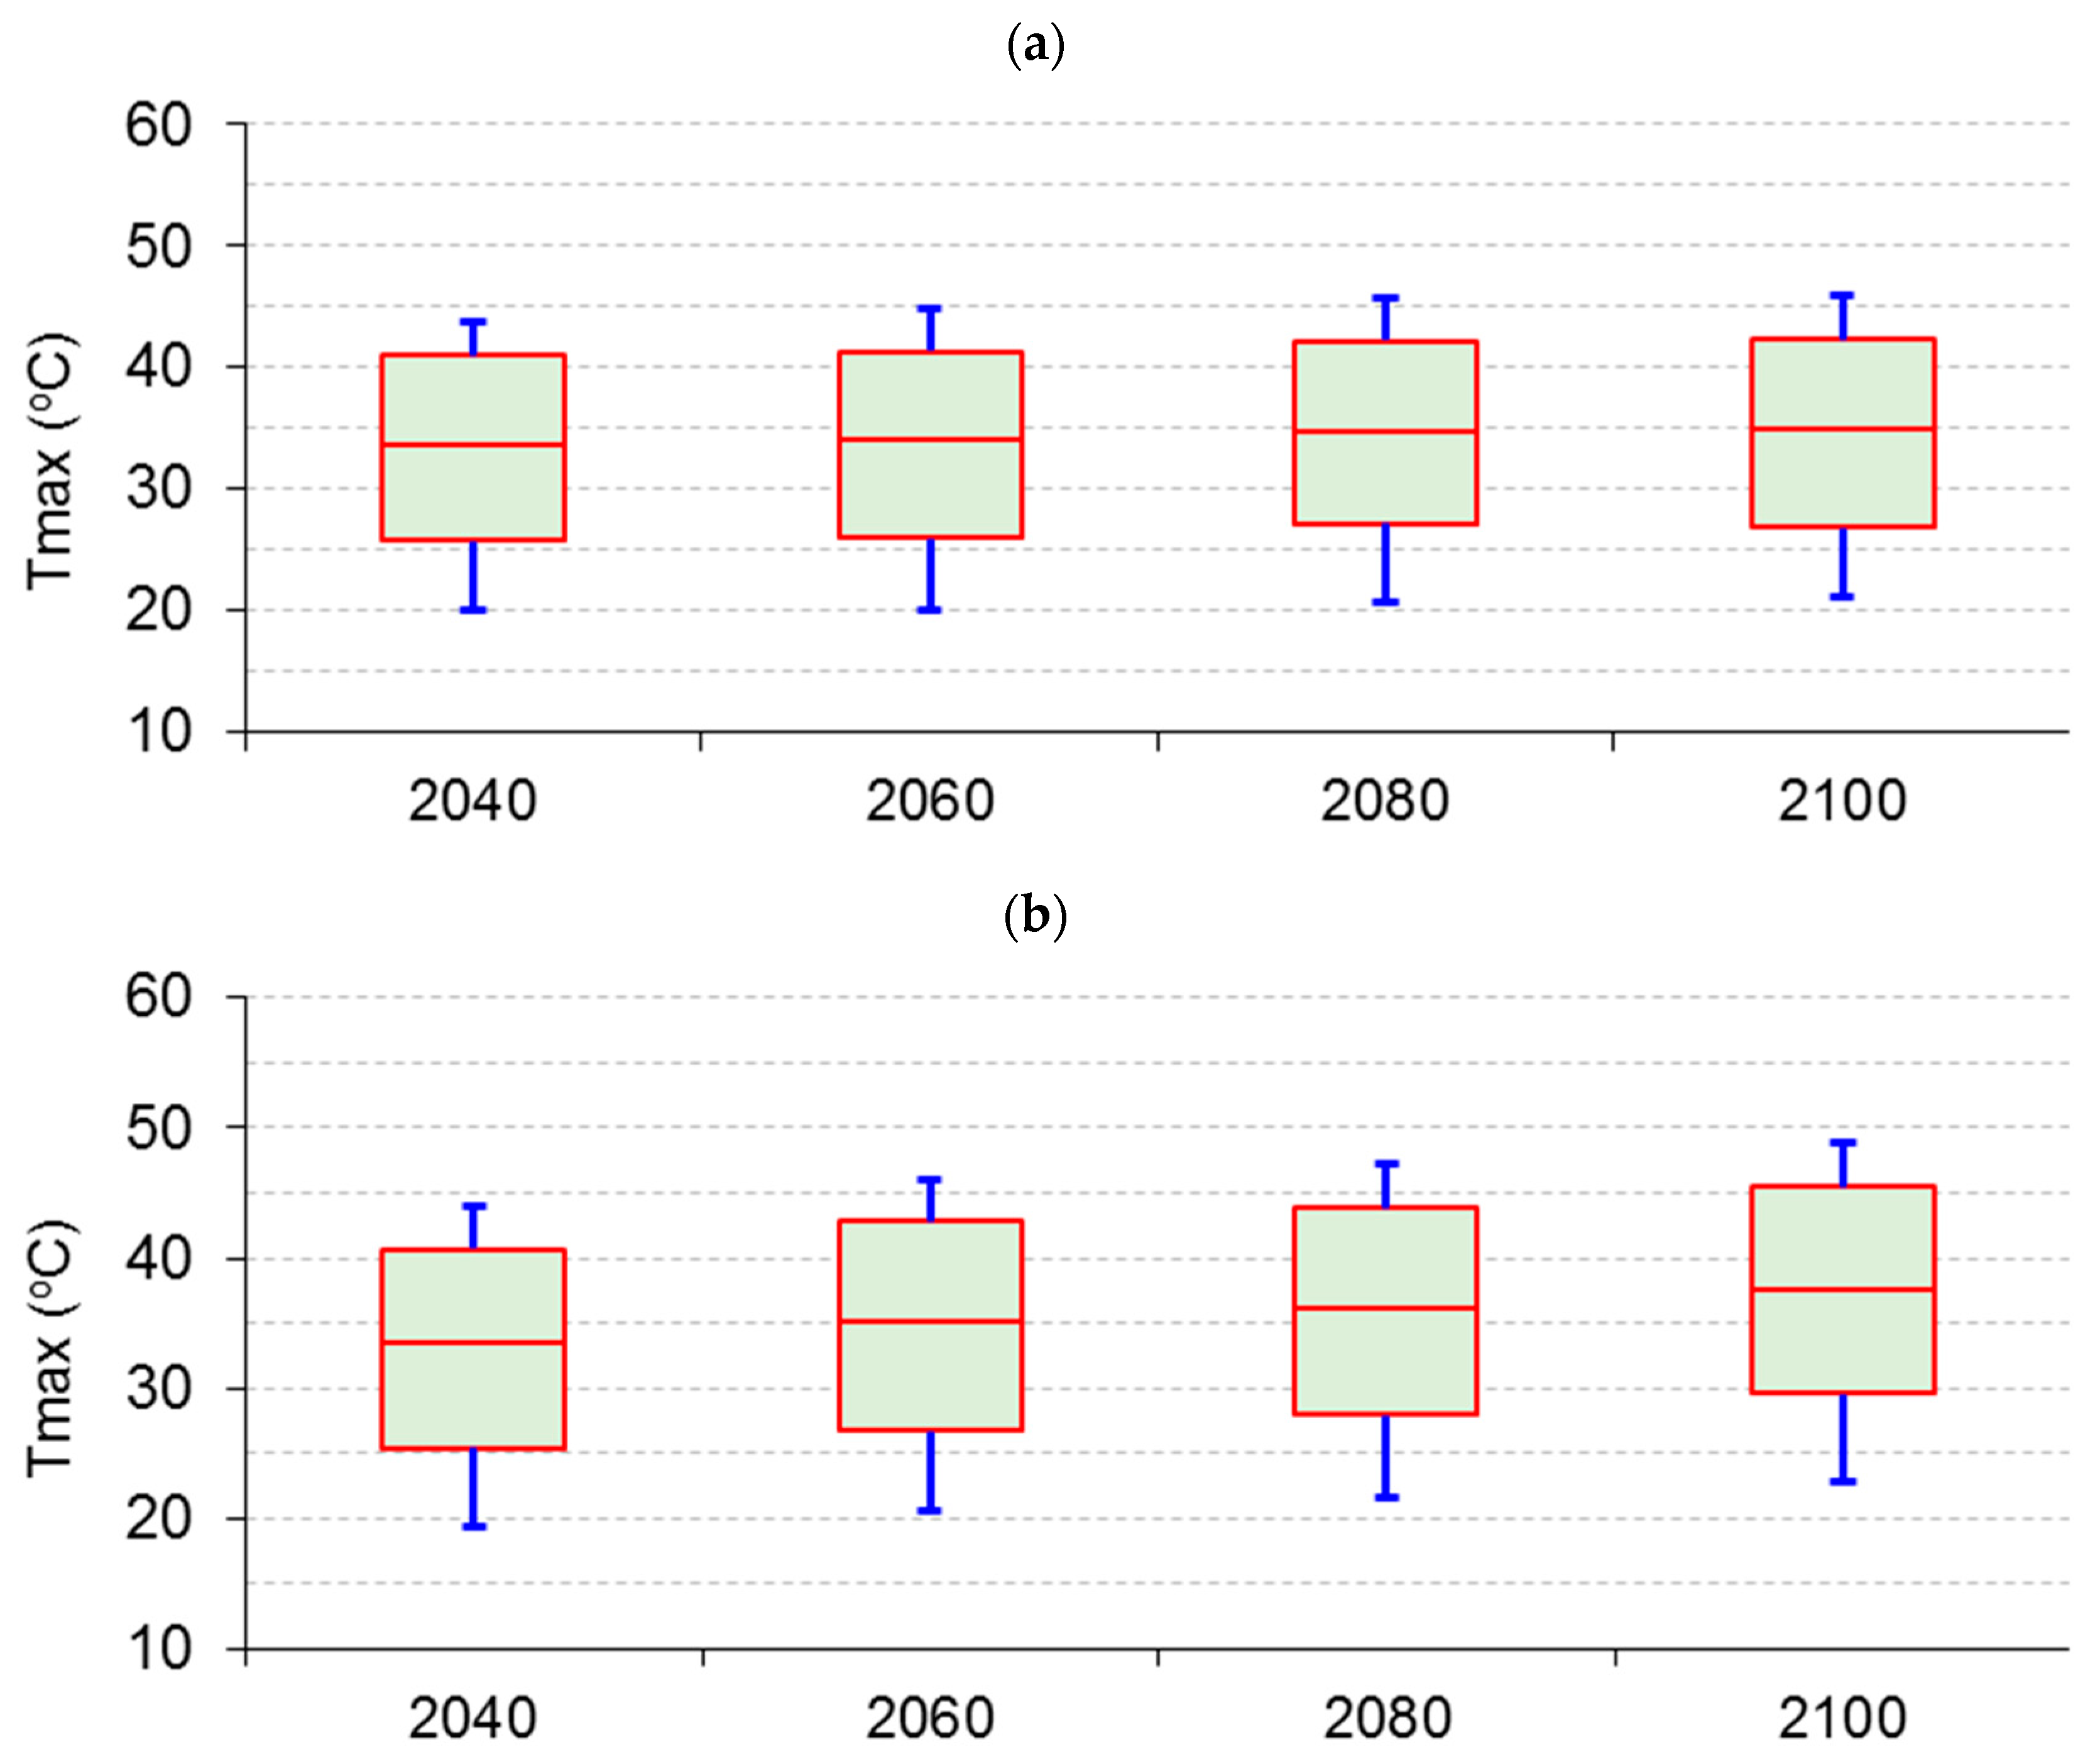
The maximum temperatures in SSP2-4.5 emission were found to be rising in the ranges of 43.88, 44.86, 45.85, and 45.93 °C, being higher than the current temperature (42.20 °C). The five models’ standard deviations range from 0.52 to 0.91 °C. Figure 3 clears the ascending increases in the maximum temperature. The standard deviation of the five models ranges from 0.52 to 0.91 °C. These results indicate temperature change ratios of 0.44, 1.31, 4.06, and 4.46% for the years 2040, 2060, 2080, and 2100, respectively, demonstrating that the models are changing more rapidly, as shown in Figure 4. Conversely, the data of SSP5-8.5 showed more change in the maximum temperature with ratios of −0.58, 4.32, 7.63, and 12.11% for the 2040, 2060, 2080, and 2100 scenarios, respectively, indicating an increase in all scenarios. The five models’ standard deviations range from 1.15 to 1.67 °C.
To increase crop evapotranspiration in response to the predicted rise in temperature, the quantity of irrigation water needed by the plant under the present scenario will be insufficient under climate change scenarios. Production will decrease if the plant is given the same amount of water as it is now.

4.2. Minimum Temperature Changes

In SSP2-4.5 emission, the minimum temperatures during 2040, 2060, 2080, and 2100 were found to be rising in the ranges of 7.69, 7.96, 8.37, and 9.34 °C, respectively, which is less than the current temperature (10.5 °C). Figure 5 shows the minimum temperature and how it will be lower than the mentioned present level, and then will escalate gradually. This is also evident in the temperature change ratios of −2.43, −0.40, 1.49, and 3.10% for the years 2040, 2060, 2080, and 2100, respectively, as shown in Figure 6. The opposite scenario SSP5-8.5 showed more change in the minimum temperature with ratios of −2.42, 1.63, 6.23, and 9.66% for the 2040, 2060, 2080, and 2100 scenarios, respectively. The findings of this study concur with earlier studies conducted on the Arabian Peninsula, which found that temperatures are expected to significantly increase in the short and long term [37].

4.3. Rainfall Changes

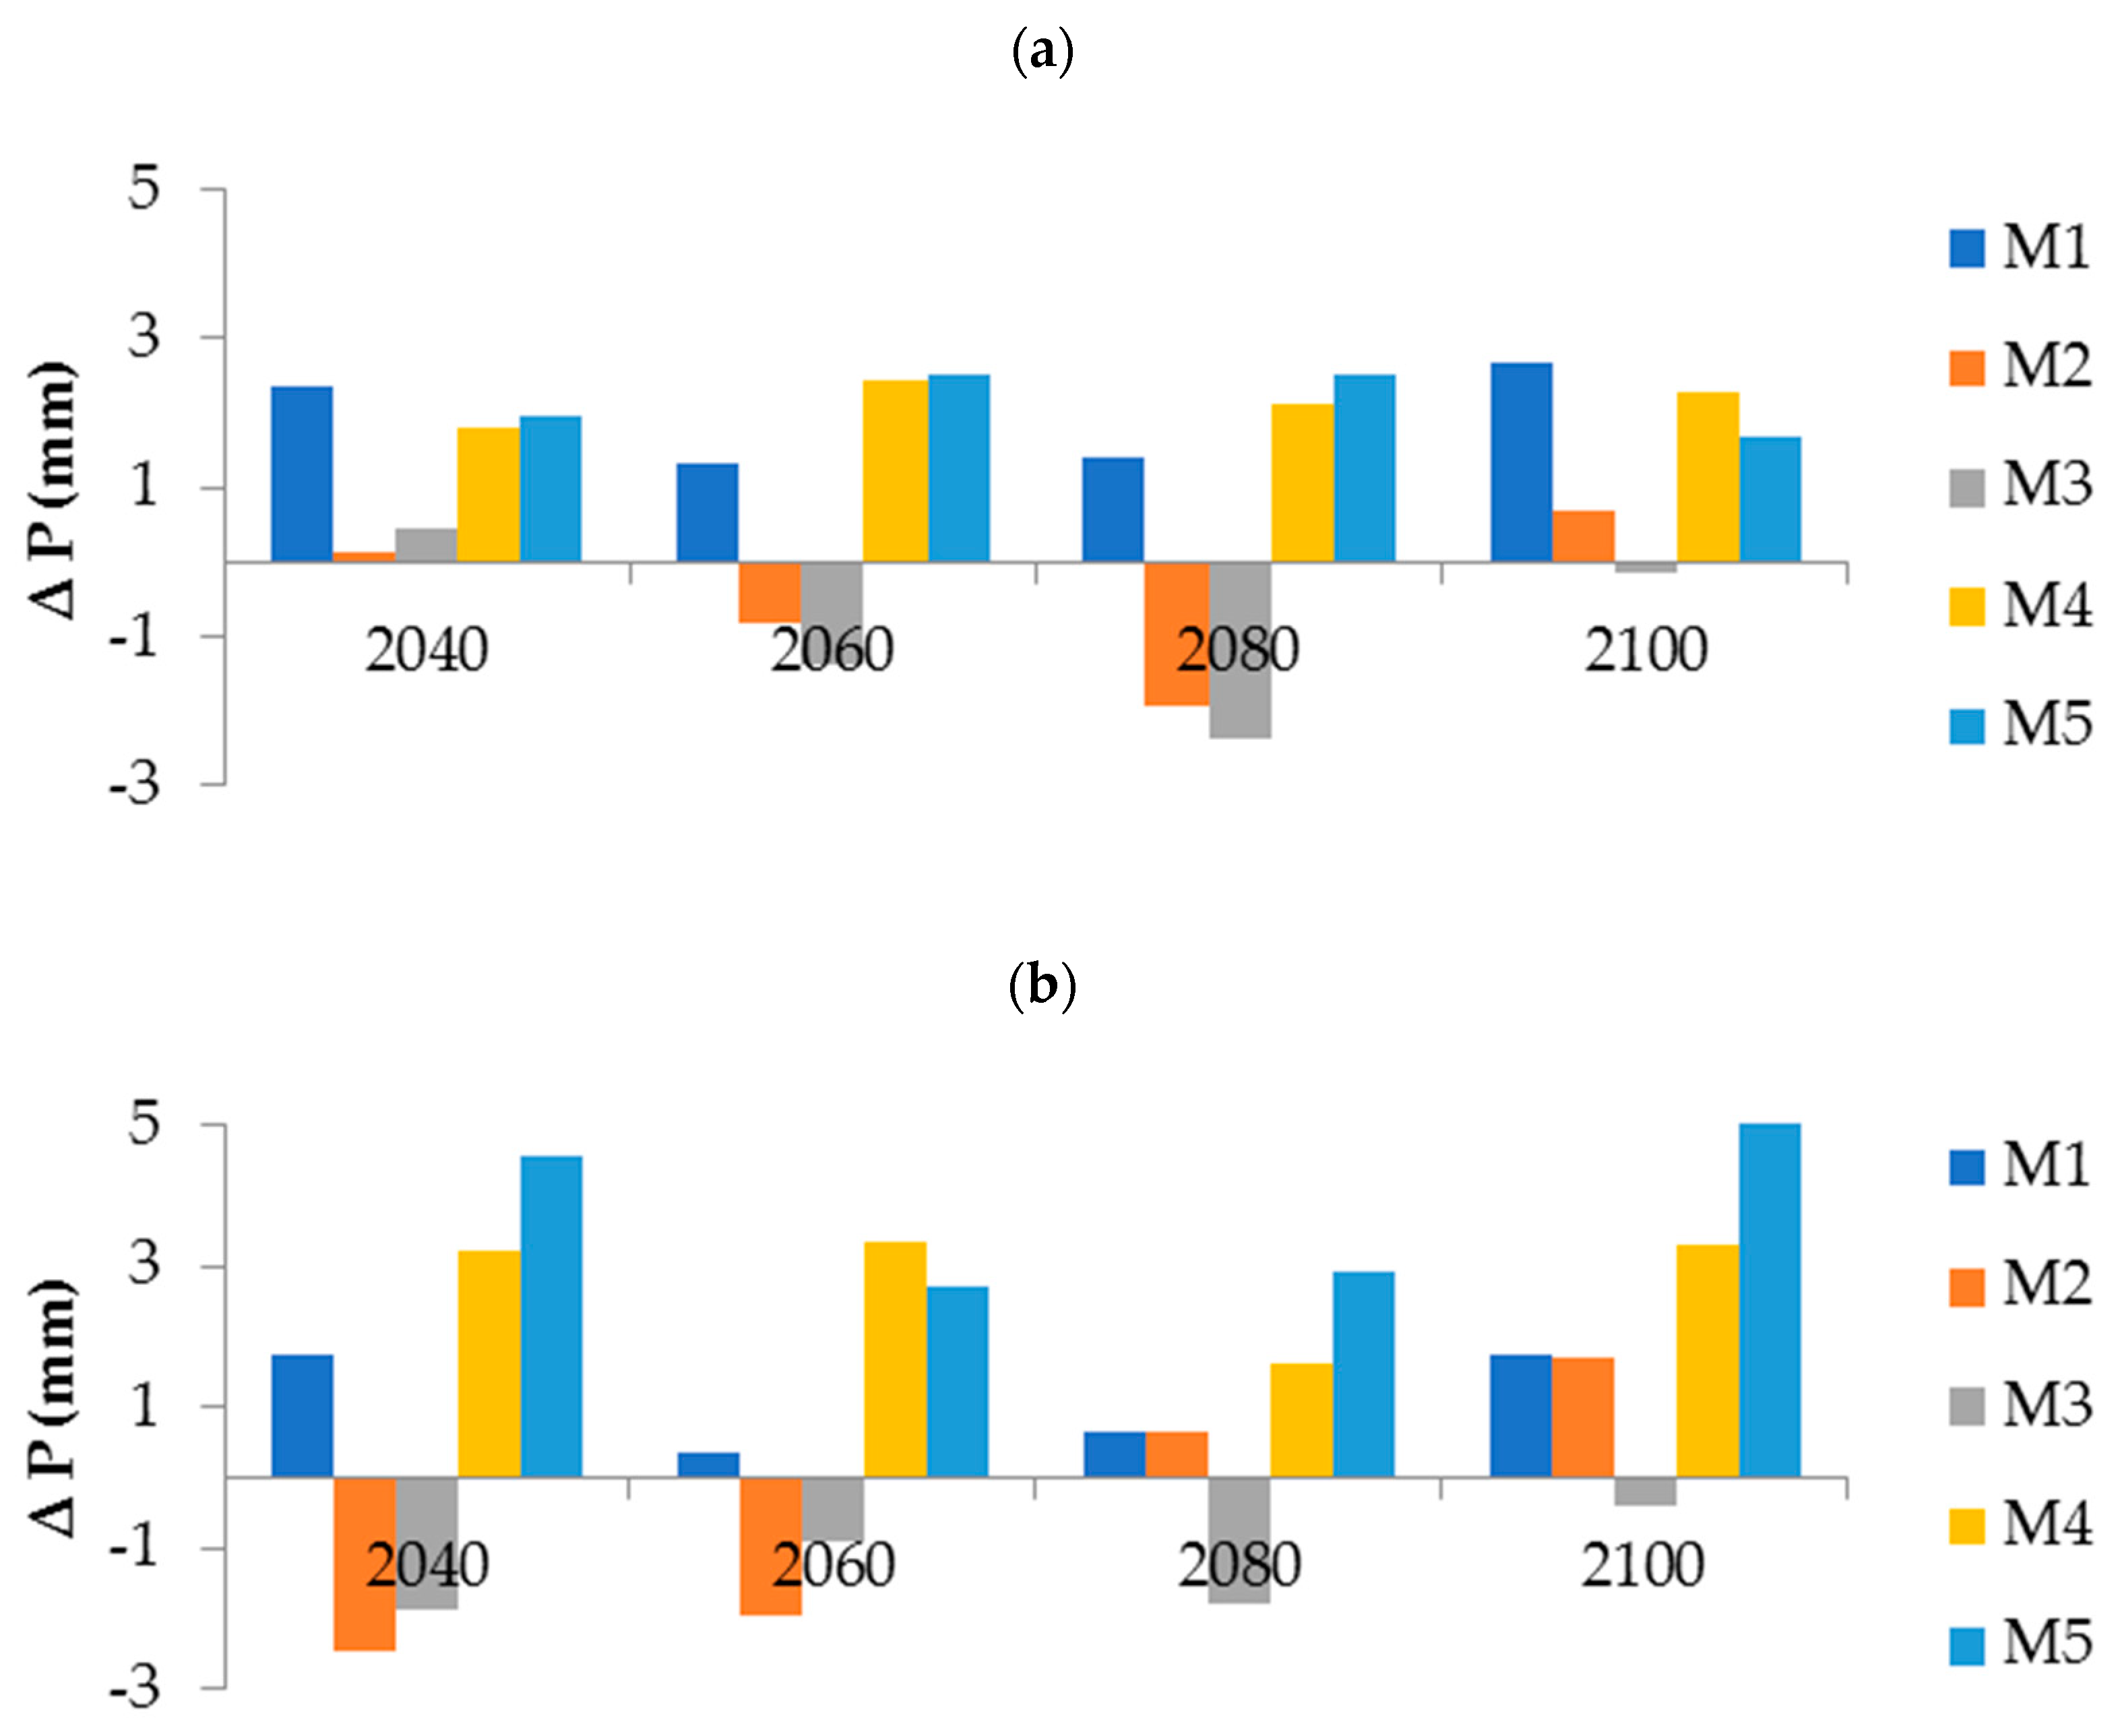
Figure 7 depicts the annual rainfall variability (mm/year) in the Ar Riyadh region for the future periods 2040, 2060, 2080, and 2100 under the two scenarios, demonstrating that rainfall increases at varying rates. The outcomes propose that the amount of rainfall may rise in the near future (2040s) by 4.08% and 3.16% from the current level for SSP2-4.5 and SSP5-8.5 scenarios, respectively, then will slightly decrease by 2.48% and 1.06% under SSP2-4.5, and 2.11% and 2.43% under SSP5-8.5 in the middle periods (2060s and 2080s). Conversely, during the last period (2100s), the highest values will reach 8.25 mm/year and 9.20 mm/year for SSP2-4.5 and SSP5-8.5 scenarios, respectively (Figure 8). A rising rate of precipitation results in more soil moisture, which is advantageous for crop growth and causes a higher evapotranspiration rate.

4.4. ETo Variation

The results of ETo values for the Ar Riyadh region during the four seasons: winter (December, January, and February), spring (March, April, and May), summer (June, July, and August), and autumn (September, October, and November) are presented in Figure 9. According to the SSP2-4.5 scenario, the mean monthly ETo was 1.84 mm/day in December, whereas 5.55 mm/day was recorded in July, which may have been caused by high net radiation brought on by that month’s high warmth and humidity. According to the SSP5-8.5 scenario, ETo would range between 1.96 mm/day in December to 5.74 mm/day in July, with the latter being the highest.
Previous findings indicate that crop and irrigation demand may grow in the mid- to long-term, particularly from June to August, since evapotranspiration parallels the temperature behavior in the study area. The results show that the growing Eto trend in Riyadh, Saudi Arabia’s capital and economic center, would increase the amount of water needed for agriculture irrigation.

4.5. ETc Variation

Figure 10 shows the Etc variability in the Ar Riyadh region for the five periods according to the two scenarios. The computed Etc for the current year, 2020, are 339.3, 965.2, 345.4, 1179.7, 490.4, 836.4, 641.1, and 404.4 mm/day for the crops wheat, clover, other vegetables, dates, maize, citrus, tomato, and potato, respectively. In SSP2-4.5 for the far future 2100s scenario, the values of Etc are increased to 346.7, 998.5, 350.4, 1204.7, 506.6, 852.9, 665.7 and 408.1 mm/day for wheat, clover, other vegetables, dates, maize, citrus, tomato, and potato, respectively. In SSP5-8.5 for the far future 2100s scenario, the values of Etc are increased to 359, 1034.6, 361.6, 1248.6, 520.2, 880.4, 685, and 422.6 mm/day for wheat, clover, other vegetables, dates, maize, citrus, tomato, and potato, respectively; this increase in Etc is a result of a rise in temperature during the growing season. Various earlier studies of regions with similar arid and semi-arid climatic conditions such as India (Kaushika et al. [38]), Egypt (Makar et al. [21]), and Ethiopia (Hordofa et al. [20]) reached a similar conclusion: in the long run, a slight increase or reduction in precipitation and an observable increase in temperature will result in an increase in crop water requirements, particularly if sowing dates are delayed.

4.6. Deficit in Crop Areas (%) Due to the Climate Change Scenarios

One of the major environmental concerns for development is global warming, particularly in dry and semi-arid countries with scarce water supplies [3]. Wheat, clover, various vegetables, dates, maize, citrus, tomato, and potato are some of the most vital global crops since they are the staple foods of the worldwide population [39], finding a considerable decline in yield in China as a consequence of rising temperatures, and it was determined that a change in temperature of 1.8 °C might result in a 3–10% decline in wheat yields. Moreover, the authors of [40] observed that a rise of 4 temperate degrees might reduce the potential yield by up to 32%, while a rise of 6 temperate degrees could reduce it further by 50%.
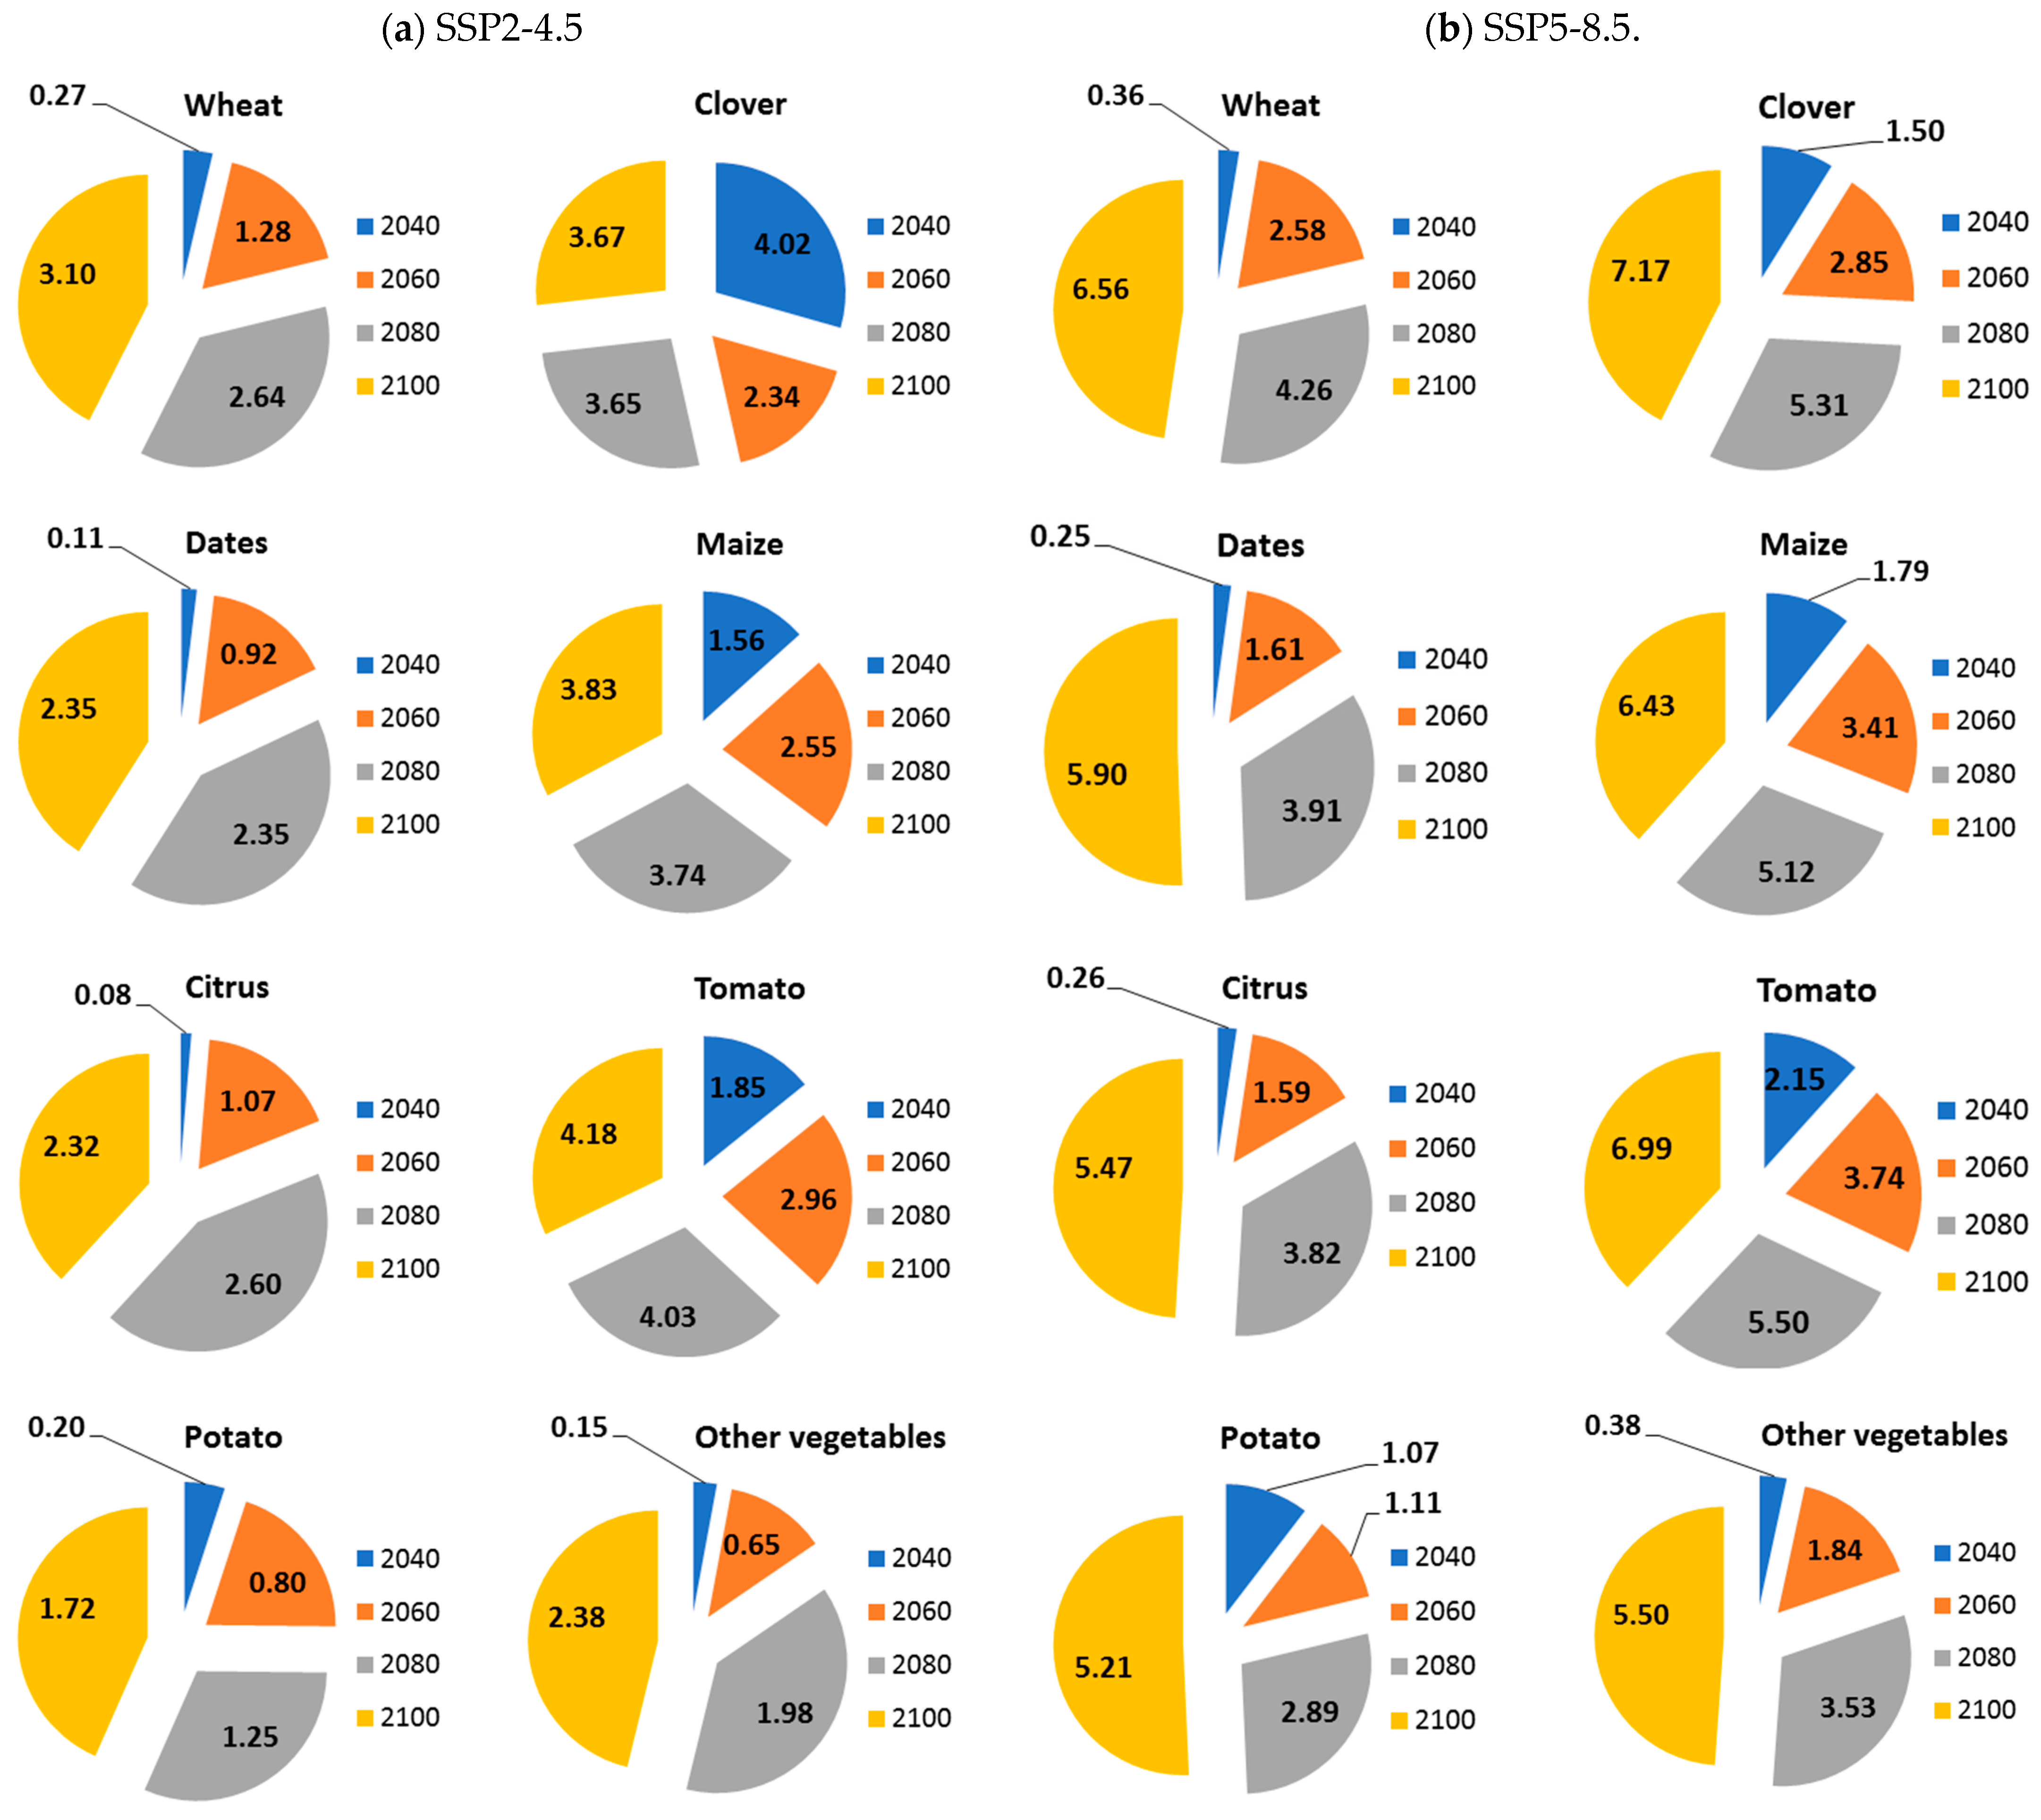
In order to provide enough water to support Ar Riyadh’s rapid population growth and to lessen a few of the negative effects of rising temperatures and increased water demand brought on by climate change, numerous procedures and policies must be implemented. This study examined the impacts of climate change on GIWR for the mentioned crops. As shown in Figure 11, the worst-case scenario (SSP5-8.5) showed a remarkable drop in crop productivity under the predicted climate change conditions, wherein the crop areas of the crops (wheat, clover, dates, maize, citrus, tomato, potato, and other vegetables) in Ar Riyadh will decrease by 6.56%, 7.17%, 5.90%, 6.43%, 5.47%, 6.99%, 5.21%, and 5.5%, respectively, under SSP5-8.5 in 2100, while less of a decrease will occur in SSP2-4.5, wherein crop areas will decrease by 3.10%, 3.67%, 2.35%, 3.83%, 2.32%, 4.18%, 1.72%, and 2.38%, respectively, in 2100.
This analysis predicts a long-term scarcity of 6.56% of wheat, the most significant food crop in the world, by the year 2100. The wheat yield values in the research region are rather close to what is anticipated in the surrounding region, for instance, in Egypt. According to Mostafa et al. [3], the highest reduction in wheat crops between current output and 2100 was roughly 10%. Conversely, higher values were found in the decrease in the wheat crop in other countries such as Ethiopia, where the authors of [18] confirmed that the decrease could reach (18% and 30%) for normal years.
Methane (CH4), carbon dioxide (CO2), and other greenhouse gases are of particular concern. The worldwide CO2 emission rates, which reach more than 36 billion ton/year, are the primary reason for the draconian climate change. The atmospheric CO2 level consistently exceeds 400 parts per million [6]. Therefore, in the context of climate change’s impact on water resource management in arid region such as Ar Riyadh, enhancing irrigation efficiency to lower water demand is a must, using contemporary irrigation techniques to conserve water for agriculture, bettering water resources planning, selecting crops that can withstand fluctuations in the soil’s climate, determining how various climate change situations affect various plant species, altering cultural customs or planting seasons, physical and ecological adaptation through enhancing yields, and boosting soil carbon storage. Moreover, using energy and salt-tolerant crops that can grow in saline soil, such as Jojuba, Jatropha, Miscanthus, and Poplar; modifying current drainage systems to regulate the water table; and determining the types of salts influencing the soil and selecting the most effective technique of reclamation to stop soil leaching, prior to releasing it into groundwater and open waterways is how industrial and health facility effluent is treated. In addition, the energy adaptation of bioenergy through the cultivation of commercial bio-energy crops and a switch in demand from liquid fuel oil to natural gas could reduce greenhouse gas emissions [16,21,41]. Furthermore, changes in precipitation volume, precipitation type, runoff, and increasing flooding are four dangers due to climate change potentially being reduced through technology advancement, for example, (i) redesigning the levee, food control, and storm drainage systems, as well as the size of the food control reservoirs, and (ii) using rainwater harvesting, which involves gathering and storing rainwater [42,43,44,45,46,47].

5. Conclusions

As is clear from the above sections, previous studies focused on studying climate change forecasts in various possibilities and scenarios and drawing conclusions about the expected effects of the regions of the Kingdom of Saudi Arabia in general, hence the importance of focusing on the most important city, Ar Riyad, as the capital and economic center, as well as the need to examine how climate change affects the water demands of Saudi Arabia’s most important food crops: wheat, clover, vegetables, and dates. Changes in IWR were anticipated for the current period 1991–2020, as well as in the SSP2-4.5 and SSP5-8.5 scenarios for the years 2040, 2060, 2080, and 2100 based on five climate models.
The results of the current study are in line with other studies published throughout the Arabian Peninsula, which found that temperatures are expected to rise considerably in the short and long term. The SSP5-8.5 scenario showed higher values in all climate change assessment items in this study compared to the SSP2-4.5 scenario. These results showed an increase in all scenarios, while the annual rainfall (mm/year) slightly decreased by 2.48% and 1.06% under SSP2-4.5, and 2.11% and 2.43% under SSP5-8.5 in the middle periods (2060s and 2080s), which is advantageous for crop growth and causes a higher evapotranspiration rate. Consecutively, in the future periods, the mean daily ETo predicted a very slight decrease from the present, with approximately −0.66% and −0.48% in SSP2-4.5 and SSP5-8.5, respectively. The findings also showed an increase in GIWR and a remarkable drop in crop productivity under the predicted climate change conditions in that the crop areas of the crops (wheat, clover, dates, maize, citrus, tomato, potato, and other vegetables) in Ar Riyadh will decrease by 6.56%, 7.17%, 5.90%, 6.43%, 5.47%, 6.99%, 5.21%, and 5.5%, respectively, under SSP5-8.5 in 2100, due to the expected increase in the value of ETc. This expected shortage in the production of important food crops must find constructive and developmental solutions. The most common and useful solutions for crop production that is sustainable include the following: controlling irrigation, moving crops, altering sowing density, adding new crop varieties, planning crop rotations, and expanding agricultural territories. It is believed that strategically moving agricultural planting or transplanting dates can help to maximize the use of the rainfall that is already available and reduce the need for irrigation. Otherwise, the adaptation measures indicated that delaying the sowing date of wheat crops under climate change conditions results in a significant decrease in agricultural production because delaying the sowing date also exposes plants to high temperatures before the growing season ends.
Future rising temperatures will necessitate more irrigation water to meet crop demands. It will also be necessary to develop new crop varieties with improved heat and drought tolerance, particularly for wheat and clover. New crop varieties, particularly wheat and clover, that are more tolerant of heat and drought will be required. Crop cultivars with higher temperature tolerance and a longer growing season may increase potential output, but because plants require more water, irrigation demand will rise. Conversely, higher stress tolerance cultivars can be seeded more densely, resulting in higher grain yields per unit area. Furthermore, for date palm and citrus, subsurface drip irrigation systems are required to save irrigation water. This study could aid in mitigating the adverse impacts of climate change on NIWR in Ar Riyadh, as well as in planning water resource management.

Author Contributions

Conceptualization, M.E.-R.; methodology, M.E.-R.; software, M.E.-R. and M.E.G.; validation, M.E.-R.; formal analysis, M.E.-R.; investigation, M.E.-R.; resources, M.E.-R.; data curation, M.E.-R.; writing—original draft preparation, M.E.-R. and H.F. writing—review and editing, M.E.-R., H.F., F.A., W.Z., S.A., F.K.Z., M.A. and M.E.G.; visualization, M.E.-R. All authors have read and agreed to the published version of the manuscript.

Funding

This research was funded by the Deputyship for Research and Innovation, Ministry of Education in Saudi Arabia, for funding this research (IFKSURC-1-7313).

Institutional Review Board Statement

Not applicable.

Informed Consent Statement

Not applicable.

Data Availability Statement

Data are available based on request from the first author.

Acknowledgments

The authors extend their appreciation to the Deputyship for Research and Innovation, Ministry of Education in Saudi Arabia, for funding this research (IFKSURC-1-7313).

Conflicts of Interest

The authors declare no conflict of interest.

References

  1. Chowdhury, S.; Al-Zahrani, M.; Abbas, A. Implications of climate change on crop water requirements in arid region: An example of Al-Jouf, Saudi Arabia. J. King Saud Univ. Eng. Sci. 2016, 28, 21–31. [Google Scholar] [CrossRef] [Green Version]
  2. Tarawneh, Q.Y.; Chowdhury, S. Trends of Climate Change in Saudi Arabia: Implications on Water Resources. Climate 2018, 6, 8. [Google Scholar] [CrossRef] [Green Version]
  3. Mostafa, S.M.; Wahed, O.; El-Nashar, W.Y.; El-Marsafawy, S.M.; Abd-Elhamid, H.F. Impact of climate change on water resources and crop yield in the Middle Egypt region. J. Water Supply Res. Technol. 2021, 70, 1066–1084. [Google Scholar] [CrossRef]
  4. Schwartz, J. How Much, Exactly, Will Greenhouse Gases Heat the Planet? Available online: https://www.nytimes.com/2020/07/22/climate/global-warming-temperaturerange.html (accessed on 15 March 2022).
  5. Iglesias, A.; Garrote, L. Adaptation strategies for agricultural water management under climate change in Europe. Agric. Water Manag. 2015, 155, 113–124. [Google Scholar] [CrossRef] [Green Version]
  6. Ritchie, H.; Roser, M. CO₂ and Greenhouse Gas Emissions—Our World in Data. Available online: https://ourworldindata.org/co2-and-other-greenhouse-gas-emissions (accessed on 18 December 2021).
  7. Kaini, S.; Gardner, T.; Sharma, A.K. Assessment of socio-economic factors impacting on the cropping intensity of an irrigation scheme in developing countries. Irrig. Drain. 2020, 69, 363–375. [Google Scholar] [CrossRef]
  8. Schilling, J.; Hertig, E.; Tramblay, Y.; Scheffran, J. Climate change vulnerability, water resources and social implications in North Africa. Reg. Environ. Chang. 2020, 20, 15. [Google Scholar] [CrossRef] [Green Version]
  9. Almazroui, M.; Halwani, H.A.; Islam, N.; Ghulam, A.B.S.; Hantoush, A.S. Regional and seasonal variation of climate extremes over Saudi Arabia: Observed evidence for the period 1978–2021. Arab. J. Geosci. 2022, 15, 1605. [Google Scholar] [CrossRef]
  10. Haque, M.I.; Khan, M.R. Impact of climate change on food security in Saudi Arabia: A roadmap to agriculture-water sustainability. J. Agribus. Dev. Emerg. Econ. 2022, 12, 1–18. [Google Scholar] [CrossRef]
  11. Chowdhury, S.; Al-Zahrani, M. Implications of Climate Change on Water Resources in Saudi Arabia. Arab. J. Sci. Eng. 2013, 38, 1959–1971. [Google Scholar] [CrossRef]
  12. Al-Zawad, F.M. Impacts of climate change on water resources in Saudi Arabia. In Proceedings of the 3rd International Conference on Water Resources and Arid Environments and the 1st ArabWater Forum, Ar Riyad, Saudi Arabia, 16–19 November 2008. [Google Scholar]
  13. Rehman, S.; Al-Hadhrami, L.M. Extreme Temperature Trends on the West Coast of Saudi Arabia. Atmos. Clim. Sci. 2012, 2, 351–361. [Google Scholar] [CrossRef] [Green Version]
  14. Almazroui, M. Simulation of present and future climate of Saudi Arabia using a regional climate model (PRECIS). Int. J. Clim. 2013, 33, 2247–2259. [Google Scholar] [CrossRef]
  15. Sasaki, Y. The Truth of the F-Measure. 2007. Available online: https://www.fao.org/land-water/databases-and-software/cropwat/en/ (accessed on 10 February 2022).
  16. Alotaibi, M.; Alhajeri, N.S.; Al-Fadhli, F.M.; Al Jabri, S.; Gabr, M. Impact of Climate Change on Crop Irrigation Requirements in Arid Regions. Water Resour. Manag. 2023, 37, 1965–1984. [Google Scholar] [CrossRef]
  17. Gabr, M.E. Land reclamation projects in the Egyptian Western Desert: Management of 1.5 million acres of groundwater irrigation. Water Int. 2023, 48, 240–258. [Google Scholar] [CrossRef]
  18. Hordofa, A.T.; Leta, O.T.; Alamirew, T.; Chukalla, A.D. Response of Winter Wheat Production to Climate Change in Ziway Lake Basin. Sustainability 2022, 14, 13666. [Google Scholar] [CrossRef]
  19. Makar, R.S.; Shahin, S.A.; El-Nazer, M.; Wheida, A.; El-Hady, M.A. Evaluating the Impacts of Climate Change on Irrigation Water Requirements. Sustainability 2022, 14, 14833. [Google Scholar] [CrossRef]
  20. Feng, X.; Wu, F.; Zai, S.; Wang, D.; Zhang, Y.; Chai, Q. Characteristics and Impacts of Water–Thermal Variation on Grain Yield in the Henan Province, China, on Multiple Time Scales. Agronomy 2023, 13, 429. [Google Scholar] [CrossRef]
  21. Esteves, R.; Calejo, M.J.; Rolim, J.; Teixeira, J.L.; Cameira, M.R. Framework for Assessing Collective Irrigation Systems Resilience to Climate Change—The Maiorga Case Study. Agronomy 2023, 13, 661. [Google Scholar] [CrossRef]
  22. Shen, X.; Liu, Y.; Zhang, J.; Wang, Y.; Ma, R.; Liu, B.; Lu, X.; Jiang, M. Asymmetric Impacts of Diurnal Warming on Vegetation Carbon Sequestration of Marshes in the Qinghai Tibet Plateau. Glob. Biogeochem. Cycles 2022, 36, e2022GB007396. [Google Scholar] [CrossRef]
  23. Yin, J.; Slater, L.; Gu, L.; Liao, Z.; Guo, S.; Gentine, P. Global Increases in Lethal Compound Heat Stress: Hydrological Drought Hazards Under Climate Change. Geophys. Res. Lett. 2022, 49, e2022GL100880. [Google Scholar] [CrossRef]
  24. Gabr, M.E. Modelling net irrigation water requirements using FAO-CROPWAT 8.0 and CLIMWAT 2.0: A case study of Tina Plain and East South ElKantara regions, North Sinai, Egypt. Arch. Agron. Soil Sci. 2021, 68, 1322–1337. [Google Scholar] [CrossRef]
  25. MOEP (The Ministry of Economy and Planning). The Ninth Development Plan (2010–2014); Legal Deposit No. 16/0694; MOEP (The Ministry of Economy and Planning): Riyadh, Saudi Arabia, 2010; ISSN 1319-4836.
  26. Al-Mutaz, I.S. Water resources development in Riyadh, Saudi Arabia. Desalination 1987, 64, 193–202. [Google Scholar] [CrossRef]
  27. Rong, X.Y.; Li, J.; Chen, H.M.; Xin, Y.F.; Su, J.Z.; Hua, L.J.; Zhang, Z.Q. Introduction of CAMS-CSM model and its participation in CMIP6. Clim. Chang. Res. 2019, 15, 540–544. (In Chinese) [Google Scholar] [CrossRef]
  28. Bi, D.; Dix, M.; Marsland, S.; O’Farrell, S.; Rashid, H.; Uotila, P.; Hirst, A.; Kowalczyk, E.; Golebiewski, M.; Sullivan, A.; et al. The ACCESS coupled model: Description, control climate and evaluation. J. South. Hemisph. Earth Syst. Sci. 2013, 63, 41–64. [Google Scholar] [CrossRef]
  29. Wu, T.; Lu, Y.; Fang, Y.; Xin, X.; Li, L.; Li, W.; Jie, W.; Zhang, J.; Liu, Y.; Zhang, L.; et al. The Beijing Climate Center Climate System Model (BCC-CSM): The main progress from CMIP5 to CMIP6. Geosci. Model Dev. 2019, 12, 1573–1600. [Google Scholar] [CrossRef] [Green Version]
  30. Voldoire, A.; Saint-Martin, D.; Sénési, S.; Decharme, B.; Alias, A.; Chevallier, M.; Colin, J.; Guérémy, J.; Michou, M.; Moine, M.; et al. Evaluation of CMIP6 DECK Experiments With CNRM-CM6-1. J. Adv. Model. Earth Syst. 2019, 11, 2177–2213. [Google Scholar] [CrossRef] [Green Version]
  31. Yukimoto, S.; Kawai, H.; Koshiro, T.; Oshima, N.; Yoshida, K.; Urakawa, S.; Tsujino, H.; Deushi, M.; Tanaka, T.; Hosaka, M.; et al. The Meteorological Research Institute Earth System Model Version 2.0, MRI-ESM2.0: Description and Basic Evaluation of the Physical Component. J. Meteorol. Soc. Jpn. Ser. II 2019, 97, 931–965. [Google Scholar] [CrossRef] [Green Version]
  32. Smith, M. CROPWAT: A Computer Program for Irrigation Planning and Management; FAO Irrigation and Drainage Paper No. 46; FAO: Rome, Italy, 1992; p. 126. [Google Scholar]
  33. Incoom, A.B.M.; Adjei, K.A.; Odai, S.N.; Akpoti, K.; Siabi, E.K. Impacts of climate change on crop and irrigation water requirement in the Savannah regions of Ghana. J. Water Clim. Chang. 2022, 13, 3338–3356. [Google Scholar] [CrossRef]
  34. Al-Omran, A.; Eid, S.; Alshammari, F. Crop water requirements of date palm based on actual applied water and Penman–Monteith calculations in Saudi Arabia. Appl. Water Sci. 2019, 9, 69. [Google Scholar] [CrossRef] [Green Version]
  35. El-Rawy, M.; Batelaan, O.; Al-Arifi, N.; Alotaibi, A.; Abdalla, F.; Gabr, M.E. Climate Change Impacts on Water Resources in Arid and Semi-Arid Regions: A Case Study in Saudi Arabia. Water 2023, 15, 606. [Google Scholar] [CrossRef]
  36. Brouwer, C.; Prins, K.; Heibloem, M. Irrigation Water Management: Irrigation Scheduling. Training Manual No. 4, 1989. Available online: https://www.fao.org/3/t7202e/t7202e00.htm (accessed on 12 November 2022).
  37. Almazroui, M.; Islam, M.N.; Saeed, S.; Saeed, F.; Ismail, M. Future Changes in Climate over the Arabian Peninsula based on CMIP6 Multimodel Simulations. Earth Syst. Environ. 2020, 4, 611–630. [Google Scholar] [CrossRef]
  38. Kaushika, G.; Arora, H.; Ks, H.P. Analysis of climate change effects on crop water availability for paddy, wheat and berseem. Agric. Water Manag. 2019, 225, 105734. [Google Scholar] [CrossRef]
  39. You, L.; Rosegrant, M.W.; Wood, S.; Sun, D. Impact of growing season temperature on wheat productivity in China. Agric. For. Meteorol. 2009, 149, 1009–1014. [Google Scholar] [CrossRef]
  40. Gabr, M.E.-S. Management of irrigation requirements using FAO-CROPWAT 8.0 model: A case study of Egypt. Model. Earth Syst. Environ. 2021, 8, 3127–3142. [Google Scholar] [CrossRef]
  41. Ludwig, F.; Asseng, S. Climate change impacts on wheat production in a Mediterranean environment in Western Australia. Agric. Syst. 2006, 90, 159–179. [Google Scholar] [CrossRef]
  42. Elnashar, W.; Elyamany, A. Managing Risks of Climate Change on Irrigation Water in Arid Regions. Water Resour. Manag. 2022, 37, 2429–2446. [Google Scholar] [CrossRef]
  43. Awad, A.; Luo, W.; Al-Ansari, N.; Elbeltagi, A.; El-Rawy, M.; Farres, H.N.; Gabr, M.E.-S. Farmers’ Awareness in the Context of Climate Change: An Underutilized Way for Ensuring Sustainable Farmland Adaptation and Surface Water Quality. Sustainability 2021, 13, 11802. [Google Scholar] [CrossRef]
  44. Al-Maktoumi, A.; Zekri, S.; El-Rawy, M.; Abdalla, O.; Al-Wardy, M.; Al-Rawas, G.; Charabi, Y. Assessment of the impact of climate change on coastal aquifers in Oman. Arab. J. Geosci. 2018, 11, 501. [Google Scholar] [CrossRef]
  45. Gabr, M.E.; El Shorbagy, A.M.; Faheem, H.B. Utilizing the Harvesting of Rainwater to Provide Safe Road Transportation Efficiency and Increase Water Resources in the Context of Climatic Change. Sustainability 2022, 14, 9656. [Google Scholar] [CrossRef]
  46. El-Rawy, M.; Elsadek, W.M.; De Smedt, F. Flood hazard assessment and mitigation using a multi-criteria approach in the Sinai Peninsula, Egypt. Nat. Hazards 2023, 115, 215–236. [Google Scholar] [CrossRef]
  47. Gabr, M.E.; El-Ghandour, H.A.; Elabd, S.M. Prospective of the utilization of rainfall in coastal regions in the context of climatic changes: Case study of Egypt. Appl. Water Sci. 2023, 13, 19. [Google Scholar] [CrossRef]
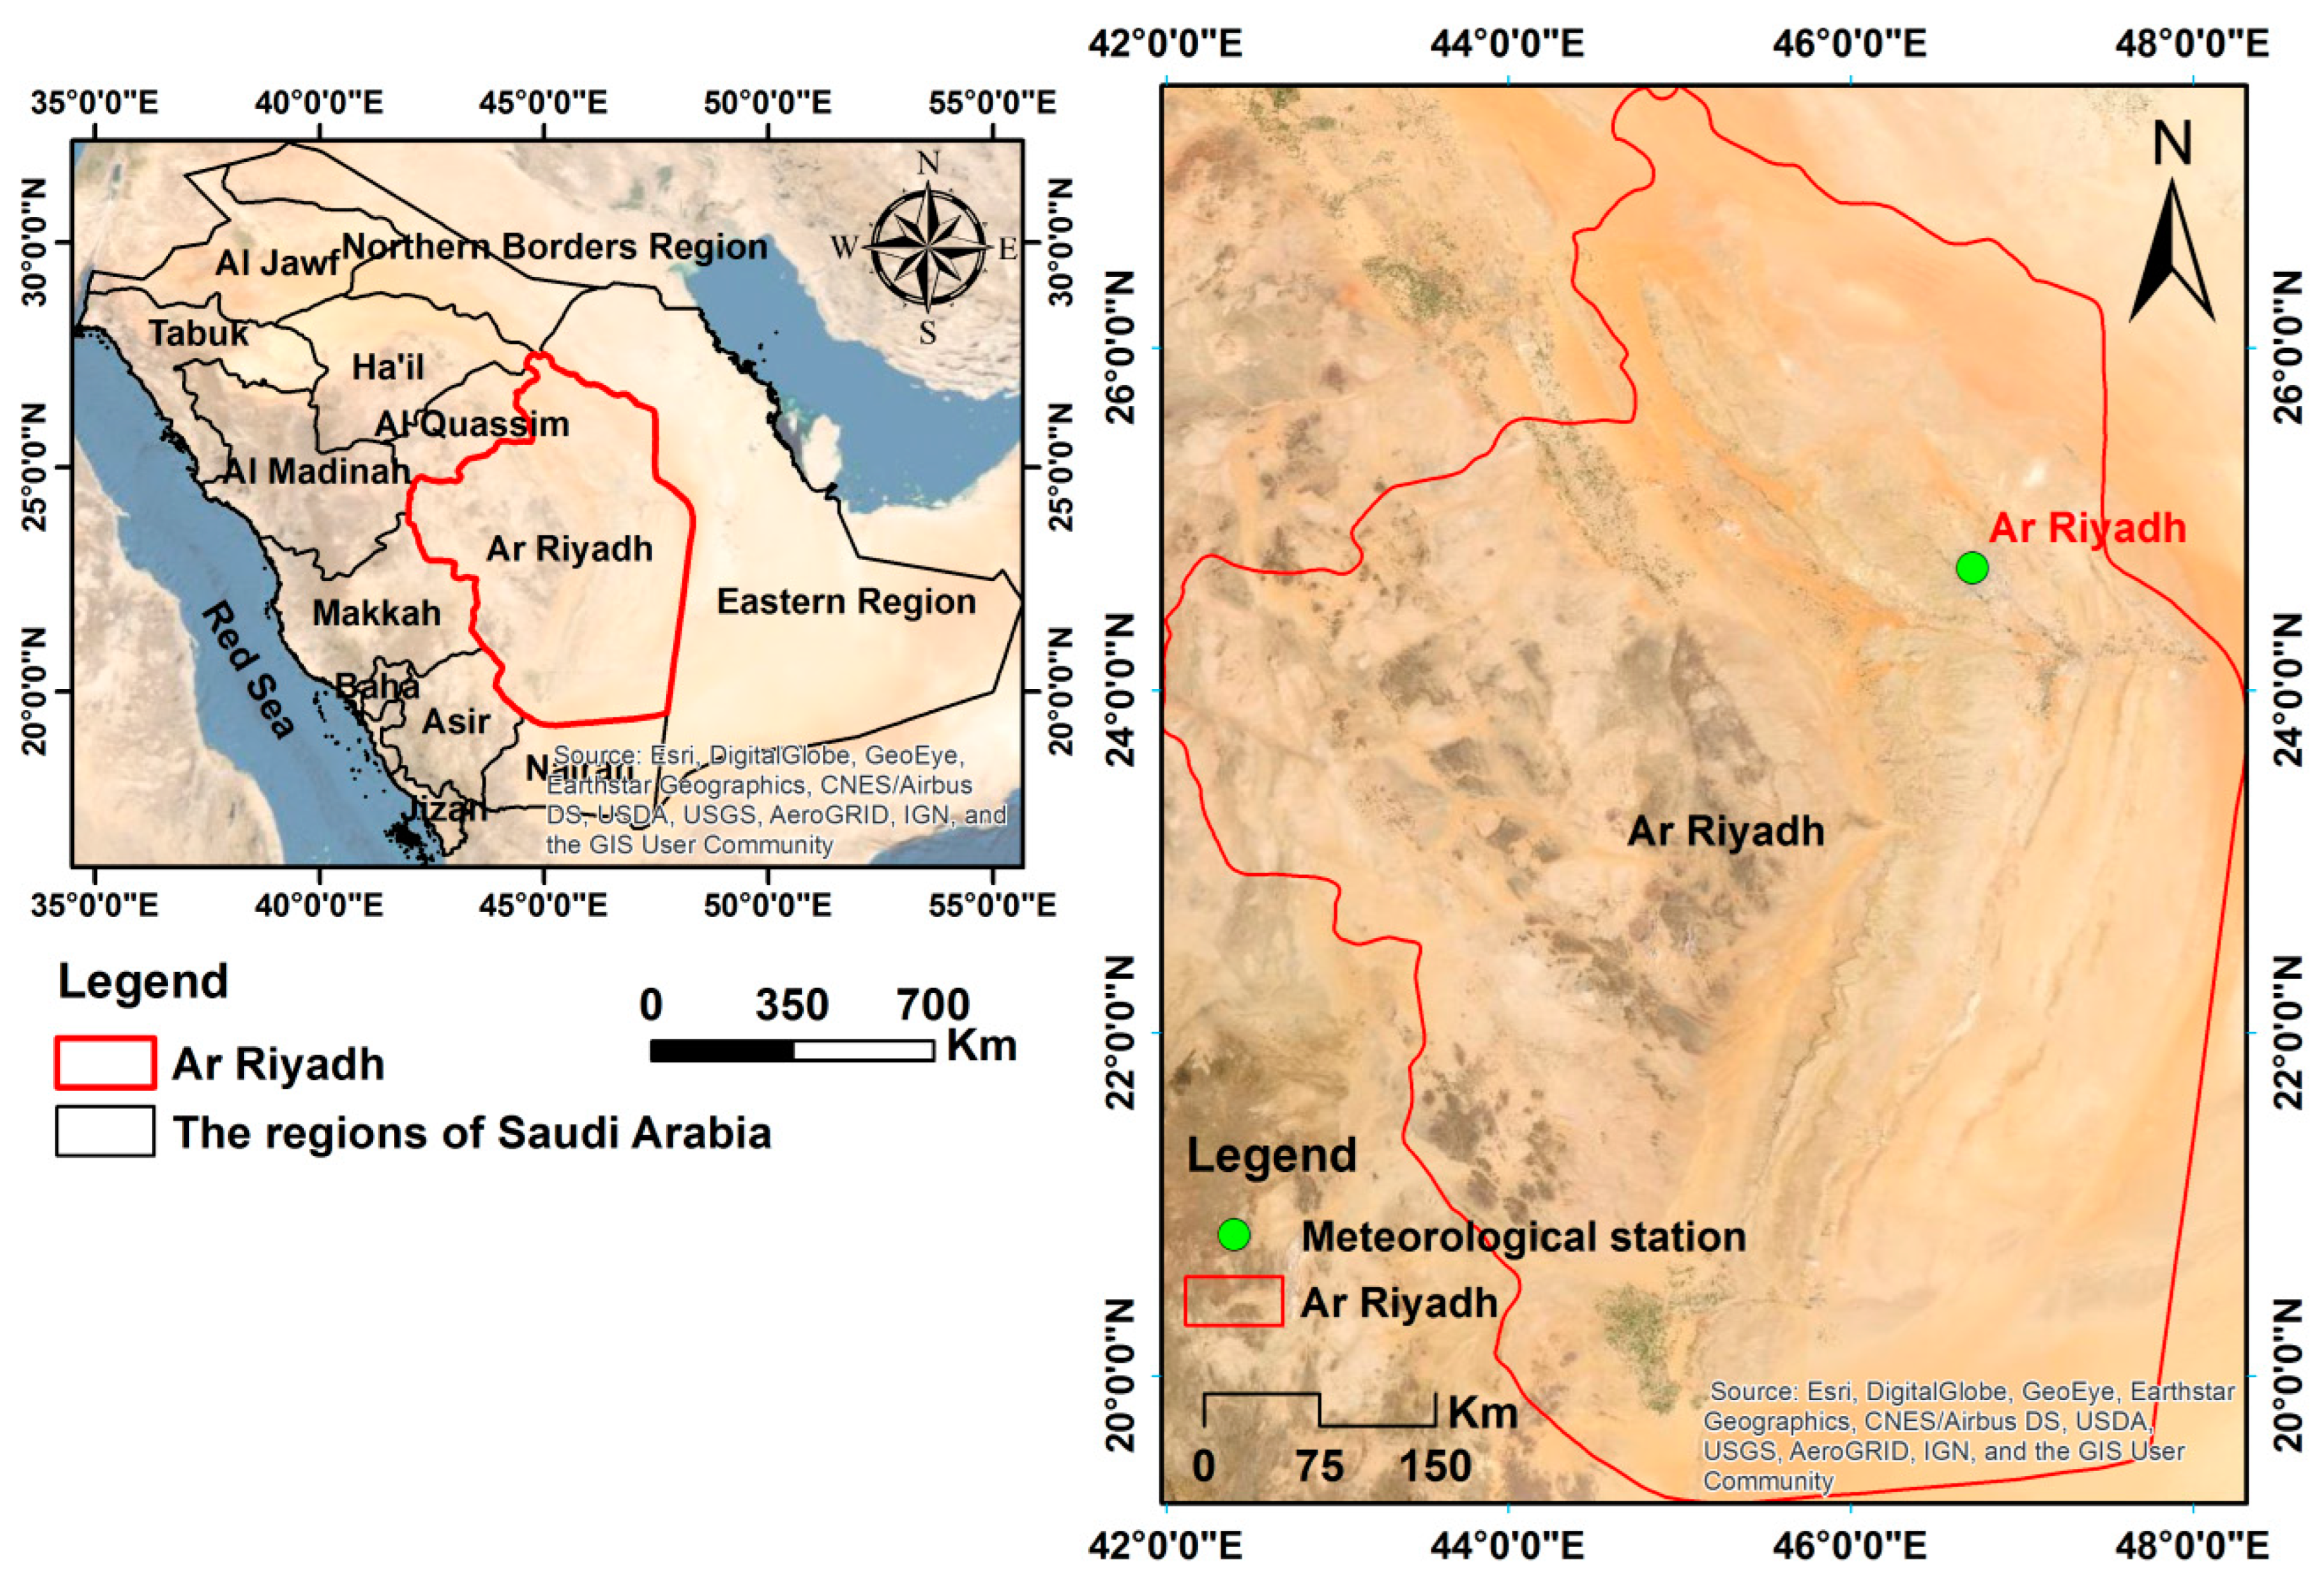
Figure 1. The study area map (Ar Riyadh, Saudi Arabia).
Sustainability 15 09513 g001
Figure 2. Average weather data (Tmin, Tmax, RH (relative humidity), wind speed, sunshine solar radiation, and ETo) for Ar Riyadh station for the period 1991–2020.
Sustainability 15 09513 g002
Figure 3. Box plot of yearly Tmax under (a) SSP2-4.5 and (b) SSP5-8.5 for the five climate models.
Sustainability 15 09513 g003
Figure 4. Variability (ΔT) in Tmax under (a) SSP2-4.5 and (b) SSP5-8.5 for the five climate models.
Sustainability 15 09513 g004
Figure 5. Box plot yearly Tmin for the five climate models under (a) SSP2-4.5 and (b) SSP5-8.5.
Sustainability 15 09513 g005
Figure 6. Variability (ΔT) in Tmin under (a) SSP2-4.5 and (b) SSP5-8.5 for the five climate models.
Sustainability 15 09513 g006
Figure 7. Box plot of yearly rainfall for the five climate models under (a) SSP2-4.5 and (b) SSP5-8.5.
Sustainability 15 09513 g007
Figure 8. Variability (ΔT) in Tmax under (a) SSP2-4.5 and (b) SSP5-8.5 for the five climate models.
Sustainability 15 09513 g008
Figure 9. Eto values based on the five climate models under (a) SSP2-4.5 and (b) SSP5-8.5 for 2020, 2040, 2060, 2080, and 2100.
Sustainability 15 09513 g009aSustainability 15 09513 g009b
Figure 10. ETc (a) SSP2-4.5 and (b) SSP5-8.5, and GIWR (c) SSP2-4.5 and (d) SSP5-8.5 variability in the Ar Riyadh region for the years 2020, 2040, 2060, 2080, and 2100.
Sustainability 15 09513 g010aSustainability 15 09513 g010b
Figure 11. Average future decrease in crop areas (%) in the Ar Riyad region under SSP2-4.5 and SSP5-8.5 in 2040, 2060, 2080, and 2100.
Sustainability 15 09513 g011
Table 1. Crop data in Ar Riyadh, KSA.
ParameterWheatCloverOther VegetablesDatesMaizeCitrusTomatoPotato
Planting date15 January1 December1 March1 April1 April1 March1 April15 January
Harvest date24 May30 November3 June3 August3 August28 February23 August24 May
Cultivated Area (ha)30,89650,09040,87943,1782212358243833446
Table 2. Statistical analysis of Tmin and Tmax (°C) and rainfall (mm) for the five models (2020, 2040, 2060, 2080, and 2100) under SSP2-4.5 and SSP5-8.5 for Ar Riyadh station.
Tmax (°C)
SSP2-4.5SSP5-8.5
AverageMax.Min.ΔTChange (%)AverageMax.Min.ΔTChange (%)
202032.7742.2022.1--32.7742.2022.1--
204032.4243.8820.03−0.34−1.0532.5844.0819.39−0.19−0.58
206033.2044.8620.070.431.3134.1846.0020.551.424.32
208034.1045.8520.681.334.0635.2747.2621.482.507.63
210034.2345.9321.121.464.4636.7348.8922.863.9712.11
Tmin (°C)
202019.727.610.5--19.727.610.5--
204018.9128.467.69−0.79−2.4318.9128.647.32−0.79−2.42
206019.5729.407.96−0.13−0.4020.2329.998.380.531.63
208020.1929.988.370.491.4921.7431.879.822.046.23
210020.7230.419.341.023.1022.8732.9610.923.179.66
Rainfall (mm)
20206.8222.000.40--6.8222.000.40--
20408.1514.622.071.344.087.8513.981.411.043.16
20607.6315.961.730.812.487.5119.871.100.692.11
20807.1614.251.690.351.067.6115.021.610.802.43
21008.2516.651.841.434.369.2015.811.732.387.27
Table 3. Statistical analysis of daily ETo for the five future models under SSP2-4.5 and SSP5-8.5 for 2040, 2060, 2080, and 2100, as well as the current case (2020), for Ar Riyadh.
SSP2-4.5SSP5-8.5
AverageMax.Min.ΔTChange (%)AverageMax.Min.ΔTChange (%)
20203.665.281.85 3.665.281.85
20403.645.421.76−0.02−0.663.645.431.77−0.02−0.48
20603.685.481.790.020.483.725.521.820.061.52
20803.735.541.830.061.753.805.631.890.143.85
21003.745.551.840.082.183.895.741.960.236.35
Table 4. NIWR and GIWR (MCM) for the five models (2040, 2060, 2080, and 2100) under SSP2-4.5 and SSP5-8.5 and the current case for the Ar Riyadh region.
SSP2-4.5SSP5-8.5
NIWR (MCM)GIWR (MCM)ΔGIWRChange (%)NIWR (MCM)GIWR (MCM)ΔGIWRChange (%)
20201315.81634.9 -1315.81634.9--
20401334.21659.724.71.51324.11645.911.00.7
20601335.81660.525.61.61345.31672.337.42.3
20801354.01683.048.02.91375.61709.975.04.6
21001355.71685.250.33.11403.71744.8109.96.7
Disclaimer/Publisher’s Note: The statements, opinions and data contained in all publications are solely those of the individual author(s) and contributor(s) and not of MDPI and/or the editor(s). MDPI and/or the editor(s) disclaim responsibility for any injury to people or property resulting from any ideas, methods, instructions or products referred to in the content.