1. Introduction
Global warming occurs when pollutants of air such as carbon dioxide (CO
2) emissions collect in the atmosphere, which significantly threaten society and the world economy [
1]. The transition to a green economy has become a leading strategy for developing countries to maintain energy security and support ecological sustainability. Therefore, investigating the inherent causes of carbon emissions is vital for global warming mitigation, which has attracted worldwide attention. In this line, the Paris international agreement (2015), which 196 parties in the world adopted, aims to cut global CO
2 emissions by around 45% by 2030. According to the Paris Agreement, renewable energy utilization is one of the leading significant solutions to achieve sustainable development [
2]. Several benefits of renewable energy utilization are as follows: (i) Generating energy that produces no carbon emissions from fossil fuels and mitigates ecological pollution, which affects health. (ii) Enhances energy security for the country, i.e., it will minimize the imported fossil fuel sources into the economy such as oil; this will reinforce the energy security of the economy against fluctuations in oil prices. (iii) Creating green economic and financial development in manufacturing, production, installation [
3].
In the empirical literature, several empirical studies have been conducted to examine the effect of economic growth on REC (e.g., [
3,
4,
5,
6,
7,
8,
9,
10,
11]). Nonetheless, their outcomes are mixed due to time frame, country(s), and employed techniques. On the other hand, few empirical research studies examined the interconnection between fiscal policy and renewable energy (e.g., [
2,
12,
13]). The fiscal policy channel, such as taxation revenue, plays a relevant role in promoting economic development by enhancing price stability. According to several scholars, taxation channels have significant effects on economic development (see, e.g., [
14,
15,
16,
17,
18,
19]).
The present study aims to assess the main determinants of renewable energy in South Africa. Hence, the study aims to answer three main questions: Could economic growth be an essential determinant of the REC? Does foreign direct investment (FDI) increase the REC in South African countries? Could fiscal policy be an essential determinant of the REC? To achieve the main objective of this study, we postulate three main hypotheses: (i) There is a positive and significant association between economic growth and REC; (ii) There is a positive and significant association between economic growth and REC; (iii) There is a positive and significant association between economic growth and REC.
From the gaps observed in the existing papers, the present paper fills a cavity in current empirical studies in different ways. To the best of our knowledge, there is no study assessed the link between fiscal policy and REC in the case of South Africa. In this regard, the main novelty of this work is to explore the influence of taxation policy on renewable energy in South Africa. Furthermore, the present work aims to evaluate the impacts of oil prices on renewable consumption in both “short and long” periods. Third, several techniques and methods, such as the ARDL method, have been applied to assess the interconnection between ecological neutrality and energy and economic growth. The novel approach of augmented ARDL (AARDL), as proposed by Sam et al. (2019) [
20], is not commonly applied in the current energy and environment literature. Therefore, the study aims to introduce fresh empirical evidence by using the AARDL method, which is preferred over traditional methods due to its advantage to capture the cointegration level when resolving some technical features, such as the limitation of the size and power. In addition, the AARDL assessed inconclusive cases, which eventually led to overcoming the instability problem of conventional assessments, and it introduced better outcomes than the classical assessments of cointegration. Finally, this study aims to provide some crucial suggestions to policymakers to sustain the country’s energy sector through fiscal policies such as taxation, which in turn leads to accelerating the transition to sustainable development in oil-importing economies such as South Africa. Therefore, it is highly important to study the linkage between oil price and renewable energy.
The oil price ultimately affects the economic development of both oil-importing and exporting economies [
21,
22,
23,
24,
25,
26,
27,
28]. Households use energy daily for cooking, transportation, and heating purposes. In addition, firms heavily depend on fossil fuel in production, communications services, banking, economics, transportation, and other services. Therefore, any change in oil price has a significant effect on the economy. In this context, the researchers suggest that an increase in oil prices will mitigate fossil fuel utilization and encourage markets and individuals to switch to green energy sources such as solar energy. However, the prevailing study aims to assess the link between oil prices and renewable energy consumption in South Africa. To the best of knowledge of this paper’s authors, no empirical paper has focused on South Africa’s economy to test the impacts of oil prices on the country’s renewable energy using the novel AARDL approach.
There are several reasons to evaluate the renewable energy determinants in South Africa. Firstly, Africa is one of the most geographically varied countries, with a coastline that stretches more than 2500 km (1600 miles). The country is endowed with abundant renewable energy sources. For example, there is a total area of approximately “194,000
” of high solar radiation potential combining Northern Cape which is considered to be one of the best areas to generate solar energy resource in the world [
29]. Second, South Africa has a highly advanced infrastructure and economy. The country is one of the world’s leading exporters of platinum, gold, copper, and other natural resources. The country is distinguished from other developing economies by its economic potential and population structure. However, the financial system in the country is well-developed, with excellent banking regulation, and the financial sector in South Africa is ranked in the top ten financial sectors in the world
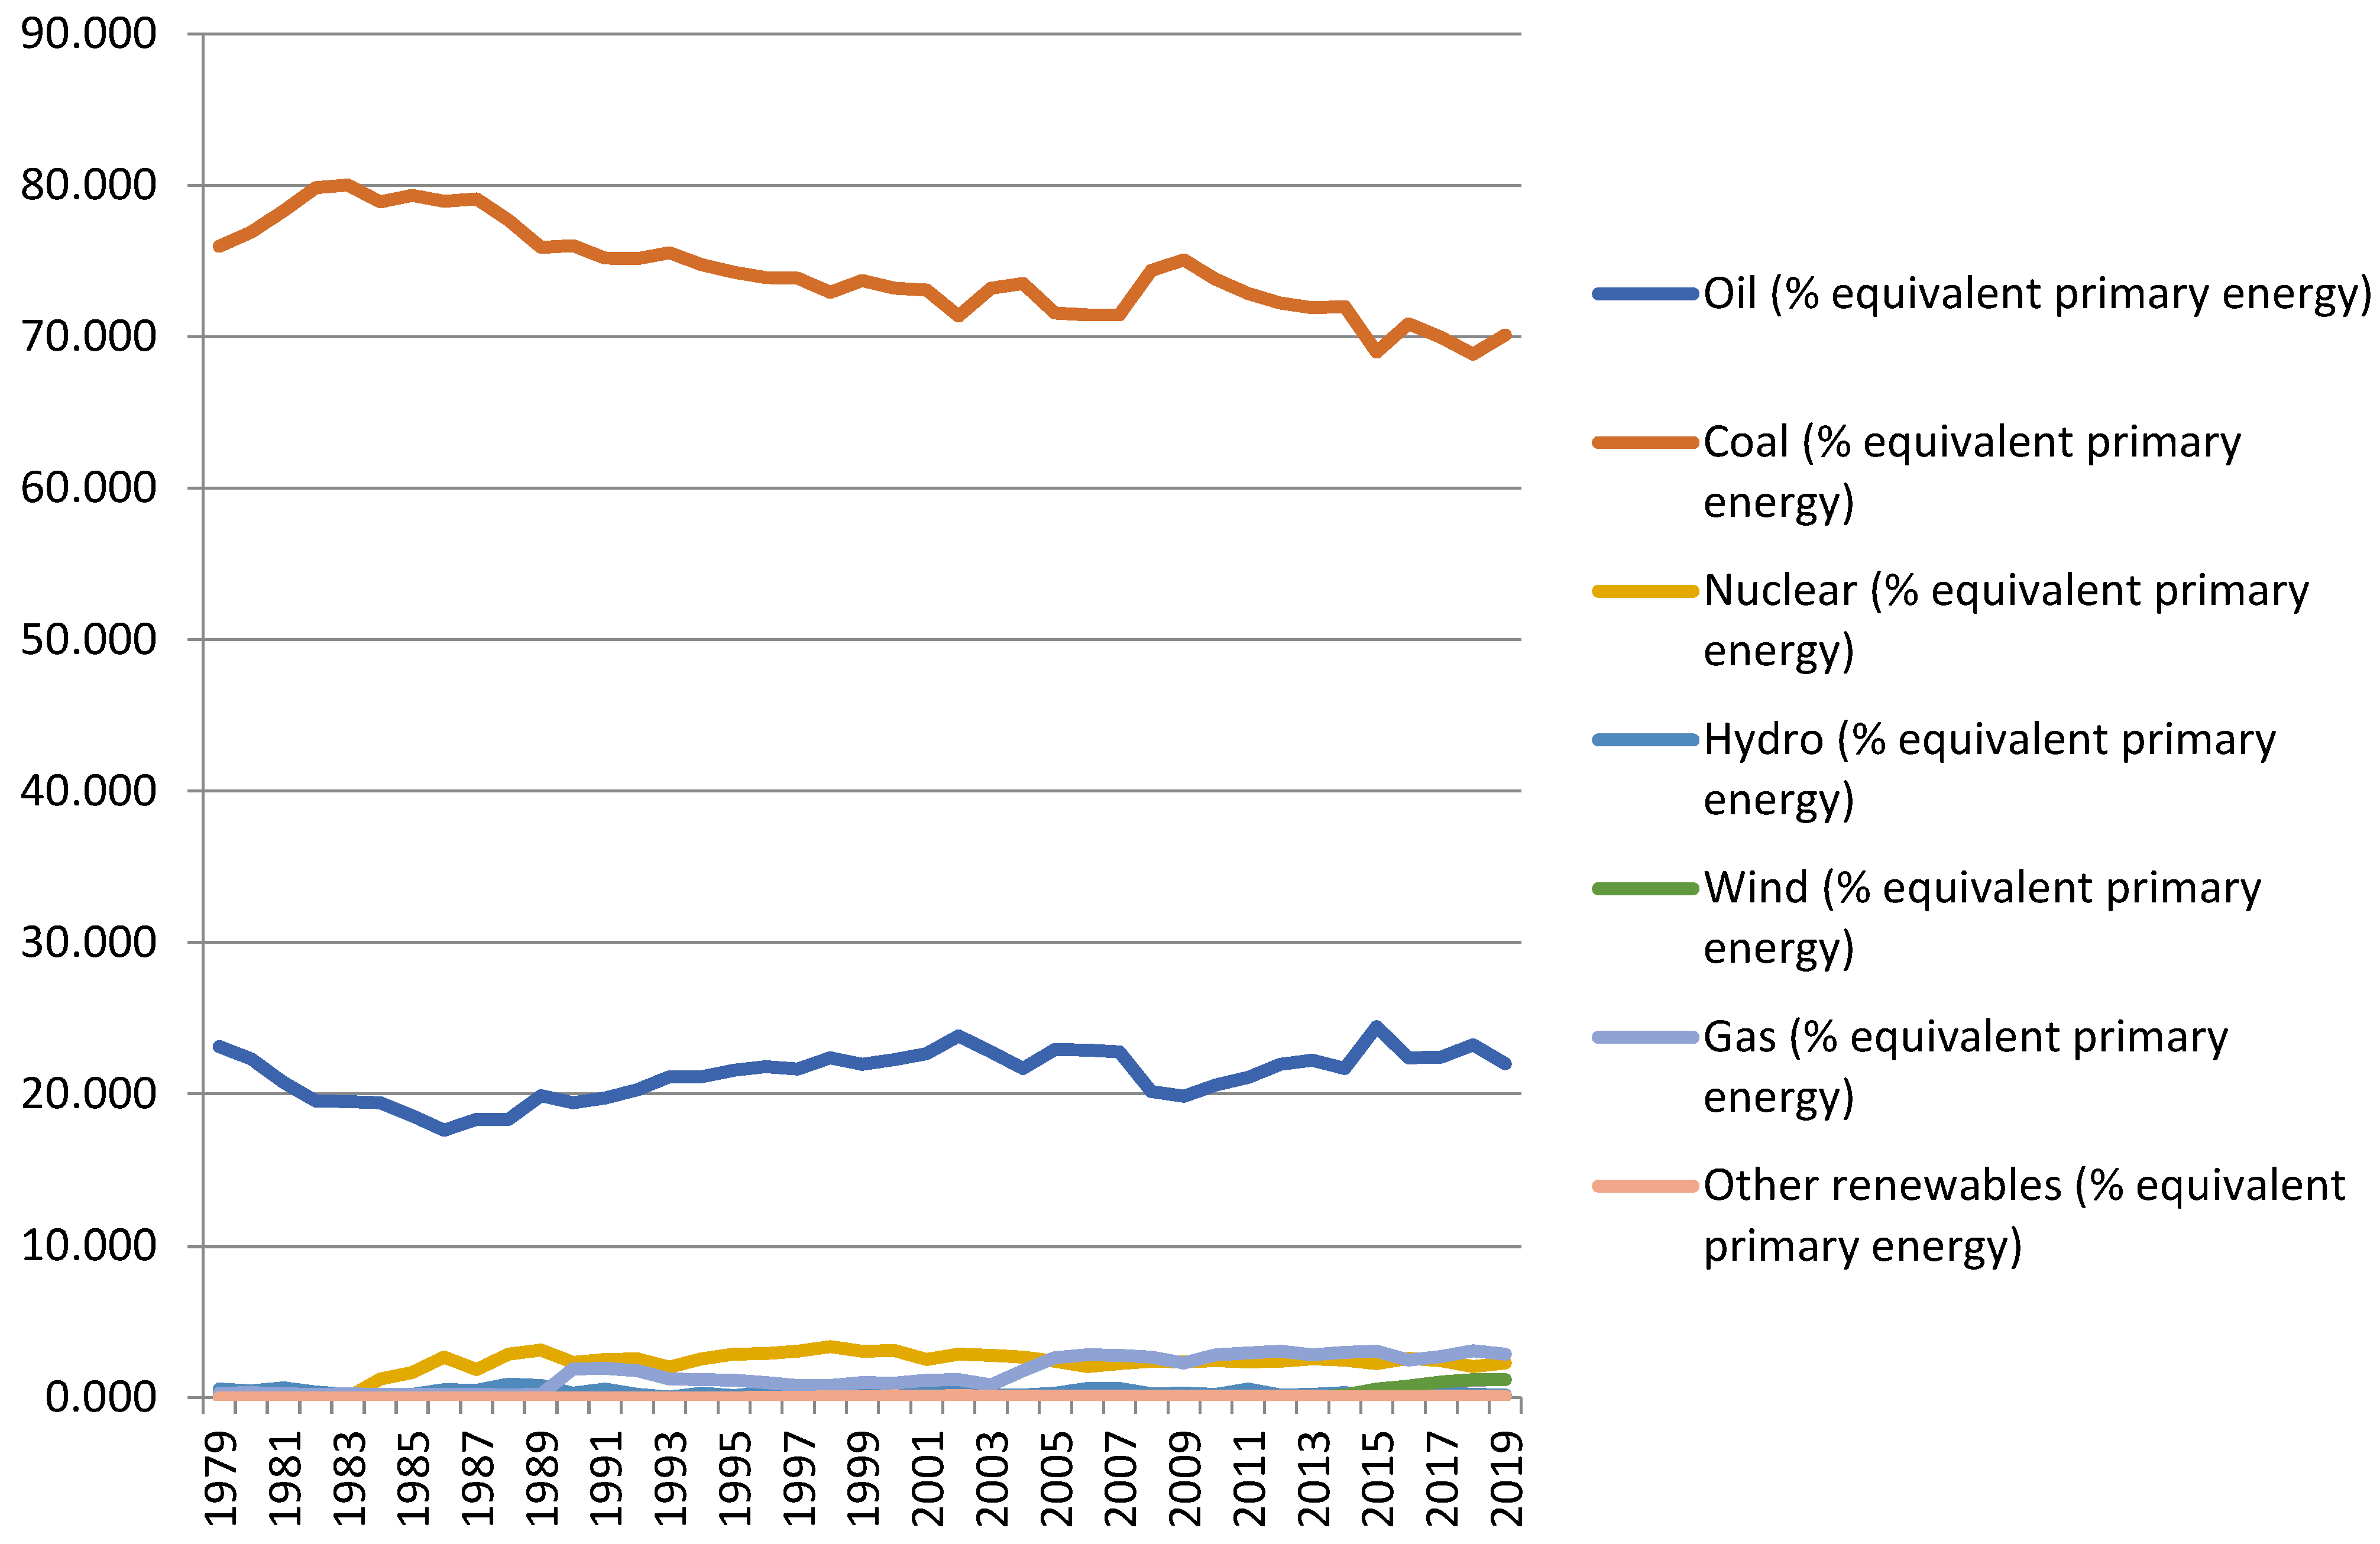
. Third, despite being endowed with abundant renewable energy sources, South Africa is facing significant challenges in the energy mix. In this context, the proportion of coal consumption to the total energy presents more than 70%. The proportion of coal utilization to the total energy presents more than 20%. Meanwhile, the proportion of renewables to the total energy in the county is less than 10% (See
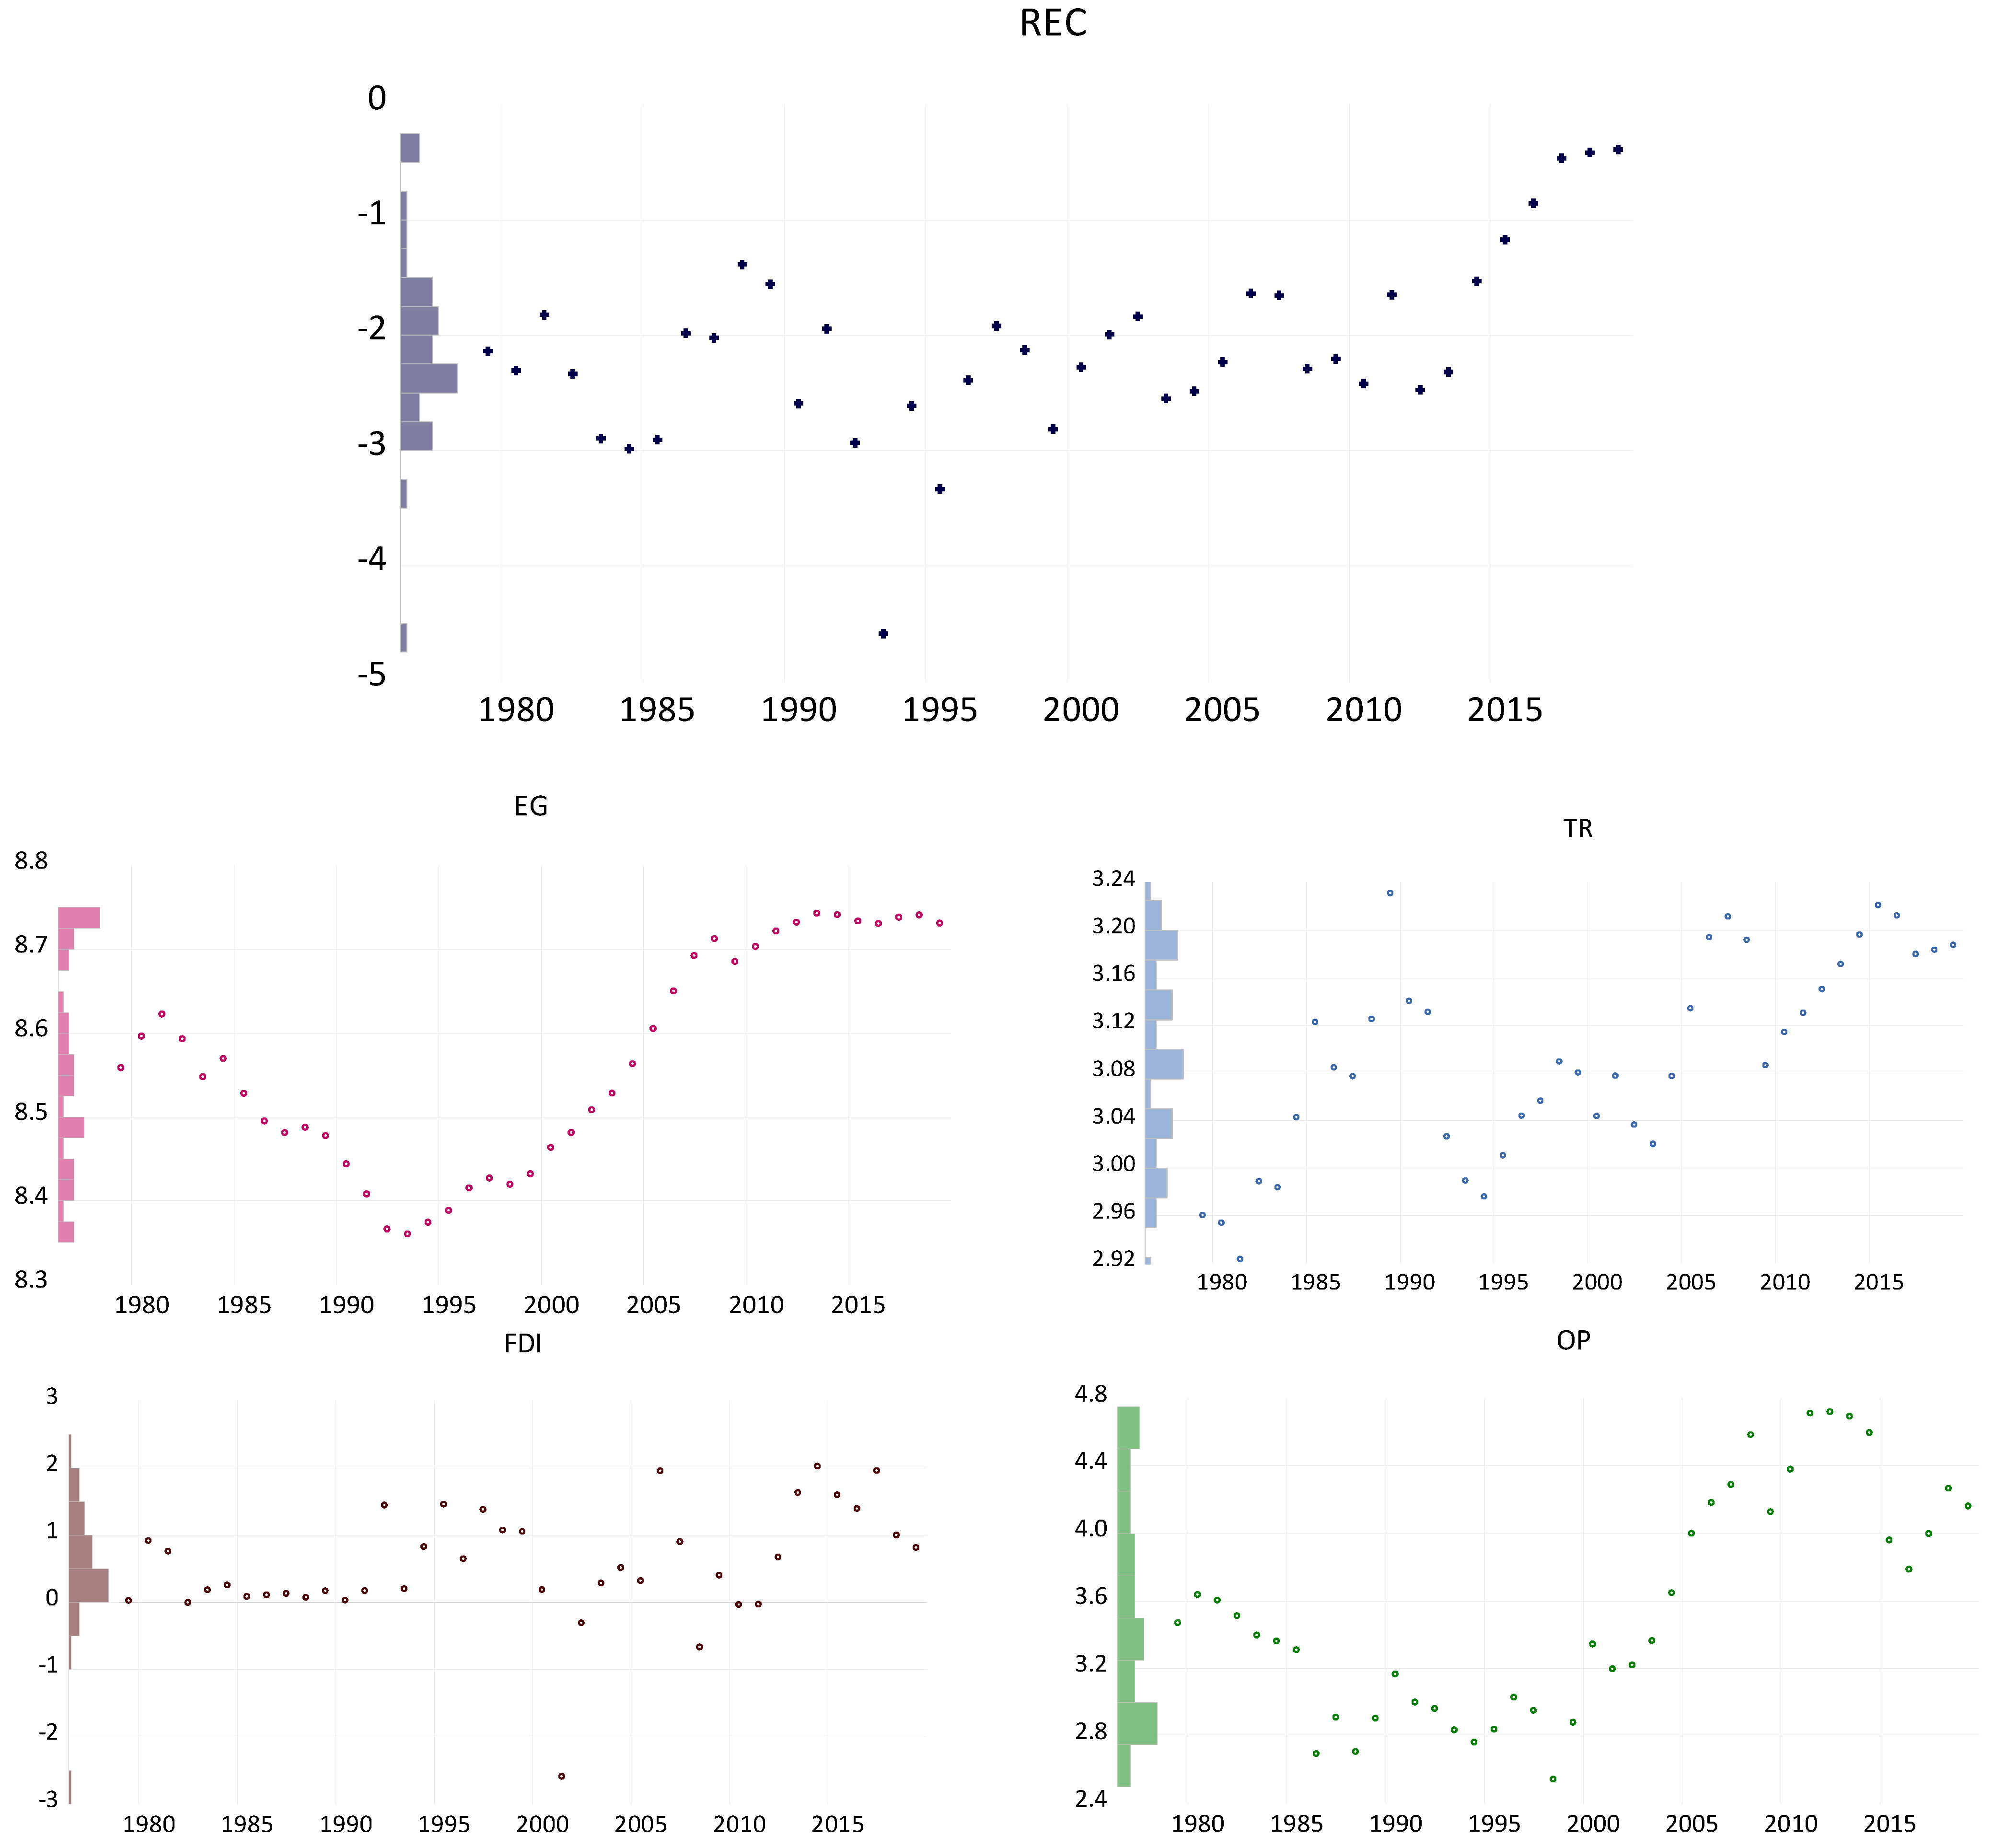
Figure 1). Despite this, renewable energy per capita has increased over the last years from 0.11 in 1979 to 0.67 in 2019 (See
Figure 2).
The remaining sections are designed as follows. The related empirical studies are presented in
Section 2.
Section 3 explains the dataset and the econometric strategy.
Section 4 and
Section 5 show the empirical outcomes of this study and discussion. Finally,
Section 6 offers the conclusions and policy implications of this study.
2. Literature Review
In the existing empirical studies, economists are highly focused on the interconnection between forging direct investment (FDI), economic growth (GDP), and renewable energy consumption (REC). Meanwhile, some economists focused on the link between fiscal policy, oil price, and REC. The relevant empirical studies in this section are classified into the following four categories. In the first category, we focused on the link between economic growth and REC. The connection of economic growth and energy has been well explored in the energy literature. As a phenomenon investigated over time, the outcomes of these studies demonstrated different findings based on four hypotheses: The first is the conservation hypothesis which indicates a unidirectional causal linkage that runs from economic growth to energy use. The second is the growth hypothesis, which indicates a causal link from energy use to economic growth [
5]. The third feedback hypothesis implies a bidirectional causal interconnection between energy use and economic growth. The fourth is called the neutrality hypothesis, which argues that the causality between energy use and economic growth is valid. For instance, Ref. [
5] suggested a positive interconnection between real output and REC for some selected emerging economies. These outcomes are confirmed by [
4] who assessed the link between REC and economic growth in the case of “Organisation for Economic Co-operation and Development” (
). Using the panel model, the authors suggested a positive link between the mentioned variables. Likewise, the authors suggested a bidirectional causality linkage between REC and economic growth from 1985 to 2005. Similar results were found by [
3] who employed Dynamic OLS (DOLS) and suggested significant and positive effects of economic expansion on REC for the case of India from 1971 to 2015. Meanwhile some studies confirmed the absence of a significant relationship between economic growth and REC. For example, Ref. [
30] employed a causality test and suggested that there is a unidirectional causal linkage from economic expansion to REC in Turkey from 1990 to 2010.
In the second category, we focused on the link between FDI and REC. In this context, Ref. [
31] employed the panel model and suggested that the real economic output and FDI positively influenced REC in various provinces in China from 1996 to 2013. Ref. [
32] assessed the same relation by using Fourier ARDL cointegration from 1985 to 2017. The findings illustrate that trade positively correlated to clean energy use in Russia, whereas its effect was insignificant in the case of South Africa. The positive influence is also supported by [
33], who used the Blundell–Bond dynamic panel and explored the influence of FDI on energy use in 74 economies from 1985 to 2012; the study found a positive influence effect of FDI on energy consumption. Ref. [
34] also evaluated the connection between REC and FDI in 31 Chinese provinces from 2000 to 2015. The authors suggested that FDI cannot significantly cause REC in a short period, while in the long FDI has a significant impact on enhancing REC in China. Similar results were found by [
35] who used the fully modified ordinary least squares (FMOLS) approach to evaluate the effect of FDI on REC in Asian nations covering the period 1990–2019. The research highlights the positive significant connection between the mentioned variables. This research suggests that policymakers in the tested economies should view FDI as a fundamental policy instrument for ecological sustainability. Ref. [
36] suggests that FDI can have various impacts on sustainable development depending on the nature of the investment. Essentially, large industrialized economies tend to send industrial factories that use fossil fuels to less developed economies. Hence, FDI may negatively affect sustainable development mostly in less developed economies than in developed economies.
In the third category, we focused on the link between oil prices and REC. Some scholars suggest a negative connection between oil prices and REC; scholars such as [
35] argue that oil prices mitigated REC in six developed and developing countries from 1980 to 2011. Such a linkage exists because an upsurge in the prices of oil will make renewable energy sources a cheaper alternative. Similar findings were found by [
37] who utilized the generalized method of moments (GMM) technique and suggested an adverse relationship between the two variables in the case of China from 2002 to 2016. Ref. [
38] used the data spanning from 1992 to 2015 and suggested that oil prices have significant barriers to the transition from conventional energy sources such as fossil fuel to green energy such as REC in the case of Azerbaijan. Meanwhile, some other scholars argue a positive interconnection between the two variables (O.P. and REC). For example, Ref. [
39] examined the effects of oil prices on REC in the case of the USA. Using NARDL, the findings demonstrate that an augment in oil prices promotes REC, while any decline in oil prices mitigates the REC from 1970 to 2018. On the other hand, some studies suggested the absence of a significant relationship between the two variables. For example, Ref. [
40] suggests that oil prices do not appear to be a significant driver of sustainable renewable energy in the USA.
In the last category in this section, we focused on the link between taxation revenues and REC. According to several scholars, taxation channels have significant effects on economic development (see, e.g., [
15,
16,
17,
41]). In this context, a significant improvement in economic performance may lead to an effect on energy utilization, which eventually leads to an effect on ecological sustainability. Ref. [
12] showed that ecological tax has a significant role in promoting sustainable development. Ref. [
42] suggested that the taxation channel has a positive role in reinforcing sustainable development in the case of European countries. Similar results are found by [
43] in the case of Sweden. Ref. [
13] also suggested that taxation has a powerful influence in supporting sustainable development in the case of five selected island economies. Recently, Ref. [
44] employed the ARDL model and suggested that the taxation channel has a positive role in promoting the renewable energy market in the case of Turkey. Ref. [
45] assessed the impact of fiscal policy channels such as taxation on energy efficiency. The author suggested that taxation has a positive effect on green energy utilization in the case of different selected economies. Ref. [
2] employed a bootstrap ARDL approach and suggested that fiscal policy channels have a significant impacts on energy use. The authors suggested that these channels play a positive role in achieving numerous sustainable development goals (SDG) in the case of the USA.
4. Empirical Findings
Table 2 presents correlation matrix findings, which show that the correlation coefficient “r2” is lower than the (CV) (i.e., r2
0.80), which means that the selected model is free from multicollinearity. Thus, the absence of multicollinearity in the tested model can be suggested.
The unit root assessments ADF and Perron and Vogelsang were employed to establish the order of integration between the focused variables and avoid any erroneous outcomes. The outcomes of the unit roots are presented in
Table 2. The findings show that all the focused variables are stationary after the first difference. Thus, we can proceed to the next step to check the co-integration between the focused variables (see
Table 3).
The novel approach of the augmented ARDL model and Bayar and Hancks approach are employed to check the cointegration. The findings of these approaches are presented in
Table 4 and
Table 5. According to AARD model results, the existence of cointegration is confirmed using three test statistics (F overall statistics, F independent, and t-dependent assessments). The findings illustrate that the F-statistic (6.228153) exceeds the critical value of 3.74. Additionally, F independent and t-dependent assessments are significant at 1%, inferring robust evidence of cointegration. In addition, the findings of Bayar and Hanck affirm that the cointegration between the focused variables is valid. According to the results of this test,
statistics were higher than the critical [
47] values of the B.H. (2013) method [
54]. Thus, the absence of the cointegration hypothesis is rejected. However, the findings of AARD and Bayer and Hanck approaches affirm the existence of cointegration between the focused variables. Thus, we can proceed to the next step to check the short and long connection between the focused variables using the ARDL model approach.
The outcomes of the ARDL approach is presented in
Table 6. The findings of this approach show a positive connection between economic growth and renewable energy. An augment in economic growth (GDP) in South Africa by 1% leads to an upsurge in REC by 9.22% and 6.82% in the long- and short-run terms.
A positive and insignificant connection is found between FDI and REC. These results suggest that FDI did not contribute to promoting REC in the country in a short and long period. Conversely, the findings show a positive and significant connection between oil prices and renewable energy. An increase in oil price by 1% leads to mitigating the level of REC by 1.58 and 1.17% in the long- and short-run terms. Likewise, the findings from ARDL affirm the short and long-term connection between taxation revenues and REC in South Africa. An increase in taxation revenues in the country by 1% leads to mitigating the level of REC by 4.3% and 3.2% in the long- and short-run terms.
The findings of FMOLS, CCR, and DOLS approaches are presented in
Table 7. At the 1% significance level, the obtained outcomes from these approaches show a positive and significant connection between economic growth and renewable energy. One percent upsurge in economic growth increases REC by 8.13–9.17%. Likewise, a positive and insignificant connection is found between FDI and REC in FMOLS, CCR, and DOLS approaches. These results confirm that FDI did not contribute to promoting REC over the tested period.
In addition, the outcomes of these approaches suggest a significant and negative connection between the prices of oil and renewable energy. An increase in oil price by 1% leads to a reduction in the level of REC by 1.2% to 1.5%. On the other hand, the outcomes of robust models affirm a positive connection between taxation revenues and REC in South Africa. An increase in taxation revenues in the country by 1% leads to an increase in REC by 3.4% to 3.8%. However, the findings of this study affirm the following hypotheses: (i) There is a positive and significant link between economic growth and REC; (ii) There is a positive and significant connection between economic growth and REC; (iii) There is a positive and significant connection between economic growth and REC. The finding of the ARCH test, the Breusch–Pagan–Godfrey test, and the normality assessment show that the explored model is correct and free from any serial correlations.
Figure 4 shows that the model is stable and correct.
Finally, the study employed Granger causality analysis to capture the causal interconnection between oil price, FDI, economic growth, taxation, and renewable energy. The outcomes of the causality analysis (
Table 8) show that there is a causal interconnection between GDP and REC and between taxation revenues and REC. However, these findings affirm the findings of FMOLS, DOLS, CCR, and ARDL approaches.
5. Discussion
This study aims to explore the link between oil prices, fiscal policy, FDI, economic growth, and REC. To this end, yearly data from 1979 to 2019 are utilized in a novel augmented ARDL approach constructed to capture the co-integration. In addition, ARDL, FMOLS, CCR, and DOLS approaches are constructed to capture the connection between the focused variables. Likewise, the Granger causality approach was constructed to capture the causal association amid O.P., T.R., FDI, GDP, and REC. The findings from ARDL, FMOLS, DOLS, and CCR show that the economic growth coefficients have positive and statistically significant coefficients with different significance levels in all estimations. These findings align with Eren et al. [
3] who suggested the significant and positive effects of economic growth in India on REC from 1971 to 2015.
Furthermore, oil prices from the examined models have adverse and significant coefficients with different significance levels in all estimations. These results corroborate similar findings found by Cao et al. [
37] who suggested a negative relationship between the two variables in the case of China from 2002 to 2016. Globally, crude oil is an important commodity; any oil price change significantly impacts economic development. An increase in oil price positively impacts revenue generation in oil-exporting countries. In contrast, a declining oil price may negatively affect revenue generation and trade in oil-importing countries. In this way, the present study’s findings could be attributed to the fact that South Africa is an oil-importing country. Hence, an augment in oil prices presents bad news for the country. In this way, increasing oil prices stimulates economic agents to mitigate their oil consumption. In that case, any augment in oil prices mitigates the utilization of fossil fuel resources and causes substitution with green energy sources, thus reinforcing sustainable development.
Likewise, FDI coefficients were not found to enhance renewable energy in both short and long periods. These findings support the outcomes of Abdo et al. [
36] who suggest that the impact of FDI on sustainable development depends on the nature of the investment. Basically, large industrialized economies tend to send industries and factories to less developed economies with less stringent ecological regulations. Hence, FDI may negatively affect sustainable development. The study’s findings suggest that FDI did not play a significant role in reinforcing sustainable development by increasing energy efficiency and mitigating fossil fuel energy usage. Therefore, the policymakers in the country must implement more regulations to support green-forging direct investment. In fact, foreign capital is considered to be the engine of economic development in emerging economies. The main challenge of FDI strategies in these countries is the absence of ecological regulations. Hence, with less stringent environmental regulations in FDI policies, the country is more likely to attract foreign investment with high emissions to invest, leading to the promotion of nonrenewable energy rather than renewable energy.
Finally, taxation revenues from the examined models have positive and statistically significant coefficients with different significance levels in all estimations. These results corroborate similar findings found by Bhowmik et al. (2023) [
2] who employed the bootstrap ARDL approach and suggested that fiscal policy channels significantly influence energy use. The authors suggested that these channels play a positive role in accomplishing some SDG in the case of the USA. These findings provide some vital suggestions that fiscal policy can play a significant role in promoting sustainable development in the economy by supporting clean energy investment and consumption. Therefore, the policymakers in South Africa should establish a green financial system to reinforce renewable energy using financial and fiscal incentive tools. Using these incentives will promote ecological sustainability by stimulating green investments. For example, governments can use tax incentives for firms that invest in clean energy sources. The findings from the Granger causality analysis suggest a unidirectional causal link between GDP, taxation revenues, and REC. These findings support the findings of the ARDL model and affirm the significant connection between GDP, taxation revenues, and REC.
6. Conclusions and Policy Recommendations
6.1. Conclusions
South Africa has experienced significant financial and economic development over the last decades. In this context, the GDP per capita in South Africa has increased from USD 57 billion in 1991 to USD 419 billion in 2021. With excellent banking regulation, a developed economy, and advanced infrastructure, the financial sector in the country is ranked in the top ten financial sectors in the world. South Africa is one of the world’s leading exporters of gold, platinum, and other natural resources. Despite this fact, the energy policy is still the main challenge in the country. In this context, the present study aims to assess the impact of oil prices, economic growth, FDI, and fiscal policy on the REC in South Africa. The research used yearly data from 1979 to 2019. To the best of our scientific knowledge, this study is the first literature to test fiscal policy and oil prices on renewable energy in South Africa using sophisticated techniques of the augmented ARDL approach. The ARDL findings illustrated that economic growth was positively linked to REC. Thus, an increase in economic development in the country promotes the level of REC. In addition, the ARDL approach findings show that taxation revenues positively affected REC in South Africa in both the short and long run.
Moreover, the findings from robust assessments (FMOLS, DOLS, and CCR) support that economic growth and taxation revenues were positively linked to REC. Likewise, the findings of ARDL, FMOLS, DOLS, and CCR tests asserted that the coefficient of oil price negatively affected REC levels in South Africa. These findings can be attributed to oil price changes significantly affecting economic development for both oil-importing and -exporting countries. In this context, an increase in oil prices presents bad news for oil-importing economies such as South Africa. This can be attributed to a rise in oil price that will mitigate oil consumption. This will encourage markets and individuals to switch to green energy sources such as solar energy. Subsequently, this will lead to the sustainable development of the country. On the other hand, the findings displayed that FDI coefficients from ARDL and robust assessments were not found to promote renewable energy in both short and long periods. These findings can be attributed to the fact that the government in South Africa did not support the policies and regulations that promote the utilization of renewable energy technologies and improvements in FDI inflow-attracting factors such as efficient energy technologies.
6.2. Policy Recommendation
The present work introduces essential findings and implications for South Africa’s government. Firstly, the government must adopt green policies to promote environmental sustainability by encouraging investment in green energy. These policies will enhance the ecological sustainability of the country. In addition, it will help to decline the country’s dependency on foreign energy suppliers.
First, the government needs to spend a large portion of the budget for research and development projects and provide awareness to producers, and use green energy sources and ecofriendly technologies. These policies will help the country to achieve sustainable development and reduce the country’s dependency on foreign energy suppliers.
Second, the policymakers in South Africa should design strategies to avert the adverse effect of oil prices on the development of the renewable energy industry.
Third, the country needs to promote green energy consumption using fiscal policy by imposing taxes on nonclean energy utilization. In contrast, they should also reduce the tax of rate on green energy sources. In this context, the study suggests that financial incentives such as low tax rates on green production and investment will help to sustain the environment.
Fourthly, the government must remove any restrictions on green foreign investment in the country and adopt green policies to promote local and foreign investment in green energy. These policies will enhance the ecological sustainability of the country.
Finally, supporting renewable energy is indispensable in the country to accomplish the SDG, in particular SDG 7, which aims to promote clean and reliable energy by integrating and increasing renewables into the energy mix.
6.3. Limitations of the Study and Future Studies
The main objective of this work is to explore the link between oil prices, fiscal policy, FDI, economic growth, and REC. The prime shortcoming of the present work is that it ignores nonlinear analysis, such as NARDL, in the tested country. The main advantage of NARDL is to overcome the weakness of the classical ARDL method and capture the positive and negative impact of the selected variables [
58,
59,
60]; thus, future studies might extend this work by testing the asymmetric effects of oil prices on the REC in South Africa or other countries using nonlinear analysis. In addition, the study focused on South Africa as an oil-importing country; further studies can concentrate on the link between oil prices and renewable energy in other oil-exporting countries such as Azerbaijan and Kazakhstan. Likewise, the study used data from 1979 to 2019 due to data availability. Hence, future studies can use updated data when they are available. Finally, future papers can assess the impact of fiscal policy on renewable energy using other fiscal policy proxies, such as government expenditures.


