Abstract
Traditional mapping of salt affected soils (SAS) is very costly and cannot precisely depict the space–time dynamics of soil salts over landscapes. Therefore, we tested the capacity of Landsat 8 Operational Land Imager (OLI) data to retrieve soil salinity and sodicity during the wet and dry seasons in an arid landscape. Seventy geo-referenced soil samples (0–30 cm) were collected during March (wet period) and September to be analyzed for pH, electrical conductivity (EC), and exchangeable sodium percentage (ESP). Using 70% of soil and band reflectance data, stepwise linear regression models were constructed to estimate soil pH, EC, and ESP. The models were validated using the remaining 30% in terms of the determination coefficient (R2) and residual prediction deviation (RPD). Results revealed the weak variability of soil pH, while EC and ESP had large variabilities. The three indicators (pH, EC, and ESP) increased from the wet to dry period. During the two seasons, the OLI bands had weak associations with soil pH, while the near-infrared (NIR) band could effectively discriminate soil salinity and sodicity levels. The EC and ESP predictive models in the wet period were developed with the NIR band, achieving adequate outcomes (an R2 of 0.65 and 0.61 and an RPD of 1.44 and 1.43, respectively). In the dry period, the best-fitted models were constructed with deep blue and NIR bands, yielding an R2 of 0.59 and 0.60 and an RPD of 1.49 and 1.50, respectively. The SAS covered 50% of the study area during the wet period, of which 14 and 36% were saline and saline-sodic soils, respectively. The extent increased up to 59% during the dry period, including saline soils (12%) and saline-sodic soils (47%). Our findings would facilitate precise, rapid, and cost-effective monitoring of soil salinity and sodicity over large areas.
1. Introduction
Salinity and sodicity are the most serious soil degradation processes in arid and semi-arid regions [1]. Globally, salt-affected soils (SAS) cover nearly 1060 million hectares (Mha) of which 40 and 60% are affected by salinity and sodicity, respectively [2]. The salt problems occur primarily due to weathering of rocks and minerals, seawater intrusion, active aeolian processes, rising water tables, and intensive evaporation [3]. Moreover, improper management practices, mainly irrigation without sufficient drainage, exacerbate salt problems in soils [4]. About 60 Mha (20% of the total irrigated lands) are salt-affected, and this area is expected to increase due to climate change [5]. Therefore, precise large-scale mapping of saline and/or sodic soils is essential for sustainable land-use planning.
Predicting the spatial extent of SAS over large areas is a very hard task due to the complexity and dynamic nature of salt [6]. Classically, geostatistical models available within the geographic information system (GIS) have been applied to map and monitor SAS [7,8]. Though these models can provide proper estimates of soil classes, the prediction accuracy is affected by the number of samples and how they are allocated in the area [8]. Moreover, intensive field surveys and laboratory analyses are needed to overcome the spatial heterogeneity across the fields [9]. Thus, traditional mapping is still time-consuming, labor-intensive, and costly, limiting its applicability for temporal observations over vast regions [10]. This entails adopting alternative methods, especially in regions with poor human and financial support.
Remote sensing (RS) data can assist large-scale digital soil mapping at a high accuracy [7]. Satellite RS data offer reliable and synoptic observations of soils at a variety of spatiotemporal scales [10]. This allows tracking space–time variations of soil quality in rapid and inexpensive ways [6]. Satellite RS-based mapping revolves around relating the spectral reflectance of soils in the visible (VIS), near-infrared (NIR), and shortwave infrared (SWIR) regions with soil attributes [8]. Among open-source multispectral data, the Landsat series has proved efficient in detecting SAS in many drylands of the world [8,10,11]. Landsat data can be traced back to the 1980s, providing over forty years of constant observations at 30 m spatial resolution [12]. Compared with the earlier Landsat series, Landsat 8 Operational Land Imager (OLI) data are superior due to higher radiometric and geometric resolutions, better acquisitions, and more spectral bands [7]. Hence, OLI data open new ways for mapping SAS at a proper resolution.
Applying salinity and spectral indices derived from satellite imageries has become the most common approach to detect SAS in recent years [10,13,14]. Yet, there is no universal index that can yield a single satisfactory outcome under any ecological conditions [13]. This is because the surface reflectance of SAS is influenced by other soil properties such as color, texture, organic matter, and carbonate [7]. The robustness of such indices is governed also by the spectral and spatial resolutions of satellite imageries, vegetation status (type and density), and atmospheric effect [11]. Thus, relating satellite RS data with field and laboratory measurements using advanced algorithms has increased the prediction accuracy [6,9].
Inversion models based on machine learning and statistical analyses have been applied to retrieve topsoil properties on local scales using soil spectra [8,15,16]. The machine learning models set a constant relation between independent and dependent variables and thus ignore the changes resulting from spatial variability [16]. In comparison, statistical-based models such as stepwise regression can improve the inversion accuracy and build dynamic relations of soil composition with multiple covariates. It also removes the collinearity in data and provides the optimal regression equation [8,16]. Inversion models derived from stepwise regressions of OLI multispectral bands could precisely estimate soil alkalinity/salinity in China [15] and soil salinity in the USA [17]. Hence, testing this powerful approach in other regions would help in developing local soil archives for saline and/or sodic soils.
Egypt is one of the main hotspots of SAS in the world, where 93% of the total irrigated lands undergo salinization and waterlogging, causing up to 25% crop yield reduction [18]. The major threats occur in the northern part of the Nile Delta and its eastern and western fringes due to the intrusion of saline waters from the Mediterranean Sea and northern lakes [19]. Local soil salinity mapping using spectral indices was achieved in these regions [20,21,22]. Yet, the linkage between RS data in different spectral channels and soil salt dynamics across different seasons is still vague. The current work, therefore, aimed to (1) explore the relations between the band reflectance of Landsat 8 imageries and soil salinity and sodicity indicators, (2) construct inversion models to retrieve these indicators, and (3) map saline/sodic soils in the wet and dry seasons in the northeastern part of the Nile Delta region.
2. Materials and Methods
2.1. Study Area
This study was conducted in an area of 607.74 km2, which is located in Port-Said and Ismailia Governorates. The geographic location is in the UTM (Universal Transverse Mercator) zone 36 between 30°45′27″ to 31°04′31″ N and 32°19′39″ to 32°33′55″ E (Figure 1). The region is bounded by the Mediterranean Sea from the north, the Suez Canal from the west, the Sinai Peninsula from the east, and desert plains from the south. This region has gained attention to establish new agroecosystems, owing to the good potential of water resources and transportation accessibility. Land reclamation projects were started in the early fifteens of the last century and have increased rapidly since the 1980s [21]. The cropping pattern is dominated by a permanent crop (alfalfa) and annual crops, including wheat, barley, and sugar beet in the winter and rice in the summer. The elevation height ranges from −118 to 72 m above sea level, and the slope varies from 0 to 92%. The geological map of Egypt [23] indicates that the Quaternary formations cover 97.4% of the study area, including stabilized sand dunes (51.9%) and undifferentiated deposits (45.6%), mainly wadi and playa deposits. The remaining 2.85% is covered by the Lower Pliocene Hagul formation (chalky limestone, sandstone, and shale).
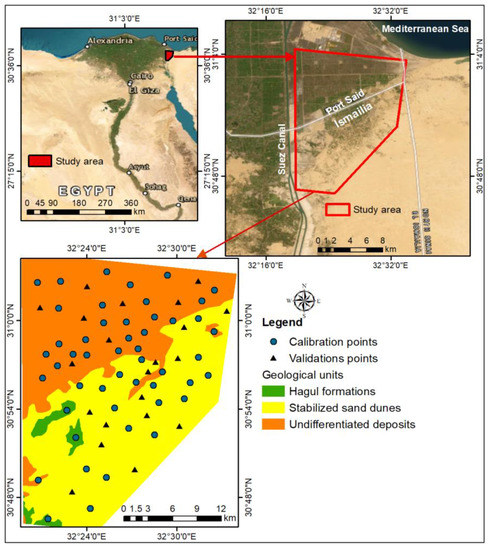
Figure 1.
Location and geological maps of the study area.
The minimum temperature is 8.1 °C during January, while the maximum value is 35.9 °C during August (Figure 2). The mean annual temperature is 21.9 °C, implying that the soil temperature regime is “Thermic” and the soil moisture regime is “Torric” [24]. The total annual rainfall (R) is 47.4 mm and mostly occurs during the winter season. The potential evapotranspiration (PET) varies from 1.8 mm day−1 (January) to 6.2 mm day−1 (August), with a mean annual value of 4.02 mm day−1. The aridity index (R/PET) is less than 0.05, indicating a hyper-arid climate [25].
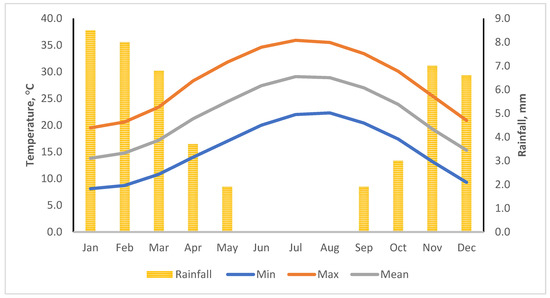
Figure 2.
Mean monthly temperature and precipitation in the studied region.
2.2. Data Acquisition and Handling
2.2.1. Field Work and Laboratory Analysis
Based on geological features, a total of 70 sampling points were randomly distributed across the studied region (Figure 1). The exact locations were accessed using a portal Global Positioning System (Garmin GPS 72: accuracy < 10 m). Topsoil samples (0–30 cm) were collected during March and September 2022 to represent the wet and dry seasons, respectively. At each sampling location, five soil samples were gathered and mixed to obtain a composite sample. The samples were then placed in polyethylene bags and labeled for the laboratory analyses. The soil analyses were performed according to Soil Survey Staff [26]. All samples were air-dried, crushed, and passed through a 2 mm mesh. The pH was determined in 1:2.5 soil-water suspensions, while the electrical conductivity (EC) was determined in the soil paste extracts. In these extracts, the concentrations of Na+ and K+ were measured using the flame photometer, while the concentrations of Ca2+, Mg2+, Cl−, HCO3−, and CO32− were determined using standard titration methods. The exchangeable sodium (Ex. Na) was determined using the ammonium acetate at pH 7.0 method. The exchangeable sodium percentage (ESP) was calculated using values of the Ex. Na and cation exchange capacity (CEC) as follows:
The soil particle size distribution was determined using the standard pipette method.
2.2.2. Remote Sensing Data
Landsat 8 OLI and Thermal Infrared Sensor (TIRS) Collection 2 Level-2 Science Products data were used in the current study. Two scenes of Landsat 8 OLI/TIRS products (Path 176/Row 39) in the UTM projection zone 36 and World Geodetic System (WGS-84) datum were downloaded in GeoTiff format from the U.S. Geological Survey (USGS). Data were acquired on 5 March and 29 September 2022 to represent the wet and dry period imageries in the study area (Figure 3). The data included eleven bands in the VIS-NIR-SWIR-TIR spectra. However, only seven bands with a 30 m spatial resolution in the VIS-NIR-SWIR regions were used for the present study. The bands (B) included coastal aerosol (B1), blue (B2), green (B3), red (B4), NIR (B5), SWIR-1 (B6), and SWIR-2 (B7).
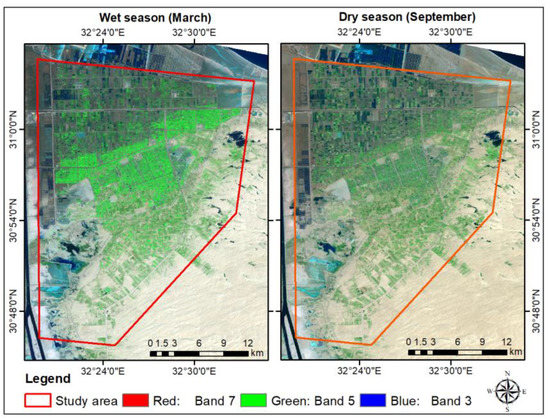
Figure 3.
Landsat 8 OLI/TIRS imageries of the study area.
Within the ArcGIS 10.8 software (ESRI, Redlands, CA, USA), the band-specific rescaling factors provided by the USGS metadata were used for converting digital number (DN) values of the seven bands to reflectance values as follows:
where ρλ′ is the top-of-atmosphere (TOA) reflectance without a correction of the solar angle, Mρ is the band-specific multiplicative factor, Qcal is the quantized and calibrated standard product pixel values (DN), and Aρ is the band-specific additive factor.
Thereafter, TOA reflectance with a correction of the sun angle (ρλ) was calculated using the local sun elevation angle (θSE) as follows:
The land cover maps for the two seasons were produced using an unsupervised classification with the Iso Cluster method followed by a supervised classification with the Maximum Likelihood method available within the ArcGIS 10.8 software.
2.3. Modeling Strategy
Two datasets containing all geo-referenced points besides their soil salinity and sodicity indicators and band reflectance data were established for the wet and dry seasons. For each season, the whole dataset was randomly and automatically divided into two sections [27] using the SPSS 28.0 software (IBM, Armonk, NY, USA), including a calibration set of 49 samples (70%) to develop the inversion model and a validation set of 21 samples (30%) to validate the outcomes.
As a prerequisite for the linear statistical analysis, the normal distribution of soil data was explored using the Kolmogorov–Smirnov test [28,29]. The variable with a low significant level (<0.05) was considered as not normal, and thus several transformations using Log, Ln, and square root methods were applied to the skewed data. Pearson’s correlation analysis was performed to explore the spectral sensitivity to soil properties. The statistically sensitive bands were used for developing stepwise multiple linear regression (SMLR) models. The measured soil attributes were set as independent variables, while the spectral reflectance values of the seven bands (B1 to B7) were set as dependent variables.
The cross-validation procedure based on the coefficient of determination (R2), root mean square error (RMSE), and residual prediction deviation (RPD) was performed to verify the robustness of modeling procedures. The R2 expresses the goodness of fit between the predicted and observed values, while the RMSE quantifies the absolute prediction error [15]. The values of R2 and RMSE were calculated as follows:
where Y1 and Y2 are the observed and predicted values, respectively, Ya is the mean of the observed values, and n is the number of observations.
The RPD is s normalized statistics, which is superior to the RMSE for comparing results from datasets with different variability degrees [30]. The RPD was calculated based on the standard deviation (SD) of the observed values and RMSE as follows:
According to Wang et al. [13], the model accuracy was defined in three levels: level A (RPD ≥ 2.0) indicates the most efficient model with a reliable predictive capacity, level B (1.4 ≤ RPD < 2.0) indicates a good model with sufficient outcomes, and level C (RPD ≤ 1.4) indicates unreliable predictive ability.
2.4. Mapping Soil Salinity and Sodicity
Considering the best-fitted retrieval models, the soil EC and ESP maps were generated using the raster calculator integrated with ArcGIS 10.8 spatial analysis tools. Soil salinity was arranged in five classes according to EC (dS m−1) values [31], including non-saline (0–2), very slightly saline (2–4), slightly saline (4–8), moderately saline (8–16), and strongly saline (>16). Soil sodicity classes [2] were categorized using ESP values as follows: none sodic (<15), slightly sodic (15–30), moderately sodic (30–50), strongly sodic (50–70), and extreme (>70). The saline soils were defined by EC above 4 dS m−1, while the sodic soils were distinguished by ESP above 15. The spatial distribution of SAS in the two seasons was obtained by overlaying soil salinity and sodicity maps.
3. Results
3.1. Land Cover
The land cover maps (Figure 4) reveal three land cover classes dominating the studied region, including barren lands, vegetation, and water bodies. These classes occupied 307.55, 285.45, and 14.74 km2, representing 50.60, 46.97, and 2.43% of the total area, respectively, in the wet season. The same classes covered 366.29, 232.89, and 8.56 km2, accounting for 60.27, 38.32, and 1.41% of the total area, respectively, in the dry season. The water bodies included permanent ponds (in the northeastern part), seasonal ponds (in the southwestern part), and fish farms (mainly in the western and northern parts). The spatial distribution of the three land cover classes displayed seasonal variations. The extent of water bodies and vegetation decreased by 1.02 and 8.65% from the wet to dry period. The extent of barren lands, on the other hand, increased by 9.66% in the dry period.
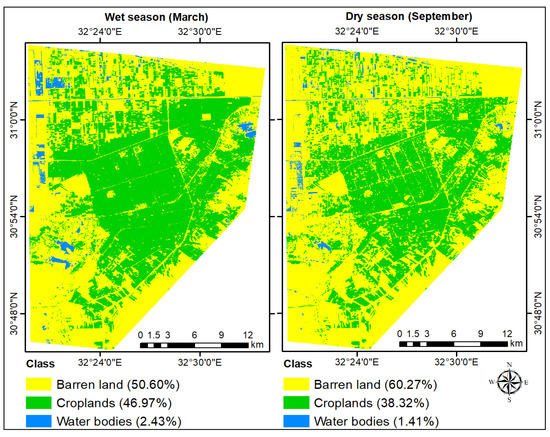
Figure 4.
Land cover maps of the study area in the wet and dry periods.
3.2. Soil Physicochemical Characteristics
The results in Table 1 show that the mean soil pH in the wet season was 7.61 and lower than that in the dry season (7.83). The mean soil EC in the wet season was 6.10 dS m−1 and about 58% lower than the one in the dry season (9.61 dS m−1). The concentrations of soluble ions were higher in the dry period than in the wet period. CO32− was not found in the samples, and thus was not examined hereafter. The mean soil ESP in the wet period was 12.03 and nearly 39% lower than the one in the dry period (16.77). The sand dominated the soil particle size distribution, averaging 48.74%, followed by clay (35.04%) and silt (16.22%). Half of the soil samples had a fine texture (clay—43% and sandy clay—7%), 44% had a medium texture (sandy loam—17%, sandy clay loam—17%, loam—9%, and silty loam—1%), while 6% had a loamy sand texture. The coefficient of variation (CV) defines the degree of variability, where CV values below 20, 20–50, and above 50% indicate low, moderate, and large variability [30]. Hence, all the studied soil characteristics had large variabilities in both seasons, except the pH (low variability) and the sand content (moderate variability).

Table 1.
Descriptive statistics of soil physicochemical properties (n = 70).
The Kolmogorov–Smirnov normality test reveals low significant values (p < 0.05) for EC and ESP in the two seasons (Table 2). This, in turn, indicates that the two variables differ significantly from the normal distribution. The best normal distribution trends were obtained by the square root (√) transformations. Thus, the original pH, √EC, and √ESP values for the wet and dry seasons were considered for the correlation and regression analyses. The selected calibration and validation datasets had nearly identical ranges for pH, EC, and ESP (Table 2). Moreover, the one-way analysis of variance (ANOVA) test revealed no significant differences in these properties between the calibration and validation datasets in the two seasons. Thus, the soil salinity and sodicity of both datasets sufficiently represent the entire dataset, implying the ability of calibration models to provide satisfactory predictions.

Table 2.
Descriptive statistics of soil data in the calibration and validation datasets.
3.3. Soil Spectral Characteristics
The reflectance of OLI/TIRS bands in all spectral channels (Figure 5) displayed unclear associations with the soil pH in the two seasons. However, the slightly alkaline soils (pH 7.4 to 7.8) had higher reflectance than moderately alkaline (pH 7.9 to 8.4) and strongly alkaline soils (pH 8.5 to 9). In contrast, the spectral reflectance values showed decreased trends with increasing soil EC and ESP levels. In the VIS channel (B1 to B4), the spectrum curves decreased gradually and the reflectance of soil salinity and sodicity classes exhibited similar values. This, in turn, renders the discrimination between soil salinity and sodicity levels using the VIS spectral bands difficult. In the NIR and SWIR spectral channels, the spectrum curves decreased sharply and the reflectance of soil salinity and sodicity classes exhibited different values. Specifically, the NIR band (B5) could discriminate the reflectance of each soil salinity and sodicity class in the two seasons.
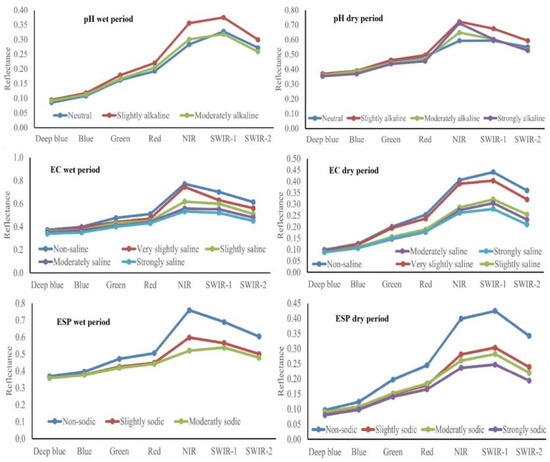
Figure 5.
Spectral reflectance curves of soil pH, EC, and ESP classes.
Pearson’s correlations between the band reflectance and soil pH, EC, and ESP are presented in Table 3. The level of p < 0.05 denoted a significant correlation, while p < 0.01 reflected a highly significant correlation. The band reflectance in all spectral channels had no significant correlations with soil pH in the two seasons. With the exception of B1 and B2, all bands showed significant and highly significant correlations with EC (in the two seasons) and ESP (in the dry season). However, in the wet season, only NIR and SWIR bands displayed significant and highly significant correlations with ESP. Among the seven bands, the NIR band showed the highest correlations with EC (−0.76 in the wet season and −0.69 in the dry season) and ESP (−0.74 in the wet season and −0.68 in the dry season). The seven bands showed also significant correlations among each other in the two seasons, reflecting collinearity between these bands.

Table 3.
Pearson’s correlations between band (B) reflectance and soil properties.
3.4. Prediction Models for Soil Salinity and Sodicity
The results of the SMLR models developed to relate soil EC and ESP with multispectral bands are shown in Table 4. Only the NIR band (B5) contributed to predicting soil EC (Equation (7)) and ESP (Equation (8)) in the wet period. The two models had sufficient fits and adequate outcomes to express soil salinity and sodicity in this period. For the cross-validation datasets, the EC and ESP predictive models had R2 values of 0.65 and 0.61 and RPD values of 1.44 and 1.43, respectively. Although predicting soil EC (Equation (9)) and ESP (Equation (11)) in the dry period was implanted also with the NIR band, the models had poor performances. The R2 and RPD for the cross-validation datasets were lesser than the acceptable limits of 0.5 and 1.4, respectively. The best-fitted retravel models for EC (Equation (10)) and ESP (Equation (12)) were constructed by combing the deep blue band (B1) with the NIR band. As indicated by the cross-validation results, band integrations improved the performance since the EC and ESP retravel models had an R2 of 0.59 and 0.60 and an RPD of 1.49 and 1.50, respectively.

Table 4.
Predictive models derived from the stepwise multiple linear regression.
3.5. Distribution of Soil Salinity and Sodicity
The predictive maps of soil EC and ESP are given in Figure 6 and Figure 7, respectively. In the two seasons, the higher salinity and sodicity levels occurred mainly in the northern and western parts, while the lowest ones were in the middle and southern parts. As shown in Table 5, the proportions of non-saline, very slightly saline, slightly saline, moderately saline, and strongly saline soils were 33.78, 13.86, 13.81, 13.72, and 22.40%, respectively, in the wet period, while they were 31.05, 8.15, 10.07, 13.15, and 36.17%, respectively, in the dry period. Results in Table 6 indicate that the non-sodic, slightly sodic, and moderately sodic soils covered 61.41, 21.94, and 14.21% of the total area, respectively, in the wet period. In the dry period, the non-sodic, slightly sodic, moderately sodic, and strongly sodic soils covered 51.17, 23.89, 22.59, and 0.95% of the total area, respectively.
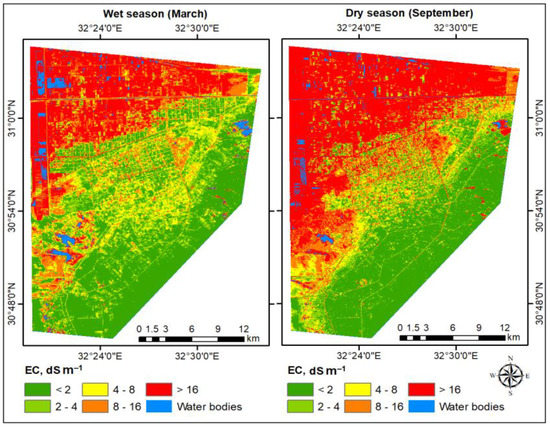
Figure 6.
Distribution maps of soil EC across the study area.
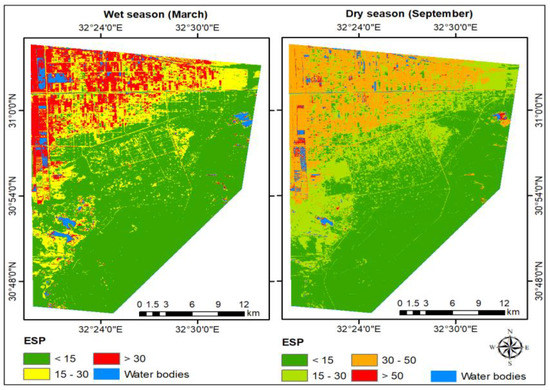
Figure 7.
Distribution maps of soil ESP across the study area.

Table 5.
Areas of soil salinity classes in the study area.

Table 6.
Areas of soil sodicity classes in the study area.
The spatial extent of soil salinity and sodicity classes showed seasonal variations. From the wet to dry period, the proportions of non-saline, very slightly saline, and slightly saline soils decreased by about 3, 6, and 4%, respectively; meanwhile, the proportion of strongly saline soils increased by about 14% (Table 5). The proportions of moderately saline soils were relatively stable during the two seasons. From Table 6, we can see that the proportion of non-sodic soils decreased from the wet to dry period by about 10%, while the proportions of the slightly and moderately sodic soils increased by 2 and 8%, respectively. Moreover, the strongly sodic soils were developed only during the dry period. Specifically, the soil salinity and sodicity in the dry period were higher than in the wet period.
3.6. Distribution Maps of Salt-Affected Soils
The studied area was dominated by three types of SAS, including non-saline non-sodic soils, saline soils, and saline-sodic soils (Figure 8). During the two periods, the soils with neither salinity nor sodicity problems were mostly observed in the middle and southern parts. On the other hand, the soils affected by salinity and sodicity problems were mostly found in the northern and southern parts. The soils affected only by salinity problems were detected in small and scattered patches across the interior region in the two seasons. The results in Table 7 show that the non-saline non-sodic, saline, and saline-sodic soils covered 47.64, 13.78, and 36.15% of the total area, respectively, in the wet season and 39.21, 11.79, and 47.42%, respectively, in the dry season. This, in turn, indicates spatial variabilities of salt-affected areas across different seasons. From the wet to dry period, the proportions of non-saline non-sodic and saline soils decreased by about 8 and 2%, respectively; meanwhile, the proportion of saline-sodic soils increased by nearly 11%.
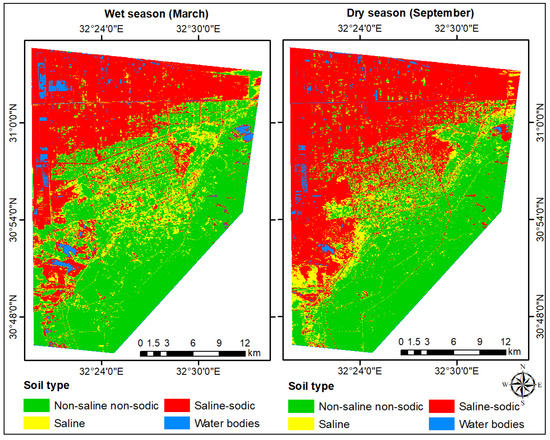
Figure 8.
Distribution maps of salt-affected soils across the study area.

Table 7.
Areas of salt-affected soils in the studied region.
4. Discussion
4.1. Seasonal Variability of Land Cover and Soil Properties
Normally, climate conditions and agronomic practices have vital roles in changing land cover patterns across different seasons [13,17]. The decreased extent of the water bodies in the dry period is closely related to the drying of seasonally submerged areas due to the higher temperature and evaporation rate than in the wet season. The winter crops are still growing during March, while the summer crops are mostly harvested at the end of September. This, in turn, could explain the decreased extent of vegetation cover from the wet to dry period. Owing to the decline in water bodies and vegetated areas in the dry period, the extent of barren land increased.
In arid and desert lands, seasonal fluctuations in air temperature, evaporation rate, and rainfall have significant effects on soil salt dynamics [32]. Uneven rainfalls during the wet period cause partial leaching of the soluble ions from the topsoil to deep layers, resulting in relatively lower concentrations [13]. Moreover, fine- and medium-textured soils with strong capillary effects [33] dominated the studied region. Thus, in response to the higher evaporation rate in the dry period, the soluble ions tend to seep up to the topsoil [16]. Therefore, the build-up in soil salinity and sodicity were highly noticeable in the dry period than in the wet period.
4.2. Sensitivity of Band Reflectance to Soil Properties
The reflectance of OLI/TIRS bands did not uniformly link to the soil pH in the two seasons, which is in line with the spectral characteristics of alkaline soils in China [16]. Most of our soils were slightly to moderately alkaline, and thus the band reflectance did not respond to the narrow pH range. In contrast, the strong heterogeneity of soil EC and ESP across the study area led to a regularity with the corresponding spectral features. The decreased soil reflectivity with increasing EC levels is in agreement with the results reported for a coastal saline area in Vietnam [27]. Such a decline is likely due to the hygroscopic nature of salts, as more energy is absorbed with increasing salt and water molecules [34]. Thus, stable declines were noticed in the NIR and SWIR spectral channels owing to the sensitivity of these bands to water content [35]. However, the most evident trend occurred in the NIR spectrum, which is in harmony with earlier published results [34,36,37].
The weak correlations of all spectral bands with soil pH revealed that OLI/TIRS imageries failed to capture the narrow spectral feature of soil pH during the two seasons. However, the pH of Chinese soils was highly linked to OLI/TIRS bands [15,38], probably due to different surface and soil conditions. This entails an urgent need to verify the capacity of Landsat 8 imageries to retrieve the soil pH under diverse ecological conditions. Compared with soil pH, the reflectance of OLI/TIRS bands had higher correlations with EC and ESP. The non-significant correlations with the deep blue and blue bands reflect the high sensitivity of these bands to soil optical properties and atmosphere conditions, limiting their associations with salt contents [39,40]. The reflectance in the longer wavelengths (B3 to B7) is less affected by the atmospheric factors [39], showing significant relations with soil salts.
The amount and type of salts affect soil color [30], which interprets the linkages to green and red bands. The reverse relations suggest the presence of nahcolite (NaHCO3), thenardite (Na2SO4), and gypsum (CaSO4.2H2O), which reduce the reflectance in the VIS range [34]. The higher relations with NIR and SWIR bands indicate the formation of spectral features related to the soil-salt mineralogy [40]. Chloride, sulfate, and carbonate minerals have distinct absorption features in the NIR and SWIR channels related to fluid inclusions or absorbed water [34,39]. The inverse relations indicate the dominance of hygroscopic salts (NaCl, CaCl2, and MgCl2), which absorb more energy and decrease the spectral reflectance [34]. Thus, the NIR bands had the highest relations with EC and ESP, probably due to the strong energy absorption by water molecules in this spectral channel [41]. Our findings are in line with Meng et al. [42] and Nguyen et al. [27], who reported that the NIR band of Landsat OLI imageries had the highest correlation with soil EC.
4.3. Retrieving Soil EC and ESP from OLI/TIRS Bands
Linear regression is still the most simple and popular approach applied to retrieve topsoil properties from satellite RS data [8,29]. The SMLR models can precisely portray the sensitivity of multiple RS covariates to the changes of a certain soil property, offering optimal regression equations [13,16]. Thus, reliable inversion models via linking reflectance of OLI bands with filed measurements of soil EC have been documented in previous case studies. These models were constructed with a single band such as the deep blue band (B1) in northeast China [15] or with blue (B2) and red (B4) bands in North Carolina, USA [17].
In the study area, only the NIR band contributed to EC and ESP predictions in the wet period, which went hand-in-hand with the correlation results. Normally, the soil water content increases during the wet period, resulting in a higher absorption of the NIR spectrum [35]. This, in turn, might provide the superiority of B5 to discriminate the amount and type of soil salts. During the dry period, the best-fitted models were constructed with the deep blue and NIR bands, regardless of the non-significant relations of B1 with EC and ESP. This might be related to the effect of intercorrelation with other spectral bands [43]. The low soil moisture content during the dry period increases the atmospheric burdens of dust and aerosol, leading to significant effects on the band reflectance [41].
Overall, results of the SMLR models indicated the possible use of OLI/TIRS bands to track space–time dynamics of soil EC and ESP over the studied region. This assumption could be affirmed by the R2 and RPD values of the cross-validation datasets. The models (Equations (6), (7), (9) and (11)) proved sufficient agreements between the predicted and observed values, with R2 ranging from 0.59 to 0.65. The adequate performance was also depicted by the low variation between the predicted and observed values, showing an RPD varying from 1.43 to 1.50. According to Wang et al. [13] and Mammadov et al. [30], models with an RPD above 1.4 can be applied in prediction procedures. The robustness of the developed models in our work could be due to the absence of obstacles (cloud, dense vegetation, and crop residue), which hamper the retrieval of topsoil properties from satellite RS imageries [44].
4.4. Space–Time Dynamics of Soil Salinity and Sodicity
The mapping results point to distinct space–time changes in soil EC and ESP across the study area. However, during the two seasons, soils affected by the highest salt problems were mostly nearby the shores. This, in turn, indicates extensive saline water intrusions from the Mediterranean Sea in the north and the Suez Canal in the west [19]. The extent of seawater instructions tends to decline into the interior region, causing lower salt problems. Depending on soil texture and salt types, soil salinity and sodicity problems are normally exacerbated during the dry period due to a capillary rise and salt accumulation on soil surfaces [13,33]. Thus, the increased extent of strongly saline soils during the dry period was related to the higher accumulation of soluble salts in soils. Sodium salts constituted a great portion of these salts, leading to increasing the extent of slightly and moderately sodic soils and the development of strongly saline soils.
The spatiotemporal dynamics of soil salts had also a profound impact on the distribution of SAS across the studied region. The non-saline non-sodic soils occupied the interior region, where the extent of seawater intrusion was relatively far away from these parts. On the other hand, being highly vulnerable to extensive seawater instructions, the saline and saline-sodic soils were located mainly near the shores. The increased extent of saline-sodic soils in the dry period suggests a higher precipitation of Ca2+ and Mg2+ salts, leaving Na+ as the dominant cation on soil collides [45]. Generally, the developed maps indicate that the studied region is highly affected by salt problems. Therefore, future studies should focus on designing proper agronomic practices to ameliorate soil and improve crop productivity.
5. Conclusions
The soil EC and ESP were highly variable across the entire study area, while the soil pH displayed weak variability. However, values of the three indicators (pH, EC, and ESP) increased from the wet to dry period. The spectral resolution of OLI/TIRS imageries was inadequate to capture the narrow spectral feature related to the soil pH. In contrast, the ability to explore the spectral features related to soil EC and ESP was rather notable at the SWIR channel and quite evident at the NIR channel. The EC and ESP retrieval models developed with the NIR band in the wet period yielded adequate outcomes (an R2 of 0.65 and 0.61 and an RPD > 1.4), while the NIR models’ results in the dry period were not reliable. After integrating B1 with B5, the best-fitted EC and ESP predictive models were obtained with an R2 of 0.59 and 0.60, respectively, and an RPD exceeding the acceptable limit (1.4). The predictive maps revealed increased soil salinity and sodicity levels from the wet period to dry periods, with the highest threats affecting areas near the shores. Selecting salt-tolerant crops and adopting proper agronomic practices is necessary for sustainable agricultural development in the studied region. The current work, in general, proved the applicability of Landsat OLI/TIRS data in dynamic soil salinity and sodicity monitoring at landscape scales. Future research is recommended to extend the conclusions of our work to other regions, especially in developing countries with poor financial support.
Author Contributions
Conceptualization, A.S.A., M.S.A.-H., M.S.E.-K. and M.S.S.; methodology, A.S.A., M.S.A.-H., M.S.E.-K. and M.S.S.; software, A.S.A., M.S.A.-H., M.S.E.-K. and M.S.S.; validation, A.S.A., M.S.A.-H., M.S.E.-K. and M.S.S.; formal analysis, A.S.A., M.S.A.-H., M.S.E.-K. and M.S.S.; investigation, A.S.A., M.S.A.-H., M.S.E.-K. and M.S.S.; resources, A.S.A., M.S.A.-H., M.S.E.-K. and M.S.S.; data curation, A.S.A., M.S.A.-H., M.S.E.-K. and M.S.S.; writing—original draft preparation, A.S.A., M.S.A.-H., M.S.E.-K. and M.S.S.; writing—review and editing A.S.A., M.S.A.-H., M.S.E.-K. and M.S.S.; visualization, A.S.A., M.S.A.-H., M.S.E.-K. and M.S.S.; supervision, A.A.E.B., E.S.M. and N.Y.R.; project administration, N.Y.R. All authors have read and agreed to the published version of the manuscript.
Funding
This research received no external funding.
Institutional Review Board Statement
Not applicable.
Informed Consent Statement
Not applicable.
Data Availability Statement
All data are included in the manuscript.
Acknowledgments
This paper has been supported by the RUDN University Strategic Academic Leadership Program.
Conflicts of Interest
The authors declare no conflict of interest.
References
- Fadl, M.E.; Abuzaid, A.S.; AbdelRahman, M.A.E.; Biswas, A. Evaluation of desertification severity in El-Farafra Oasis, Western Desert of Egypt: Application of modified MEDALUS approach using wind erosion index and factor analysis. Land 2022, 11, 54. [Google Scholar] [CrossRef]
- Omuto, C.T.; Vargas, R.R.; El Mobarak, A.M.; Mohamed, N.; Viatkin, K.; Yigini, Y. Mapping of Salt-Affected Soils: Technical Manual; Food and Agriculture Organization of the United Nations: Rome, Italy, 2020; p. 113. [Google Scholar]
- Basak, N.; Rai, A.K.; Barman, A.; Mandal, S.; Sundha, P.; Bedwal, S.; Kumar, S.; Yadav, R.K.; Sharma, P.C. Salt affected soils: Global perspectives. In Soil Health and Environmental Sustainability: Application of Geospatial Technology; Shit, P.K., Bhunia, G.S., Adhikary, P.P., Sengupta, D., Eds.; Springer International Publishing: Cham, Switzerland, 2022; pp. 107–129. [Google Scholar]
- Chhabra, R. Nature and origin of salts, classification, area and distribution of salt-affected soils. In Salt-Affected Soils and Marginal Waters: Global Perspectives and Sustainable Management; Chhabra, R., Ed.; Springer International Publishing: Cham, Switzerland, 2021; pp. 1–47. [Google Scholar]
- Eswar, D.; Karuppusamy, R.; Chellamuthu, S. Drivers of soil salinity and their correlation with climate change. Curr. Opin. Environ. Sustain. 2021, 50, 310–318. [Google Scholar] [CrossRef]
- Barman, A.; Basak, N.; Narjary, B.; Mitran, T. Land degradation assessment using geospatial techniques. In Geospatial Technologies for Crops and Soils; Mitran, T., Meena, R.S., Chakraborty, A., Eds.; Springer: Singapore, 2021; pp. 421–453. [Google Scholar]
- Kanwar, N.; Rai, S.; Kuniyal, J.C. Open-source satellite repository and geographic information system (GIS) for soil resource mapping. In Soil Health and Environmental Sustainability: Application of Geospatial Technology; Shit, P.K., Bhunia, G.S., Adhikary, P.P., Sengupta, D., Eds.; Springer International Publishing: Cham, Switzerland, 2022; pp. 3–25. [Google Scholar]
- Santra, P.; Kumar, M.; Panwar, N.R.; Yadav, R.S. Digital soil mapping: The future need of sustainable soil management. In Geospatial Technologies for Crops and Soils; Mitran, T., Meena, R.S., Chakraborty, A., Eds.; Springer: Singapore, 2021; pp. 319–355. [Google Scholar]
- Garzella, T.C.; Kazama, V.S.; Sassaki, M.H. Sampling and interpretation of maps. In Digital Agriculture; Marçal de Queiroz, D., Valente, D.S.M., Pinto, F.d.A.d.C., Borem, A., Schueller, J.K., Eds.; Springer International Publishing: Cham, Switzerland, 2022; pp. 81–98. [Google Scholar]
- Aksoy, S.; Yildirim, A.; Gorji, T.; Hamzehpour, N.; Tanik, A.; Sertel, E. Assessing the performance of machine learning algorithms for soil salinity mapping in Google Earth Engine platform using Sentinel-2A and Landsat-8 OLI data. Adv. Space Res. 2022, 69, 1072–1086. [Google Scholar] [CrossRef]
- Masoud, A.A.; Koike, K.; Atwia, M.G.; El-Horiny, M.M.; Gemail, K.S. Mapping soil salinity using spectral mixture analysis of landsat 8 OLI images to identify factors influencing salinization in an arid region. Int. J. Appl. Earth Obs. Geoinf. 2019, 83, 101944. [Google Scholar] [CrossRef]
- Fan, X.; Weng, Y.; Tao, J. Towards decadal soil salinity mapping using Landsat time series data. Int. J. Appl. Earth Obs. Geoinf. 2016, 52, 32–41. [Google Scholar] [CrossRef]
- Wang, J.; Ding, J.; Yu, D.; Ma, X.; Zhang, Z.; Ge, X.; Teng, D.; Li, X.; Liang, J.; Lizaga, I.; et al. Capability of Sentinel-2 MSI data for monitoring and mapping of soil salinity in dry and wet seasons in the Ebinur Lake region, Xinjiang, China. Geoderma 2019, 353, 172–187. [Google Scholar] [CrossRef]
- Kumar, N.; Reddy, G.P.O.; Nagaraju, M.S.S.; Naitam, R.K. Remote sensing and machine learning for identification of salt-affected soils. In Data Science in Agriculture and Natural Resource Management; Reddy, G.P.O., Raval, M.S., Adinarayana, J., Chaudhary, S., Eds.; Springer: Singapore, 2022; pp. 267–287. [Google Scholar]
- Bai, L.; Wang, C.; Zang, S.; Zhang, Y.; Hao, Q.; Wu, Y. Remote sensing of soil alkalinity and salinity in the Wuyu’er-Shuangyang River basin, Northeast China. Remote Sens. 2016, 8, 163. [Google Scholar] [CrossRef]
- Jia, P.; Shang, T.; Zhang, J.; Sun, Y. Inversion of soil pH during the dry and wet seasons in the Yinbei region of Ningxia, China, based on multi-source remote sensing data. Geoderma Reg. 2021, 25, e00399. [Google Scholar] [CrossRef]
- Davis, E.; Wang, C.; Dow, K. Comparing Sentinel-2 MSI and Landsat 8 OLI in soil salinity detection: A case study of agricultural lands in coastal North Carolina. Int. J. Remote Sens. 2019, 40, 6134–6153. [Google Scholar] [CrossRef]
- FAO-ITPS. Status of the World’s Soil Resources (SWSR)—Main Report; Food and Agriculture Organization of the United Nations (FAO) and Intergovernmental Technical Panel on Soils (ITPS): Rome, Italy, 2015. [Google Scholar]
- Ouda, S.; Khalifa, H.; Mohamadin, A.; Zohry, A.E.-H. Sustainable use of soil and water resources to combat degradation. In Global Segradation of Soil and Water Resources: Regional Assessment and Strategies; Li, R., Napier, T.L., El-Swaify, S.A., Sabir, M., Rienzi, E., Eds.; Springer Nature: Singapore, 2022; pp. 61–74. [Google Scholar]
- Arnous, M.O.; El-Rayes, A.E.; Green, D.R. Hydrosalinity and environmental land degradation assessment of the East Nile Delta region, Egypt. J. Coast. Conserv. 2015, 19, 491–513. [Google Scholar] [CrossRef]
- Arnous, M.O.; Green, D.R. Monitoring and assessing waterlogged and salt-affected areas in the Eastern Nile Delta region, Egypt, using remotely sensed multi-temporal data and GIS. J. Coast. Conserv. 2015, 19, 369–391. [Google Scholar] [CrossRef]
- Aboelsoud, H.M.; AbdelRahman, M.A.; Kheir, A.M.; Eid, M.S.; Ammar, K.A.; Khalifa, T.H.; Scopa, A. Quantitative estimation of saline-soil amelioration using remote-sensing indices in arid land for better management. Land 2022, 11, 1041. [Google Scholar] [CrossRef]
- CONCO-Coral/EGPC. Geologic Map of Egypt, Scale 1:500,000; Conoco-Coral and Egyptian General Petroleum Company (EGPC): Cairo, Egypt, 1987. [Google Scholar]
- Soil Survey Staff. Keys to Soil Taxonomy, 12th ed.; United States Department of Agriculture, Natural Resources Conservation Service: Washington, DC, USA, 2014. [Google Scholar]
- Prăvălie, R.; Bandoc, G.; Patriche, C.; Sternberg, T. Recent changes in global drylands: Evidences from two major aridity databases. CATENA 2019, 178, 209–231. [Google Scholar] [CrossRef]
- Soil Survey Staff. Soil Survey Field and Laboratory Methods Manual; Soil Survey Investigations Report No. 51, Version 2.0; Burt, R., Survey Staff, Eds.; U.S. Department of Agriculture, Natural Resources Conservation Service: Washington, DC, USA, 2014. [Google Scholar]
- Nguyen, K.-A.; Liou, Y.-A.; Tran, H.-P.; Hoang, P.-P.; Nguyen, T.-H. Soil salinity assessment by using near-infrared channel and Vegetation Soil Salinity Index derived from Landsat 8 OLI data: A case study in the Tra Vinh Province, Mekong Delta, Vietnam. Prog. Earth Planet. Sci. 2020, 7, 1. [Google Scholar] [CrossRef]
- Mitran, T.; Solanky, V.; Suresh, G.J.; Sujatha, G.; Sreenivas, K.; Ravisankar, T. Predictive mapping of surface soil texture in a semiarid region of India through geostatistical modeling. Model. Earth Syst. Environ. 2019, 5, 645–657. [Google Scholar] [CrossRef]
- Kılıc, O.M.; Budak, M.; Gunal, E.; Acır, N.; Halbac-Cotoara-Zamfir, R.; Alfarraj, S.; Ansari, M.J. Soil salinity assessment of a natural pasture using remote sensing techniques in central Anatolia, Turkey. PLoS ONE 2022, 17, e0266915. [Google Scholar] [CrossRef]
- Mammadov, E.; Denk, M.; Riedel, F.; Lewinska, K.; Kazmierowski, C.; Glaesser, C. Visible and near-infrared reflectance spectroscopy for assessment of soil properties in the Caucasus Mountains, Azerbaijan. Commun. Soil Sci. Plant Anal. 2020, 51, 2111–2136. [Google Scholar] [CrossRef]
- Soil Science Division Staff. Soil Survey Manual. USDA Handbook 18; Government Printing Office: Washington, DC, USA, 2017. [Google Scholar]
- Jafari, M.; Tavili, A.; Panahi, F.; Esfahan, E.Z.; Ghorbani, M. Characteristics of arid and desert ecosystems. In Reclamation of Arid Lands; Jafari, M., Tavili, A., Panahi, F., Esfahan, E.Z., Ghorbani, M., Eds.; Springer International Publishing: Cham, Switzerland, 2018; pp. 21–91. [Google Scholar]
- Zovko, M.; Romić, D.; Colombo, C.; Di Iorio, E.; Romić, M.; Buttafuoco, G.; Castrignanò, A. Ageostatistical Vis-NIR spectroscopy index to assess the incipient soil salinization in the Neretva River valley, Croatia. Geoderma 2018, 332, 60–72. [Google Scholar] [CrossRef]
- Mandal, A.K. The need for the spectral characterization of dominant salts and recommended methods of soil sampling and analysis for the proper spectral evaluation of salt affected soils using hyper -spectral remote sensing. Remote Sens. Lett. 2022, 13, 588–598. [Google Scholar] [CrossRef]
- Khellouk, R.; Barakat, A.; Boudhar, A.; Hadria, R.; Lionboui, H.; El Jazouli, A.; Rais, J.; El Baghdadi, M.; Benabdelouahab, T. Spatiotemporal monitoring of surface soil moisture using optical remote sensing data: A case study in a semi-arid area. J. Spat. Sci. 2020, 65, 481–499. [Google Scholar] [CrossRef]
- Moreira, L.C.J.; Teixeira, A.D.S.; Galvão, L.S. Laboratory salinization of Brazilian alluvial soils and the spectral effects of gypsum. Remote Sens. 2014, 6, 2647–2663. [Google Scholar] [CrossRef]
- Neto, O.C.D.; Teixeira, A.D.; Leao, R.A.D.; Moreira, L.C.J.; Galvao, L.S. Hyperspectral remote sensing for detecting soil salinization using ProSpecTIR-VS aerial imagery and sensor simulation. Remote Sens. 2017, 9, 42. [Google Scholar] [CrossRef]
- Yu, H.; Liu, M.; Du, B.; Wang, Z.; Hu, L.; Zhang, B. Mapping soil salinity/sodicity by using Landsat OLI imagery and PLSR algorithm over semiarid west Jilin Province, China. Sensors 2018, 18, 1048. [Google Scholar] [CrossRef] [PubMed]
- Bannari, A.; El-Battay, A.; Bannari, R.; Rhinane, H. Sentinel-MSI VNIR and SWIR bands sensitivity analysis for soil salinity discrimination in an arid landscape. Remote Sens. 2018, 10, 855. [Google Scholar] [CrossRef]
- Al-Ali, Z.M.; Bannari, A.; Rhinane, H.; El-Battay, A.; Shahid, S.A.; Hameid, N. Validation and comparison of physical models for soil salinity mapping over an arid landscape using spectral reflectance measurements and Landsat-OLI data. Remote Sens. 2021, 13, 494. [Google Scholar] [CrossRef]
- Nasab, F.Q.; Rahnama, M.B. Developing restoration strategies in Jazmurian wetland by remote sensing. Int. J. Environ. Sci. Technol. 2020, 17, 2767–2782. [Google Scholar] [CrossRef]
- Meng, L.; Zhou, S.; Zhang, H.; Bi, X. Estimating soil salinity in different landscapes of the Yellow River Delta through Landsat OLI/TIRS and ETM+ Data. J. Coast. Conserv. 2016, 20, 271–279. [Google Scholar] [CrossRef]
- Chagas, C.D.; de Carvalho, W.; Bhering, S.B.; Calderano, B. Spatial prediction of soil surface texture in a semiarid region using random forest and multiple linear regressions. Catena 2016, 139, 232–240. [Google Scholar] [CrossRef]
- Silvero, N.E.; Demattê, J.A.; de Souza Vieira, J.; de Oliveira Mello, F.A.; Amorim, M.T.A.; Poppiel, R.R.; de Sousa Mendes, W.; Bonfatti, B.R. Soil property maps with satellite images at multiple scales and its impact on management and classification. Geoderma 2021, 397, 115089. [Google Scholar] [CrossRef]
- Abuzaid, A.S.; Mazrou, Y.S.A.; El Baroudy, A.A.; Ding, Z.; Shokr, M.S. Multi-Indicator and geospatial based approaches for assessing variation of land quality in arid agroecosystems. Sustainability 2022, 14, 5840. [Google Scholar] [CrossRef]
Disclaimer/Publisher’s Note: The statements, opinions and data contained in all publications are solely those of the individual author(s) and contributor(s) and not of MDPI and/or the editor(s). MDPI and/or the editor(s) disclaim responsibility for any injury to people or property resulting from any ideas, methods, instructions or products referred to in the content. |
© 2023 by the authors. Licensee MDPI, Basel, Switzerland. This article is an open access article distributed under the terms and conditions of the Creative Commons Attribution (CC BY) license (https://creativecommons.org/licenses/by/4.0/).