Article

A Monitoring Method for Corporate Environmental Performance Based on Data Fusion in China under the Double Carbon Target

1
School of Ecology and Environment, Nanjing Forestry University, Nanjing 210037, China
2
Co-Innovation Center of the Sustainable Forestry in Southern China, Nanjing 210037, China
3
School of Business, Central South University, Changsha 410017, China
4
Artificial Intelligence Innovation Center, Central South University, Changsha 410017, China
5
School of Art, Hunan Normal University, Changsha 410008, China
*
Author to whom correspondence should be addressed.
Sustainability 2023, 15(12), 9391; https://doi.org/10.3390/su15129391
Submission received: 24 April 2023 / Revised: 4 June 2023 / Accepted: 8 June 2023 / Published: 11 June 2023

Abstract

:
The production and operation of corporates have a significant impact on the environment, and it is crucial for corporates to operate in an environmentally friendly manner, especially in the context of the China double carbon target. Corporate environmental performance refers to the degree of impact on the environment and the degree of contribution to environmental protection by corporates in their business activities. Our study conducted an assessment and early warning system for corporate environmental performance by monitoring seven typical corporate environmental performance variables, including the green asset ratio (Gra), the proportion of environmentally friendly products (Pefp), and cash flow for environmental protection to total assets ratio (ECF), of 2718 non-financial listed corporates in China’s A-share market. The dataset comprised empirical data from the CSMAR database and multi-scale measurements collected by us. Among data-driven monitoring methods, deep learning is widely applied due to its powerful automatic feature extraction abilities. However, multi-time scale data is often encountered in industrial ecology-related data, as the different underlying physical quantities of various data result in inconsistent sampling rates. Multi-time scale data are incomplete and asymmetrical, making it difficult for traditional models to use directly for corporate ecological monitoring. In this article, an improved CNN-LSTM monitoring model based on data fusion is proposed to address this issue. This method employs unified vectorization processing to transform incomplete multi-time scale data into uniform complete data. An end-to-end diagnostic model is constructed to simultaneously optimize feature extraction and monitoring. In a multi-time scale corporate monitoring model, CNN can mine hidden features of data, while LSTM can further capture the time dependence of underlying time series. Compared to manual feature extraction that relies on prior knowledge, the proposed model can learn more effective data features. The effectiveness of the method has been demonstrated through empirical data experiments, which is beneficial for corporates in the context of double carbon emissions, providing a method for regulating corporate ecological indicators.

1. Introduction

The development of corporates is essential for the national economy. Since the 21st century, the rapid advancement of emerging technologies such as computers, the internet, new materials, and testing technologies has propelled the world’s corporate system to new heights [1,2]. The concept of “corporate environmental performance” measures the extent to which a corporation is successful in managing its environmental impacts and achieving its environmental goals. This includes reducing carbon emissions and other negative externalities associated with global warming, which has become an increasingly pressing issue in recent years. Companies have a critical role to play in reducing carbon emissions and promoting sustainability practices. In recent years, the international community has placed greater attention on environmental sustainability [3,4], and more companies have incorporated corporate environmental performance (CEP) strategies into their long-term development strategy management [5,6]. In the context of the China double carbon target, “corporate environmental performance” is a crucial evaluation indicator for corporate development. Failure to meet the standards can result in the risk of production reduction or even shut down for corrective action [7]. Therefore, quantitatively determining corporate environmental performance remains a crucial issue in ecology, economics, and sustainability development disciplines. Research on corporate environmental performance is generally carried out from four directions: economics, ecology, sociology, and systematics [8]. Currently, the most commonly used methods for research are ecological footprint, emergy method, and entropy method [9]. This article monitors key corporate environmental performance indicators of the industry using artificial intelligence methods, with guidance on energy conservation and carbon reduction. By extracting factors related to the ecological environment from corporate production data, and monitoring green production behaviors, the article achieves the green and healthy development of industrial systems in the context of China’s double carbon scenario.
Learning-based methods are widely used for data monitoring and are emerging as a method for monitoring corporate ecological environment indicators [10,11,12,13]. This method generally consists of three steps: data feature extraction, monitoring model training, and online monitoring. Extracting data features relies on prior knowledge and is based on specific systems, making it difficult to optimize jointly with monitoring models [14]. Some scholars have introduced deep learning to address these issues. The deep learning method adaptively integrates feature learning and system monitoring into neural networks, which can automatically learn data features and avoid the shortcomings of manual feature extraction [15]. Deep learning provides useful methods for processing and analyzing corporate ecological indicator data in modern manufacturing. For example, Ma et al. [16] proposed a deep learning-based marine oil spill monitoring method that evaluates coastal ecological risks by considering oil spill risk and environmental vulnerability information. This helps to respond to marine accidents and provides a new perspective for ecological risk assessment of coastal ecosystems. Similarly, Glaviano et al. [17] independently designed multimodal artificial intelligence monitoring methods to respond in real-time to signals in the marine environment, improving the ability of coastal ecological monitoring and reducing the cost of large-scale monitoring. Therefore, adopting deep learning methods to monitor and alert corporations’ ecological data can regulate their production and operation corporate environmental performance behaviors and be an effective approach to supervise the implementation of the double carbon strategies and achieve low-carbon development.
Most traditional system monitoring methods are based on the assumption of data completeness, assuming that different variables have the same sampling rate and that data exists at each sampling point [18,19]. However, the corporate environmental performance data collected from corporates have different indicator units, inconsistent sampling rates, and varying distributions of data characteristics. Variables related to economic benefits, such as pollutant emissions, and product chemical composition, require targeted on-site collection, and decision-making by professional personnel [20]. Therefore, the sampling rates of these variables are often at the minute, hour, or daily level [20], creating what is called multi-time-scale data or multi-sampling-rate data. Multi-time-scale data is characterized by incomplete data and asymmetric information [21]. Due to the inconsistent sampling rates in multi-time-scale data, low-time-scale variables may have missing data at some sampling points of high-time-scale variables. Furthermore, low sampling-rate variables are more important in the ecological monitoring of corporate systems under the China double carbon scenario, making them more valuable in research.
In order to effectively monitor corporate environmental performance, many scholars have explored different methods to process multi-time scale data. For instance, Masuda et al. [22] proposed a new multivariate statistical process control (MSPC) method based on the up-sampling method for real-time control and monitoring of difficult-to-measure variables. Feng et al. [23] used the K-nearest neighbor method to compute detection thresholds for each re-organized dataset and performed anomaly monitoring separately. Chen et al. [24] proposed a multi-time scale fault diagnosis model based on transfer learning. The multi-time scale data is divided into a complete variable subset and multiple incomplete variable subsets. Diagnostic models are then formed for each sub-dataset, and the transfer learning method is used to share knowledge between complete and incomplete variable subsets.
While these methods have contributed to the monitoring field, they often face limitations when applied to corporate environmental performance monitoring. One major challenge is the separate optimization of multi-time scale data processing and diagnostic models, which hampers the achievement of globally optimal results. Furthermore, most of these methods rely on machine learning monitoring techniques. Shallow machine learning models often have issues with extracting feature information from high-dimensional data, requiring prior knowledge for manual feature extraction. This results in model separation, which is not conducive to achieving optimal results for feature learning and monitoring.
Moreover, it is worth noting that our study draws inspiration and builds upon the insights provided by previous research. For example, the work on reducing carbon intensity in the heavy industry [25] offers valuable insights into effective strategies for environmental performance improvement. The investigation of the driving forces of distributed energy resources in China [26] provides a foundation for understanding the factors influencing the adoption of renewable energy sources. The exploration of low-carbon transition in heavy industry from a nonlinear perspective [27] contributes to our understanding of the complexities involved in achieving sustainable industrial transitions. Lastly, the examination of the role of environmental regulations in improving energy efficiency and reducing CO2 emissions in the logistics industry [28] sheds light on the impact of policy interventions on environmental performance. These studies collectively support the motivation and relevance of our research in monitoring corporate environmental performance and highlight the significance of our proposed approach.
This article proposes a multi-time scale corporate environmental performance monitoring model based on an improved CNN-LSTM network to address the above issues. Figure 1 illustrates the structure of the corporate environmental performance monitoring method proposed in this article. Our approach fills a gap in the current literature by addressing the challenges associated with multi-time-scale data. Through unified vectorization processing, we transform incomplete and asymmetrical multi-time-scale data into uniform and complete data, enabling seamless integration in our monitoring model. Furthermore, our proposed model extends existing methods by integrating the strengths of CNN and LSTM networks. The CNN component enables the extraction of hidden features from the original sensor signals, while the LSTM component captures the time dependence of underlying time series data. By combining these two networks, our model achieves enhanced feature extraction and temporal modeling, leading to more accurate and comprehensive monitoring of corporate environmental performance. Traditionally, corporate data analysis has predominantly focused on financial and operational aspects, while monitoring indicators have primarily targeted environmental aspects. However, in order to gain a comprehensive understanding of corporate environmental performance, it is essential to bridge the gap between these two domains. In this study, we introduce a novel approach that combines empirical data with multi-scale measurement data, thereby extending the existing literature and addressing a significant research gap. Overall, the innovation of this model is as follows:
(1)
The proposed CNN-LSTM model uniformly vectorizes and fuses the multi-time scale corporate environmental performance data at the data level to avoid additional resampling.
(2)
By constructing an end-to-end integrated monitoring model, this proposed method can achieve the simultaneous optimization of feature extraction and monitoring of corporate environmental performance indicators. Additionally, the utilization of deep networks allows for automatic feature learning, eliminating the need for manual feature extraction.
(3)
This article innovatively combines empirical data from listed companies with multi-scale measurement data to monitor corporate environmental performance indicators. The study bridges the gap between corporate data and monitoring indicators and provides an efficient online method for ecological monitoring of corporate environmental performance.
This article is structured as follows: firstly, we introduce the principles of convolutional neural networks and short-term memory networks. Based on this, we introduce the proposed multi-scale data monitoring model for corporate environmental performance using an improved CNN-LSTM network. We explain the application process and principles of the model in detail. Lastly, we analyze the feasibility of the model in monitoring corporate environmental performance indicators under the China double carbon scenario through experimental cases on two datasets.

2. Preliminaries

2.1. Convolutional Neural Networks

The convolutional neural network (CNN) is a type of neural network that handles local and global correlations by using multiple filters to extract data features. CNN can maintain translation, scaling, and distortion invariance while preserving initial features, making it widely used in image recognition applications. Inspired by the structure of the visual system and originally used for handwritten character recognition, CNN’s success in AlexNet [29] has made it the dominant method for detection and recognition tasks. It is also used to solve problems in natural language processing and speech recognition. Typically, a CNN structure is composed of convolutional and pooling layers, and it often connects one or more fully connected layers at the end [30].
Convolutional layers consist of filters with weighted parameters, sometimes referred to as convolutional kernels or feature matrices in the literature. In contrast to traditional fully connected neural networks that use distinct parameters per unit, every filter in CNN has the same bias and weight. CNN employs these filters to convolve the input data and reveal the input’s hidden features. The principle behind the convolutional layer is to apply convolution to examine the input data, and the output may be expressed as:
C n = f c ( x , θ ) = t a n h x W n + b n
Among them, C n represents the output of the nth convolutional layer; n = 1,2 , 3 , N , N is the number of predefined filters; W n and b n represents the weight and bias of the nth filter, respectively, and represents convolution, and tanh is the activation function of the convolution layer, f c x , θ is a simplified representation of the effect of convolutional layers, where θ represents parameters including weights and biases in the convolutional layer.
After the processing of the convolutional layer, the features are input into the pooling layer for further processing. The pooling layer can select the most representative features within the feature map. This effectively reduces the size of features, and the number of parameters required for the model is also reduced, thereby improving computational efficiency. The maximum pooling layer is the most commonly used pooling layer and is utilized in this model. Its output is expressed as follows:
P n = f p ( x ) = m a x C n S ( C n )
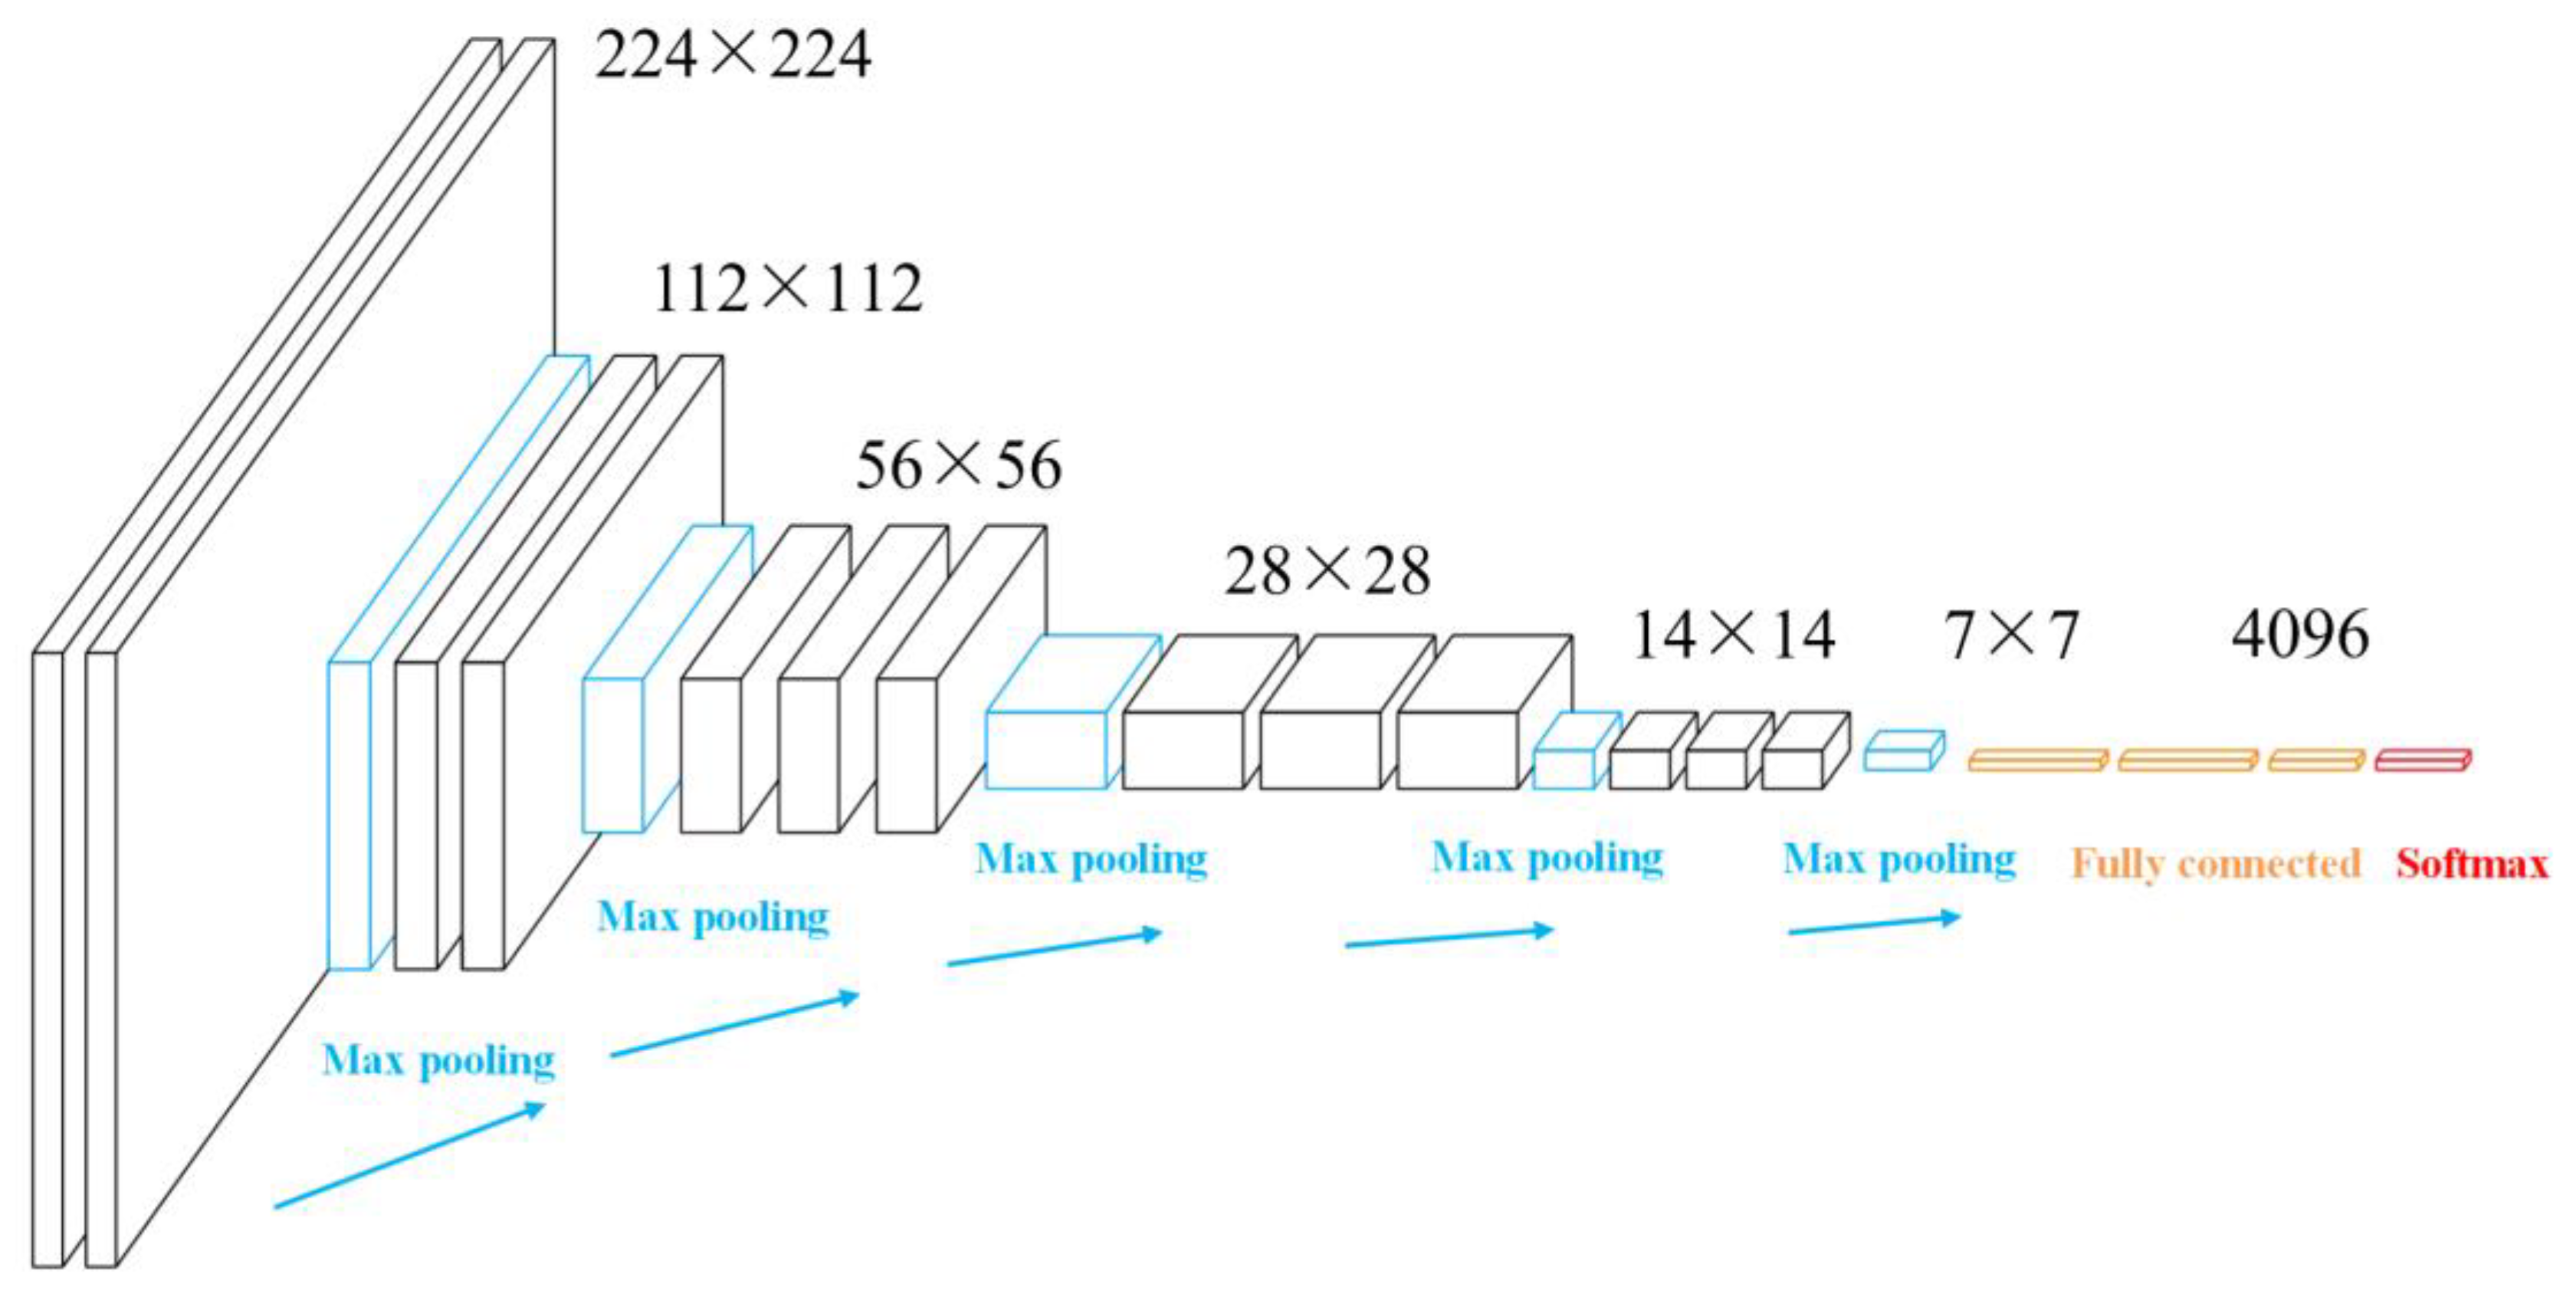
where P n represents the feature map formed after being compressed by the pooling layer, and S represents the receptive domain of the pooling layer. Finally, the fully connected layer is responsible for summarizing the features extracted by convolution operations, mapping high-dimensional inputs to low-dimensional feature outputs, which typically correspond to the learning objectives of the task. A typical CNN network is shown in Figure 2.

2.2. The Principles of Long Short-Term Memory Networks

Recurrent neural networks (RNN) were developed to model sequence data correlations [31]. Traditional neural networks have disconnected neurons in each layer, making them incapable of handling the time series data correlations. In contrast, the output of the current neuron in RNN is associated with the input of the prior neuron. Each neuron in RNN carries a hidden state that stores prior information and utilizes it to compute the output of the present neuron. Backpropagation over time trains the RNN. However, as the input time series gets longer, the network’s training speed slows down and may even stop training—this is the gradient vanishing issue. Such a problem seriously impacts RNN performance. To alleviate this issue, some scholars proposed using Long Short-Term Memory (LSTM) networks [32] and gated current units (GRU) [33] to mitigate the impact of gradient disappearance.
The LSTM network is capable of processing longer time series data and capturing long-term data dependence. Figure 3 illustrates its four main components: the cell state, forgetting gate, input gate, and output gate. Unlike RNN, where each unit status is wholly overwritten by the previous status, LSTM uses unit status to store and create information over time and employs three gating units to regulate information flow.
Forgotten Gate F t Decide whether to abandon the previous cell state. It extracts the state h t 1 of the previous moment and the input x t at the current time. Output values between 0 and 1 to the previous cell state C t 1 , 0 represents complete abandonment, and 1 represents complete retention.
F t = σ W f h t 1 , x t + b f
The input gate I t transfer the newly learned information selectively add C ~ t to the current cell state C t . First, use the t a n h activation function to create a candidate vector C ~ t . Next, calculate the value of the input gate to determine candidate information and which aspect of the value in C ~ t will be updated. Finally, change the previous state C t 1 updated to C t . Specifically, it is manifested as changing the previous state C t 1 , multiplying the forgetting gate F t to discard useless information, and add the result by multiplying the input gate I t and candidate state C ~ t to update the status.
C t ~ = t a n h W c h t 1 , x t + b c
I t = σ W i h t 1 , x t + b i
C t = f t C t 1 + I t C t ~
The output gate O t determines which parts of the cell state will be used for output, ensuring that other units are not affected by irrelevant information. Using the t a n h function to process cell state C t and then multiply it with the output gate O t to obtain the final output:
O t = σ W o h t 1 , x t + b o
h t = O t t a n h ( C t )
In Equation (8), W represents weight, b represents bias, and the subscripts f , i , and o correspond to forgetting gates, input gates, and output gates respectively, which are shared between different time steps. σ ( x ) represents the sigmoid function, which is the most commonly used activation function of the three components, and is defined as 1 / ( 1 + e x p ( x ) ) .

3. Corporate Environmental Performance Multi-Time Scale Monitoring Based on Improved CNN-LSTM

The proposed article presents an improved CNN-LSTM model based on multi-time scale data fusion for monitoring corporate environmental performance (Figure 4). The monitoring process consists of three primary steps: multi-time scale data preprocessing, offline corporate environmental performance diagnosis model establishment, and online monitoring. The first step involves collecting relevant historic data related to the corporate environmental performance and performing preprocessing operations such as sliding windows and normalization to render usable inputs for the model. The second step is to construct a more precise corporate environmental performance system monitoring model utilizing the improved CNN-LSTM, feed in the processed input data, and train the model. Finally, the online monitoring data of the corporate’s corporate environmental performance is collected, processed, and used to make real-time diagnostic decisions.

Algorithm Design

Data preprocessing is a crucial step in model training for corporate environmental performance indicators. The original data cannot be inputted into the model directly, and even if signals were continuous, applying them point by point to the model poses significant difficulties. Preprocessing is therefore required. Multiple time scale signals must first be obtained, and fixed-length segments are then randomly selected from the signals. The time domain data from different sensors in the same time segment is then spliced. As sensors have different time scales, the length of the time domain data acquired varies. Next, these segments are standardized. If x indicates the input data while mean and std represent the mean and standard deviation, respectively, the obtained input data x through the normalization process is defined as:
x = x m e a n s t d
A monitoring model was established for corporate environmental performance indicators based on multi-scale data fusion, primarily using CNN. To enhance the accuracy and robustness of the model, LSTM was connected with CNN. This was necessary due to CNN’s small acceptance domain, which could not encode key time series information that determines the extent of degradation. In contrast, LSTM’s ability to capture long-term dependence compensates for this deficiency. Furthermore, applying LSTM directly to input data could result in its recognition accuracy being undermined by input data noise. Combining the two methods would therefore offer a superior means of monitoring corporate environmental performance.
This model utilizes 1D-CNN applied to fused data at multiple time scales to account for the one-dimensional time series characteristics of corporate environmental performance data. The feature learning ability of CNN is positively associated with its structural depth, allowing more intricate features to be extracted with deeper structures. However, increased depth also means a greater number of hyperparameters and complex structures, leading to difficulty in establishing suitable models. Moreover, deeper structures require more data for training, a potential cause of overfitting. To counter this, the zero-filling method is used to prevent loss of size. The pooling layer extracts optimal features from each feature map while reducing the data dimension, the number of parameters, and the likelihood of overfitting. This article adopts maximum pooling as the pooling operation. Notably, the order of the original data is not changed during feature extraction, enabling LSTM to extract intrinsic temporal information from generated features and avoid manual data reconstruction. The role of CNN, therefore, is expressed as follows:
R = f p f c f p f c f p f c x , θ 1 , θ 2 , θ 3
where R represents the features extracted by CNN; θ 1 , θ 2 and θ 3 represents the parameter sets of three convolutional layers respectively, f p represents the role of the maximum pooling layer, and f c represents the convolutional layer.
The succeeding step involves utilizing LSTM to extract implicit temporal correlations in features. The number of units in LSTM corresponds to the feature map length, with the data input vector length per unit equaling the number of feature layers. The vector input to the LSTM cell at time step “t” is denoted as “r” sub t, and the final LSTM cell output is “H”. This output is passed through the Fully Connected (FC) and Batch Normalization (BN) layers. The batch standardization layer enables control of input distribution changes from the middle layer during the training process, minimizing internal covariate shifts, and ensuring model robustness. The batch standardization layer is advantageous as it permits the use of higher learning rates during training and aids in preventing overfitting while making the training process smoother [34]. The following approximates utilizing a fully connected layer to LSTM output:
Y = t a n h ( H W + b )
where, W and b represent the weight and offset of the full connection layer respectively, tanh() represents the tanh activation function used by the full connection layer, the output of the full connection layer is represented by Y = y 1 , y 2 , , y m , and m represents the number of samples.
The definition of batch standardization operation for output is as follows:
y l ^ = y i μ β σ β 2 + ε
z i = γ y l ^ + β
Among them, u β and σ β 2 represents the mean and variance of Y, γ and β are parameters for learning, and z i is the reconstructed data after batch standardization processing.
Lastly, a classifier is employed to determine the corporate environmental performance status categories. In the event of only two ecology models in the system, the Sigmoid classifier is utilized; the Softmax classifier is utilized when data has two or more categories.
The definition of a sigmoid classifier is:
f ( z ) = 1 1 + e x p ( z )
The definition of a Softmax classifier is:
f ( z ) = e x p ( θ T z ) k = 1 K e x p ( θ T z )
where θ is a parameter of Softmax, and K represents the number of categories of data.
The CNN-LSTM model is trained using the back-propagation algorithm and optimized via the adaptive moment estimation (Adam) random optimization algorithm [35]. The classification cross-entropy function is employed as the cost function for updating and optimizing model parameters. The dropout method is applied to prevent overfitting. The general Algorithm 1 for this model is presented below:
Algorithm1: CNN-LSTM Monitoring Model Based on Data Hierarchy Fusion
Step 1: Data preprocessing: x = x m e a n s t d
Step 2: Preliminary extraction of feature R through a CNN portion with multiple convolutional layers and maximum pooling layers through (1–2).
Step 3: Construct the temporal correlation in feature R extracted by LSTM using Formula (8):
                                   H = O t t a n h R t
Step 4: Map H using fully connected layers:
            Y = t a n h ( H W + b )
Step 5: Batch standardization processing:
            y l ^ = y i μ β σ β 2 + ε , z i = γ y l ^ + β
Step 6: Using a classifier to determine the monitoring categories of corporate environmental performance conditions:
           Sigmoid: f ( z ) = 1 1 + e x p ( z )   Softmax: f ( z ) = e x p ( θ T z ) k = 1 K e x p ( θ T z )

4. Variables

For monitoring corporate environmental performance indicators, the correct selection of variables and data is vital due to the diversity and uncertainty of corporate production. Corporate environmental performance (CEP) strategies have been increasingly incorporated in long-term development strategy management due to the global community’s growing attention to environmental sustainability [36,37]. This article monitors CEP-related indicators and divides corporates into “low carbon environment-friendly corporates” and “high carbon environment unfriendly corporates” through corporate ecological indicators. Offline data is used to train the monitoring model, and then online data is used to monitor corporate ecological indicators, providing early warning for corporates that may be detrimental to the achievement of the double carbon goal. There are potential limitations and challenges in data and indicator selection, which require careful consideration and the introduction of expert knowledge to achieve accurate and meaningful performance evaluation. Additionally, engaging various stakeholders in the data interpretation process can help address potential biases and uncertainties. The following provides a comprehensive summary of the selected variables.

4.1. Corporate Environmental Performance

In accordance with the research conducted by Zhang et al. [38], we chose to focus on a series of typical monitoring variables for corporate CEP. The selection of variables and data for corporate environmental performance monitoring in this study was based on a rigorous methodology. It involved predecessors’ study, expert consultation, evaluation of relevance and availability, and data validation. In the end, we selected seven typical monitoring variables for CEP, which include the book-to-market ratio (BM), leverage (Lev), corporation age (Age), corporation size (Size), green asset ratio (Gra), the proportion of environmentally friendly products (Pefp), and the ratio of cash flow to total assets for environmental protection (ECF). Here are the reasons for choosing these seven variables mainly from the perspective of predecessors’ study and evaluation of relevance. Corporates with a higher book-to-market ratio (BM) may face more scrutiny and attention from socially responsible investors, who prioritize and reward strong environmental performance. In addition, leverage (Lev) can significantly impact a business’s decision-making owing to the influence on external financing channels. A corporation’s age (Age) is considered an indicator of its maturity level. Mature corporates tend to have lower corporate environmental performance measurements as they focus more on pollution prevention and control [39]. Corporation size (Size) usually measured by its total assets or market capitalization, can have a significant influence on its environmental performance. Larger companies often have greater resources and capabilities to implement sustainable practices and initiatives. A higher green asset ratio (Gra) indicates a more eco-friendly approach to resource allocation, encouraging companies to focus more on environmental and social practices [40]. Moreover, a higher proportion of environmentally friendly products (Pefp) indicates corporate responsibility towards environmental issues, enabling companies to increase their expenditure on environmental protection [41]. Finally, the financial looseness of a corporation is also considered through the ratio of cash flow to total assets (ECF), as an increased amount of financial flexibility is believed to have a positive impact on CEP performance according to Vural et al. [42].

4.2. Monitoring Variables

Based on the above analysis, we finally selected book-to-market ratio (BM), leverage (Lev), corporation age (Age), corporation size (Size), green asset ratio (Gra), the proportion of environmentally friendly products (Pefp), and the ratio of cash flow to total assets for environmental protection (ECF), which are seven monitoring variables. To provide a more comprehensive understanding of each variable, Table 1 offers a detailed explanation of their meaning and equation.

5. Experiments

This experiment applies the proposed CNN-LSTM monitoring model to the corporate environmental performance data previously analyzed to monitor the condition of the business. If a corporation meets low-carbon production standards, it is deemed normal data; however, if it does not meet these standards, it is considered abnormal, and an alarm is triggered. First, we highlight the data sources, then discuss the model parameter settings and lastly present the monitoring results.

5.1. Data Resources

Data on the book-to-market ratio (BM), leverage ratio (Lev), corporation age (age), and corporation size (size) were obtained from CSMAR. We collected our own data on the green asset ratio (Gra), the proportion of environmentally friendly products (Pefp), and cash flow for environmental protection to total assets ratio (ECF).
Initially, our research subjects consisted of non-financial listed companies in China’s A-share market from 2008 to 2020, excluding companies based on the following criteria: (1) suspended or unlisted companies, (2) companies from special industries (such as *ST and annual financial training), (3) companies without significant financial data, and (4) non-polluting information companies. Subsequently, we have chosen the year 2020 as it reflects China’s long-standing competition at the bottom of the supply chain as they remain a global manufacturing center. However, this position makes it challenging to regulate upstream factor pricing and profit distribution rights, leading to a significant depletion of resources and environmental degradation. As economic agents, there is an urgent need for corporates to upgrade and adjust their environmental performance to ensure sustainable development. For the final analysis, we utilized 20,429 data from 2718 companies. Table 2 exhibits the mean, variance, and quantiles of all variables. As discussed by previously in the literature [43], the descriptive statistics of other variables are mostly consistent.

5.2. CNN-LSTM Model Parameter Setting and Discussion

Data preprocessing is first applied, which involves the collection of time series data regarding seven corporate environmental performance variables, concatenating and normalizing them to create model-appropriate data. With 80% of the data used for training and the remaining 20% for testing, the dataset contains 8200 samples for training and 1800 test samples. Next, a CNN-LSTM model was constructed based on multi-time-scale data fusion utilizing experience and experimental results to set model parameters and structure. Table 3 presents the specific model settings employed. Notably, when constructing convolutional neural networks, the number and size of convolutional kernels need to be considered, balancing feature extraction and computational complexity. Hence, a three-layer convolutional neural network with 16, 32, and 64 convolutional kernels, respectively, was established, allowing for better feature extraction as the model deepens. Additionally, larger convolutional kernels can capture low-frequency features in the data, such as periodic changes in the signal, and were hence used in the deeper convolutional layer. Although some parameter adjustments were made, the proposed approach is a relatively robust model, showing little impact on the experimental results.
In the experiment, four evaluation indicators were used to comprehensively measure the fault detection performance of different methods, namely accuracy, precision, recall, and F1 score. The formula for these indicators is as follows:
Accuracy = T P + T N T P + F P + F N + T N
Precision = T P T P + F P
Recall = T P T P + F N
F 1 - score = 2 · P r e c i s i o n · R e c a l l P r e c i s i o n + R e c a l l
where T P and T N represent the number of samples correctly classified as positive and negative cases; Similarly, F P and F N represent the number of samples incorrectly classified as positive and negative examples. Accuracy can determine the accuracy of classification. Precision and recall are two interrelated indicators. The higher the recall rate, the lower the accuracy. In this case, the model is more likely to alarm for faults, thereby increasing downtime and reducing equipment production efficiency. On the contrary, the higher the accuracy, the lower the recall rate. In this case, some faults may be missed, which may lead to serious losses and casualties. A good monitoring model should only trigger alerts when real anomalies occur, and there should be no error alerts. Therefore, the F1 score, which combines these two indicators, serves as an evaluation indicator to reflect the overall indicator. In order to avoid contingency and particularity of the results, several tests were carried out and their average values were recorded.
The length of input data has a significant impact on the recognition ability of the model. If the input length is small, the model may not achieve the expected effect. If the input length is large, more information can be obtained during the training process, but the running time and data required for training will also increase, so it is necessary to compare different input lengths. With other parameters unchanged, the experiment increases the length of the data with the lowest time scale from 10 to 70, and the input length increases from 70 to 490. Table 4 records the average accuracy and running time of the model under different input lengths.
From Table 4, it can be seen that the model has good recognition accuracy even when the input time series is short, indicating that the model has strong robustness. Considering the accuracy of classification and computational efficiency, choosing 350 as the length of input data is a better choice.

5.3. Experimental Results and Analysis

To evaluate the monitoring performance of the proposed model in the corporate environmental performance, an ablation experiment was conducted in this study. Two critical components of the proposed model, that is, the convolutional neural network and the long short-term memory network, were compared with the model through experiments. Furthermore, an experiment was conducted without batch standardization layers to verify the effectiveness of batch normalization layers. Table 5 presents the experimental results in the form of average accuracy (%) ± standard deviation (10−2). The data in the table indicates that the proposed model has the best results, achieving an accuracy of 99.41%, 99.87%, a recall rate of 97.75%, and a comprehensive classification rate of 98.80%. The diagnostic results meet the design requirements. Moreover, the model without a batch standardization layer obtained results that are second only to the proposed CNN-LSTM model. Therefore, the result illustrates that the batch standardization layer enhances the effectiveness of the model. These outstanding diagnostic results demonstrate that the proposed CNN-LSTM model meets the design requirements and is superior to other models tested. The average accuracy of CNN and LSTM is 97.09% and 97.16%, respectively, which does not significantly differ from the proposed model. Nonetheless, regarding the accuracy, recall rate, and comprehensive classification rate, the diagnostic performance of the two neural networks notably lags behind the proposed method. These comparative results indicate that combining CNN with LSTM enhances the monitoring performance of the proposed model.
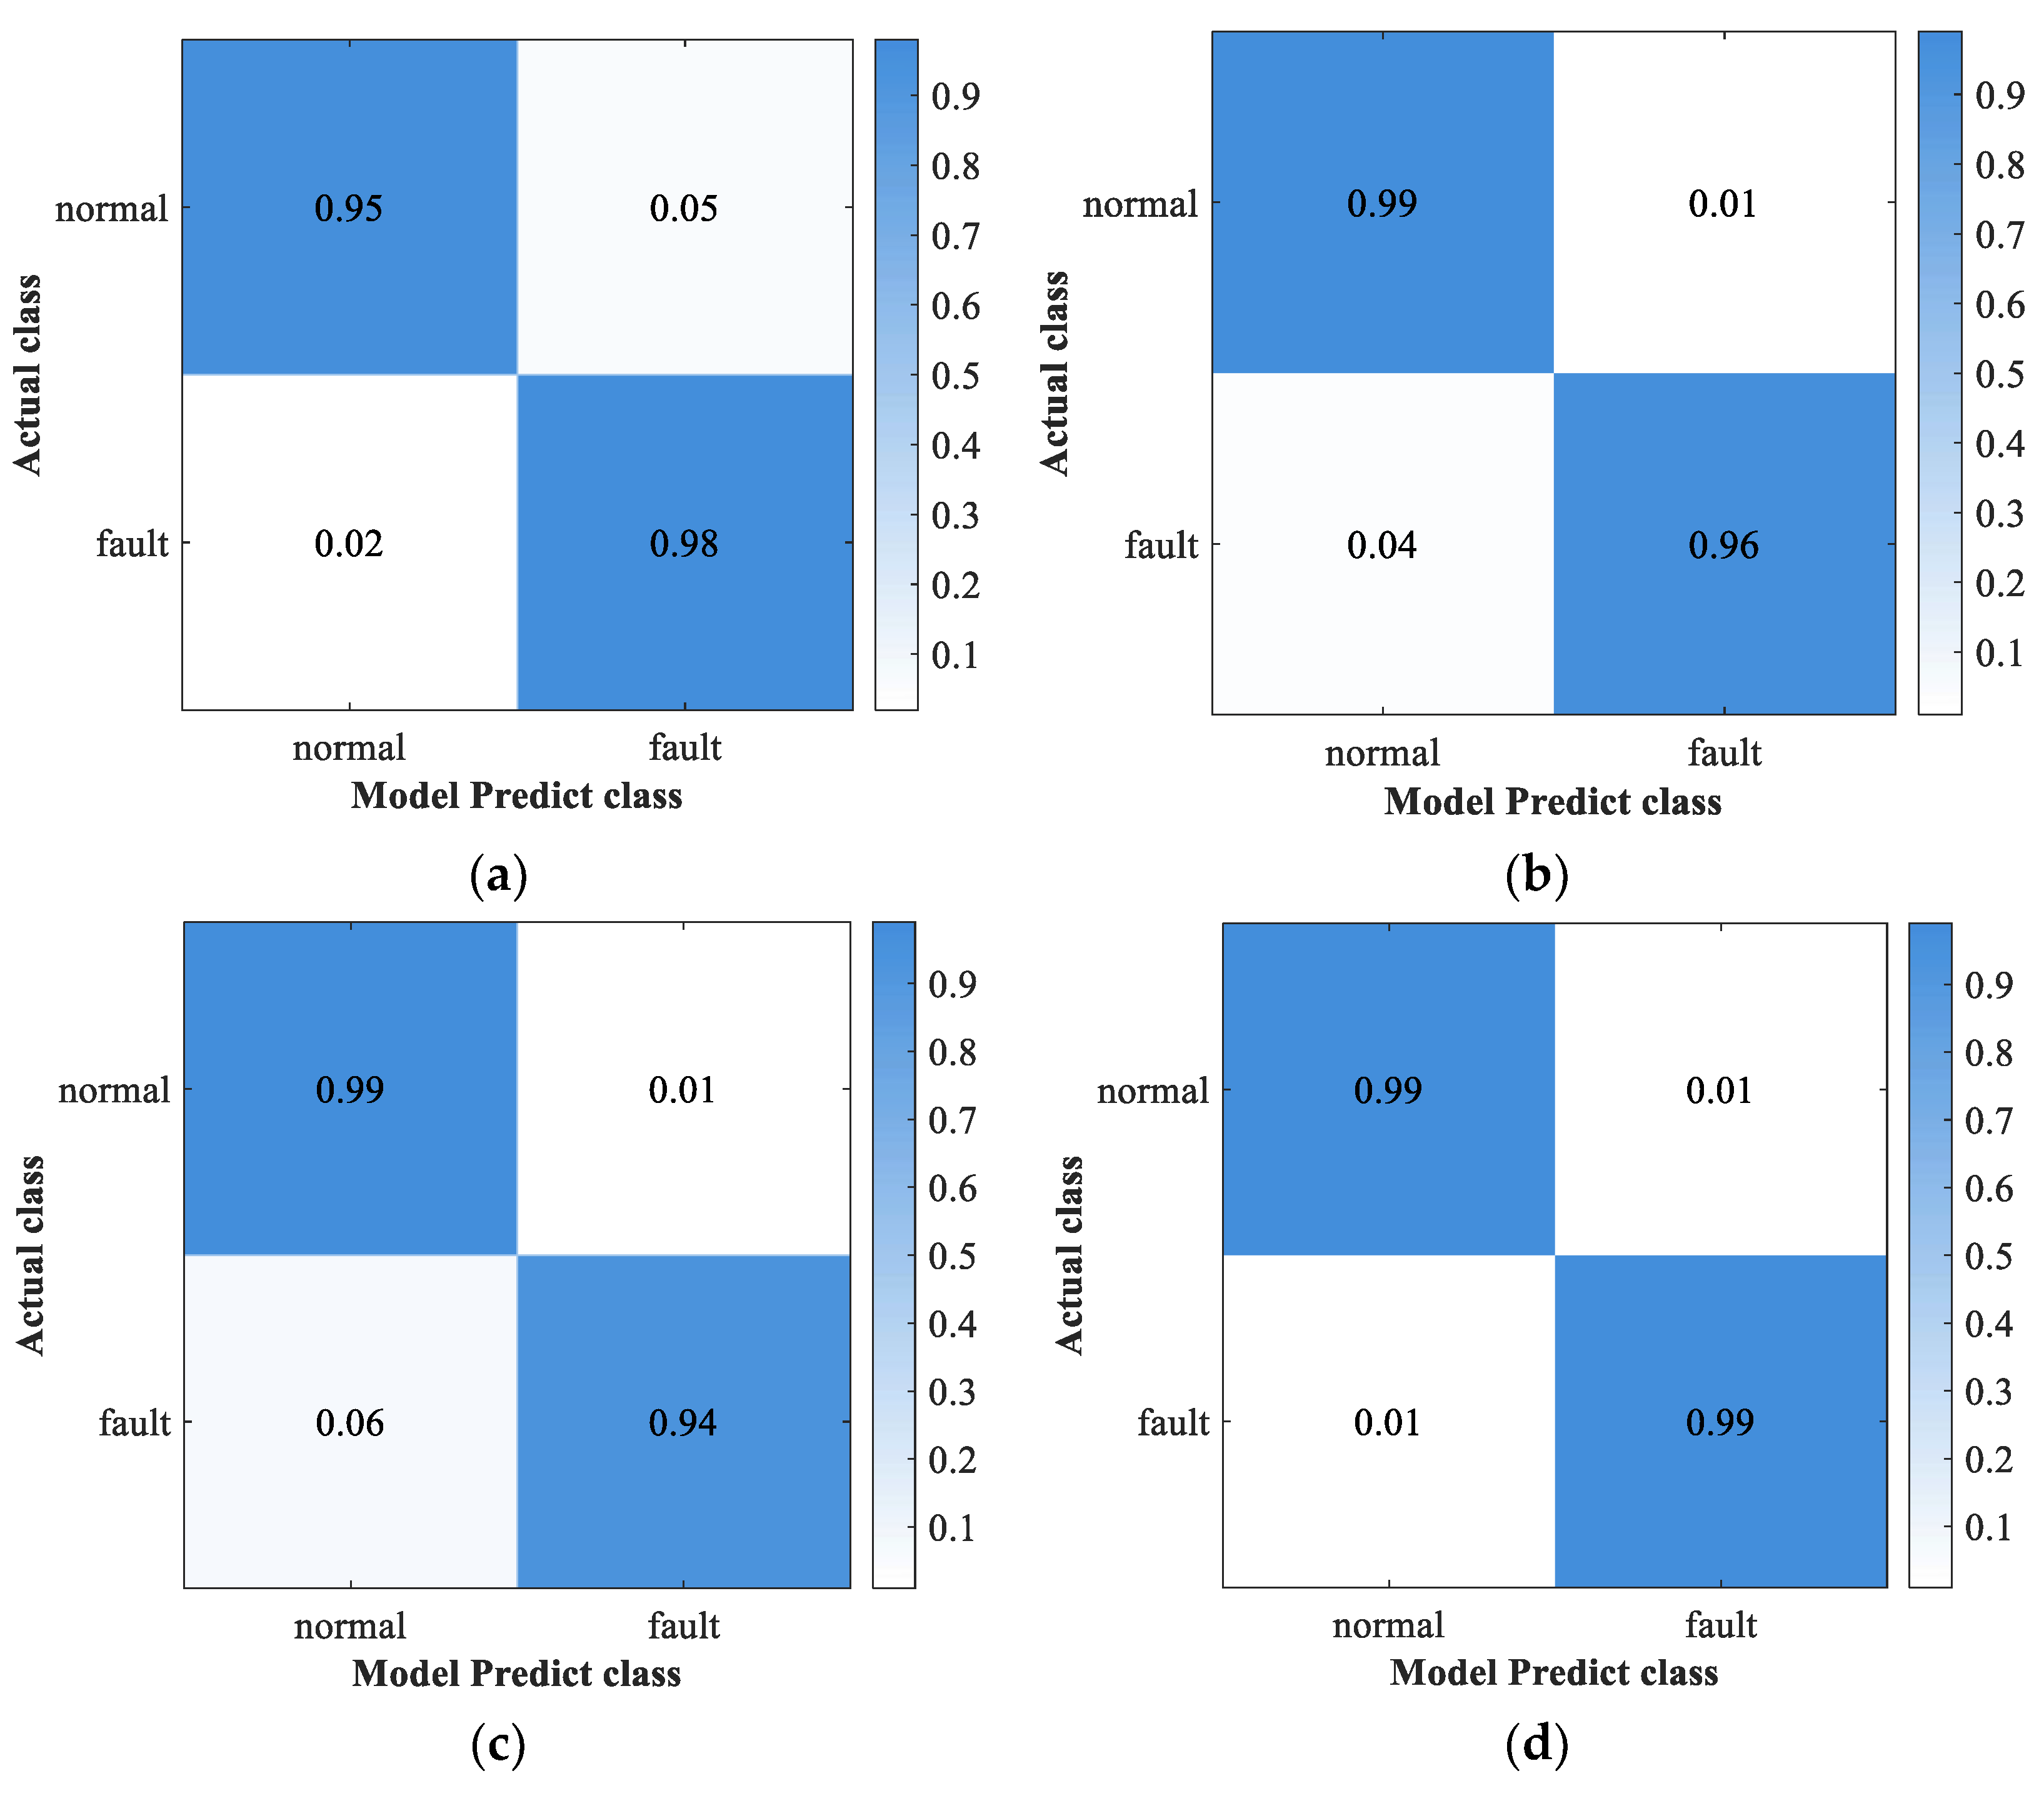
Figure 5 displays the experimental results of various models using confusion matrix images to provide a more intuitive understanding of the classification results. The vertical axis represents the true label of the sample, while the horizontal axis represents the predicted label of the sample. In this example, there are two labels, where the normal scenario indicates the “low carbon environment-friendly corporates”, and the abnormal scenario represents the “high carbon environment unfriendly corporates”. Comparison with other models indicates that the designed model has the fewest number of abnormal data mistakenly classified as normal data, signifying that the proposed model can accomplish corporate environmental performance monitoring in the corporate under the double carbon target.

6. Conclusions

This study employs a deep learning method to investigate the monitoring of the corporate environmental performance under the China double carbon target using panel data from non-financial listed companies and propose corporate environmental performance indicators for the companies. To resolve the issues of inadequate multi-time-scale data, this study proposes a data-level fusion-based multi-time-scale monitoring method. The proposed method involves three primary steps, specifically multi-time-scale signal preprocessing, offline modeling, and online monitoring. Multiple time-scale signals are preprocessed by randomly selecting fixed-length time segments from the original time-series data and conducting data preprocessing. A CNN-LSTM corporate environmental performance monitoring model is proposed based on multi-time scale data fusion. The model consists of CNN, LSTM, batch standardization layer, fully connected layer, and classifier. CNN can extract the hidden features of the original sensor signal, and LSTM further encodes the extracted features and uses the full connection layer for mapping. The batch standardization layer can improve the performance of the system and avoid overfitting to some extent. In order to verify the effectiveness of the model in corporate environmental performance monitoring, validation experiments were conducted on data from listed companies. The experimental results demonstrate that the model can adaptively combine multi-time scale data fusion and monitoring under double carbon targets, achieving simultaneous optimization. The ablation experiment has demonstrated the superiority of this model in monitoring corporate environmental performance, providing a new path for achieving double carbon in corporates. In conclusion, our study not only introduces a deep learning-based monitoring approach but also provides valuable insights into achieving double carbon emissions reduction in corporations. By effectively monitoring and evaluating corporate environmental performance, corporates can make informed decisions and implement targeted measures to enhance energy efficiency, reduce emissions, and ensure stable operations. Our proposed method serves as a practical tool for policymakers and regulatory authorities to develop more effective and targeted environmental regulations and policies.

Author Contributions

Conceptualization, Y.M., C.D., X.L. and Y.W.; Investigation, X.L.; Methodology, Y.M., C.D. and X.L.; Software, Y.M. and C.D.; Validation, C.D. and X.L.; Visualization, Y.M. and C.D.; Writing—original draft, Y.M., C.D. and X.L.; Writing—review & editing, Y.M., X.L. and Y.W. All authors have read and agreed to the published version of the manuscript.

Funding

Jiangsu Science and Technology Project (BE2022306) and Jiangsu Forestry Science & Technology Innovation and Extension Project (LYKJ[2022]02).

Institutional Review Board Statement

Not applicable.

Informed Consent Statement

Not applicable.

Data Availability Statement

The data that support the findings of this study are available from the corresponding author upon reasonable request.

Acknowledgments

The authors express appreciation to Hu S. and Liu L. for their pioneering research. Furthermore, we thank the reviewers of this work for their valuable comments and suggestions.

Conflicts of Interest

The authors declare no conflict of interest.

References

  1. Yasmeen, R.; Cui, Z.; Shah, W.; Kamal, M.; Khan, A. Exploring the role of biomass energy consumption, ecological footprint through FDI and technological innovation in B&R economies: A simultaneous equation approach. Energy 2022, 2, 244. [Google Scholar]
  2. Lu, H.; Diaz, D.; Czarnecki, N.; Zhu, C.; Kim, W. Machine learning-aided engineering of hydrolases for PET depolymerization. Nature 2022, 4, 604. [Google Scholar] [CrossRef]
  3. Huang, L.; Lei, Z. How Environmental Regulation Affect Corporate Green Investment: Evidence from China. J. Clean. Prod. 2021, 279, 123560. [Google Scholar] [CrossRef]
  4. Carpentier, C.; Suret, J.-M. Stock market and deterrence effect: A mid-run analysis of major environmental and non-environmental accidents. J. Environ. Econ. Manag. 2015, 71, 1–18. [Google Scholar] [CrossRef]
  5. Kim, O.S. Does Political Uncertainty Increase External Financing Costs? Measuring the Electoral Premium in Syndicated Lending. J. Financ. Quant. Anal. 2019, 54, 2141–2178. [Google Scholar] [CrossRef]
  6. Simmou, W.; Govindan, K.; Sameer, I.; Hussainey, K.; Simmou, S. Doing good to be green and live clean!—Linking corporate social responsibility strategy, green innovation, and environmental performance: Evidence from Maldivian and Moroccan small and medium-sized enterprises. J. Clean. Prod. 2023, 384, 135265. [Google Scholar] [CrossRef]
  7. Wu, J.; Li, X.; Jin, R. The response of the industrial system to the interrelationship approaching to carbon neutrality of carbon sources and sinks from carbon metabolism: Coal chemical case study. Energy 2022, 15, 261. [Google Scholar] [CrossRef]
  8. Han, M.; Chen, W. Determinants of eco-innovation adoption of small and medium enterprises: An empirical analysis in Myanmar. Technol. Forecast. Soc. Change 2021, 9, 173. [Google Scholar] [CrossRef]
  9. Li, C.; Firdousi, S.; Afzal, A. China’s Jinshan Yinshan sustainability evolutionary game equilibrium research under government and enterprises resource constraint dilemma. Environ. Sci. Pollut. Res. 2022, 27, 29. [Google Scholar] [CrossRef]
  10. Zhang, K.; The, J.; Xie, G.; Yu, H. Multi-step ahead forecasting of regional air quality using spatial-temporal deep neural networks: A case study of Huaihai Economic Zone. J. Clean. Prod. 2020, 11, 277. [Google Scholar] [CrossRef]
  11. Masmoudi, S.; Elghazel, H.; Taieb, D.; Yazar, O.; Kallel, A. A machine-learning framework for predicting multiple air pollutants’ concentrations via multi-target regression and feature selection. Sci. Total Environ. 2020, 5, 715. [Google Scholar] [CrossRef]
  12. Ban, M.; Lee, D.; Shin, S.; Kim, K.; Kim, S. Identifying the acute toxicity of contaminated sediments using machine learning models. Environ. Pollut. 2022, 9, 312. [Google Scholar] [CrossRef]
  13. Lin, N.; Jiang, R.; Li, G.; Yang, Q.; Li, D.; Yang, X. Estimating the heavy metal contents in farmland soil from hyperspectral images based on Stacked AdaBoost ensemble learning. Ecol. Indic. 2022, 8, 143. [Google Scholar] [CrossRef]
  14. Luo, Y.; Li, Y.; Sharma, P.; Shou, W.; Wu, K. Learning human-environment interactions using conformal tactile textiles. Nat. Electron. 2021, 4, 193. [Google Scholar] [CrossRef]
  15. Chen, H.; Chen, A.; Xu, L.; Xie, H.; Qiao, H. A deep learning CNN architecture applied in smart near-infrared analysis of water pollution for agricultural irrigation resources. Agric. Water Manag. 2020, 240, 106303. [Google Scholar] [CrossRef]
  16. Ma, X.; Xu, J.; Pan, J.; Yang, J.; Wu, P.; Meng, X. Detection of marine oil spills from radar satellite images for the coastal risk assessment. J. Environ. Manag. 2022, 325, 116637. [Google Scholar] [CrossRef]
  17. Glaviano, F.; Esposito, R.; Cosmo, A.D.; Esposito, F.; Gerevini, L.; Ria, A.; Molinara, M.; Bruschi, P.; Costantini, M.; Zupo, V. Management and Sustainable Exploitation of Marine Environments through Smart Monitoring and Automation. J. Mar. Sci. Eng. 2022, 10, 297. [Google Scholar] [CrossRef]
  18. Geng, H.; Liang, Y.; Yang, F. Model-reduced fault detection for multi-rate sensor fusion with unknown inputs. Inf. Fusion 2017, 33, 14. [Google Scholar] [CrossRef]
  19. Chen, Z.; Deng, S.; Chen, X. Deep neural networks-based rolling bearing fault diagnosis. Microelectron. Reliab. 2017, 75, 327–333. [Google Scholar] [CrossRef]
  20. Wu, D.; Jiang, Z.; Xie, X. LSTM Learning With Bayesian and Gaussian Processing for Anomaly Detection in Industrial IoT. IEEE Trans. Ind. Inform. 2020, 16, 5244. [Google Scholar] [CrossRef] [Green Version]
  21. Zhang, Y.; Chen, Y.; Wang, J. Unsupervised Deep Anomaly Detection for Multi-Sensor Time-Series Signals. IEEE Trans. Knowl. Data Eng. 2021, 1, 1. [Google Scholar] [CrossRef]
  22. Masuda, Y.; Kaneko, H.; Funatsu, K. Multivariate Statistical Process Control Method Including Soft Sensors for Both Early and Accurate Fault Detection. Ind. Eng. Chem. Res. 2014, 53, 8553. [Google Scholar] [CrossRef]
  23. Feng, J.; Li, K. MRS-kNN fault detection method for multirate sampling process based variable grouping threshold. J. Process Control 2020, 85, 149–158. [Google Scholar] [CrossRef]
  24. Chen, D.; Yang, S.; Zhou, F. Transfer Learning Based Fault Diagnosis with Missing Data Due to Multi-Rate Sampling. Sensors 2019, 19, 1826. [Google Scholar] [CrossRef] [Green Version]
  25. Xu, R.J.; Xu, B. Exploring the effective way of reducing carbon intensity in the heavy industry using a semiparametric econometric approach. Energy 2022, 243, 123066. [Google Scholar] [CrossRef]
  26. Xu, B.; Luo, Y.; Xu, R.; Chen, J. Exploring the driving forces of distributed energy resources in China: Using a semiparametric regression model. Energy 2021, 236, 121452. [Google Scholar] [CrossRef]
  27. Xu, B.; Chen, J.B. How to achieve a low-carbon transition in the heavy industry? A nonlinear perspective. Renew. Sustain. Energy Rev. 2021, 140, 110708. [Google Scholar] [CrossRef]
  28. Xu, B.; Xu, R.J. Assessing the role of environmental regulations in improving energy efficiency and reducing CO2 emissions: Evidence from the logistics industry. Environ. Impact Assess. Rev. 2022, 96, 106831. [Google Scholar] [CrossRef]
  29. Krizhevsky, A.; Sutskever, I.; Hinton, G. ImageNet classification with deep convolutional neural networks. Commun. ACM 2017, 60, 84–90. [Google Scholar] [CrossRef] [Green Version]
  30. Girshick, R.; Donahue, J.; Darrell, T. Rich Feature Hierarchies for Accurate Object Detection and Semantic Segmentation. In Proceedings of the IEEE Conference on Computer Vision and Pattern Recognition, Columbus, OH, USA, 23–28 June 2014; pp. 580–587. [Google Scholar]
  31. Mikolov, T.; Karafiat, M.; Burget, L. Recurrent Neural Network Based Language Model. In Proceedings of the 11th Annual Conference of the International Speech Communication Association, Makuhari, Japan, 26–30 September 2010; p. 4. [Google Scholar]
  32. Sun, H.; Wang, A.; He, S. Temporal and Spatial Analysis of Alzheimer’s Disease Based on an Improved Convolutional Neural Network and a Resting-State FMRI Brain Functional Network. Int. J. Environ. Res. Public Health 2022, 19, 4508. [Google Scholar] [CrossRef] [PubMed]
  33. Liu, Y.; Pei, A.; Wang, F.; Yang, Y. An attention-based category-aware GRU model for the next POI recommendation. Int. J. Intell. Syst. 2021, 7, 36. [Google Scholar] [CrossRef]
  34. Wang, J.; Fu, P.; Zhang, L. Multilevel Information Fusion for Induction Motor Fault Diagnosis. IEEE/ASME Trans. Mechatron. 2019, 24, 2139. [Google Scholar] [CrossRef]
  35. Nhu, V.; Hoang, N.; Nguyen, H.; Ngo, P. Effectiveness assessment of Keras based deep learning with different robust optimization algorithms for shallow landslide susceptibility mapping at tropical area. Catena 2020, 5, 188. [Google Scholar] [CrossRef]
  36. Casalin, F.; Pang, G.; Maioli, S.; Cao, T. Inventories and the concentration of suppliers and customers: Evidence from the Chinese manufacturing sector. Int. J. Prod. Econ. 2017, 193, 148–159. [Google Scholar] [CrossRef] [Green Version]
  37. Cai, L.; Cui, J.; Jo, H. Corporate Environmental Responsibility and Firm Risk. J. Bus. Ethics 2016, 139, 563–594. [Google Scholar] [CrossRef]
  38. Zhang, C.; Liu, Q.; Ge, G.; Hao, Y.; Hao, H. The impact of government intervention on corporate environmental performance: Evidence from China’s national civilized city award. Financ. Res. Lett. 2021, 39, 101624. [Google Scholar] [CrossRef]
  39. Zhang, R.; Fu, W. Multiple large shareholders and corporate environmental performance. Financ. Res. Lett. 2023, 51, 103487. [Google Scholar] [CrossRef]
  40. Borghesi, R.; Houston, J.; Naranjo, A. Corporate socially responsible investments: CEO altruism, reputation, and shareholder interests. J. Corp. Financ. 2023, 26, 164–181. [Google Scholar] [CrossRef]
  41. Choi, J.; Contractor, F.J. Choosing an appropriate alliance governance mode: The role of institutional, cultural and geographical distance in international research & development (R&D) collaborations. J. Int. Bus. Stud. 2016, 47, 210–232. [Google Scholar]
  42. Vural-Yavas, C. Economic policy uncertainty, stakeholder engagement, and environmental, social, and governance practices: The moderating effect of competition. Corp. Soc. Responsib. Environ. Manag. 2021, 28, 82–102. [Google Scholar] [CrossRef]
  43. Tran, N.; Fu, L.; Boehe, D. How does urban air pollution affect corporate environmental performance? J. Clean. Prod. 2023, 383, 135443. [Google Scholar] [CrossRef]
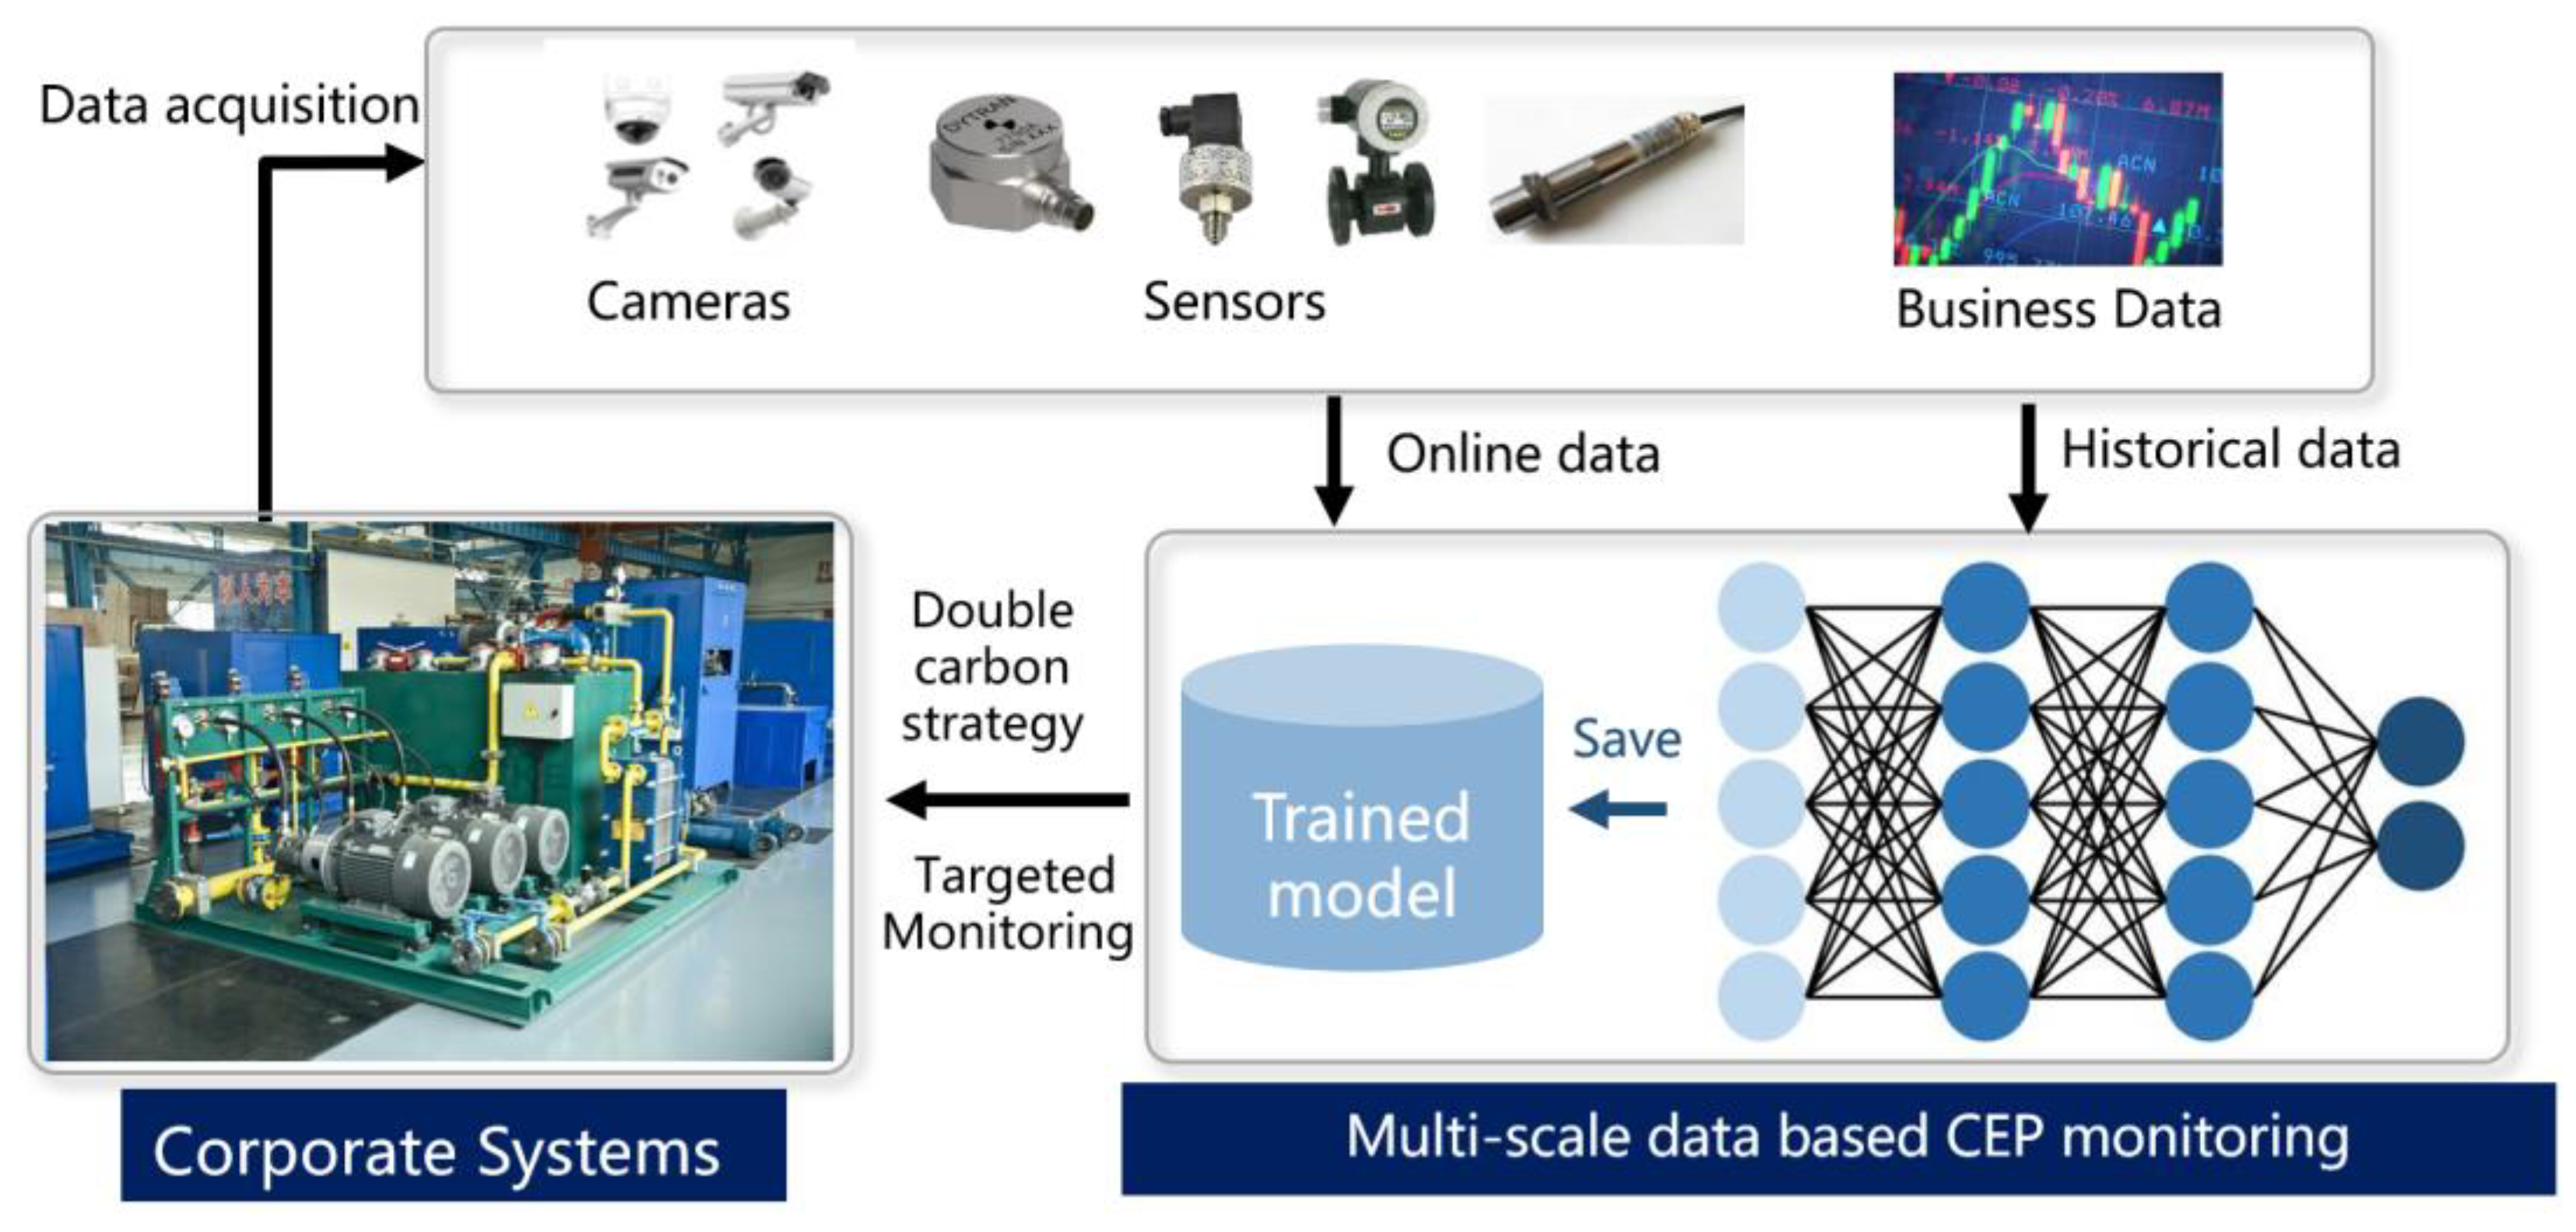
Figure 1. The corporate environmental performance monitoring method structure for corporates facing the China double carbon strategy proposed in this article. By collecting multi-timescale data of industrial systems through multiple sensors, the industry data can be input into a neural network for monitoring with a carbon-based evaluation target.
Sustainability 15 09391 g001
Figure 2. The structure of a typical CNN network.
Sustainability 15 09391 g002
Figure 3. Structure diagram of the LSTM unit.
Sustainability 15 09391 g003
Figure 4. Flow chart of multi-time scale data fusion monitoring based on improved CNN-LSTM.
Sustainability 15 09391 g004
Figure 5. Confusion matrix of different monitoring methods for the corporate environmental performance. (a) CNN; (b) LSTM; (c) the proposed model without the BN layer; (d) the proposed CNN-LSTM model.
Sustainability 15 09391 g005
Table 1. Definitions and Equations of Monitoring Variables.
VariableDefinitions and Equations
B M Book-to-market, the book value of common equity divided by the market value
Book Value of Equity/Market Value of Equity
L e v The debt-to-assets ratio
Total Debt/Total Equity
A g e Log of one plus the current year minus the year in which a firm
was listed
Current Year—Year of Incorporation
S i z e The natural logarithm of a firm’s market capitalization
ln(Market Capitalization)
G r aGreen asset ratio
Green Assets/Total Assets
P e f p The proportion of environmentally friendly products
Number of Environmentally Friendly Products/Total Number of Products
E C F The ratio of cash flow to total assets for environmental protection
Cash Flow for Environmental Protection/Total Assets
This table describes the control variables used in this paper with their definitions and equations.
Table 2. Summary Statistics of Variables.
VariableMeanSdP5P25P50P75P95
B M 0.3500.1580.1250.2340.3280.4510.645
L e v 0.4010.1990.09500.2400.3940.5520.733
A g e 2.7600.3592.0792.5652.8332.9963.258
S i z e 21.971.24120.3021.0621.7822.6624.40
G r a 0.06100.0570−0.01900.03100.05600.08800.159
P e f p 0.3560.1460.1420.2430.3400.4530.621
E C F 0.05000.0660−0.05800.01100.04800.08900.163
This table is descriptive statistics of the variables, including mean, standard deviation, and quartiles.
Table 3. Structure and parameters of CEP monitoring model.
LayerParameter
Convolutional Layer (C1)Number of filters: 16, filter size: 20
Pooling layer (P2)Pooling size: 2
Convolutional Layer (C3)Number of cores: 32, size of cores: 20
Pooling layer (P4)Pooling size: 2
Convolutional Layer (C5)Number of cores: 64, size of cores: 15
Pooling layer (P6)Pooling size: 2
LSTM NetworkNumber of nodes: 32
Fully connected layer (FC)Number of output nodes: 8, activation function: tanh
Batch standardization layer (BN)Number of output nodes: 2, classifier: Sigmaid
Output layer (Output)
Table 4. Average accuracy and running time of state recognition under different data lengths.
Data Length70140210280350420490
Accuracy (%)94.5997.0698.1597.5698.9497.1298.34
Running time (s)24.9742.1952.1370.4483.6199.90112.04
Table 5. Monitoring Results of Different Models in Corporate Environmental Performance.
ModelAccuracyPrecisionRecallF1-Score
CNN97.09 ± 0.7993.93 ± 2.7694.63 ± 3.1394.21 ± 1.61
LSTM97.16 ± 0.2793.93 ± 0.4294.75 ± 1.0994.33 ± 0.56
The Proposed CNN-LSTM99.41 ± 0.1299.87 ± 0.2597.75 ± 0.5098.80 ± 0.24
CNN-LSTM without BN99.00 ± 0.7898.76 ± 2.1797.25 ± 1.1697.99 ± 1.54
Disclaimer/Publisher’s Note: The statements, opinions and data contained in all publications are solely those of the individual author(s) and contributor(s) and not of MDPI and/or the editor(s). MDPI and/or the editor(s) disclaim responsibility for any injury to people or property resulting from any ideas, methods, instructions or products referred to in the content.