Article

Regional Water Stress Forecasting: Effects of Climate Change, Socioeconomic Development, and Irrigated Agriculture—A Texas Case Study

Department of Agricultural Sciences, Clemson University, Clemson, SC 29634, USA
*
Author to whom correspondence should be addressed.
Sustainability 2023, 15(12), 9290; https://doi.org/10.3390/su15129290
Submission received: 11 May 2023 / Revised: 5 June 2023 / Accepted: 5 June 2023 / Published: 8 June 2023
(This article belongs to the Section Sustainable Water Management)

Abstract

:
Climate change, socioeconomic development, and irrigation management are exacerbating water scarcity in many regions worldwide. However, current global-scale modeling approaches used to evaluate the impact of these factors on water resources are limited by coarse resolution and simplified representation of local socioeconomic and agricultural systems, which hinders their use for regional decision making. Here, we upgraded the irrigation water use simulation in the system dynamics and water environmental model (SyDWEM) and integrated it with the water supply stress index (WaSSI) ecosystem services model. This integrated model (SyDWEM-WaSSI) simulated local socioeconomic and agricultural systems to accurately assess future water stress associated with climate change, socioeconomic development, and agricultural management at subbasin levels. We calibrated the integrated model and applied it to assess future water stress levels in Texas from 2015 to 2050. The water stress index (WSI), defined as the ratio of water withdrawal to availability, was used to indicate different water stress levels. Our results showed that the integrated model captured changes in water demand across various sectors and the impact of climate change on water supply. Projected high water stress areas (WSI > 0.4) are expected to increase significantly by 2050, particularly in the Texas High Plains and Rolling Plains regions, where irrigation water use was projected to rise due to the impact of climate change. Metropolitan areas, including Dallas, Houston, Austin, and San Antonio, were also expected to experience increased domestic water demand, further exacerbating water stress in these areas. Our study highlights the need to incorporate socioeconomic planning into water resources management. The integrated model is a valuable tool for decisionmakers and stakeholders to evaluate the impacts of climate change, socioeconomic development, and irrigation management on water resources at the local scale.

1. Introduction

Water is a fundamental resource for human activities, including food production, energy generation, and domestic and industrial uses [1]. The global demand for freshwater has increased significantly since the 1950s, mainly due to population growth, urbanization, industrialization, and rising food and energy needs [1]. Moreover, the ongoing COVID-19 pandemic has led to changes in water consumption patterns [2,3,4]. These changes, combined with climate-change-induced alterations in precipitation patterns, increasing temperatures, and more frequent extreme hydrologic events, have further exacerbated the situation, posing challenges to the availability and management of freshwater resources [5].
To assess the severity of water scarcity, the water stress index (WSI), defined as the ratio of water withdrawal to availability, has served as a key metric both regionally [6,7] and globally [8,9,10]. A WSI higher than 0.4 indicates high water stress. Currently, over 2.3 billion people live in high water-stressed basins worldwide, and this number is expected to rise to 4.2 billion by the end of the century due to the impact of climate change alone [10]. Meanwhile, domestic and industrial water withdrawals are projected to increase by 50–80% with continued urbanization and socioeconomic development [11,12]. Irrigation water demand is also expected to rise under a warming climate [13,14,15,16], leading to increased competition for water resources among agriculture, domestic, and industrial sectors [12]. Therefore, integrating water supply and demand simulation with the considerations of factors such as climate change, socioeconomic development, and irrigation management is essential in allocating limited water resources effectively.
The integration of climate and hydrological models has been widely used to evaluate the impact of climate change on water availability [17,18,19]. Global crop models have also been integrated to improve the simulation of water demand for irrigation and assess potential adaptation strategies to mitigate the effects of water scarcity [20]. However, applying these global models to regional water management is challenging due to the resolution and accuracy required for local decision making, particularly in water demand estimation and projection. One major limitation is the lack of detailed information on crops, planting dates, and local irrigation practices, leading to inaccurate irrigation estimates. Another issue is the reliance on coarse resolution and unreliable data on water use for different sectors, which are often limited, incomplete, or outdated. Additionally, these models may not adequately account for local socioeconomic changes, leading to inaccurate predictions of domestic and industrial water uses.
To overcome the challenges associated with the inaccurate estimation of water demand and projection, we developed an integrated model that provided a more detailed simulation of local socioeconomic and agricultural systems. By integrating with existing climate and hydrological models, the integrated model allowed us to assess future water stress levels associated with climate change, socioeconomic development, and irrigation management at subbasin, basin, county, and state levels. To evaluate the effectiveness of this integrated model, we applied it to the state of Texas, United States. Texas has experienced rapid population and economic growth, exceeding that of other states. For instance, its population grew from 19.4 to 27.9 million from 1997 to 2015, with an annual growth rate of 2%, whereas the mean growth rate in the U.S. was 1% [21]. At the same time, its manufacturing gross domestic product (GDP) increased from 104 to 237 billion dollars (2015 prices), with an annual growth rate of 5%, compared to a mean rate of 0.8% in the U.S. [21]. According to a recent survey by the Texas Water Development Board, the total population is expected to increase by 35% from 2015 to 2050 [22]. Moreover, many regions in Texas are projected to become warmer and drier under a changing climate [23,24,25], indicating high water stress.
Therefore, understanding the spatial and temporal characteristics of water supply and demand and the relative contributions of different water users to water stress is crucial for long-term water resources management. In this paper, we aimed to: (1) Develop and evaluate an integrated model to simulate mid-term (2015–2050) water supply and water demand from various sectors at the county and subbasin levels, i.e., 8-digit Hydrologic Unit Codes (HUC 8), in Texas, United States; and (2) Identify the impacts of population growth, economic development, and irrigation management on local and regional water stress under a changing climate. We provide an overview of the integration of SyDWEM and WaSSI models, including the calculation of water use across different sectors in Section 2. Changes in water supply, water demand, and water stress at subbasin scales from 2015 to 2050, as well as sensitivities of population growth, economic development, and irrigation management to water stress are presented in Section 3. Section 4 discusses the policy implications, advantages, and limitations of this study and provides valuable insights for decisionmakers and future research. We summarize the key findings of this study in Section 5.

2. Methods

2.1. Integrated SyDWEM-WaSSI Model

Figure 1 illustrates the conceptual integration of the system dynamics and water environmental model (SyDWEM) and water supply stress index (WaSSI) ecosystem services model. The SyDWEM model, based on our previous studies [6,7,26], was used to simulate socioeconomic (e.g., population and GDP) changes and water demand from different sectors. It includes three modules: (1) Population/GDP module; (2) Domestic and industrial water withdrawal module; and (3) Irrigation water demand module. A simplified population/GDP module was used here without consideration for the impact of labor force migration on GDP growth. An updated irrigation module was used and detailed in Section 2.2.2. The WaSSI model [24] was employed to calculate monthly or yearly water availability (i.e., surface/groundwater water supply and return flow) at HUC 8 levels based on spatially explicit 2001 MODIS land cover and predictions from several global circulation models (GCMs). The major outputs of the WaSSI model include potential evapotranspiration (PET), actual evapotranspiration (ET), infiltration, soil storage, snow accumulation and melt, surface runoff, and base flow.
The two models were integrated using WSI, with values of less than 0.1, 0.1 to 0.2, 0.2 to 0.4, and greater than 0.4, indicating low, moderate, medium to high, and high stress, respectively [27]. These values indicate the extent of human interaction with sustainable water supply. High water stress (WSI > 0.4) implies significant competition between total water withdrawals and environmental water requirements. Smakhtin et al. [28] evaluated 128 major river basins and drainage regions worldwide and found that 20–50% of the mean annual river flow was required to maintain freshwater-dependent ecosystems in good conditions. In the case of Texas, the environmental water requirements were estimated to be around 40–50% of the mean annual river flow in most basins [28].
Major interactions and feedbacks between the two models include: (1) PET, precipitation, and runoff simulation from the WaSSI model were used to calculate the irrigation water use; and (2) Water withdrawals from all water use sectors were allowed to feed into water supply models as return flow. The portions of each return flow were validated in the WaSSI model and considered constant for future projections. Together, the integrated SyDWEM-WaSSI models provided a comprehensive framework for evaluating water supply and demand dynamics and their interactions with socioeconomic and irrigation management at various spatial and temporal scales.
Understanding the spatial and temporal scales for each module is important for model integration. For spatial scales, water withdrawals from domestic and industrial sectors were calculated at the county level first and then distributed at the subbasin level, using land use data. Irrigation water demand was calculated at a resolution of 30 × 30 m and summarized at both county and subbasin scales. For temporal scales, population and GDP were simulated annually, and irrigation water demand was simulated at a monthly time step. Outputs from the WaSSI model were simulated either annually or monthly, and WSI was reported at an annual step. The simulation period of the integrated model is from 2015 to 2050. Here, water withdrawals, or water use/water demand, used in this study are defined as the total amount of water removed from surface water or groundwater sources. Water consumption refers to the permanent loss of water from surface water or groundwater sources. The calculation of water use from each sector is detailed in Section 2.2.

2.2. Water Use from Different Sectors

The water use considered in this study included domestic, industrial (manufacturing), irrigation, livestock, mining, and power generation. The top three water users in Texas in 2020 were irrigation, domestic, and industrial, accounting for 55%, 31%, and 7% of the total water use, respectively [29]. Detailed sectoral water use is provided in Figure S1. As livestock, mining, and power generation (water consumption) accounted for a relatively small portion of the total water use; changes in water use for these sectors were not directly simulated. Instead, historical and projected data from the Texas Water Development Board were used for these sectors [22].

2.2.1. Domestic and Industrial Water Use

Domestic water use was estimated based on population and per capita water use, as shown in Equation (1).
W D t i D o m = P o p t i × W U P C i
where W D t i D o m is the domestic water use in ith county in year t (m3); P o p t i is the population in ith county in year t, and W U P C i represents per capita water use in ith county (m3 per capita). The future population was estimated by projecting birth rates, death rates, and migration rates. A 0.5 migration scenario was adopted for long-term analysis, assuming migration rates at 50% of those between 2005 and 2015 [22]. In order to reduce uncertainty in the input data, the long-term average (1997–2014) value of per capita water use was calculated for each county and assumed to remain constant for future estimations.
Industrial water use was estimated using manufacturing GDP and water use intensity (i.e., water use per GDP, m3 per dollar), as shown in Equation (2).
W D t i I n d = G D P t i × W U P G t
where W D t i I n d and G D P t i are the industrial water use (m3) and GDP (dollars) in the ith county in year t, respectively, and W U P G t represents industrial water use per unit GDP (m3 per dollar) in year t.
A time-evolving water use intensity was used to account for long-term changes due to technological improvements, as shown in Equation (3).
W U P G t = W U P G o × e x p ( α × T )
where W U P G o represents water withdrawal per unit GDP (m3 per dollar) in the initial year (1997); α is the exponential rate of change in industrial water use intensity, and T is the number of years since the initial year. W U P G o and α were calibrated by performing a regression analysis of historical data from 1997 to 2014. The equation obtained from this analysis was W U P G t = 0.2311 e 0.083 T , with an R2 of 0.93 (p = 0.000011).

2.2.2. Irrigation Water Use

Once the monthly PET, precipitation, and runoff were obtained from the WaSSI model simulations, grid-level irrigation water use (30 m × 30 m) was calculated based on crop coefficient, growing area, and irrigation efficiency, as shown in Equations (4) and (5).
W D t I r r = m = 1 12 j P E T m j × K C j P m + R m × A j × I × E
K C j = ( K C 1 × T 1 + K C 2 × T 2 + K C 3 × T 3 ) j / 30
where W D t I r r denotes grid-level irrigation water use in year t (m3); P E T m j is potential evapotranspiration for jth type of crop in mth month (m); K C j is the mean monthly crop coefficient for jth type of crop, which is based on the calculation of crop coefficients at three growth stages using Equation (5). K C 1 , K C 2 , a n d   K C 3 are the crop coefficient of the jth type of crop corresponding to the growth stages of T 1 , T 2 , and T 3 , respectively; P m and R m are the precipitation and runoff in mth month (m), respectively; A j is the grid area (i.e., 900 m2), I indicates whether the grid is irrigated (I = 1) or not (I = 0), and E represents the irrigation system efficiency (fraction).
Figure 2 shows the calculation of irrigation water use at the county or subbasin levels. To identify the crop types, the cropland data layer from the National Agricultural Statistics Service (NASS) were used [30], and a total of 58 cropland types were identified, including nine double cropping land types (Table S1). The major crop types are shown in Figure S2. If double cropping land was irrigated, irrigation water use was calculated twice based on crops and their growing periods. Irrigated cropland was obtained from the 2017 moderate resolution imaging spectroradiometer (MODIS) irrigated agriculture dataset for the United States (MIrAD-US), at a 250 m spatial resolution [31]. If large errors were observed in model calibration, irrigation rates at county levels were corrected by using the global dataset (about 9 km spatial resolution at the equator) of the percentage of area equipped for irrigation by the Food and Agriculture Organization (FAO) of the United Nations [32]. Irrigation water use was first calculated at the grid level and then summed to the county or the HUC 8 level.
The reported efficiencies of mid-elevation spray application (MESA), low energy precision application (LEPA), and low elevation spray application (LESA) irrigation systems in Texas ranged from 0.6 to 0.96 [33,34,35], as shown in Table S2. Due to the lack of detailed data, we assumed a constant value of 0.80 for all irrigation systems. We applied field-observed crop coefficients covering the growing seasons for major crops, including cotton, corn, and sorghum (Figure S3). For other crops, K C 1 , K C 2 , and K C 3 for each growing stage were used [36] (Table S3). The growing stages for K C 1 , K C 2 , and K C 3 were obtained from the Texas Board of Water Engineers [37], and the calculation procedure followed Singh and Su [38].

2.2.3. Model Validation

Relative error (RE) (%) was used to evaluate model performance, as shown in Equation (6).
R E % = ( X p i X m i ) X m i × 100
where X p i and X m i are the predicted and measured model variables for ith county or subbasin. The RE values closer to 0 indicate good model performance.
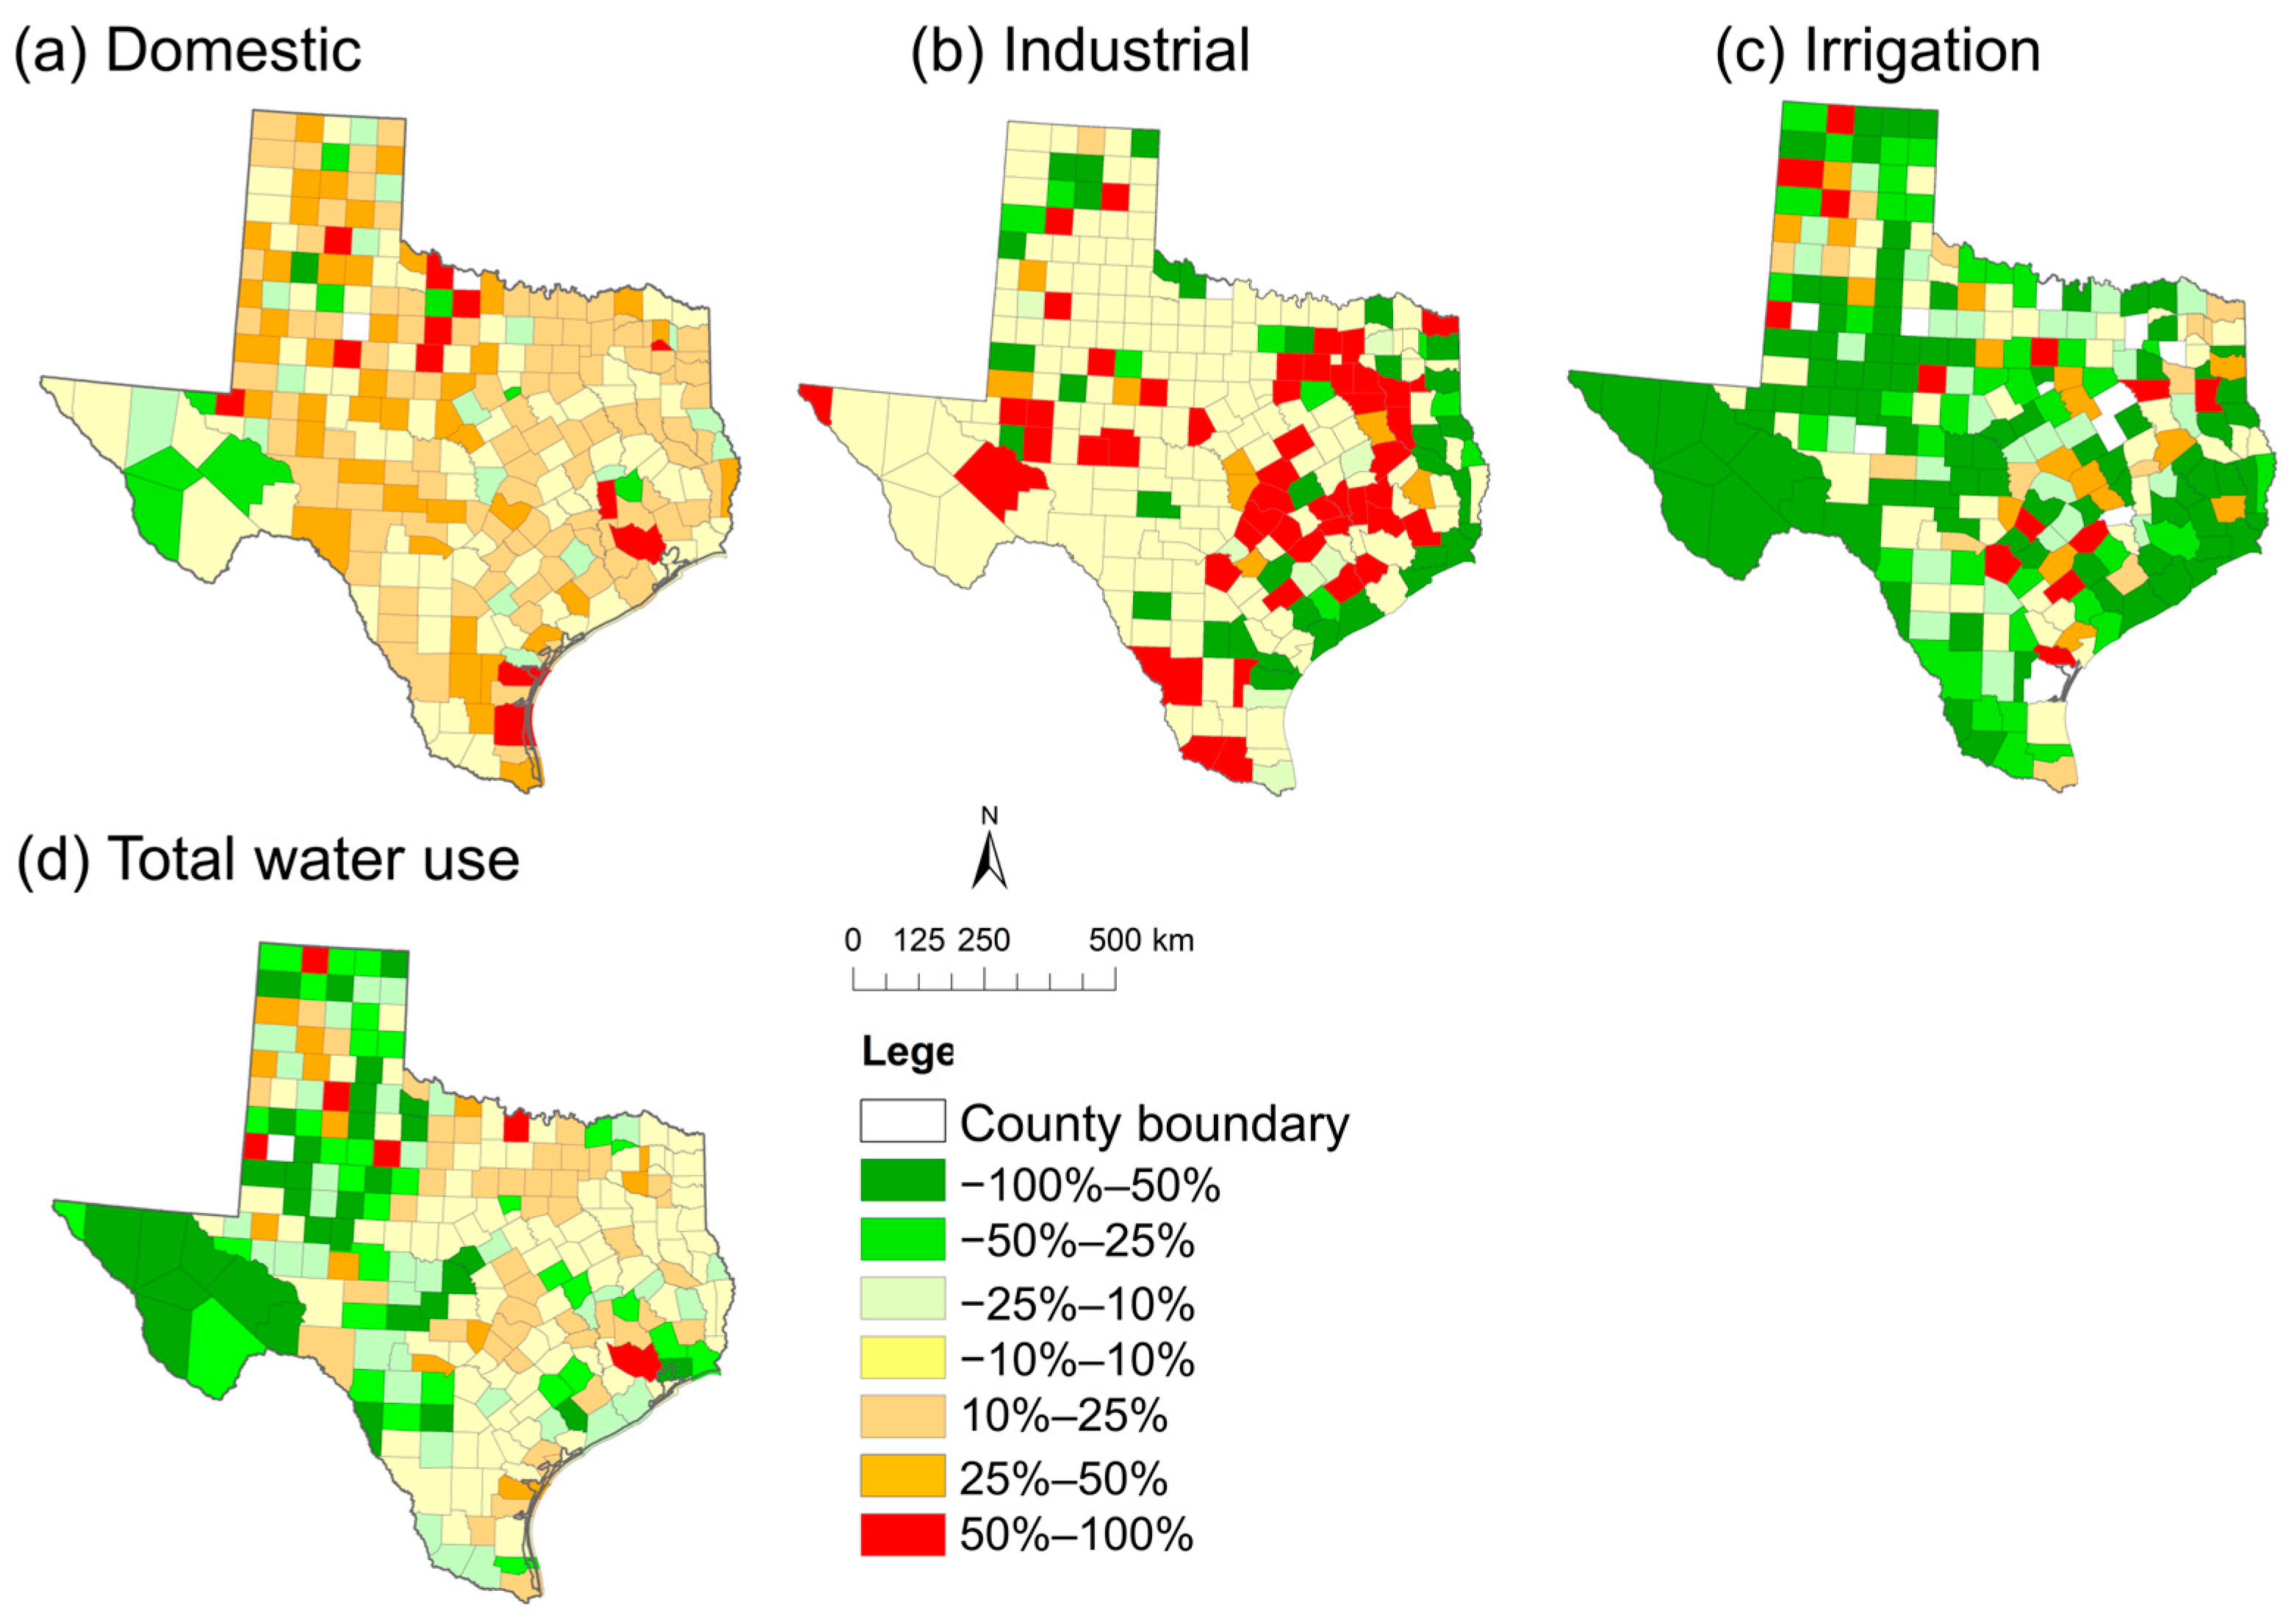
We evaluated the performance of the integrated model by comparing the projected data with actual water uses at the county level for the year 2015. The integrated model demonstrated good simulation ability, with mean RE of 13.5%, 21.9%, −11.5%, and −10.0% for domestic, industrial, irrigation, and total water use, respectively (Figure 3). However, industrial and irrigation water use showed higher RE variations at the county level due to data limitations and differences between the model’s assumptions and actual conditions. For industrial water use, the integrated model did not consider water use in different industrial sectors, resulting in large overestimations or underestimations in counties with relatively homogeneous industrial structures. As for irrigation water use, the constant irrigation efficiency used for each cropland and the assumption of 100% ET replacement for irrigation may not align with actual irrigation practices, which could have affected the accuracy of the model’s irrigation water use estimates.

2.3. Scenarios

Here, seven scenarios were evaluated to assess their impacts on water stress, including a business-as-usual (BaU) scenario, two population growth (i.e., PoG-low and PoG-high) scenarios, two economic development (i.e., GDP-low and GDP-high) scenarios, and two irrigation management (i.e., IM-1 and IM-2) scenarios (Table 1). The BaU scenario served as a reference scenario, where moderate rates of socioeconomic changes were simulated without implementing irrigation management. Under the BaU scenario, the population growth rates of each country were based on birth and death rates and a 0.5 migration scenario (assuming the migration rate to be 50% to the mean between 2005 and 2015) over the period of 2016–2050. The future manufacturing GDP growth rates were assumed at a moderate growth rate of 5% for each county. The irrigation system was kept the same as the 2015 level. Water supply from 2016 to 2050 was projected using the Hadley Centre Coupled Model version 3 with the Intergovernmental Panel on Climate Change A2 scenario (HADCM3-A2), which has demonstrated better performance than other models in Texas [24]. To reduce prediction uncertainty, a 20-year mean value from 2041 to 2060 was used to represent the temperature, precipitation, and water supply in 2050.
To evaluate the impacts of population growth on water stress, we simulated two population growth scenarios. The PoG-low scenario did not consider migration, and the PoG-high scenario assumed a higher migration rate (i.e., assuming the migration rate to be equal to the mean between 2005 and 2015) than that of the BaU scenario. We also evaluated the impact of two economic development scenarios on water stress, namely a lower (3%) and higher (7%) manufacturing growth rate over the period of 2016–2050, corresponding to a 49% lower GDP or 94% higher GDP in 2050 than that of the BaU scenario. The irrigation management scenarios were used to simulate the effects of increasing irrigation on water stress, with 15% and 35% increase rates at the subbasin level relative to the BaU scenario.

3. Results

3.1. Base Scenario

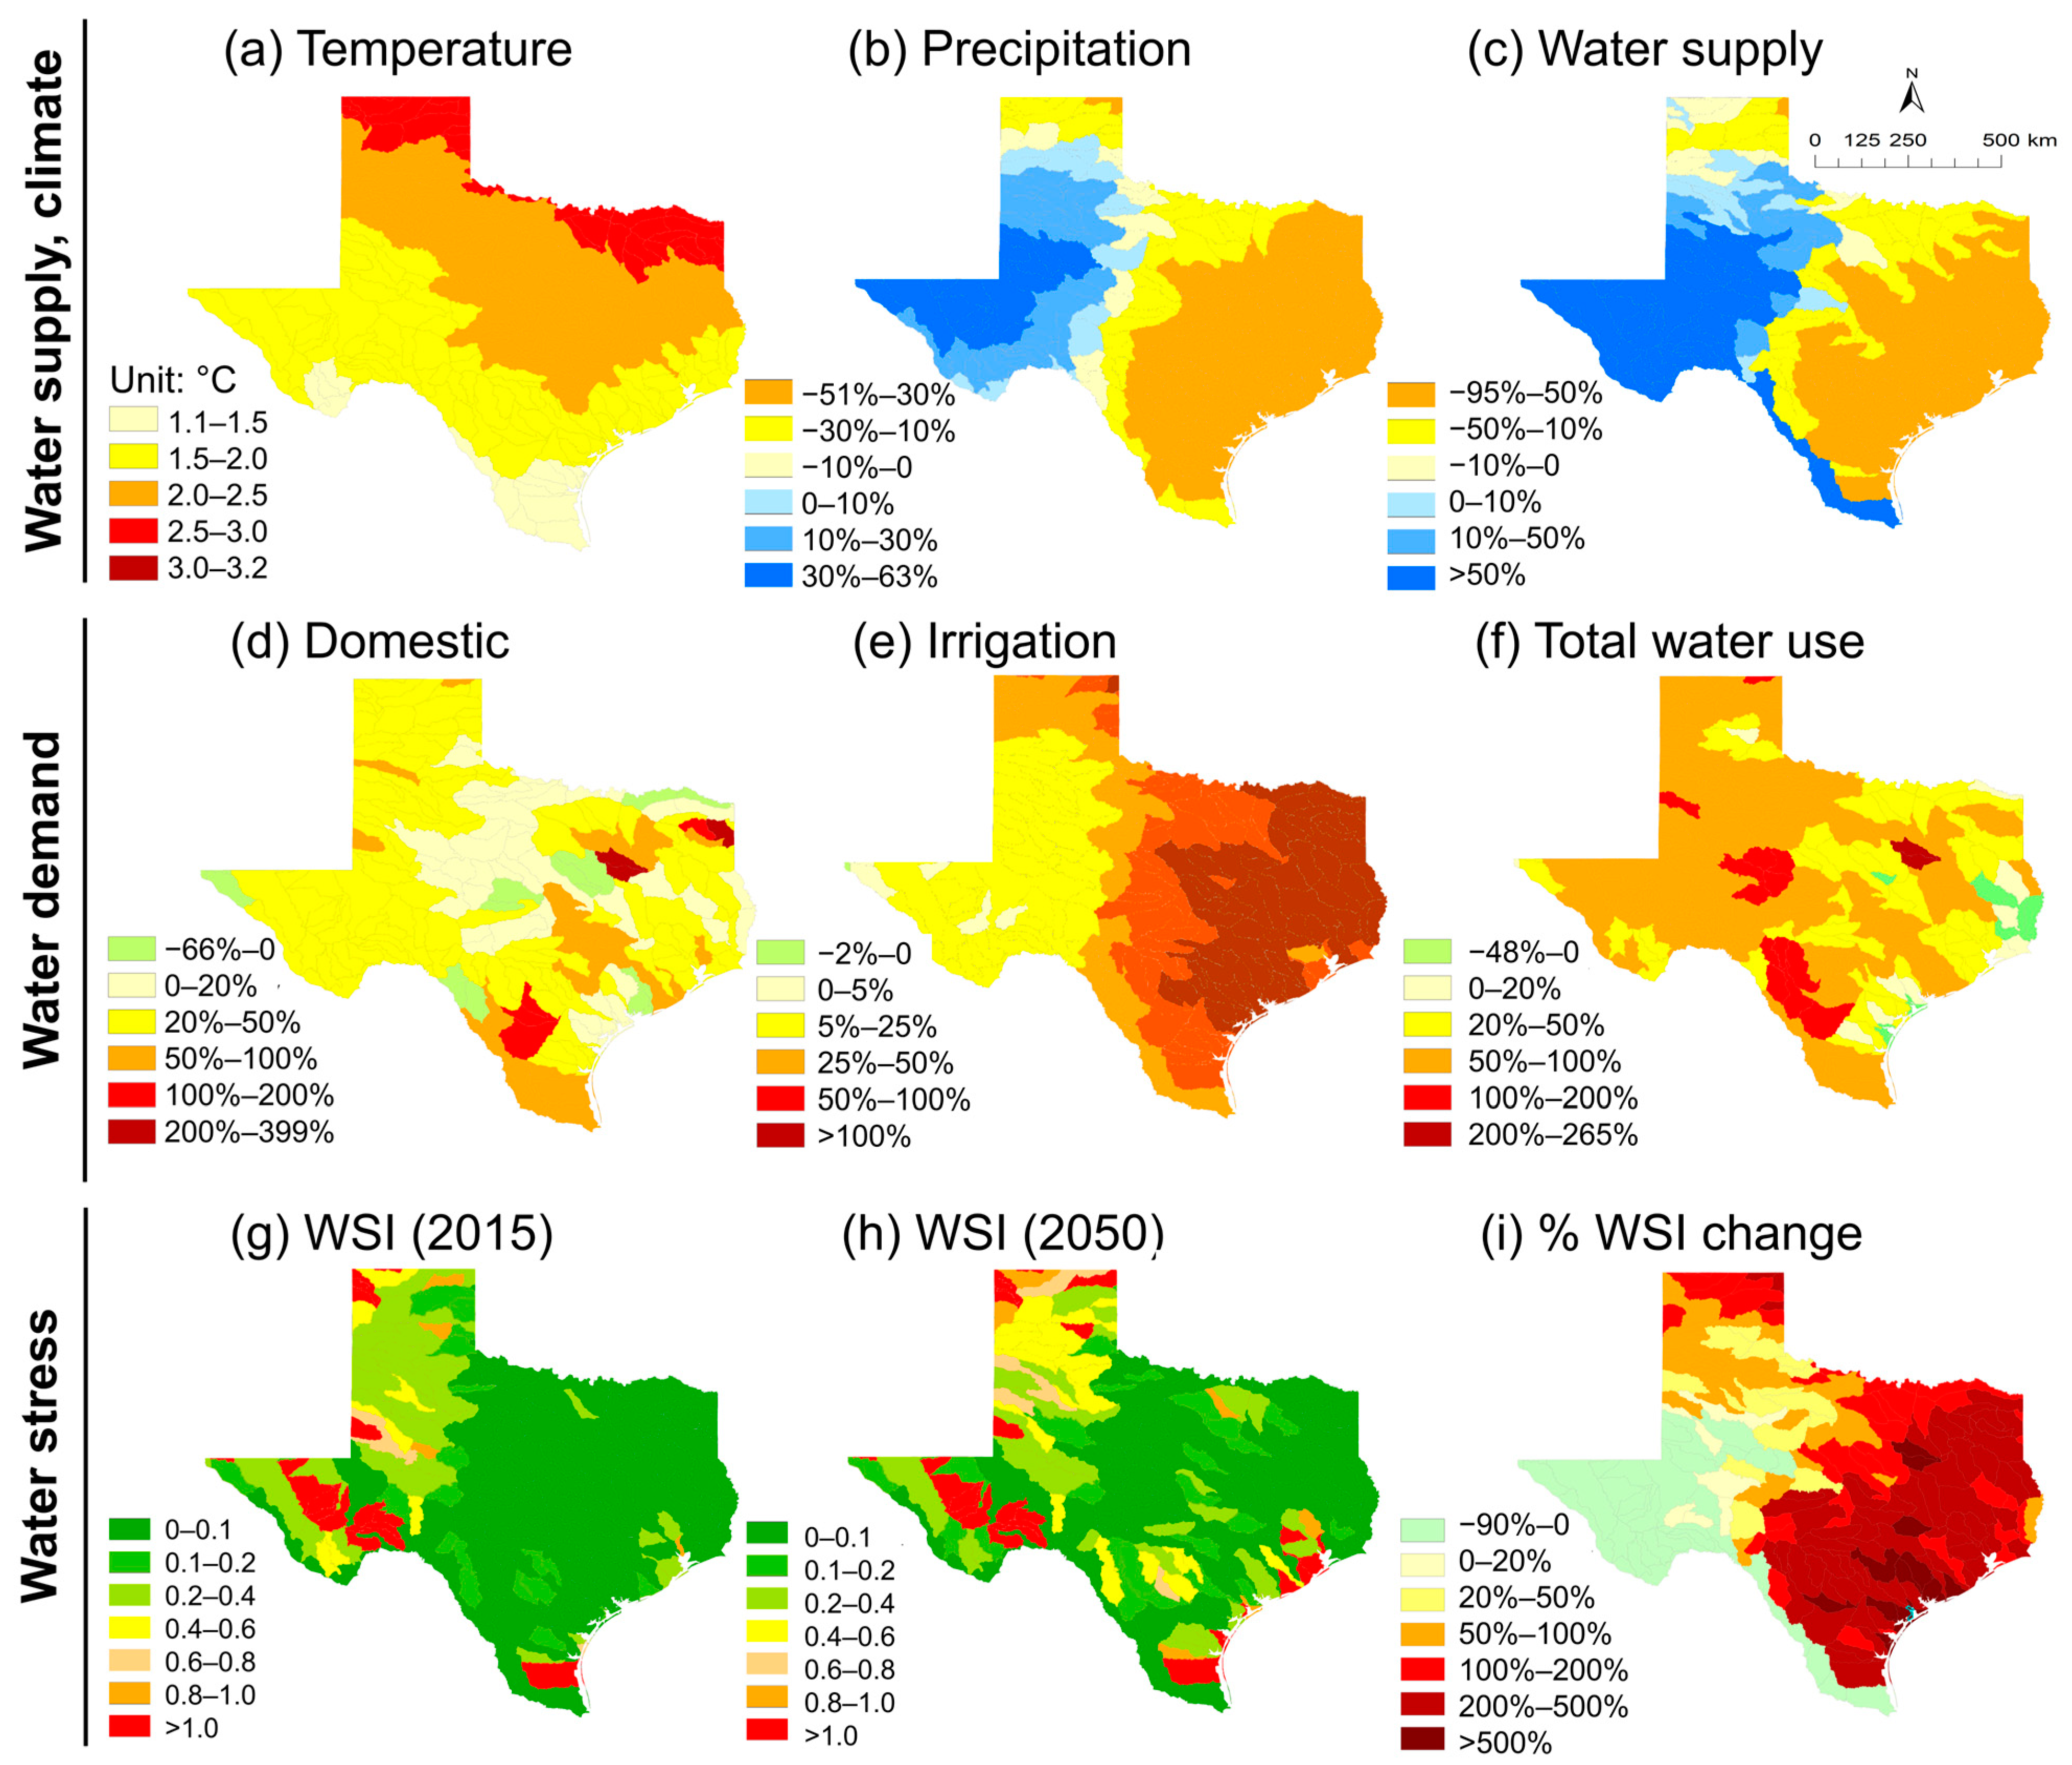
Climate change was projected to have a significant impact on water supply, and its effects varied significantly across different regions of Texas. The western region was projected to experience an annual mean air temperature increase of 1.5–2.0 °C (Figure 4a) and a 65% rise in annual total precipitation (Figure 4b), resulting in a significant increase in water supply (Figure 4c). In contrast, the eastern region was expected to face a 51% decrease in precipitation and a large increase in air temperature, up to 3.2 °C, leading to a decrease of up to 95% in water supply. While the relative increase in precipitation in western Texas is large, the absolute value of precipitation in this region is still relatively low compared to other regions in the state. This means that the increase in precipitation may not have a significant impact on water supply in western Texas, as the water availability in this region is already limited.
Total water use was projected to increase by 58% in 2050 compared to 2015 levels, mainly driven by domestic and irrigation water use changes (Figure 4d–f). Most areas in Texas were expected to experience a 50% to 100% increase in total water demand, with the percentage change varying from −48% to 265% across the state. As shown in Figure 4d, domestic water use would not increase uniformly across Texas, varying from −66% to 399%, with the highest increases occurring in metropolitan areas such as Dallas, Houston, Austin, and San Antonio. Irrigation water use was also projected to increase across Texas, ranging from −2% to 200%. The largest increase in irrigation water use was found in the eastern part of Texas due to increased ET and decreased precipitation (Figure 4e). Decreased water use was found in some coastal regions due to increased water use efficiency, leading to a projected 70% decrease in total manufacturing water use in Texas compared to the 2015 level (Figure 4f).
Regions facing water stress (i.e., WSI > 0.4) in 2050 were projected to increase significantly compared to 2015 levels, including the Texas High Plains (THP) and Rolling Plains (TRP) regions and metropolitan areas, such as Dallas, Houston, Austin, and San Antonio (Figure 4g–i). The THP and TRP regions are important agricultural regions in Texas [39]. Although these two regions were projected to benefit from climate change with increased water supply in 2050, water stress in these two regions would become more severe due to increased irrigation and domestic water use. In addition, these two regions received lower precipitation (<700 mm per year) than eastern Texas (>2000 mm in some coastal regions), making crop production in these regions highly dependent on irrigation. Metropolitan regions such as Dallas, Houston, Austin, and San Antonio are located in eastern Texas, where water supply was projected to decrease. The projected increase in population in these regions would pose significant challenges to local water supply.

3.2. Sensitivity Analysis

Sensitivities of population growth, economic development, and irrigation management to WSI in 2050 were examined (Figure 5). Population growth had a significant impact on domestic water use and was highly sensitive to WSI, particularly in metropolitan areas such as Dallas, Houston, Austin, and San Antonio (Figure 5a). The WSI in these cities was expected to increase by 50–90% under the PoG-high scenario compared to the BaU scenario. It should be noted that certain regions were projected to experience a decline in population as people moved away from those areas under the BaU scenario. Therefore, a 0–7% WSI increase was projected in these areas under the PoG-low scenario, and a 12% WSI decrease was projected under the PoG-high scenario. Results showed that labor force migration could have a significant impact on local population growth, which in turn may affect water stress levels in each area. This is particularly important in developing countries currently undergoing rapid urbanization. Megacities in these countries, such as Shenzhen, Dhaka, Mexico City, Jakarta, and San Paulo, have faced challenges in meeting the increasing water demands associated with rapid population growth [6,40,41]. To effectively address these challenges, it is important to implement mid- to long-term socioeconomic planning to ensure that water infrastructure development keeps pace with the rate of socioeconomic growth [7].
The impact of manufacturing GDP growth on WSI varied across Texas, with most regions showing negligible impact, except for some coastal subbasins with higher proportions of manufacturing water use (Figure 5b). This was due to a projected 70% decrease in manufacturing water use per GDP compared to the 2015 level with improved water use efficiency. As a result, the proportion of manufacturing in total water use was projected to decrease from 3% in 2015 to 1% in 2050. Despite the significant improvements in water use efficiency, WSI in subbasins with high proportions of water use from the manufacturing sector (44–92%, Figure S5) was still sensitive to GDP growth. For instance, under the GDP-high scenario, WSI in these counties was expected to increase by 20–50%. In metropolitan areas, such as Houston, where the manufacturing sector water use accounts for 34%, an increase in manufacturing GDP may exacerbate competition with domestic water use (Figure S5). One possible solution to avoid competition between domestic and industrial water uses suggested by previous studies in metropolitan areas was accelerating local industrial structure upgrading by restricting water-intensive industries, e.g., textiles, chemical, and the paper and pulp production manufacturing sectors [6,42].
Increasing irrigation rates were highly sensitive to WSI. Most regions were expected to experience a significant increase in irrigation water use, ranging from 25% to 50% and from 50% to 100%, for a 15% and 35% increase in irrigation rates, respectively. Some areas, such as the TRP region, part of the northern THP region, northeast Texas, and coastal bend, are particularly vulnerable to water stresses, with projected increases as high as 190%. Therefore, the expansion of irrigated agriculture to improve crop production in these regions should be carefully planned so as to not worsen water scarcity. Additionally, our findings highlighted the importance of improving water use efficiency as a crucial climate change adaptation strategy, which is consistent with the study by Flörke et al. [12] on 482 of the world’s largest cities. Their study showed that improving water use efficiency has the potential to significantly alleviate water stress in 80% of the high-conflict basins worldwide.

4. Discussion

4.1. Policy Implications

The integrated model developed in this study captured changes in water demand across various sectors and the impact of climate change on water supply. By using this model, decisionmakers can identify the key factors contributing to water stress and develop more effective policies and measures to manage water demand and supply. Some suggested measures include: (1) Emphasizing the importance of socioeconomic planning in water resources management. Accurate projections of future socioeconomic changes, particularly in rapidly developing regions, are important in promoting efficient water resources management [43]. Restricting labor-intensive and water-intensive industries is recommended in water-stressed metropolitan areas. In addition, implementing water pricing policies is suggested to incentivize industries to adopt more water-efficient practices [44]; (2) Promoting domestic water saving. Given the high sensitivity of population growth to water stress in most regions in Texas, encouraging water conservation and efficiency measures at the individual, household, and business levels can effectively reduce total water demand. Several strategies can be employed, such as increasing public awareness, water conservation education [1], and the use of water-efficient appliances and fixtures in new constructions or renovations; (3) Promoting sustainable water use in agriculture. The expansion of irrigated croplands can be achieved through the adoption of precision irrigation technologies, such as soil moisture sensors [45], drip irrigation [46], and precision sprinkler systems [38], which may offset its adverse impacts on irrigation water use. Another strategy is to encourage the adoption of drought-tolerant crops that require less water [47]. The impact of implementing these strategies on mitigating water stress can be evaluated using our integrated model.

4.2. Advantages and Limitations

The SyDWEM-WaSSI model improves simulations of local socioeconomic and agricultural systems, enabling a more accurate assessment of future water stress associated with climate change, socioeconomic development, and agricultural management at subbasin levels. The model is a valuable tool for decisionmakers and stakeholders, providing a comprehensive framework for evaluating the complex interactions between climate change, socioeconomic development, and agricultural management on local water resources. The advantages of using SyDWEM-WaSSI are as follows: (1) It enables dynamic simulations of local domestic and industrial water use, considering population growth and economic development. By incorporating these variables, the integrated model captures water demand changes across different sectors over time; (2) It improves the estimation of irrigation water use by integrating high-resolution crop information and local irrigation practices. This improvement allows for a more accurate evaluation of irrigation water demand, providing valuable insights into irrigation water requirements and supporting the development of effective management strategies; and (3) It has the potential to assess climate adaptation strategies, such as the adoption of precision irrigation technologies and drought-tolerant crops. By simulating the implementation of these strategies, decisionmakers can evaluate their effectiveness in mitigating water stress and make informed choices to promote sustainable water resource management.
The integrated system developed in this study has several limitations that can be addressed in future research. One limitation is that the socioeconomic module of the system was considered an external scenario, indicating that the feedback between population growth and economic development cannot be simulated. For instance, manufacturing industries’ development can significantly affect the local labor force market, leading to increased migration and domestic water use [6,7,42]. Unfortunately, this element was not incorporated into our model due to a lack of detailed sectoral labor force data. Another limitation of our study is the lack of detailed information on local irrigation systems. Irrigation efficiency is highly dependent on local irrigation practices and infrastructure [38], and the uniform irrigation efficiency used in this study may lead to overestimation or underestimation of irrigation water use in certain areas. Further research is needed to develop more accurate estimates of irrigation water use. In addition, we only accounted for the impact of water consumption from power generation and did not consider water withdrawal. The cooling process in power generation requires large amounts of water, and the availability of water for cooling may affect power generation, especially during drought and heat-wave events [48,49,50]. Neglecting the impact of water withdrawal from power generation can lead to an underestimation of water stress in certain regions.
To reduce simulation uncertainties related to water demand across different sectors, we selected a simulation period from 2015 to 2050. The rationale behind this selection was the use of historical data simulations to project future population growth and economic development. While relying solely on historical data can introduce significant errors as time progresses, we used an exponential equation to estimate water use intensity to account for technological improvements. However, the reliability of this approach decreases as technology continues to evolve, resulting in substantial errors in long-term projections. This highlights the need to improve long-term modeling techniques to capture the dynamic nature of technological progress and its impact on water consumption patterns.
Furthermore, our analysis did not consider the changes in domestic water use patterns. Recent studies have shown a significant increase in domestic water use during the COVID-19 pandemic, mainly attributed to the widespread adoption of remote work arrangements [2,3]. This shift in work arrangements has led to substantial changes in consumer behavior, resulting in lasting changes in water consumption patterns that could have long-term implications. We did not incorporate these effects on domestic water use due to limitations in the available data. However, it is important for future research to address this uncertainty in water use and its potential impacts.

5. Conclusions

In this study, we developed an integrated model to assess water vulnerable areas in Texas from 2015 to 2050, due to climate change, socioeconomic development, and agricultural management at subbasin levels. Our findings indicated that climate change significantly impacts water supply, with western Texas benefiting from increased precipitation and eastern Texas experiencing a large decrease in water supply due to reduced precipitation and increased air temperature. The areas facing water stress were projected to increase rapidly in 2050, including the THP and TRP regions due to increased irrigation water use under climate change, and metropolitan areas, such as Dallas, Houston, Austin, and San Antonio, due to increased domestic water demand. Our study highlights the importance of incorporating socioeconomic planning into water resources management, such as restricting labor-intensive and water-intensive industries to mitigate the competition among domestic and industrial water use in metropolitan areas. The integrated model provides a useful tool for policymakers and stakeholders in developing effective water management strategies to mitigate the effects of water stress at regional scales.

Supplementary Materials

The following supporting information can be downloaded at: https://www.mdpi.com/article/10.3390/su15129290/s1, Figure S1: the proportion of sectoral water use in different counties in Texas; Figure S2: spatial distribution of major crop types in Texas; Figure S3: spatial distribution of irrigated croplands in Texas; Figure S4: crop coefficients used for (a) Cotton, (b) Corn, and (c) Sorghum; Figure S5: Water stress index (WSI) change under GDP-high scenario and sectoral water use in major counties; Table S1: crop types and their planting areas in Texas; Table S2: summary of the efficiencies (fraction) of MESA/LESA/LEPA irrigation systems in Texas; Table S3: Crop coefficients used for different crops. References [33,34,35,36] are cited in the supplementary materials.

Author Contributions

Q.S.: Conceptualization, data curation, formal analysis, methodology, writing—original draft. R.K.: conceptualization, supervision, project administration, writing—review and editing. All authors have read and agreed to the published version of the manuscript.

Funding

This research received no external funding.

Institutional Review Board Statement

Not applicable.

Informed Consent Statement

Not applicable.

Data Availability Statement

Not applicable.

Acknowledgments

The authors would like to thank Guy Fipps at Texas A&M University for providing field-observed crop coefficient data.

Conflicts of Interest

The authors declare no conflict of interest.

References

  1. Singh, V.P.; Su, Q. Water: How Secure Are We under Climate Change? In Sustainability of Water Resources: Impacts and Management; Yadav, B., Mohanty, M.P., Pandey, A., Singh, V.P., Singh, R.D., Eds.; Springer International Publishing: Cham, Swizterland, 2022; pp. 3–24. [Google Scholar]
  2. Nemati, M.; Tran, D. The Impact of COVID-19 on Urban Water Consumption in the United States. Water 2022, 14, 3096. [Google Scholar] [CrossRef]
  3. Abu-Bakar, H.; Williams, L.; Hallett, S.H. Quantifying the impact of the COVID-19 lockdown on household water consumption patterns in England. NPJ Clean Water 2021, 4, 13. [Google Scholar] [CrossRef]
  4. Ober, J.; Karwot, J. The Effect of Publicly Available COVID-19 Information on the Functioning of Society, Businesses, Government and Local Institutions: A Case Study from Poland. Int. J. Environ. Res. Public Health 2023, 20, 2719. [Google Scholar] [CrossRef] [PubMed]
  5. IPCC. Climate Change 2021: The Physical Science Basis. Contribution of Working Group. I to the Sixth Assessment Report of the Intergovernmental Panel on Climate Change; Cambridge University Press I: Cambridge, UK, 2021. [Google Scholar]
  6. Su, Q.; Dai, H.C.; Lin, Y.; Chen, H.; Karthikeyan, R. Modeling the carbon-energy-water nexus in a rapidly urbanizing catchment: A general equilibrium assessment. J. Environ. Manag. 2018, 225, 93–103. [Google Scholar] [CrossRef] [PubMed]
  7. Qin, H.P.; Su, Q.; Khu, S.T. Assessment of environmental improvement measures using a novel integrated model: A case study of the Shenzhen River catchment, China. J. Environ. Manag. 2013, 114, 486–495. [Google Scholar] [CrossRef]
  8. Heinke, J.; Muller, C.; Lannerstad, M.; Gerten, D.; Lucht, W. Freshwater resources under success and failure of the Paris climate agreement. Earth Syst. Dynam. 2019, 10, 205–217. [Google Scholar] [CrossRef] [Green Version]
  9. Wada, Y.; Florke, M.; Hanasaki, N.; Eisner, S.; Fischer, G.; Tramberend, S.; Satoh, Y.; van Vliet, M.T.H.; Yillia, P.; Ringler, C.; et al. Modeling global water use for the 21st century: The Water Futures and Solutions (WFaS) initiative and its approaches. Geosci. Model. Dev. 2016, 9, 175–222. [Google Scholar] [CrossRef] [Green Version]
  10. Stenzel, F.; Greve, P.; Lucht, W.; Tramberend, S.; Wada, Y.; Gerten, D. Irrigation of biomass plantations may globally increase water stress more than climate change. Nat. Commun. 2021, 12, 1512. [Google Scholar] [CrossRef]
  11. Garrick, D.; De Stefano, L.; Yu, W.; Jorgensen, I.; O’Donnell, E.; Turley, L.; Aguilar-Barajas, I.; Dai, X.P.; Leao, R.D.; Punjabi, B.; et al. Rural water for thirsty cities: A systematic review of water reallocation from rural to urban regions. Environ. Res. Lett. 2019, 14, 043003. [Google Scholar] [CrossRef]
  12. Flörke, M.; Schneider, C.; McDonald, R.I. Water competition between cities and agriculture driven by climate change and urban growth. Nat. Sustain. 2018, 1, 51–58. [Google Scholar] [CrossRef]
  13. Konapala, G.; Mishra, A.K.; Wada, Y.; Mann, M.E. Climate change will affect global water availability through compounding changes in seasonal precipitation and evaporation. Nat. Commun. 2020, 11, 3044. [Google Scholar] [CrossRef] [PubMed]
  14. Haddeland, I.; Heinke, J.; Biemans, H.; Eisner, S.; Florke, M.; Hanasaki, N.; Konzmann, M.; Ludwig, F.; Masaki, Y.; Schewe, J.; et al. Global water resources affected by human interventions and climate change. Proc. Natl. Acad. Sci. USA 2014, 111, 3251–3256. [Google Scholar] [CrossRef] [Green Version]
  15. Su, Q.; Singh, V.P. Calibration-free Priestley-Taylor Method for Reference Evapotranspiration Estimation. Water Resour. Res. 2023, 59, e2022WR033198. [Google Scholar] [CrossRef]
  16. Su, Q.; Singh, V.P.; Karthikeyan, R. Improved reference evapotranspiration methods for regional irrigation water demand estimation. Agric. Water Manag. 2022, 274, 107979. [Google Scholar] [CrossRef]
  17. Bardsley, T.; Wood, A.; Hobbins, M.; Kirkham, T.; Briefer, L.; Niermeyer, J.; Burian, S. Planning for an Uncertain Future: Climate Change Sensitivity Assessment toward Adaptation Planning for Public Water Supply. Earth Interact. 2013, 17, 1–26. [Google Scholar] [CrossRef]
  18. Ficklin, D.L.; Luo, Y.Z.; Zhang, M.H. Climate change sensitivity assessment of streamflow and agricultural pollutant transport in California's Central Valley using Latin hypercube sampling. Hydrol. Process. 2013, 27, 2666–2675. [Google Scholar] [CrossRef]
  19. Jha, M.; Arnold, J.G.; Gassman, P.W.; Giorgi, F.; Gu, R.R. Climate change sensitivity assessment on Upper Mississippi River Basin streamflows using SWAT. J. Am. Water Resour. Assoc. 2006, 42, 997–1015. [Google Scholar] [CrossRef]
  20. Elliott, J.; Deryng, D.; Mueller, C.; Frieler, K.; Konzmann, M.; Gerten, D.; Glotter, M.; Florke, M.; Wada, Y.; Best, N.; et al. Constraints and potentials of future irrigation water availability on agricultural production under climate change. Proc. Natl. Acad. Sci. USA 2014, 111, 3239–3244. [Google Scholar] [CrossRef] [Green Version]
  21. United States Census Bureau. American Community Survey 2016; United States Census Bureau: Suitland, MD, USA, 2016.
  22. Texas Water Development Board, TWDB. Planning Data. 2023. Available online: https://www.twdb.texas.gov/waterplanning/data/index.asp (accessed on 5 June 2023).
  23. Wuebbles, D.; Meehl, G.; Hayhoe, K.; Karl, T.R.; Kunkel, K.; Santer, B.; Wehner, M.; Colle, B.; Fischer, E.M.; Fu, R.; et al. CMIP5 CLIMATE MODEL ANALYSES Climate Extremes in the United States. Bull. Am. Meteorol. Soc. 2014, 95, 571–583. [Google Scholar] [CrossRef] [Green Version]
  24. Sun, G.; McNulty, S.G.; Myers, J.A.M.; Cohen, E.C. Impacts of Multiple Stresses on Water Demand and Supply Across the Southeastern United States. J. Am. Water Resour. Assoc. 2008, 44, 1441–1457. [Google Scholar] [CrossRef]
  25. Hernandez, E.A.; Uddameri, V. Standardized precipitation evaporation index (SPEI)-based drought assessment in semi-arid south Texas. Environ. Earth Sci. 2014, 71, 2491–2501. [Google Scholar] [CrossRef]
  26. Su, Q.; Dai, H.C.; Xie, S.Y.; Yu, X.Y.; Lin, Y.; Singh, V.P.; Karthikeyan, R. Water-Energy-Carbon Nexus: Greenhouse Gas Emissions from Integrated Urban Drainage Systems in China. Environ. Sci. Technol. 2023, 57, 2093–2104. [Google Scholar] [CrossRef] [PubMed]
  27. Vorosmarty, C.J.; Green, P.; Salisbury, J.; Lammers, R.B. Global water resources: Vulnerability from climate change and population growth. Science 2000, 289, 284–288. [Google Scholar] [CrossRef] [PubMed] [Green Version]
  28. Smakhtin, V.; Revenga, C.; Doll, P. A pilot global assessment of environmental water requirements and scarcity. Water Int. 2004, 29, 307–317. [Google Scholar]
  29. Texas Water Development Board, TWDB. Water for Texas: 2012 State Water Plan; Texas Water Development Board: Austin, TX, USA, 2012.
  30. NASS Cropland Data Layer (CDL), National Agricultural Statistics Service. 2016. Available online: https://nassgeodata.gmu.edu/CropScape/ (accessed on 5 June 2023).
  31. Pervez, M.S.; Brown, J.F. Mapping Irrigated Lands at 250-m Scale by Merging MODIS Data and National Agricultural Statistics. Remote Sens. 2010, 2, 2388–2412. [Google Scholar] [CrossRef] [Green Version]
  32. AQUASTAT. Global Map of Irrigation Area (Version 4.0.1) in Natioins; AQUASTAT FAO-UN Land and Water Division: Rome, Italy, 2007. [Google Scholar]
  33. Steve, A.; Almas, L.; Girase, J.R.; Kenny, N.; Guerrero, B.; Vimlesh, K.; Marek, T. Economic of Irrigation Systems; Texas A&M AgriLife Research; Irrigation-Bulletin-Final-B6113; Texas A&M University: College Station, TX, USA, 2011. [Google Scholar]
  34. Rajan, N.; Maas, S.; Kellison, R.; Dollar, M.; Cui, S.; Sharma, S.; Attia, A. Emitter Uniformity and Application Efficiency for Centre- Pivot Irrigation Systems. Irrig. Drain. 2015, 64, 353–361. [Google Scholar] [CrossRef]
  35. Lyle, W.M.; Bordovsky, J.P. Lepa Irrigation System Evaluation. Trans. ASAE 1983, 26, 776–781. [Google Scholar] [CrossRef]
  36. Allen, R.G.; Pereira, L.S.; Raes, D.; Smith, M. Crop. Evapotranspiration: Guidelines for Computing Crop. Water Requirements; Food and Agriculture Organization of the United Nations: Headquarters: Rome, Italy, 1998; p. 300. [Google Scholar]
  37. Texas Board of Water Engineers. Bulletin 6019; TBWE: Austin, TX, USA, 1960. [Google Scholar]
  38. Singh, V.P.; Su, Q. Irrigation Engineering: Principles, Processes, Procedures, Design, and Management; Cambridge University Press: Cambridge, UK, 2022. [Google Scholar]
  39. USDA-NASS. Annual Cotton Review (May 2020); USDA; National Agricultural Statistics Service; Southern Plains Regional Field Office: Austin, TX, USA, 2020.
  40. Biswas, A.K. Water management for major urban centres. Int. J. Water Resour. Dev. 2006, 22, 183–197. [Google Scholar] [CrossRef]
  41. Tortajada, C.; Biswas, A.K. The rapidly changing global water management landscape. Int. J. Water Resour. Dev. 2017, 33, 849–851. [Google Scholar] [CrossRef]
  42. Su, Q.; Dai, H.C.; Chen, H.; Lin, Y.; Xie, Y.; Karthikeyan, R. General Equilibrium Analysis of the Cobenefits and Trade-Offs of Carbon Mitigation on Local Industrial Water Use and Pollutants Discharge in China. Environ. Sci. Technol. 2019, 53, 1715–1724. [Google Scholar] [CrossRef]
  43. Arnell, N.W. Climate change and global water resources: SRES emissions and socioeconomic scenarios. Glob. Environ. Chang.-Human Policy Dimens. 2004, 14, 31–52. [Google Scholar] [CrossRef]
  44. Garcia-Lopez, M.; Montano, B.; Melgarejo, J. Water Pricing Policy as Tool to Induce Efficiency in Water Resources Management. Int. J. Environ. Res. Public Health 2020, 17, 3534. [Google Scholar] [CrossRef] [PubMed]
  45. Zhou, W.C.; Xu, Z.H.; Ross, D.; Dignan, J.; Fan, Y.Z.; Huang, Y.K.; Wang, G.L.; Bagtzoglou, A.C.; Lei, Y.; Li, B.K. Towards water-saving irrigation methodology: Field test of soil moisture profiling using flat thin mm-sized soil moisture sensors (MSMSs). Sens. Actuat. B-Chem. 2019, 298, 126857. [Google Scholar] [CrossRef]
  46. Thompson, T.L.; Pang, H.C.; Li, Y.Y. The Potential Contribution of Subsurface Drip Irrigation to Water-Saving Agriculture in the Western USA. Agric. Sci. China 2009, 8, 850–854. [Google Scholar]
  47. Vahmani, P.; Ban-Weiss, G. Climatic consequences of adopting drought-tolerant vegetation over Los Angeles as a response to California drought. Geophys. Res. Lett. 2016, 43, 8240–8249. [Google Scholar]
  48. Ganguli, P.; Kumar, D.; Ganguly, A.R. US Power Production at Risk from Water Stress in a Changing Climate. Sci. Rep. 2017, 7, 11983. [Google Scholar] [CrossRef] [Green Version]
  49. Scanlon, B.R.; Duncan, I.; Reedy, R.C. Drought and the water-energy nexus in Texas. Environ. Res. Lett. 2013, 8, 045033. [Google Scholar] [CrossRef]
  50. Pacsi, A.P.; Alhajeri, N.S.; Webster, M.D.; Webber, M.E.; Allen, D.T. Changing the spatial location of electricity generation to increase water availability in areas with drought: A feasibility study and quantification of air quality impacts in Texas. Environ. Res. Lett. 2013, 8, 035029. [Google Scholar] [CrossRef]
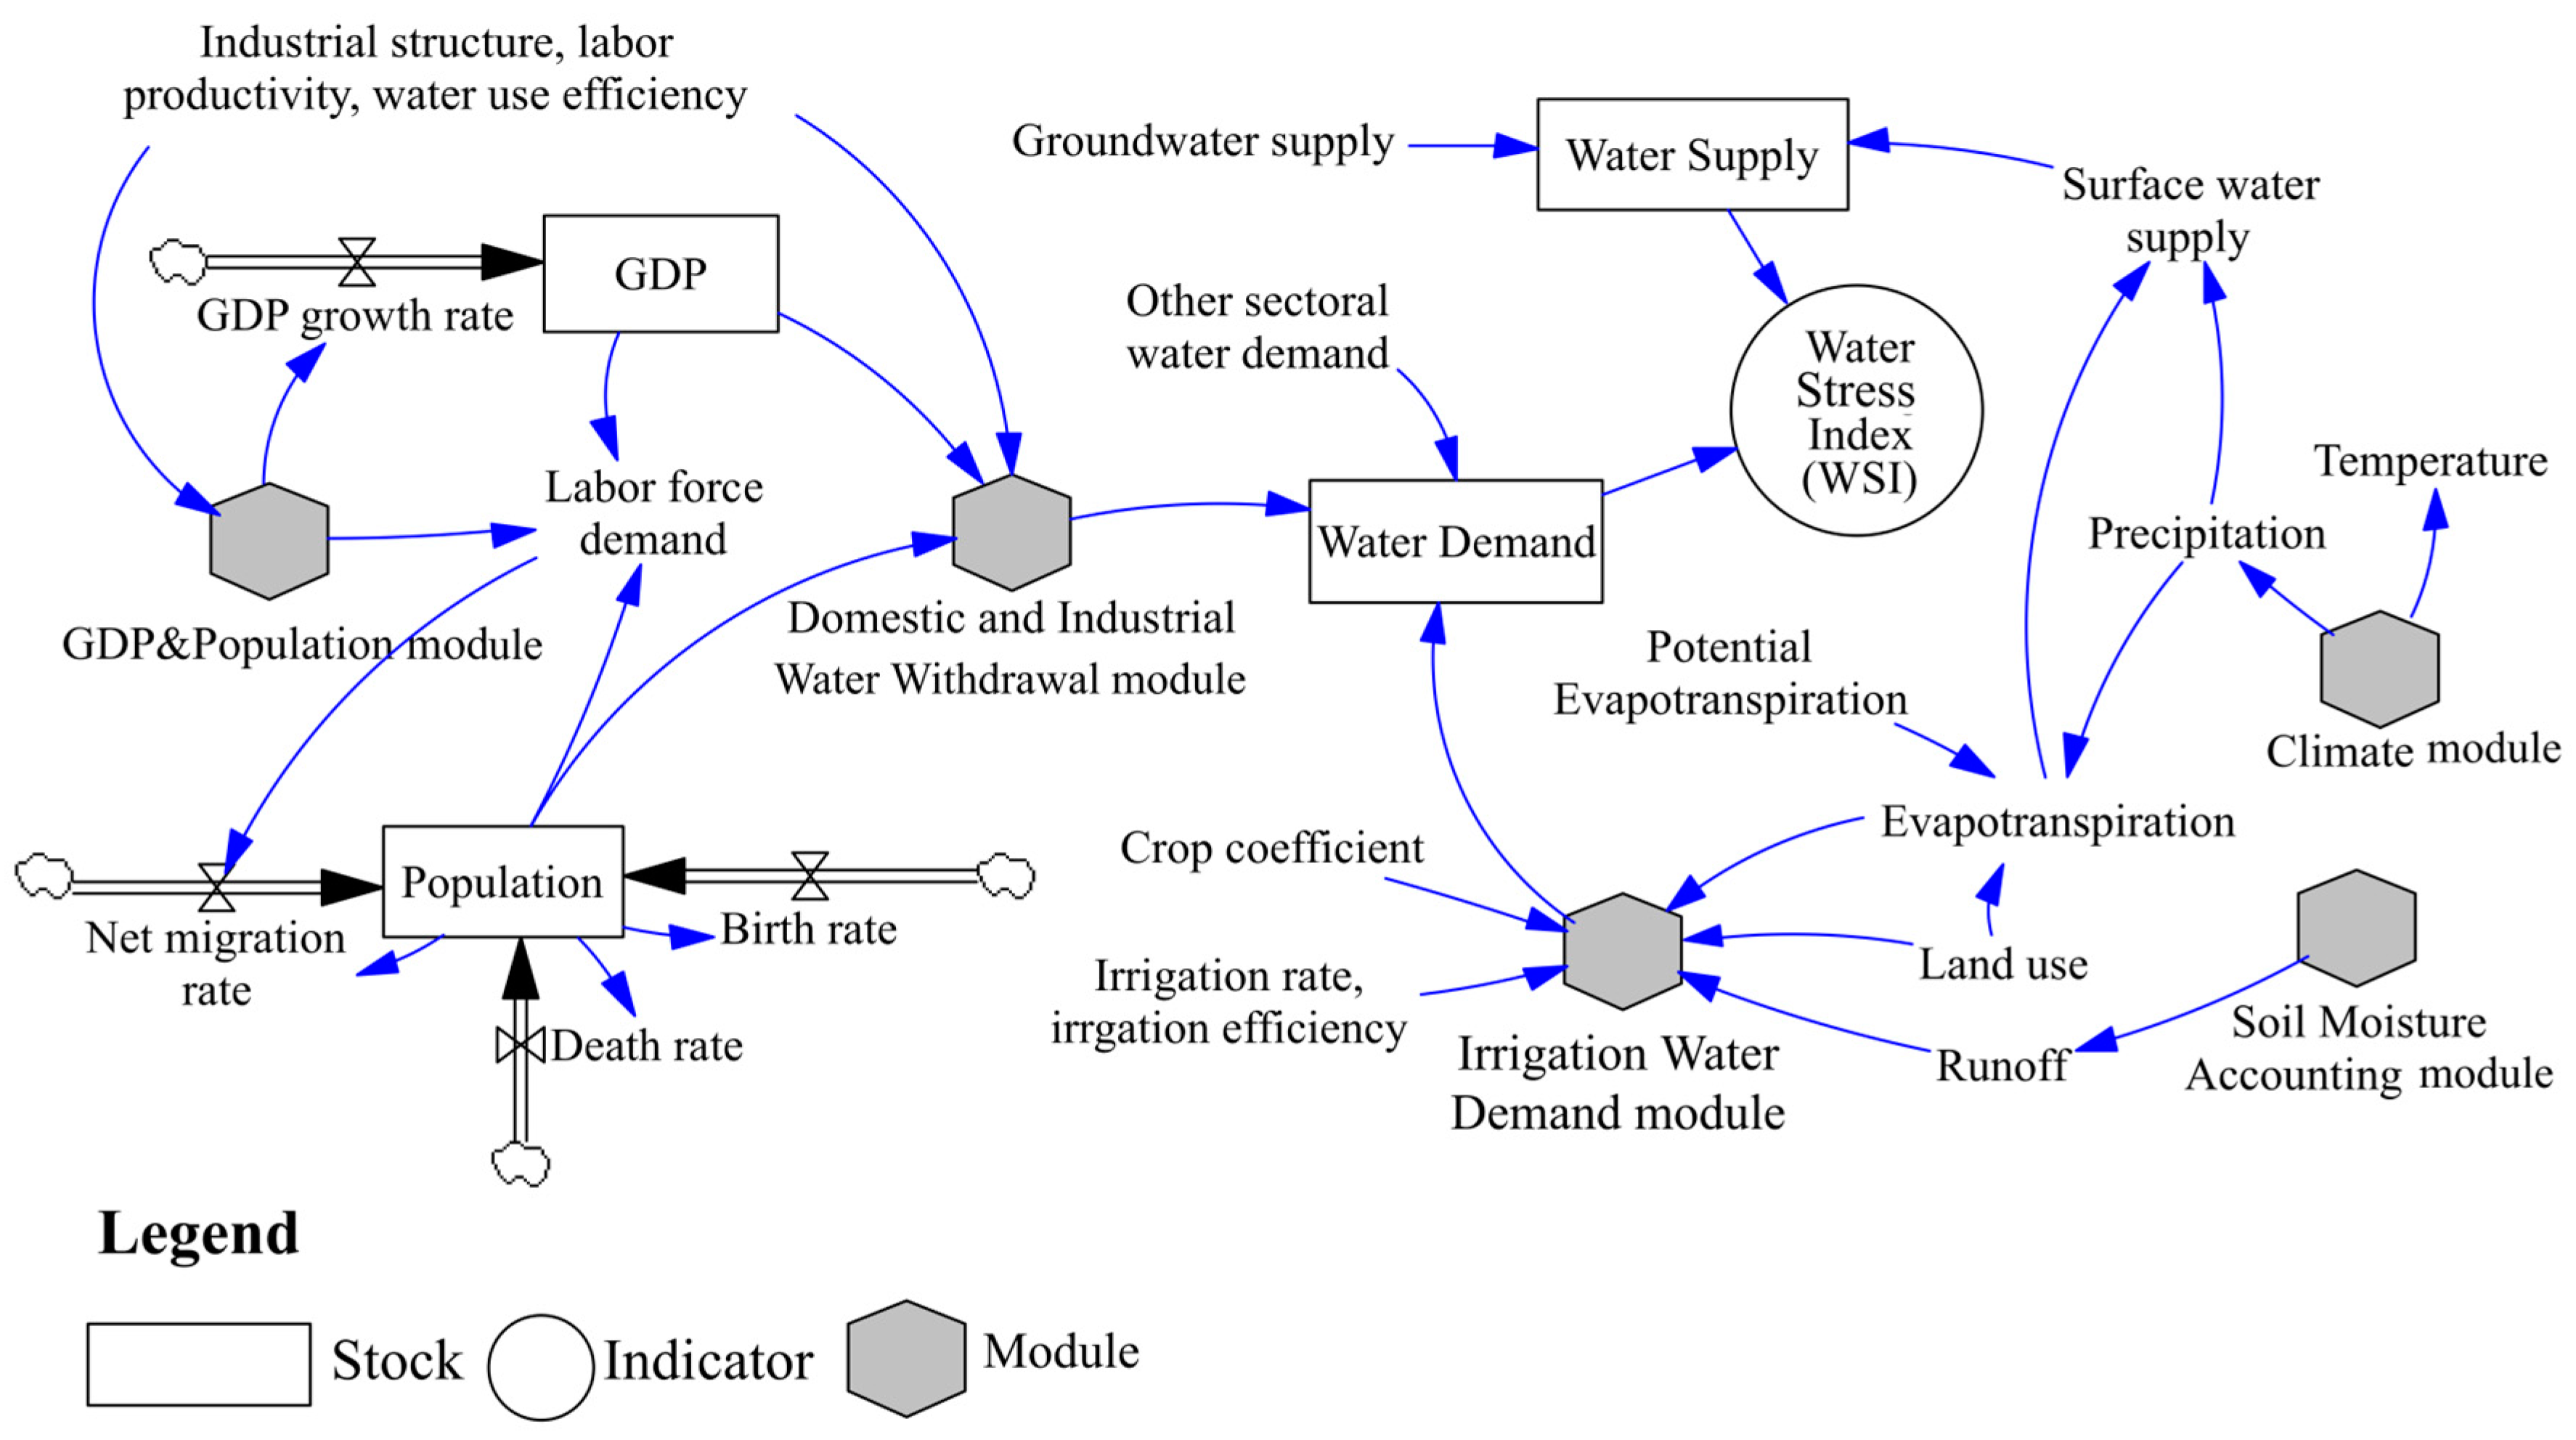
Figure 1. Conceptual integration of the system dynamics and water environmental model (SyDWEM) and water supply stress index (WaSSI) ecosystem services model.
Sustainability 15 09290 g001
Figure 2. Illustration of irrigation water use calculation at county or subbasin level.
Sustainability 15 09290 g002
Figure 3. Comparison of predicted and measured county-level water use data in 2015.
Sustainability 15 09290 g003
Figure 4. Predicted change in water supply, demand, and water stress in Texas in 2050 relative to 2015 under the BaU scenario at subbasin scales. (a) Mean air temperatures, (b) total precipitation, (c) total water supply, water use from (d) domestic, (e) irrigation, and (f) all sectors, current (g) and future (h) water stress index (WSI) and (i) change in the WSI from 2015 to 2050. Note: (a) is in absolute change, and (bf,i) are in percentage changes.
Sustainability 15 09290 g004
Figure 5. Water stress index (WSI) changes compared with the BaU scenario in 2050 under sensitivity analysis of (a,b) population growth, (c,d) economic development (manufacturing GDP growth), and (e,f) irrigation management.
Sustainability 15 09290 g005
Table 1. Configurations of scenarios.
ScenariosPopulation Growth RateManufacturing GDP Growth RateIrrigation Rate
BaU0.5 migration5% over 2016–2050Same as 2015 over 2015–2050
PoG-low0.0 migrationSame as BaUSame as BaU
PoG-high1.0 migrationSame as BaUSame as BaU
GDP-lowSame as BaU3% over 2016–2050Same as BaU
GDP-highSame as BaU7% over 2016–2050Same as BaU
IM-1Same as BaUSame as BaUIncreases by 15% relative to BaU
IM-2Same as BaUSame as BaUIncreases by 35% relative to BaU
Note: the 0.0, 0.5, and 1.0 migration scenarios indicate that the migration rates are 0%, 50%, and 100% of the mean migration rates from 2005 to 2015, respectively.
Disclaimer/Publisher’s Note: The statements, opinions and data contained in all publications are solely those of the individual author(s) and contributor(s) and not of MDPI and/or the editor(s). MDPI and/or the editor(s) disclaim responsibility for any injury to people or property resulting from any ideas, methods, instructions or products referred to in the content.