Review

Assessing the Relationship between Urban Blue-Green Infrastructure and Stress Resilience in Real Settings: A Systematic Review

Faculty of Human Sciences, University of Regensburg, 93040 Regensburg, Germany
*
Author to whom correspondence should be addressed.
Sustainability 2023, 15(12), 9240; https://doi.org/10.3390/su15129240
Submission received: 13 May 2023 / Revised: 3 June 2023 / Accepted: 5 June 2023 / Published: 7 June 2023

Abstract

:
Acute and chronic stress can have detrimental effects on health, particularly in urban environments that lack conducive elements. Optimizing the urban landscape is a preventive measure to enhance well-being and develop healthier cities. This systematic review examines the relationship between stress reduction and urban landscapes, focusing on 19 empirical studies conducted in real urban settings. The findings highlight the physiological and psychological benefits of urban green infrastructure in promoting stress recovery. A well-designed green infrastructure that incorporates objective measurements while considering accessibility, availability, biodiversity, and cumulative effects emerged as crucial for enhancing stress resilience. However, the existing research lacks comprehensive measurements and calls for innovative approaches to ensure evidence-based health outcomes. Interdisciplinary research is needed to develop rigorous methods and tools for understanding the complex link between urban landscapes and stress reduction. This review emphasizes the need for integrating objective measurements of urban green infrastructure and considering accessibility, availability, biodiversity, and cumulative effects to foster healthier urban environments and enhance stress resilience.

1. Introduction

Urbanization is a rapidly growing trend worldwide, and by 2050, an estimated 70% of the global population is projected to live in cities [1]. However, the urban environment can cause stress due to various physical, social, economic, and environmental factors, which can negatively impact both physical and mental health. Public health strategies with a natural environment component, particularly exposure to green spaces, have been proposed as a promising approach [2,3,4] based on the biophilia hypothesis [5] and stress recovery theory [6]. While the therapeutic landscape approach [2,3] and experimental evidence [4,7,8] have confirmed the positive impact of natural environments on reducing psychophysiological measures of stress, it is crucial to implement evidence-based health design for urban open spaces to promote healthy and socially sustainable cities [4] that support various aspects of human life.
However, studies examining the relationship between landscape and mental health have produced inconsistent results, partly due to the complex and multifaceted connotations of the term “landscape” and its multifunctionalities. Specifically, according to the holistic landscape ecology approach promoted in Europe [9,10], which encompasses both the visual aesthetic function advocated by Francesco Petrarca and the exploration of how individuals gather information from visual perception, as well as Alexander von Humboldt’s definition of “Landschaft”, which delves into the psychobiology of the human–environment relationship extended by the effects of landscape change.
Previous reviews on the benefits of real landscape settings for stress reduction have primarily focused on evaluating stress response methods and measures [11], oversimplifying landscapes as generalized natural environments [12]. However, the fact is that the character and quality of a landscape vary depending on its locality. An integrated review conducted by Barnes et al. (2019) [13] recommended considering three significant aspects in health study design: (1) geographic information of the site and surroundings, (2) size, type, and elements of green space, and (3) local climate and seasonal changes [13]. Therefore, it is crucial to distinguish the inherent differences between urban, rural, and wilderness landscapes and not mix them to compare their effects on stress reduction benefits. Moreover, previous studies have focused primarily on the visual perception of landscape features and their effects on stress recovery [14]. However, recent evidence suggests that non-visual aspects, such as soundscapes and olfactory experiences, may also play a crucial role in stress reduction [15]. Additionally, the impact of individual differences in the perception and interpretation of landscape features on stress recovery should also be considered [16], as some individuals may have stronger preferences for certain types of landscapes than others [17]. The limited evidence-based support for the effects of nature contact on stress recovery is due to methodological shortcomings in current research. Some studies neglect objective measurements of the landscapes they study, while others overlook psychological stress measurements.
Thus, to minimize potential bias, this systematic review aims to provide a comprehensive analysis of the impact of urban landscapes and interventions on stress reduction. The review focuses exclusively on urban landscapes and offers an objective assessment of relevant research related to the effects of different types of urban environments on stress responses. It also analyzes the scale and elements covered in these selected studies to provide insights into the most effective approaches for stress reduction in urban environments. Ultimately, the review provides evidence-based recommendations for both the practice and academic fields, informing urban green space planning and design. By doing so, we can promote healthy and sustainable cities and improve the overall well-being of urban populations.

2. Materials and Methods

We conducted a comprehensive systematic review following the Preferred Reporting Items for Systematic Reviews and Meta-Analysis (PRISMA) guidelines [18]. Our search strategy involved using a combination of relevant keywords related to “urban landscapes” and “human stress” from various sources. The search was limited to studies published in English and available online or in the press before 1 February 2022. We screened all relevant studies and included those that met our predefined inclusion criteria based on the relevance of their titles, abstracts, or keywords. A complete list of search terms is provided in Appendix A Table A1.

2.1. Inclusion Criteria

Inclusion criteria were publications that reported the effects of urban landscape exposure on stress response in humans. Studies were deemed eligible if they met the following inclusion criteria: (1) randomized controlled trials (RCTs) and non-RCTs comparing at least two groups; (2) empirical studies in an urban landscape context with at least one study site in a city with any kind feature of landscapes, either blue or green, public or not; (3) only outdoor landscape settings, indoor landscape, and plants were excluded, but viewing outside landscape through windows from inside buildings are included; (4) a mixed-method approach to the assessment of stress using both physiological parameters and psychological scales to stress; (5) only studies with sedentary and light physical activity were included.

2.2. Exclusion Criteria

The exclusion criteria applied in this study were as follows: (1) exclusion of participants with a history of specific illnesses such as endocrine, neuropsychiatric, salivary gland disorders, or acute/chronic pain, as well as those using medication for asthma, blood pressure, or diabetes; (2) exclusion of studies that utilized artificial landscapes or landscapes located outside of urban areas. Furthermore, studies that were not peer-reviewed or published in journals without an impact factor were also excluded.

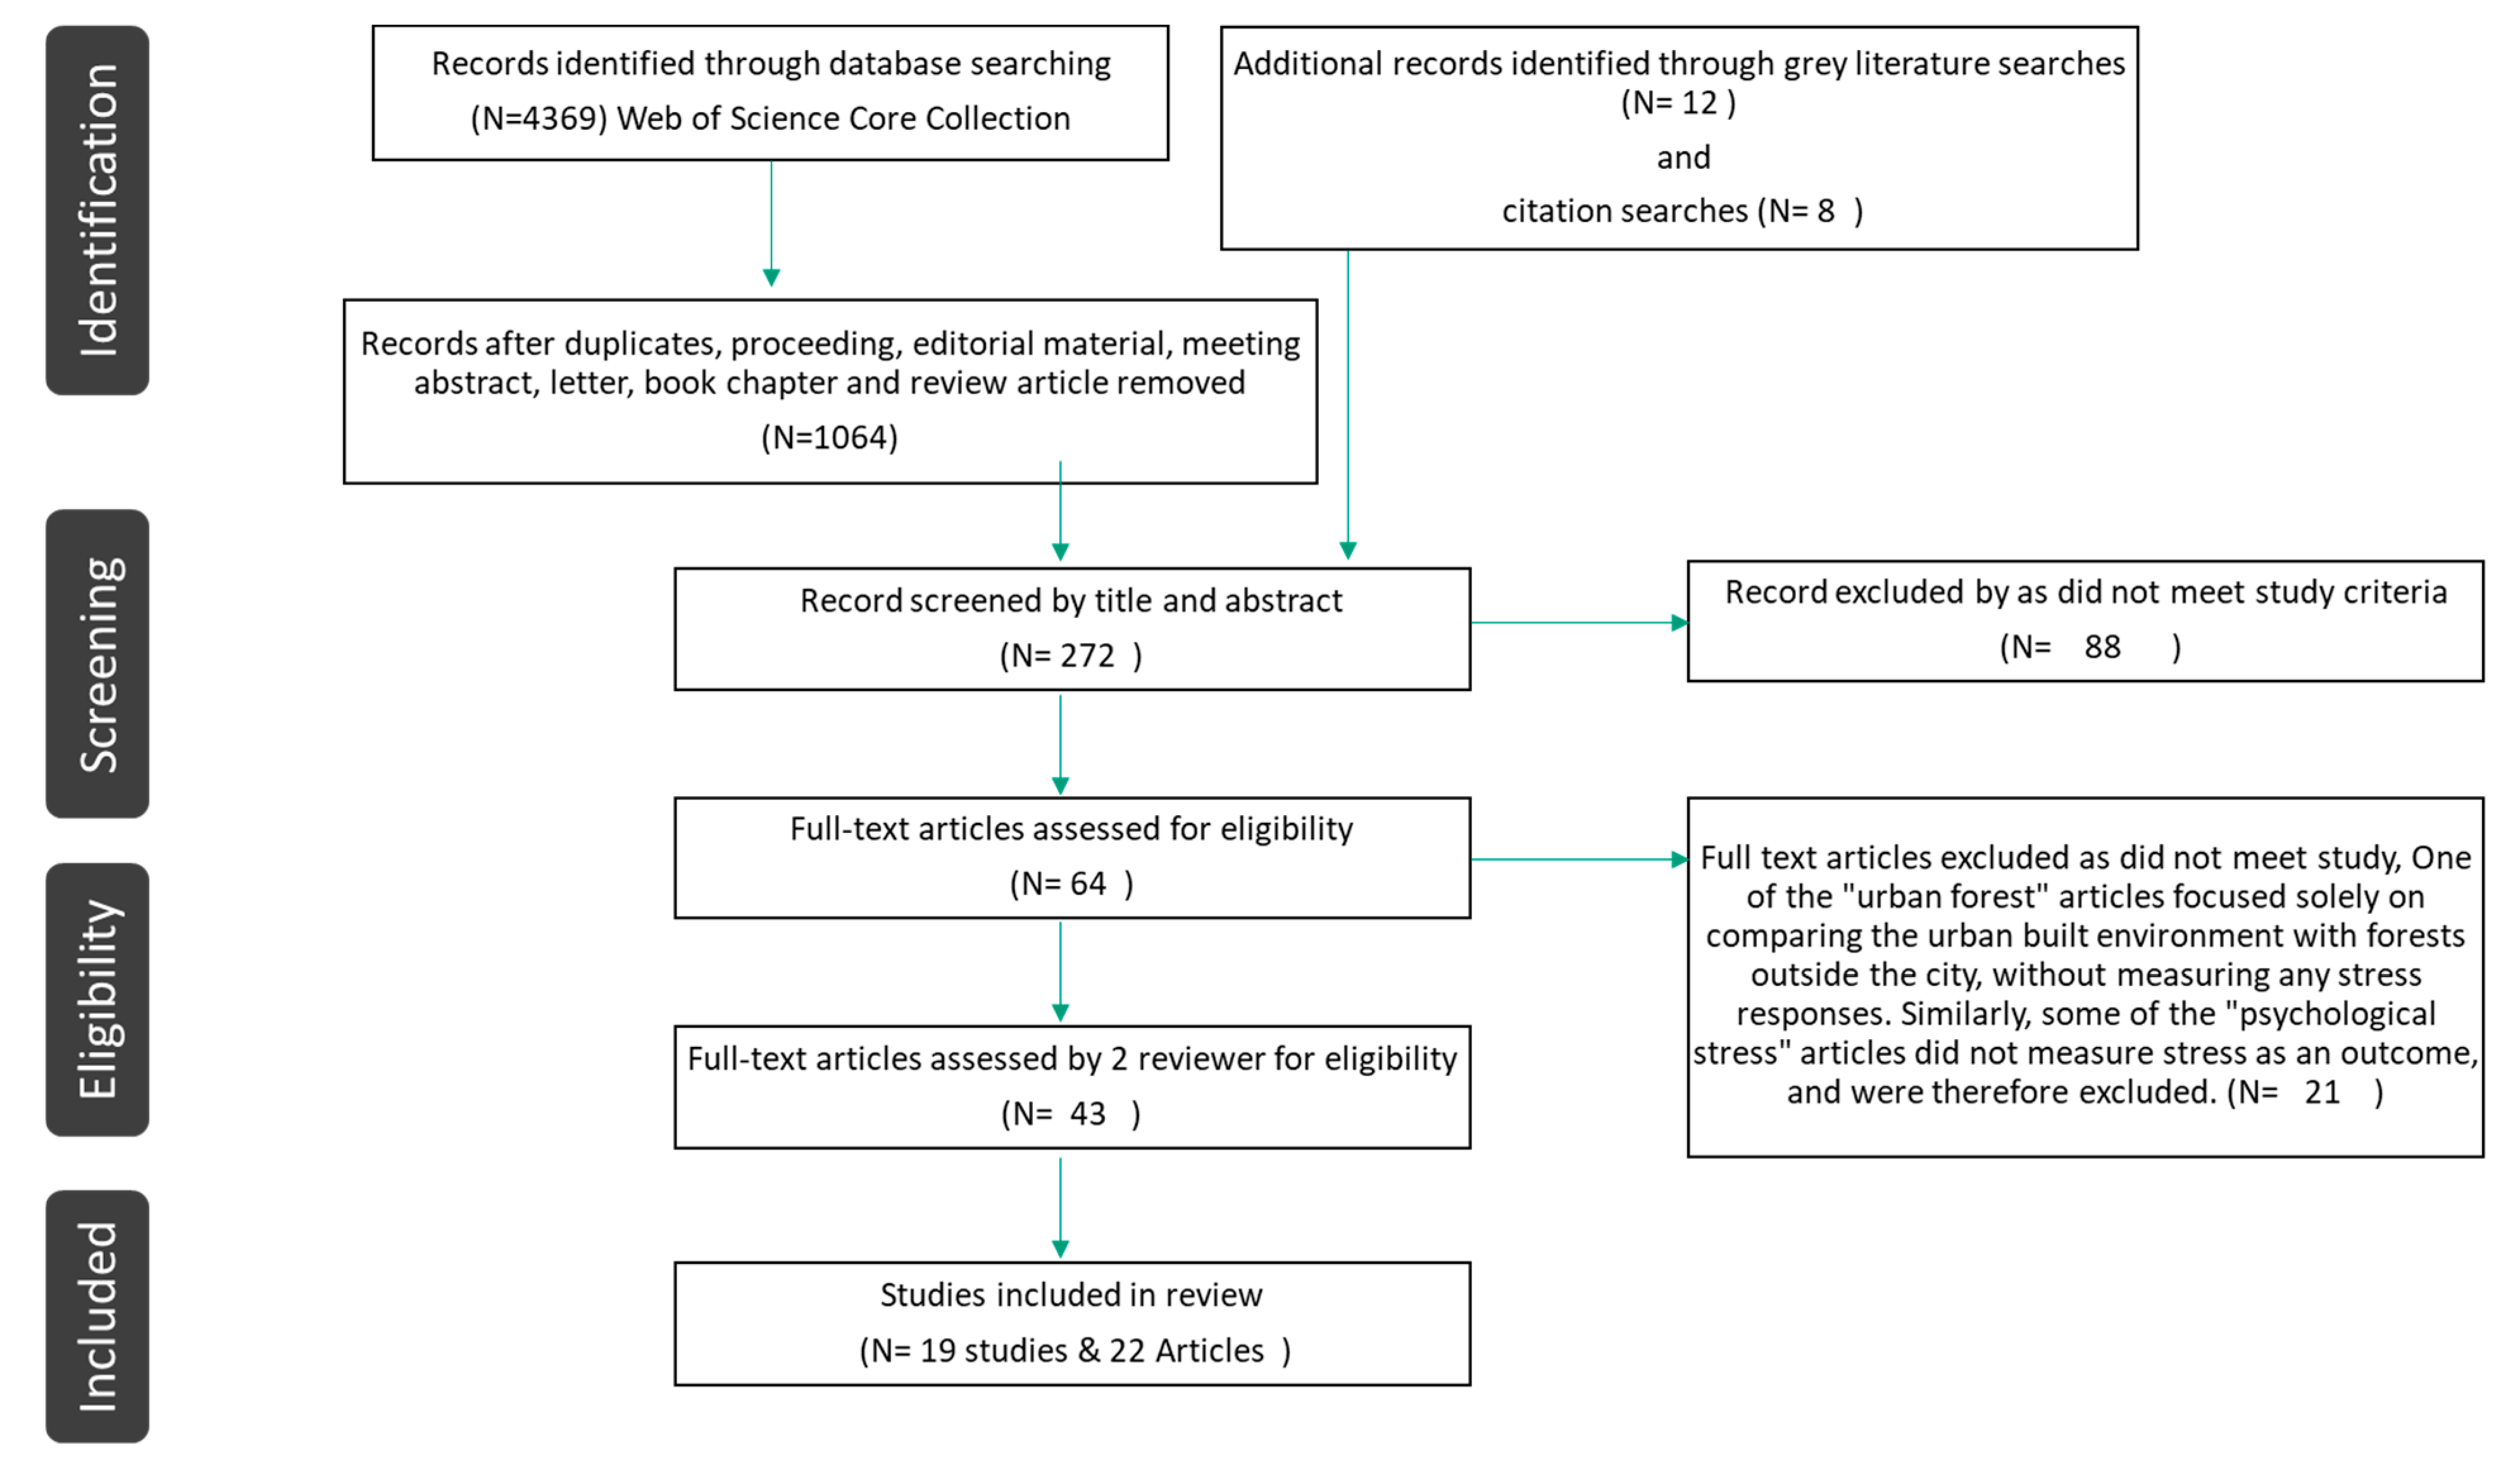
2.3. Search Strategy and Data Collection

The present study aims to examine how landscape intervention is presented and measured in mixed-method psychophysiological stress studies within an urban context. To achieve this, we conducted a thorough search of the Web of Science Core Collection and PubMed databases, covering the period from 2012 to 1 February 2022. We did not set any restrictions on publication dates within this period and used Endnote X9 reference manager to save all references in a well-organized thematic sorting system. Our search used a standard Boolean search phrase with syntax tailored to each database, including the search terms outlined in Table A1. We focused on studies that measured biological indicators associated with both physiological and psychological stress responses, as well as self-reported psychological indicators and scales related to mood, anxiety, distress, and perceived stress (or at least one of their subscales related to stress). We included studies that measured these responses in relation to any outdoor landscapes, including those viewed through building windows. We only selected studies where stress was the primary outcome of interest and excluded those that assessed stress as a mediator of other health outcomes.
To ensure we identified all relevant articles, we conducted additional hand searching of the available literature reviews. First, we removed any duplicated or non-peer-reviewed articles from our search results. Next, two reviewers (LL and KWL) screened the titles and abstracts of the remaining articles to decide on their inclusion in the final sample. Finally, we used eligibility criteria to eliminate any additional unrelated articles once we had identified the full-text articles through the screening procedures. Throughout the entire process, we adhered to the PRISMA guidelines [18].

3. Results

A comprehensive literature search was conducted using Web of Science Core Collection and PubMed (NLM), resulting in 4369 papers. After removing duplicates and articles that did not meet the study’s field and criteria, 64 articles were subjected to title screening. Following abstract evaluation by two reviewers, 43 articles were selected for full-text screening, and an additional 20 articles were identified through other sources, such as bibliography citations. Ultimately, 19 studies published in 22 articles were included in the final review, as shown in the PRISMA flow diagram in Figure 1. Of these articles, sixteen studies were identified during the initial search, and three were found through additional searching. Table A2 lists the case numbers, objective of study, and study country of included studies. Extracted data for each study, including the study’s type of green infrastructure, participant background, sample size, landscape intervention and metrics, psychological and physiological stress measures, and health outcomes, can be found in Table 1. Study design varied, with four studies using a randomized controlled trial (RCT) design, four using a cross-sectional design (CST), and seven using a quasi-experimental design. Overall, this review includes 19 studies represented by 22 articles.

3.1. Characteristics of Selected Studies

3.1.1. Location

The majority of the studies included in this review were conducted in the United States (N = 5) and the United Kingdom (N = 4), followed by Germany (N = 3), New Zealand (N = 1), Finland (N = 1), China (N = 3), and Japan (N = 2). Two studies built upon previous publications, utilizing different stress measurements or collecting data at different time points but focusing on the same study sites. Apart from three studies [19,20,21] that lacked sufficient information regarding their study sites, detailed locations of the selected studies are provided in the table below (Table 2).

3.1.2. Research Questions and Objectives

In the review of selected 22 articles and 19 studies, several research questions and objectives were identified. Three studies aimed to investigate the impact of landscape views on stress reduction, specifically by looking at greenery visible through high school classroom windows [21], high-rise windows [22], and participants’ homes [23]. One study with two articles were focused on examining the relationship between personal stress and quantitative levels of urban neighborhood greenspace [24,25]. Four studies explored the potential stress-reducing effects of various light physical activities in green spaces, including home gardening [20], comparison of walking and sitting [26], and participation in green walking tours [27]. Two studies aimed to develop wearable stress-measuring devices to assess the impact of different landscape places on real-time stress levels [28,29,30,31,32]. Two of these studies specifically focused on the effects of viewing different landscape elements, such as colorful blossoms and greenery in urban parks [33]. Finally, seven studies compared the effects of stress associated with different levels of naturalness in specific urban sites [17,19,34,35,36,37,38].

3.1.3. Participants

All the studies reviewed in this article enrolled healthy participants, with sample sizes ranging from 11 to 164 individuals and an average of 62.8 participants. There was significant variation in participants’ age, with a range of 14 to 85 years (mean 33.4 years). The study populations included high school and university students, local full-time employed workers and professionals, socially disadvantaged groups with low income or without employment, home and allotment gardeners, park visitors, and retired elderly individuals with low income. Neighborhood residents were the most commonly studied group (N = 8 studies). Most studies included both male and female individuals, except for four studies that enrolled only female [22,36] or male students [30,31,32]. Importantly, the studies selected for this review included participants from a wide range of ages and occupational statuses, which enhances the generalizability of the findings.

3.2. Urban Landscape Characteristics

The selected studies identified three levels of factors that characterize the potential of urban landscape features in affecting stress-related health: types, functions, and activities. Specifically, all studies identified specific types of urban landscape characteristics such as parks, gardens, and nearby greenery. In addition to the landscape characteristics mentioned above, two studies focused on viewing different elements of landscape, such as colorful blossoms and greenery in urban parks by different seasons [33], and 13 different levels of plant species richness [38]. Additionally, 12 studies addressed the functions of urban landscapes, such as visual meditation, gardening, light physical activity, and social interaction. Four studies analyzed the long-term stress response of residents to the coverage of nearby greenery or green space. Table 3 provides more detailed information about the specific landscape characteristics included in this review.

3.2.1. Types of Urban Landscapes

The definition of urban green space and its impact on health and well-being lacks universality. The European Urban Atlas map provides the most commonly used definition from a city-scale top-down perspective, which includes public green areas such as gardens, zoos, parks, suburban natural areas and forests, or green areas bordered by urban areas managed or used for recreational purposes. In the studies analyzed, the types of urban green space were usually categorized into two groups: public access and vegetation cover conditions. The first category emphasizes public accessibility and usage possibility, including public parks, gardens, playgrounds, water bodies, and streets. The second category takes only greenery and vegetation exposure into account [39]. However, some studies argue that non-public vegetated areas and water bodies are still natural and play an essential role in providing a city’s ecological, social, and economic services.
The present review’s definition of landscape types includes all natural features, regardless of color, size, vertical and private greenery, covering scales, and types of landscape from a nearby neighborhood to the whole city scale. These include nearby greenery exposure, private greenspace, urban public greenspace, and freshwater. Table 4 compares most landscape interventions that were designed to compare different levels of naturalization settings. For example, some studies compared naturalized landscapes, such as a natural park, with artificial built environments in city centers (N = 9). Others examined the effects of green school or university campuses (N = 3), landscapes next to a house working place or within 3000 m (N = 5), and home and allotment gardens (N = 2). In addition, four studies [17,23,28,38] using a healthy city perspective drew attention to blue-green infrastructure (BGI). BGI has been recognized for its crucial role in the development of the urban green network structure [40].

3.2.2. Functions of Urban Landscape

When studying the health effects of urban landscapes, researchers often select specific green spaces based on their objectives and characteristics. However, it’s important to recognize that urban landscapes serve multiple functions and offer multidimensional benefits to city dwellers. For example, one study emphasized that psychophysiological stress is often associated with physical activity, social interaction, and air quality [41]. Green spaces can simultaneously provide benefits in these three areas. Furthermore, different forms of landscape contact exist, varying in spatial scale, proximity, sensory pathways (visual, auditory, olfactory, gustatory, and tactile), individual activities, and levels of perception.
To examine the quality of landscape functions, two commonly used methods are landscape visual assessment and landscape preference/value analysis [42,43]. These methods are interrelated, as landscape preferences are linked to the adaptive pathways of the surrounding environment and are influenced by visual perception and stimulation [44]. The surrounding environment is dynamic, influenced by spatial–temporal changes, microclimate (air quality, wind, sunlight, etc.), and direct and indirect interactions with other people or animals [45]. Based on previous research and theoretical considerations, we identified five functions for analyzing the selected studies: visual stimulation (being within urban green areas or viewing greenery through a window) [46], light physical activity (such as walking) [47], social coherence, nature connection (awareness of biodiversity, rich species), and sensory meditation (creating a sense of refuge) [48]. These functions have been widely recognized as important dimensions of the human–nature relationship and have been shown to contribute to stress reduction and well-being.
In Table 4, we illustrate the landscape functions addressed in each of the 19 studies supporting stress reduction. In addition, we conducted content analysis to examine the information and measures provided in each article regarding the landscape context and environment surrounding the study site, as well as the frequency of participants’ visits and duration of exposure.
Promoting social coherence is recognized as a crucial function of urban landscapes in relation to stress reduction [49]. However, only one of our selected studies encouraged social interaction among participants in a park setting, with interactions recorded through a questionnaire [37]. To foster engagement with the environment and potential interaction with others, participants were asked to avoid using smartphones or reading during the sessions. The most frequently studied function among our selected studies was visual stimulation, with its effect on stress reduction measured in ten studies. Among these, five studies compared viewing to walking or gardening as a light physical activity [23,26,35,37,47]. Additionally, nature connection emerged as an important function of urban landscapes, and four studies aimed to understand participants’ experiences through questionnaires, such as the Nature Relatedness Scale [28,34,47,50]. All studies that focused on multiple urban landscape functions demonstrated positive effects on stress reduction.
Table 1. Main characteristics and results of the studies on urban landscapes and stress responses.
No.Participants + TypesActivity & DurationFunctionsUrban Landscape TypeControlPsychologicalPhysiologicalStress Responses
1.
[21]
94 high school students + campus window viewDuring the 10 min break viewing campus greenery through the windowsViewing(1) Green window view of campus(2) Gray
(3) No window view classroom
VASECG HRV
BVP
BT
BVP
HRV-Positive response during 10 min break
Green view > gray view
2.
[22]
30 working females + high-rise window view + urban park2 min rest
3 min green window view
5 min self-repost
2 min rest
3 min urban view
Viewing(1) Green view to urban park(2) urban viewSD
POMS
Emotiv EPOC+EEG
HRV
SC, EDA
EEG green > urban
HRV urban > green
SC urban > green
POMS/TMD vaule: urban > green
3.
[23]
32 residents + nearby greenery
(1)
Window views from home
(2)
Use of public green and blue spaces
(1)
Viewing
(2)
Non-defined
High (%PGC ≤ 500 m/p) + small urban parksLow (%PGC ≤ 500 m/p)+ canal blue space along the vegetated trail neighborhood site SF
IPCS
LS
Hair CortisolView:
(1)
Cortisol: high vegetation quality and diversity > high vegetation quality and low diversity
(2)
LS & SF: No significant differences
Use:
(3)
Cortisol: canal with a vegetated trail > Park A > Park B, no significant differences found from park users and the degree of activities
(4)
SF: often used trail
4.
[20]
42 residents + nearby greeneryFront home garden horticultural intervention over 3 monthsGardeningA front home garden intervention block residents Bare front gardenPSS
SWEMWB
PAL
Salivary cortisol (3 times/2 days)PSS (+)
Cortisol slope(steeper) (+)
5.
[34]
106 residents + nearby greenery% greenspace in each deprived participant’s neighburhoodNon-definedHigh % PGSLow % PGS PSS
SWEMWB
Salivary cortisol
(4 times/2 days)
PSS: high > low, no garden male has negative effect.
Cortisol (Steeper): high > low, elder group living in high% has significant positive effect; low % male group has negative effect.
Age was a significant predictor
6.
[19]
164 university workers and students+ a sensory garden30–40 min @ 1–3 times/4 weeks X 2 sitesNon-definedA species-rich sensory(SG) groupUrban plaza (UP) group
Control groupPre–post
SPANE
HPQ
FS
Pre–post salivary cortisol and amylasePSS: (+) SG > UP
HPQ: (+)
F.S.: (+)
Cortisol: (+)
7.
[50]
105 randomly selected visitors in 3 different sitesAfter visiting (any light activities) urban park (average staying 68.3 min)Non-definedA. Natural park (non-urban)B. Urban parkC. Indoor sport areaPre–post
PSQ
Pre–post salivary cortisol and amylasePSQ: A > B > C
Cortisol: A (+), B,C (/)
Amylase: C (−), AB (/)
8.
[27]
52 low income people visited a regional park eventAfter visiting (walking) a regional parkWalking2 guide walk events in a regional park
Rural vs. urban park
Pre–post
PSS
SPANE
RRS
Pre–post Salivary cortisol
Heart rat(HR)
PSS (+)
Cortisol (+)
HR: (missing data)
9.
[50]
15 community neighbors visiting 4 different level landscape areas20 min one-time visit of 4 sitesSitting and viewingA. Natural areaB. Urban parkC. Plaza
D. shopping area
Pre–post
PSS
EID
PRS
Pre-in–post salivary cortisol
(3 times)
PSS: (+)
Cortisol (+)
10.
[35,36]
77 + 36 female workers visiting 3 different sites15 min viewing
30 min fixed walking route
@ 3 different sites
Viewing
walking
Urban woodlandUrban parkUrban shopping areaPre–post
FOAS
ROS
PRS
PANAS
SVS
C.S.
Pre–post cortisol (P = 77)
ECG (P = 36)
ROS, PRS, SVS, CS: (+)
PANAS: (+)
Cortisol: B > C, A vs. B no difference, no gender difference
ECG: (+)
11.
[28]
36 local professional, first time visiting the wetland siteSitting and viewing
10 min at 3 different areas in the wetland center
Sitting and viewingUrban wetland siteStreet sidewalk siteIndoor siteHRSI
DASS
PANAS
Emotiv EPOC + EEG wristband
PPG
EDA
DASS: −
PANAS: (+)
HR: (+)
ECG, HRV, RMSSD, TINN: (−)
12.
[26]
40 university students, visit 2 campus sites8 min sitting or viewing at bamboo forest area after high stress tasks in the classroomSitting vs. walking+ viewingWalking (WG) vs. at bamboo forest on campusSitting group (SG) Pre–post
STAI
EPOC+EEGSTAI: (+)
(Inconsistent)
13.
[38]
33 mixed gender young (25) students visiting 13 seleted urban green spaces3 min sitting in 13 different urban spaces 13 typical sites selected based on low and high degree of plant richness/speciesRoad networkPRSEDA
EMG
RESP
SKT
PPG
PRS (+) for all 13 sites
EMG (+) high plant species
Strong correlation between physiological and PRS indicators
14.
[29]
11 retired low income elders walking around nearby greeneryOnce each day, 15 min walking around green or gray routes in a neighboring areaWalkingGreen routeGray route Pre–post
UWIST
MACL
SWEMWBS
CF
SRT and MR task
HR(Smart watch)
HRV
PPG
HRV: (+)
SWEMWBS: (/)
15.
[17]
38 residents + nearby greeneryWalking 30 min along 3 different levels of landscapesWalkingA. ParkB. Blue footpathC. Urban quiet residential streetsPre–post
SF, PSS (baseline)
TMD
ROS
CF
Salivary
HRV
HR
RPE: A > C > B
HR: A > C > B
TMD: (/)
BDST: A = B > C
HRV: (/)
Cortisol (/)
NR: no linking with ROS & CF
16.
[37]
33 average 63.5 young elders visiting 3 sites15 min sitting
30 min walking at 3 different levels of urban areas
Sitting
Wallking
Old parkNew parkStreet areaPOMS
ROS
HRV
Portable ECG
Sitting
HRV(SDNN, RMSSD, HF): urban street (↓)
systolic blood pressure sitting (/)
POMS: TMD urban street(↑) 2 parks(↓)
17.
[33]
12 young elders (66.4) viewing cherry blossoms and fresh greenery in urban parks11–15 sitting and viewing scenes at 3 different scenesSitting
Viewing
Urban park site in spring (cherry blossoms)Urban park site in early summer(freh greenery)City area sitePOMS
STAI
BP
HR
POMS: (+)
BP: (−)
HR: (+)
18.
[30,31,32]
13–20 university students, visit park once in spring, fall, and winterWalking 15 min along park and urban street sidewalkWalkingParkUrban sidewalk next to the park POMS
STAI
ECGHR: (+)
HRV: (+)
LF/HF: (+)
19.
[47]
85 gardening beginners self-reported recent activities in green spacesLast 4 weeks, amount of time spent doing 4 different types of activities in 5 different types of landscapesSelf-reported 5 different activitiesDoing nothing
Light physical activity
Intense physical activity
Social interaction
SSCS
SCI
LSE
SF
POMS
Hair CortisolCortisol (+)
(+) positive effect; (−) negative effect; (/) no difference effect; (↑) value increased (↓) value decreased. Abbreviations: PGC: Public Greenery Coverage; PGS: Public Green Space; AUCg: Total Daily Salivary Cortisol; BVP: Blood Volume Pulse; CCL(t): Changes in Salivary Cortisol Levels; CSP: Cortisol Slope Profiles (managed times); DASS: Depression, Anxiety, and Stress Scale; ECG: Portable Electrocardiography; EDA: Electrodermal Activity; EEG: Electroencephalograpy; EID: Environmental Identity; EMG: Facial Electromyography; FS: Flourishing Scale; HR: Heart Rate; HRV: Heart Rate Variability; IPCS: Inventory of Perceived Chronic Stress; LS: Life Satisfaction; NRS: Nature Relatedness Scale; PAL: Level of Physical Activity; PPG: Photoplethysmography; PRE: Rate of Perceived Exertion (Borg scale for exercise intensity); PSS: Perceived Stress Scale; PRS: Perceived Restorativeness Scale; PPG: Photoplethysmography; RESP: Respiration Sensor; ROS: Restoration Outcome Scale; SCL: Skin Conductance Level; SF: Short Form Health Survey; SWEMWB: Short Warwick and Edinburgh Mental Wellbeing Scale; SL: Skin Conductance; SPANE: Scale of Positive and Negative Experience; TMD: Total Mood Disturbance; TSST: Trier Social Stress Test; VAS: Visual Analogue Scale.
Table 2. Study Cities and Sites in Selected Studies.
StudyStudy CityStudy Sites
#1Illinois, U.S.Two urban school campuses compared to three suburban school campuses
#2Shanghai, ChinaAn office building located next to a city park
#3Berlin, GermanyTwo residential blocks situated near different sizes of green infrastructure
#4Salford, U.K.Two residential blocks implementing a front garden intervention with plants and planted containers
#5Dundee, U.K.Comparison between areas with low green space and areas with higher 43% green space in participants’ living areas
#6Auckland, New ZealandA sensory garden at the Auckland University of Technology campus
#7Midwest U.S.Contrasting natural, semi-natural, and urban built environments
#8San Francisco, U.S.Bay area residents visiting a regional park
#9Portland, U.S.Local community of the National College of Natural Medicine visiting different levels of green space areas
#10Helsinki, FinlandWorkers from the Natural Institute for Health & Welfare visiting an urban park, large urban woodland, and the city center
#11London, U.K.Visiting the Wildfowl & Wetlands Trust Center
#12Ya’an, Chengdu, ChinaUrban green space surrounded by a bamboo forest at Sichuan Agricultural University
#13Linpu, Fuzhou, ChinaWalking through 13 different types of urban landscapes in the coastal city, including blue landscapes
#14Richmond, Virginia, U.S.Walking in a busy urban "gray" district vs. an urban "green" district in a quieter residential district with front gardens, street trees, and a pocket park
#15West Midlands region, U.K.Residents living around Staffordshire University, visiting urban streets, a country park, and a footpath beside a canal with natural vegetation
#16Leipzig, GermanyThree sites included Friedenspark, Lene-Voigt-Park, and an urban street area around Ostplatz square
#17Matsudo, JapanForest and Park for the 21st Century (FPC) within an urbanized city, featuring green and blue landscapes
#18Kashiwa, JapanKashiwa-no-ha Park in winter, spring, and summer
#19Bern, Basel, and Schlieren, SwitzerlandSelf-reported recreational activities and exposure to nature at home and work, specifically measuring time spent in different types of gardens
The numbers #1.. in the table represent the identification numbers for each study. For more detailed study titles and author information, please refer to Appendix A Table A2.
Table 3. Overview of landscape type characteristics.
Type(s) of Space IncludedWays of Contact (for Study Numbers See Table A2)
Sitting or ViewingWalkingOther or Undefined Activity
Nearby greeneryWindow green viewNo.1, 2
% landuse, NDVI, % trees3 5
Private greenspaceResidential gardensPrivate gardens, front or back yards 4, 19
Functional/amenityAllotment, cemetery, amenity spaces, Institutional (university, school, hospital grounds, etc.)1, 116, 1119
Urban public greenspaceFormal recreation civic spaceSquares, gardens, playgrounds and sports fields (not within parks), zoo9619
ParksNeighbor park 3, 19
Urban park7, 9, 107, 10, 15, 16, 183, 7, 19
Regional park9819
Natural/green corridorGreenway, pathways, trails, and cycle paths 2, 19
Semi-natural/naturalBiodiversity areas, conservation areas, nature reserves, protected areas12 5, 19
Other natural featuresStreet greenery: street trees, pocket parks, green roofs, and vertical greenery 1619
Landscape elementsPlants species, seasonal plants12, 1712
Freshwater Lakes, ponds, wetlands (standing water bodies)11
Rivers, streams, canals (linear water features)15 4, 19
NDVI: Normalized Difference Vegetation Index (NDVI). The numbers in the table represent the identification numbers for each study. For more detailed study titles and author information, please refer to Appendix A Table A2.
Table 4. List of landscape interventions, measurements, and functions of the selected studies.
NoLandscape ContextGeographic & Mico-Climate InformationIntervention & ParticipantContact Function FocusSubjective MeasureObjective Measure
TypeElementLocationSizeSurrounding SourcesMicroclimateChanges (Daytime, Season)Intervention vs. ControlDurationFrequencyAccompanyVisual StimulationPhysical ActivitiesSocial CoherenceNature ConnectionParticipant Self-ReportExpert AssessmentQuantityQuality
1 School CampusGreen, gray, no window view10 min
(break)
User-LP
2 Nearby WorkGreen, urban window views3 minUser-
3 Nearby Home2 different blocks of residents4 mon.
(Q)
User-SemiQ: F3D% GP
4 Home2 different blocks of residents and years3 mon.
(G)
User- SemiQ: PN
5 Nearby HomeResidents in a high vs. low %PGP area>30 min
(Q)
User (4 weeks recall)-% PGP
6 University CampusSensory garden vs. urban plaza vs. control30 min
(each)
4 weeks8NR-21DCMSA
7 ParksWilderness vs. urban park vs. indoor fitness54.4–68.3 min1–3 times/week-
8 Parks2 different events in the same park2 h
(event)
18
9 UPGsNatural vs. park vs. plaza vs. shopping areas20 min
(each)
4 sites (non-consecutive 4 days)3–4EIDFGD
10 UPGsUrban nature vs. park vs. city center15 + 30 min
(V + W)
All 3 sites one time (N: 86%)4
11 WetlandUrban wetland vs. urban street vs. control10 min
(each)
3 sites in one day-NR-21FGD
12 University CampusWalking vs. sitting group at a bamboo forest site8 min
(each)
User?
13 UPGs13 landscape types90 min13 sites in one day-
14 Nearby HomeGreen (sidewalk of the park) vs. gray walk (heave traffic)15 min
(total)
User
2 days
5–6% land-use cover
15 UPGsPark vs. green + blue trail vs. residential street30 min
(total)
3 sites (non-consecutive 3 days)?NR-6
16 ParksDiesty greenery vs. new park vs. stress15 + 30 mins
(each)
3 sites in one day4
17 ParksSpring bloom vs. summer green3 min
(each)
3 sites in one day2–4
18 ParkSpring vs. fall vs. winter group @ one park30 min
(total)
One time11
19 UPGsPassive vs. light vs. intense vs. social activity>30 minUser (4 weeks)-
We categorized the outcomes into three levels of information or measurement quality using symbols (● Strong ♁ middle ○ weak). Abbreviations: UPGs: Urban Public Green Spaces; MSA: Morphological Species Approach/Biodiversity); FGD: Focus-Group Debriefing; DC: Garden Design Concept; F: Frequency of Nature Usage; PN: Perceptions of Local Nature; PGP: Public Green Space; NR: Nature Relatedness Scale.

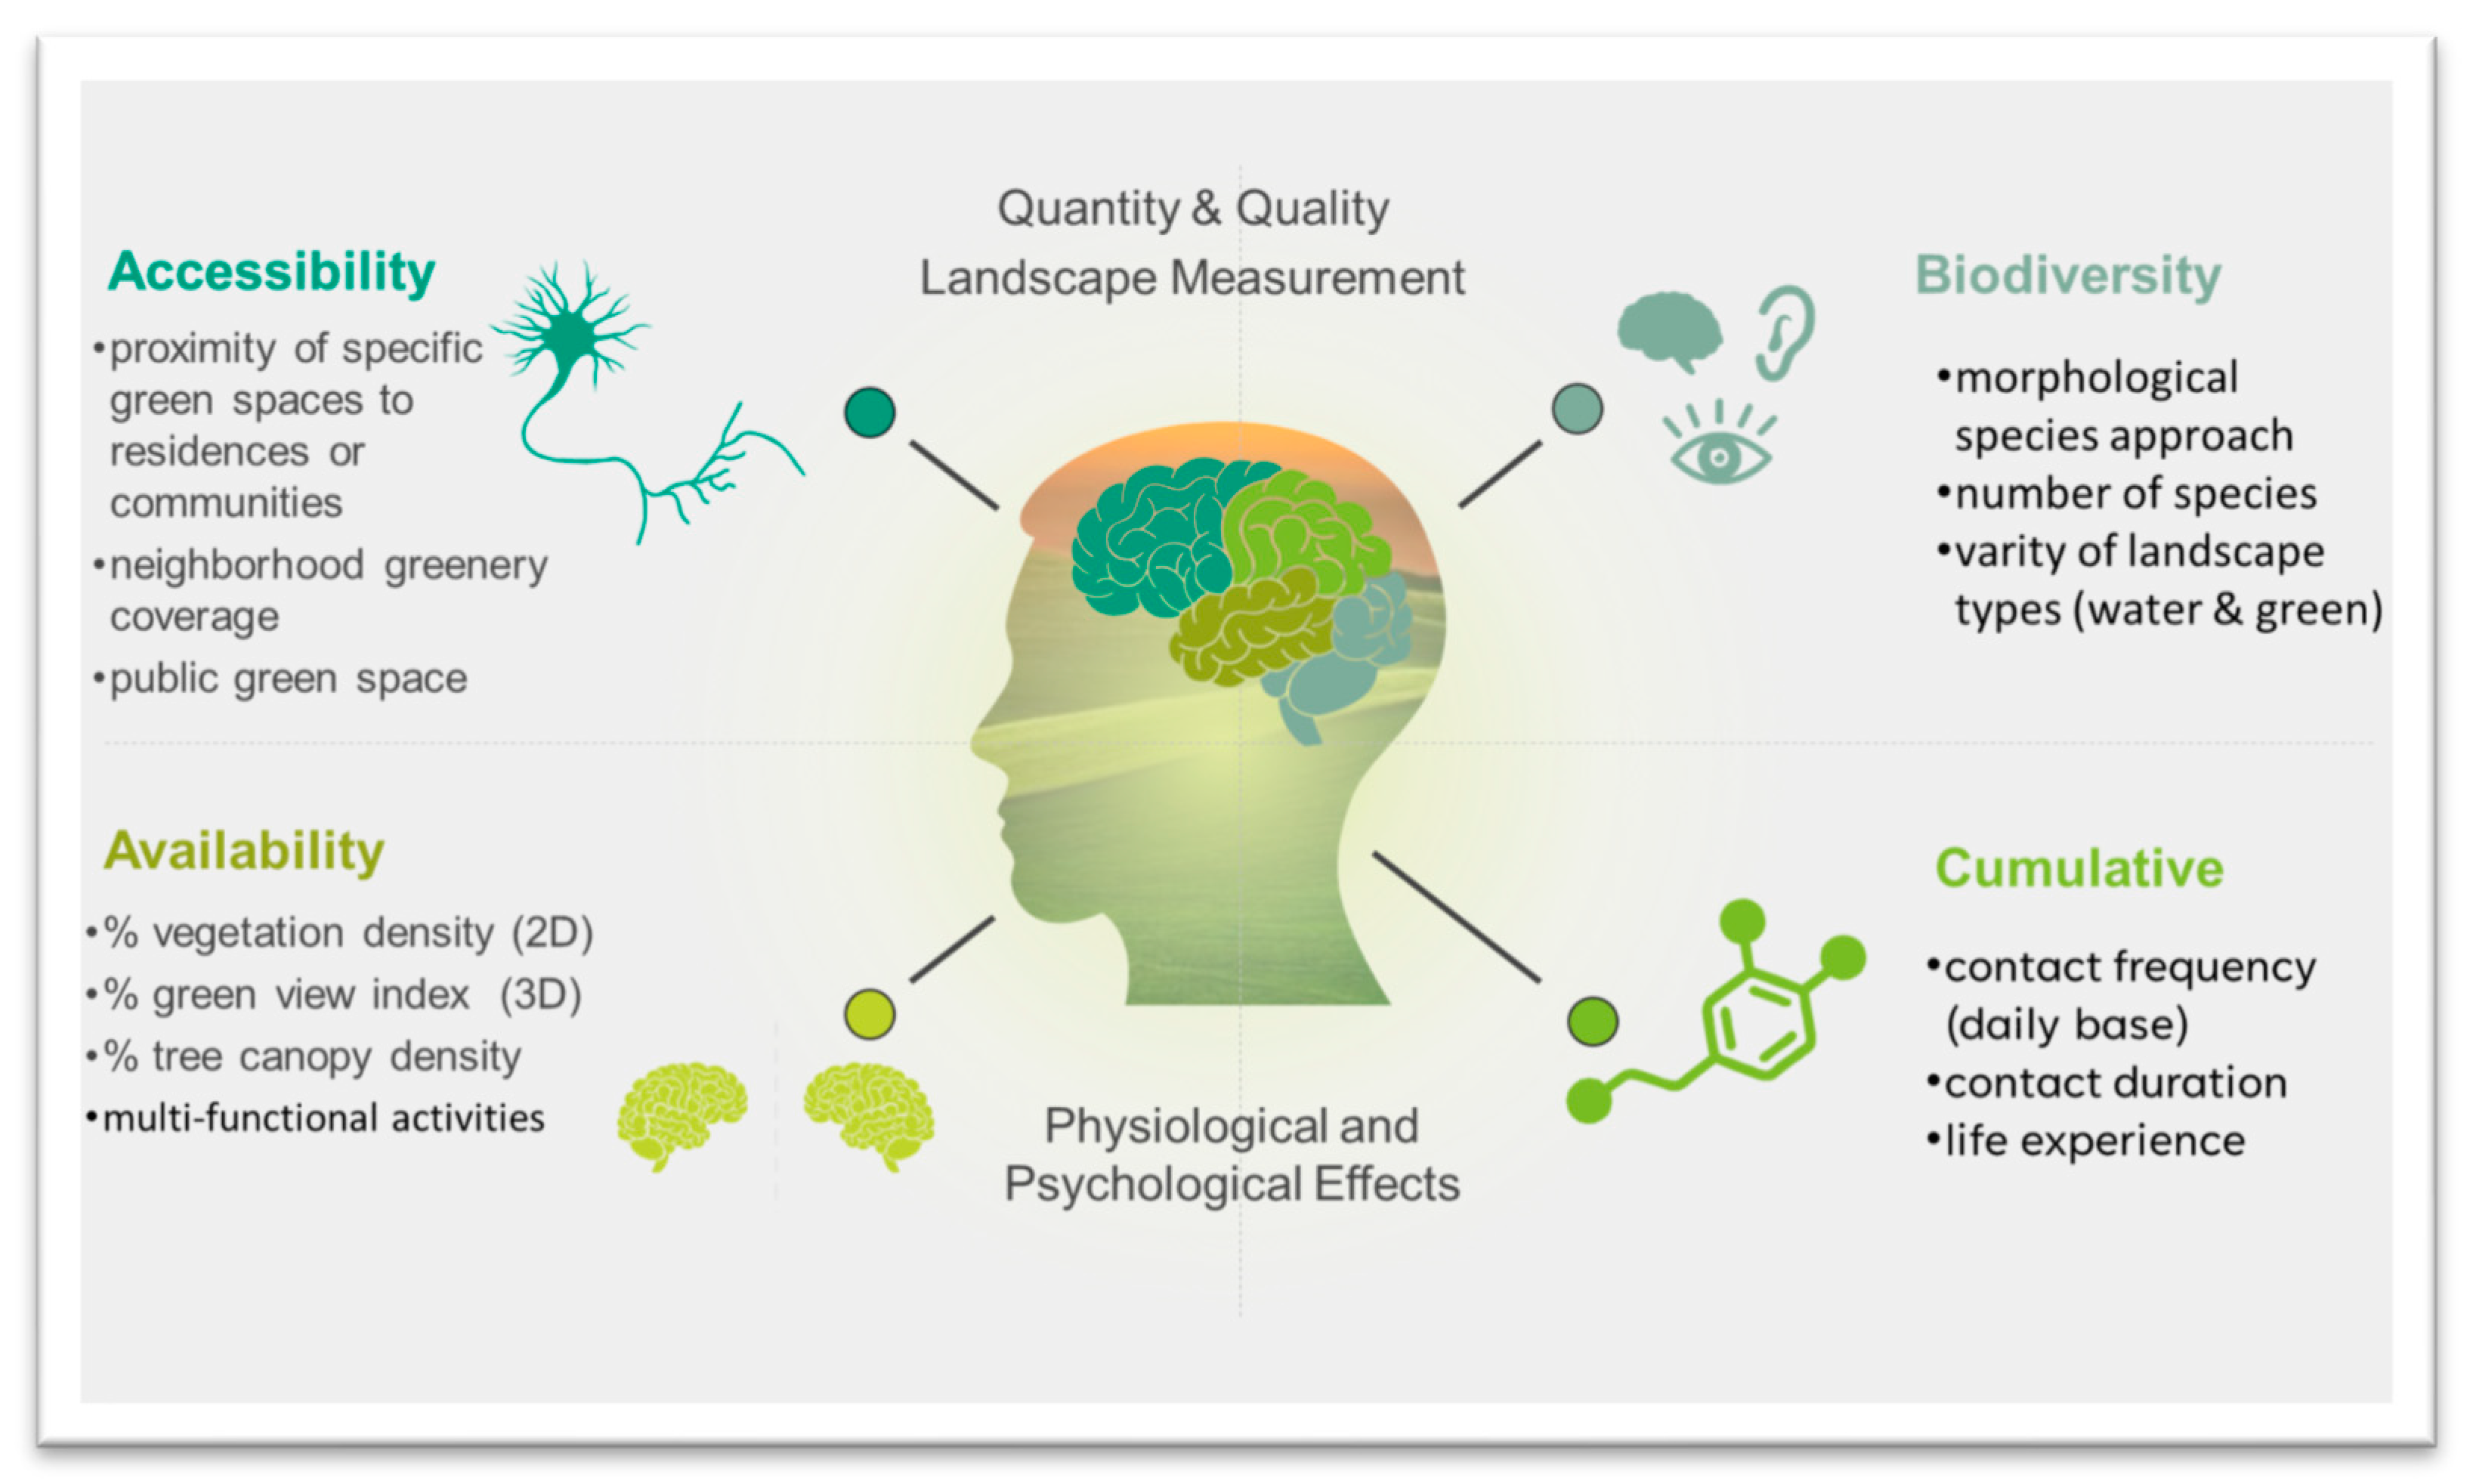
3.3. Subjective and Objective Measures of Landscape

In an effort to better understand the landscape features that elicit mental health benefits, an integrated review conducted by Barnes et al. (2019) recommended considering three significant aspects in health study design: (1) geographic information of the site and surroundings, (2) size, type, and elements of green space, and (3) local climate and seasonal changes [13]. Detailed information or photographs of the experimental site and its surroundings that participants would view or encounter during exposure should be provided, including the exact geographic location and a map of the exposure routes. A commonly known name with a landmark reference should be reported if no formal name exists. The boundary, size, and types of landscapes and surrounding areas, including the type and density of adjacent environmental features, such as buildings, roads, lakes, and sources of noise and air pollution, should also be defined.

3.3.1. Geographic and Micro-Climate Information

To ensure comprehensive understanding and accurate interpretation of experimental studies, it is crucial to provide detailed information and visual documentation of the experimental site and its surroundings. This includes precise geographic coordinates, a map illustrating exposure routes, and familiar landmarks as points of reference. Additionally, a clear delineation of the study area’s boundaries, size, and landscape types is essential. It is important to identify and describe any relevant environmental features in the vicinity, such as buildings, roads, lakes, as well as sources of noise and air pollution. Furthermore, considering the influence of micro-climate and local seasonal conditions on outcomes, it is pertinent to include basic weather information for the day of the experiment. However, it is worth noting that while a few studies have addressed microclimate conditions and pollution, the majority of studies reviewed have predominantly focused on valid stress measures, neglecting the incorporation of objective landscape measures and the provision of detailed geographic and micro-climate information. The selected four studies have considered the relationship between stress recovery and urban landscapes by putting effort on detailed study design in providing precise location, landscape elements description [38], even measurements of temperature and humidity on experiment sites [33], and considered seasonal changes of landscapes [31,33,35].

3.3.2. Subjective Measurement (Self-Report) of Landscape Experience

Questionnaire-based studies and interviews are the most commonly used approach to assess and compare individuals’ preferences, behaviors, perceptions, or satisfaction with landscape experience in urban settings. User experience and engagement evaluation is a diverse and growing research area of environmental psychology, which is most evident in stress-related outcomes such as individual attitudes or preferences [51]. This approach is usually measured using participant self-report, interview, or expert subjective judgment.
(1)
Participants’ self-report
An advantage of applying subjective landscape experience measurement based on participants’ self-report is the potential description of a wide range of individual perceptions and experiences of landscape. In addition, surveys may sometimes include respondents’ geographic information, which we extracted from the selected articles and linked to questions concerning the following aspects:
  • Spatial references of frequent visits to green space areas;
  • The data of respondents’ daily landscape experience;
  • Accessibility and connectivity within an urban green network [23];
  • Views through windows of everyday used buildings.
As shown in Table 4, only one study in the present review was wholly based on subjective landscape measurement as a primary source of information [47]. However, this approach of asking participants to recall and report past behavior (e.g., regarding their green space exposure) is prone to bias. To reduce such bias, it has been suggested that questions should refer to short periods in the immediate past, using direct observation or successive questionnaires, each on shorter periods [47]. Another option is the use of standard assessment scales, which have been tested in a similar research field. For example, for the assessment of the relationships between nature-relatedness and stress-related health, three studies employed the Nature Relatedness Scale (N.R.S.) [25,34,36] as a self-report method to assess participants’ affective, cognitive, and experiential relationships with nature. This 21-item scale contains three subscales (N.R.S. Perspective, N.R.S. Self, and N.R.S. Experience) [52]. In addition, one study applied the Environmental Identity Scale (EID), which is related to environmental behavior and was first applied to a health-related study to measure individual differences with nature [50].
(2)
Expert judgment
In contrast to participants’ self-reports, another frequently used subjective landscape measurement is the evaluation by researchers with professional experience in the fields of landscape, ecological, or other relevant environmental studies. For example, to understand whether the vertical dimension of greenery exposure is associated with stress reduction, a study used expert evaluation for the assessment of four different indicators: vegetation quality, vegetation quantity, structural diversity, and vegetation diversity from 90 photos of window views taken by the participants [23]. In addition, we also classified expert design as a subjective expert measure approach. For example, in the case of a campus sensory garden for workers, the combination and arrangement of elements and spaces in the garden were developed using the salutogenic design principles that assist in sensory design [34]. Therefore, this conceptual principle and the design results can be used as one of the expert measurement methods.
(3)
Focus group debriefing
Two studies introduced a short focus group debriefing hosted by the researcher team after the experimental field trip to provide information about participants’ experiences with the individual settings [36,50]. For example, one was specifically interested in whether participants showed a preference for urban or wetland sites and whether they had experienced any physical or psychological discomfort or distress that might confound the outcome measures.

3.3.3. Objective Landscape Measurements

(1)
Quantity of neighborhood greenery coverage
Some studies have emphasized a more detailed data analysis regarding the proximity of specific green spaces to residences or communities. These studies usually reveal considerable variation in quantities and qualities of green space around each participant’s living or working area as well as different levels of access to greenspace or views of green surroundings. In such studies, green space was usually measured at a finer scale. Respective study recruitment is challenging and may include the following approaches: defining a specific residential area and conducting in-person door-to-door calls (place orientation); geocoding the residential addresses of study participants (participants’ orientation); identifying indicators for investigating the landscapes of selected neighborhoods.
A two-stage sampling design is often adopted in neighborhood-based studies. First, neighborhoods are purposefully selected in a city to maximize urban environmental and socioeconomic variation and comparison. Second, a random sample of participants is recruited from selected areas with geocoded information. The landscape indicators applied and presented with geographic information systems (GIS) and satellite imagery usually focus on regional vegetation coverage, surrounding tree canopy density, percentage of green space, greenery buffering zones (300 m, 500 m, etc.), and distance to parks. It is worth mentioning that none of our selected studies measured these buffering zones by using the most commonly applied measure in landscape–health-related studies, the Normalized Difference Vegetation Index (NDVI), a two-dimensional bird-eye used to measure an area’s greenness or living green vegetation. NDVI is an indicator of green vegetation density based on the difference between visible red and near-infrared surface reflectance.
(2)
Quantity index of green view
Only one selected study considered the index of green view from participants’ home windows [23]. As a result, the street view or vertical three-dimensional (3D) measurement replacing the previously mentioned bird-eye mapping has become popular in landscape-health studies.
(3)
Assessment of landscape quality
Quantifying the quality by several correlative indicators, such as biodiversity and the number of species, is another objective way to measure the quality of urban landscapes. However, only one of our selected studies used the morphological species approach (MSA) to calculate how many plant and animal species stay in the urban landscape site they studied [34].

3.4. Exposure Procedure, Duration, and Frequency

The amount of time that participants were exposed to urban landscape intervention and control environments or extreme natural environments ranged from 8 min to 3 months for a single intervention (see Table 4). Exposure time varied depending on what kind of landscape contacts were investigated. For example, a horticultural intervention assessing the change of a bare front garden to a finished garden lasted three months [20], and three studies used self-report to recall participants’ time spent in greenspace over the previous four weeks [19,23,25,47]. Furthermore, six studies examined visual stimulation effects by landscape exposure, with participants being either directly or indirectly (view through a window) exposed, which lasted 8–20 min. Regarding exposure frequency, only one study measured the effect of biodiverse sensory university campus gardens on work-related stress. This study used a 30-min appointment with nature once a week for four weeks [34]. Some studies assessed exposure frequency using questionnaires. Most studies (N = 9) invited nearby or on-site residents, workers, and students to understand how daily encounters with urban landscapes affect physiological and psychological measures of stress.

3.5. Stress Tasks and Type of Stress Measurements

3.5.1. Stress and Cognitive Task

Four studies introduced specific stress tasks before landscape intervention. Three studies used stress tasks, including the Trier Social Stress Task (TSST) [21], Trail Making Test (TMT) [26], and Backward Digit Span (BDST) [17], a measure of working memory. Roe and his coworkers (2020) [29] employed pre–post cognitive tasks. The Deary-Liweald computer-based Simple Reaction Time test (SRT) was used for pre-intervention. The Cognitive Memory Recall (CMR), a route-based sketch-mapping memory task, was used by participants and completed by participants immediately post-intervention on each route of the walking section [25]. The purpose of CMR is to assess remarkable features recognized after interventions. Five aspects (usability, accuracy, network quality, waypoints, and natural features) were analyzed descriptively, and the mean number of each subject recalled on the map was estimated [29]. Different from the above, Lin and his coworkers (2020) [26] implemented two phases of stress tasks. Before applying the task–TMT, a high-stress task was applied, which consisted of (1) foreign language translation and advanced mathematical calculations, and (2) connecting lines and putting random numbers to maintain the participants’ attention.

3.5.2. Types of Stress Measurements

Stress responses can be measured using physiological reactions, subjective feelings, and behavioral changes [53,54]. One of our inclusion criteria was that the studies must include both subjective and objective stress measures (n = 19). As shown in Table 5, ten studies included in the present review measured salivary (n = 8) and hair (n = 2) cortisol levels. Other physiological variables included cardiovascular measures, such as heart rate, heart rate variability, blood pressure [33], skin conductance level (N  = 1, [21]), and brain activity measured using electroencephalography (N = 7). Three studies did not find a significant favorable influence of urban landscapes on physiological stress restoration [17,28,35]. For example, Tyrvainen et al. (2014) [35], Gidlow et al. (2016) [17] measured stress levels objectively using cortisol concentration and HRV and compared the effect of different levels of urban landscapes (park vs. green/blue trail vs. street). These authors found no statistically significant differences regarding the fixed group walk routes [17]. Three studies used an Emotiv EPOC + EEG wristband carrier to measure ECG and HRV [22,26,28]. One among them did not find a significant difference in a 10 min sitting and viewing contact way at three different levels of nature in the urban wetlands [28].

3.5.3. Measures of Perceived Stress

In the present review, subjective psychological stress was measured using sixteen different measures in twelve studies, while six other studies used the subscale of emotional mood assessment [25,34,35,36]. The measures used for self-reported stress included the Perceived Stress Scale (PSS) and Perceived Stress Question (PSQ) (N = 6) [17,19,20,27,29,50], the State-Trait Anxiety Inventory (STAI) (N = 2) [21,30,31,55], the Screening Scale for Chronic Stress (SSCS) (N = 2) [47,50], the Inventory of Perceived Chronic Stress (IPCS) (N = 1) [23], and the Depression, Anxiety, and Stress Scale (DASS-21) (N = 1) [28].
In addition to self-reported stress, three studies assessed mood using two instruments: the Scale of Positive and Negative Experience (PANE) and the Mood Adjective Checklist (MACL). The PANE measures perceived stress [34,35] with three items assessing positive feelings (POS) and three items assessing negative emotions (NEG), which represent an increase in negative stress [34]. The MACL [29] includes hedonic tone (pleasantness), stress (acute tension), and arousal (physical energy).
One study in the review with ninety-four young adults (aged 14–18 years) used the Visual Analogue Scale (VAS), a validated measure of stress to assess stress change in five high schools [21]. Three studies considered the effects of different stress statuses and used SCS, SSS, and SRRS at baseline to screen the stress status of participants before landscape interventions [28,50,55].

3.6. Summary of Findings

We analyzed 19 experimental studies and found that 15 of them reported positive psychological and physical stress relief when engaging in passive or light physical activity in urban green or blue landscapes. However, three studies showed no significant difference between participants who walked or sat in specific urban landscapes compared to a control group in a gray area of the city. These studies used salivary cortisol as an objective measure to assess stress responses in different urban landscapes.
The studies were categorized based on their purpose, including residential green cover conditions, light activity in urban landscapes, non-contact visual viewing conditions, and self-reporting. However, more than half of the studies did not include objective and subjective measurements of urban landscapes, and important information about the landscape environment was often missing. Only two studies provided comprehensive landscape measurements, and five studies used questionnaires to understand respondents’ landscape preferences. This gap in the research represents a significant finding, as it emphasizes the “missing link” between experimental studies demonstrating the beneficial effects of contact with natural environments on perceived well-being and stress biomarkers.
In conclusion, the identified gap in the literature highlights the need for more comprehensive and integrated research that incorporates objective measurements of urban green infrastructure (see Figure 2), considers accessibility, availability, biodiversity, and cumulative effects, and explores the link between contact with urban natural environments and perceived and physiological stress responses.

4. Discussion

To our knowledge, this is the first review of measures used to investigate the association between urban landscapes and stress reduction in real-world experimental studies. This review highlights the current research gap regarding the evidence-based effects of experiencing urban landscapes on coping with psychological and physiological stress. Improved stress recovery in urban landscapes has been discussed in three systematic review articles, but most previous reviews exploring the benefits of real landscape settings for stress reduction have focused on reviewing the effectiveness of methods and tests for stress response while simplifying the landscape as a generalized natural environment. Furthermore, none have focused solely on landscapes in urban areas. The study’s findings emphasize the influence of personal characteristics, such as age, gender, and social class, on landscape preferences [56]. Additionally, environmental value orientations play a significant role in shaping preferences. The results highlight the unique characteristics of urban, rural, and wilderness landscapes and suggest that they may have varying effects on stress reduction. This supports the argument that these landscape types have distinct qualities that can potentially impact individuals’ well-being differently.
In addition, most reviews rarely delve into the nature of landscape differences, but landscape characteristics such as scale, size, and seasonality can shape different atmospheres and functions, giving different sensory, recreational, and visual experiences. Finally, the relationship between accessibility, such as distance and contact time, and frequency of visits has rarely been thoroughly examined and discussed in landscape intervention studies. Therefore, this review provides a more comprehensive evidence-based summary of the types of urban landscapes that can benefit stressed urban residents.
First, in discussing the relationship between different urban landscape types and stress responses, our findings suggest that cumulative exposure generated by urban landscapes has a significant positive impact whenever it is associated with daily activities [7]. Thus, long-term exposure to nearby urban landscapes can more or less reduce physiological and psychological stress responses. Nearby landscapes can be characterized as green or blue spaces, public or nonpublic, and in a landscape setting or looking out of a window [21,22,23]. Based on this result, we agree with Ekkel and Vries (2017) [57] that cumulative opportunities may positively impact health, with distance availability being more critical than public accessibility. In other words, an urban neighborhood surrounded by agricultural areas performs similarly to an urban park. Therefore, providing more daily access to the landscape is the most important key to a therapeutic urban landscape. Even indirect access to nature through windows is better than distant nature parks at the edge of the city.
Second, in experimental health research on the benefits of urban landscapes for stress reduction, the theoretical and evaluative basis for the design and measurement of urban landscapes often appears to be inadequate [45]. Such a discrepancy is commonly found in many evidence-based and well-developed stress-related design studies. How exposure to urban landscapes in real settings is presented, designed, and objectively measured is often underrepresented compared to the evidence for stress response measurement. Therefore, we highlight the challenges of such unequal cross-disciplinary expertise in stress health research and environmental research.
Third, we found from our selected studies that quality is more powerful and positive than quantity in the urban landscape experience. The landscape quality of a “healthy” city can be defined as a city with well-planned green infrastructure that maintains a sustainable ecological network. This means that such a city has more biodiversity, species-rich habitats, and multifunctional landscapes where citizens can experience multiple landscapes daily, such as static observation and meditation, dynamic physical activity, or social interaction. All of this is attributable to the quality of the landscape that shapes the urban atmosphere.
Based on these three main findings, in this interdisciplinary systematic review, we assessed the current state of evidence for stress responses in urban landscapes. Moreover, we explored the relationships between combining objective and subjective stress measurements with different types of landscape settings. The potential elements of therapeutic landscapes may provide urban planning decision-makers with more substantial evidence to design urban landscapes considering stress-related health issues.

4.1. Strengths and Limitations of the Studies Included

The studies included in this review made significant efforts to provide a range of measurements, such as pre–post intervention cortisol measurement or HRV, in combination with subjective stress outcomes. However, there were some gaps and challenges in the measures of stress and urban landscape interventions.

4.1.1. Gaps and Challenges in Measures of Stress

Understanding the relationship between exposure to urban green spaces and stress reduction has become increasingly important as the world’s population becomes more urbanized. The benefits of green spaces have been widely studied, but there are still gaps and challenges in measuring their impact on stress reduction.
In a longitudinal study conducted in a deprived urban community in the United Kingdom, more than 50% of participants’ salivary data were missing due to a complex sampling schedule, possibly affecting the study’s validity [23]. Challenges also exist in real-time studies, including technical difficulties in acquiring and processing psychophysiological measures, as well as interindividual variations in small sample sizes, making it difficult to detect significant differences [28,50,55]. Another challenge is the need for regular saliva collection or proper fitting of measuring devices, which may result in small sample sizes and low statistical power.
Despite these gaps and challenges, it is crucial to gather interventional data on landscape contact distance, frequency, and duration to provide better opportunities for city dwellers to sustain frequent contact with green spaces. Cross-sectional studies that apply one-time visits to a site cannot demonstrate causality, and urban landscape data is often too abstract and general, lacking in-depth analyses of people’s behavior and experiences in specific green spaces [25]. To gain a better understanding of the long-term effects of regular exposure to urban green spaces, especially concerning physiological health indicators, it is necessary to address these gaps and challenges in measuring stress reduction. Regular use of urban green spaces may amplify the benefits of green space availability on health, highlighting the importance of continued research in this area.

4.1.2. Gaps and Challenges in the Measurements of Urban Landscape Interventions

Although the concept of landscape functions has the potential to improve nearby green spaces and networks with green and blue paths to create a livable and healthy city, landscape interventions are often conducted and measured on an abstract level rather than at a local site scale. Additionally, studies often fail to report on the broader environmental context of the intervention site [13], which makes it difficult to assess the potential sources of beneficial effects or negative impacts, such as noise or pollution. This highlights the need for detailed and contextualized descriptions of intervention sites, including information on location, size, and landscape elements, illustrated with photos and maps, for a better understanding of the outlooks of the intervention site.
However, many studies included in this review were found to have several critical features missing (see Table 5), which may represent a missing link in experimental studies that have demonstrated beneficial effects of contact with natural environments on perceived stress and stress biomarkers. Furthermore, some cutting-edge objective landscape measures, such as NDVI, which is recommended by the World Health Organization [58], were not used by any of the articles included in this review. In addition, geographically individual landscape resources, such as orbit-measured GPS positioning or 3D landscape perception in stereoscopic space for street imagery [59,60,61], were also not used in our selected studies.
These discrepancies between studies may be attributed to the lack of evidence-based methods for landscape measurements in assessing their impact on health outcomes. Addressing these gaps and challenges is crucial for advancing our understanding of the effects of urban landscape interventions on health outcomes. Previous studies have commonly utilized metrics such as green coverage rate, ratio of green space, and NDVI to measure urban greenery. However, it has been suggested that the green view index (GVI), which represents the percentage of green in human vision, can provide a more comprehensive assessment of the three-dimensional greenery of the city compared to traditional two-dimensional indicators.
In the context of understanding whether the vertical dimension of greenery exposure is associated with stress reduction, a study [23] conducted by researchers with professional experience in the fields of landscape, ecological, or other relevant environmental studies employed expert evaluation to assess four different indicators: vegetation quality, vegetation quantity, structural diversity, and vegetation diversity. This assessment was performed using 90 photos of window views taken by the study participants. The utilization of expert evaluation allowed for a nuanced understanding of the vertical dimension of greenery and its potential influence on stress reduction.
However, it is noteworthy that despite the potential advantages of GVI in reflecting the three-dimensional greenery and its closer relationship with mental health, its application in evaluating the effects of greenery exposure on stress reduction remains limited in the current literature. Therefore, we suggest that future research should explore the incorporation of GVI as a measure of greenery exposure and discuss its advantages and implications in the context of stress reduction and other health outcomes.

4.1.3. Quality of Urban Landscape

It is widely accepted that landscape quality plays a critical role in its impact on physical and mental health. High-quality landscapes evoke positive emotions; however, the validity of the measurement of landscape quality and the definition of high quality remain controversial. The aesthetic or scenic quality is generally viewed as a dimension of human response. Daniel and Vining have argued that landscape quality should be systematically linked to the physical, biological, and social characteristics of the environment [62]. Thus, landscape quality is measured based on its function and impact on ecological, social, recreational, and economic values, which can evoke positive emotions and reduce daily stress. The most commonly used indicator for measuring ecological function is biodiversity. For example, a German research team has demonstrated that the green view index based on photos of the surroundings of participants’ homes can evaluate the quality and diversity of urban landscapes [23]. Biodiversity of species is another common ecological indicator. For example, one study examining a campus sensory garden used a morphological species approach to assess the quality and quantity of landscape diversity on the campus [34]. In most studies selected for the present review, social, recreational, and economic values of urban landscapes are discussed qualitatively and descriptively without any objective measurements being mentioned. The results obtained are sometimes confusing owing to a wide variability in ranges of individual daily contacts with landscapes. An integrative and informed understanding of human–environment interactions requires sensitivity to the methodologies used to measure individual psychological and biological responses, conduct empirical field studies, and interpret experimental findings. The lack of information regarding the conditions of exposure sites and landscape interventions is a major deficiency. To reduce such problems, Souter-Brown and colleagues (2021) have given a good example of how to collect primary and secondary environmental data to precisely describe the quality levels of nature [34].
Several studies have compared extreme landscape conditions (urban built vs. urban nature) by using abstract descriptions of the selected sites. These studies lack any detailed presentations of the landscape settings, elements, and sizes. Some studies have investigated the green space provision or vegetation coverage of a city without further details. Little attention has been given to individuals’ behaviors and experiences of daily landscape contact. In environmental health studies, an in-depth examination of individuals’ behaviors and experiences in specific green spaces is therefore urgently needed when examining the restorative effects of contact with different kinds of urban nature [23]. The outlooks and settings of landscapes and the experience of individual landscape contacts are all discussed by Tyrvainen et al. (2014) [35]. They examined the elements and sizes of three green spaces with different levels of naturalness and measured real-time air quality and noise levels at each site. The study observed no stress-related effects between different environments during participants’ 30-min walking in the parks and 15-min relaxed seating while looking around [35]. Beil et al. (2013) reported abstract information on landscape elements, size, and environment identification simultaneously and observed only positive health effects in terms of subjective stress recovery but no significant differences in objective measures during a 30-min viewing landscape intervention [50]. This finding contrasts with the results of long-term viewing of a landscape from a home, where stress responses were positively influenced by exposure to urban landscape surroundings, even through the windows of a home or classroom [21,23]. Short-term viewing of urban greenery was found to likely be ineffective. However, this could also mean that pre- and post-salivary cortisol measures are not recommended for short-term stationary landscape exposure. This is because, in the second study of Tyrvainen, thirty-six women had positive ECG measurements on three identical green spaces [36], while in the first study, seventy-seven mixed-sex participants had stress responses measured by cortisol [35].

4.2. Strengths and Limitations of This Review

The present review of 19 studies on urban landscapes in real settings and their impact on physiological and psychological stress reduction has several strengths. First, the well-designed studies using mixed stress measurements allowed us to assess the gaps between interdisciplinary research on urban landscapes and health effects. Second, the participant characteristics of previous reviews were similar across the individual studies, while our review presents the variations in characteristics of the study populations and covers a wide range of age groups, including ages 14 to 85 years, with different gender groups (mixed, male, or female respondents only) and socioeconomic statuses. This increases the generalizability of the outcome effects found. Third, all possible urban landscape types, such as green spaces (i.e., street trees, home gardens), public gardens, parks, regional parks), or blue spaces (i.e., wetlands and canals along a vegetated trail), were included in this review. Therefore, this review can be considered to be a reference index for future research. The results of this review cover all types of urban landscapes and their effects on psychological and physiological stress responses through different experimental designs and measures. Future investigators are encouraged to replicate these methods and extend their research to explore whether objective landscape measurement tools will support the validity of the study in terms of stress recovery. Recent studies have applied modern technologies, such as real-time monitoring using easily wearable and carriable devices, to provide immediate feedback on changes in stress levels. Finally, the assessment of landscape measures discussed in this review attempts to avoid bias to improve the evaluation of evidence.
However, this review has some limitations. We were unable to conduct a meta-analysis regarding the outcome due to the heterogeneity of the samples, which assessed various participant backgrounds and urban landscape types. In addition, although the studies included attempted to control for some confounding factors, such as age and gender, there may be other factors that influence stress reduction that were not controlled for, such as individual differences in personality or coping styles, which may affect how people respond to urban landscapes. Lastly, the studies included used different measurement tools to assess stress reduction, making it difficult to compare the results across studies, hence limiting the generalizability of the findings.

4.3. Recommendations for Future Work

The current review offers valuable insights into the effectiveness of urban landscape exposure on stress-related health. However, future research can further enhance the understanding of this field by implementing the following recommendations:
  • Foster transdisciplinary and interdisciplinary cooperation in developing urban landscape measures. By integrating the expertise of health scientists, ecologists, and sociologists, we can create evidence-based approaches for measuring landscape quality and quantity, as well as cross-disciplinary dialogue. For example, new technologies such as machine learning can be integrated to provide more objective and real-time metrics for assessing the components and changes of landscapes and stress-related health.
  • Encourage longitudinal studies across the lifespan and individual tracking. Instead of focusing solely on the distance from home to an urban landscape site, we should collect frequency and duration data of visits to the urban landscapes to feed back on the health impacts of individuals. Sustainability should be considered rather than availability or accessibility for routine use of nearby natural resources to connect with landscapes.
  • Optimize green infrastructure to form a city green network. A well-structured connection of greenways and green open space has shown promising benefits to stress reduction. Instead of relying on a single greenspace in a city, concepts such as “green corridors”, “parkways”, or “greenways” can serve as an escape from urban stress factors, such as noise, traffic, and pollution. Diverse landscape settings as a holistic green network can help mitigate air pollution, noise pollution, and visual stressors that may affect well-being.
  • Identify the specific functions of the landscape in study design, considering the contextual information and the role of landscape functions in stress recovery. Understanding the function of the landscape in the study site’s context is essential, as landscape functions can contribute to stress recovery either independently or in combination with other functions.
In conclusion, improving the measurement of different types of urban landscapes is crucial for future research to examine gender differences and explore the relationship between access to private/semi-private gardens, other green spaces, and health. Developing an integrated approach to landscape interventions for alleviating urban stressors requires a holistic understanding of landscape assessment and perception theories.

5. Conclusions

Urban landscapes have been recognized as having multifaceted health benefits for stress recovery. However, further research is needed to examine the validity of these relationships, particularly in experimental field studies that integrate interdisciplinary methods and measurements from environmental and health research to improve the validity of results. This systematic review identifies fundamental issues missing in landscape–health research and assesses approaches to the measurement of stress responses in urban landscapes. The review suggests that urban landscapes can provide therapeutically relevant changes in psychological states, physiological activity, and cognitive functioning. However, the lack of precise definitions and objective measures in the landscape context may affect the validity of the findings.
To provide the detailed and quantified information required for evidence-based health research on psychological and physiological stress recovery, four indicators of urban landscapes are suggested: the type and function of the urban landscape, the quantity and quality of the landscape, the way of human contact with urban landscapes, and the opportunities for sustainable exposure. Both landscape and stress-related metrics require more direct, accurate, and objective methodologies combined with technological innovations. This includes the use of real-time activity monitoring in landscape experiences and temporal changes, objective longitudinal assessments of the landscape experiences, including individual information about time spent, places visited, psychophysiological parameters, and measuring locomotor activity using tracking devices, and machine learning-based training models to help characterize the complex matrix of landscape settings and physical environments in real settings that may contribute to stress relief.
While this review provides valuable insights into the relationship between urban landscapes and stress recovery, there are limitations to be considered. Future research should aim to address these limitations by improving the precision and objectivity of measurements and controls for potential confounding factors.

Author Contributions

L.L.: Conceptualization, software, validation, formal analysis, project supervision, visualization, funding acquisition, and writing—original draft. K.W.L.: Review and editing. All authors have read and agreed to the published version of the manuscript.

Funding

This research received no external funding.

Institutional Review Board Statement

Not applicable.

Informed Consent Statement

Not applicable.

Conflicts of Interest

The authors declare no conflict of interest.

Appendix A

Table A1. List of search terms.
AndSearch Terms
urban landscapes(“green space*” OR “greenspace” OR “green exercise” OR “green landscape*” OR “natural space” OR “sounds of nature” OR “urban nature sound*” OR “urban natural environment*” OR “urban landscape” OR “urban nature” OR “nearby nature” OR “nature view*” OR “tree
cover” OR “exposure to nature” OR “outdoor nature” OR “natural space” OR “nature contact” OR “contact with nature*” OR “outdoor environment*” OR greening OR greenness OR neighborhood OR neighborhood* OR park OR “vacant lot*” OR gardening OR “urban
environment*” OR “urban forest” OR “urban field settings” OR “neighborhood greenery*”)
urban(urban OR “city*” OR “suburban” OR “municipal*” OR “metropolitan*”)
human stress(“stress*” OR “environmental stressor*” OR “blood pressure” OR neuro* OR physiologic* OR psychophysiologic* OR allostatic)
period1 January 2012 to 1 February 2022
Table A2. List of selected studies.
No.ObjectiveCountry (Reference)
1The effect of viewing green campus landscape on students’ chronic stress levels during class activities and breaksU.S. (D. Li & Sullivan, 2016) [21]
2The effect of viewing green space through a high-rise window on the psychological well-being and stress levels of urban dwellersChina (Elsadek et al. 2020) [22]
3The effects of (1) viewing the surrounding greenery from home and (2) specific public green space usage on residents’ stress levels and their perception of the restoration potential of these green spacesGermany (Honold et al., 2016) [23]
4The effect of a front garden horticultural intervention over three months on residents’ stress reductionU.K. (Suyin Chalmin-Pui, et al., 2021) [20]
5The effect of green space in deprived urban neighborhoods in Scotland on residents’ stress reductionU.K. (J. J. Roe, et al., 2013) [25]
6The effect of university campus designed loosely on a therapy garden on users’ stress reduction and workplace well-beingNew Zealand (Souter-Brown, et al., 2021) [34]
7The effects of visitation to different types of field-based environments, with varying degrees of nature, upon physiological- and psychological-based measures on levels of stressU.S. (Ewert & Chang, 2018) [19]
8The health impact of selected two-hour HPHP Bay Area events that targeted low-income racial and ethnic minority groupsU.S. (Yoshino, et al., 2018) [27]
9The effect of four urban environments on physiological and psychological stress measuresU.S. (Beil & Hanes, 2013) [50]
10(1) The effects of short-term visits to urban nature environments; three different types of urban areas, a built-up city center (control), an urban park, and urban woodland, on levels of stress
(2) The effects of femal visitors to the above three different types of urban green areas on their stress responses via ECG measures
Finland (Lanki et al., 2017; Tyrvainen et al., 2014) [35,36]
11The use of low-cost wearable technology to quantify the psychophysiological effects of short-term exposure to urban wetlandsU.K. (Reeves et al., 2019) [28]
12The changes of stress levels caused by common behaviors in urban green space (walking and sitting)China (Lin et al., 2020) [26]
13The effect of urban green spaces on stress recovery and attention restoration in low-density residential areasChina (Huang et al., 2021) [38]
14The feasibility of (1) integrating real-time physiological data with real-time environmental data; (2) establishing a new study protocol integrating cognitive health measures with real-time stress measures to explore outdoor exposure effects in an aging populationU.S. (Roe, et al., 2020) [29]
15A comparison of psychophysiological responses to natural environments with and without water and a pleasant urban environmentUK (Gidlow et al., 2016) [17]
16A comparison of the effects of visiting an old urban park, a newly developed park, and a dense urban street environment on psychophysiological health outcomes in older individualsGermany (Kabisch et al. 2021) [37]
17The effect of viewing cherry blossoms and fresh greenery in urban parks on the physiological and psychological relaxation of older adult residentsJapen (Pratiwi et al. 2019) [33]
18The effects of walks in urban parks on young males’ physiological and psychological stress responses during spring, winter, and summerJapan (Song, Joung et al. 2013, Song, Ikei et al. 2014, Song, Ikei et al. 2015) [30,31,32]
19The effects of 70 different outdoor activities in green spaces on users’ stress responsesSwitzerland (Hofmann et al., 2018) [47]

References

  1. UN-HABITAT. The Strategic Plan for 2020–2023; UN-Habitat: Nairobi, Kenya, 2019. [Google Scholar]
  2. Hartig, T.; Kahn, P.H., Jr. Living in cities, naturally. Science 2016, 352, 938–940. [Google Scholar] [CrossRef]
  3. Marcus, C.C.; Barnes, M. Healing Gardens: Therapeutic Benefits and Design Recommendations; John Wiley & Sons: Hoboken, NJ, USA, 1999; Volume 4. [Google Scholar]
  4. Memari, S.; Pazhouhanfar, M.; Grahn, P. Perceived Sensory Dimensions of Green Areas: An Experimental Study on Stress Recovery. Sustainability 2021, 13, 5419. [Google Scholar] [CrossRef]
  5. Wilson, E.O. Biophilia; Harvard University Press: Cambridge, MA, USA, 1984. [Google Scholar]
  6. Ulrich, R.S.; Simons, R.F.; Losito, B.D.; Fiorito, E.; Miles, M.A.; Zelson, M. Stress recovery during exposure to natural and urban environments. J. Environ. Psychol. 1991, 11, 201–230. [Google Scholar] [CrossRef]
  7. Mygind, L.; Kjeldsted, E.; Hartmeyer, R.; Mygind, E.; Stevenson, M.P.; Quintana, D.S.; Bentsen, P. Effects of Public Green Space on Acute Psychophysiological Stress Response: A Systematic Review and Meta-Analysis of the Experimental and Quasi-Experimental Evidence. Environ. Behav. 2021, 53, 184–226. [Google Scholar] [CrossRef]
  8. Corazon, S.S.; Sidenius, U.; Poulsen, D.V.; Gramkow, M.C.; Stigsdotter, U.K. Psycho-Physiological Stress Recovery in Outdoor Nature-Based Interventions: A Systematic Review of the Past Eight Years of Research. Int. J. Environ. Res. Public Health 2019, 16, 1711. [Google Scholar] [CrossRef] [Green Version]
  9. Palang, H.; Mander, Ü.; Naveh, Z. Holistic landscape ecology in action. Landsc. Urban Plan. 2000, 50, 1–6. [Google Scholar] [CrossRef]
  10. Wascher, D.M. European Landscape Character Areas: Typologies, Cartography and Indicators for the Assessment of Sustainable Landscapes; Landscape Europe: Wageningen, The Netherlands, 2005; pp. 1566–7197. [Google Scholar]
  11. Kondo, M.C.; Jacoby, S.F.; South, E.C. Does spending time outdoors reduce stress? A review of real-time stress response to outdoor environments. Health Place 2018, 51, 136–150. [Google Scholar] [CrossRef]
  12. Shuda, Q.; Bougoulias, M.E.; Kass, R. Effect of nature exposure on perceived and physiologic stress: A systematic review. Complement. Ther. Med. 2020, 53, 102514. [Google Scholar] [CrossRef]
  13. Barnes, M.R.; Donahue, M.L.; Keeler, B.L.; Shorb, C.M.; Mohtadi, T.Z.; Shelby, L.J. Characterizing Nature and Participant Experience in Studies of Nature Exposure for Positive Mental Health: An Integrative Review. Front. Psychol. 2019, 9, 2617. [Google Scholar] [CrossRef] [Green Version]
  14. Song, C.; Ikei, H.; Kagawa, T.; Miyazaki, Y. Effect of Viewing Real Forest Landscapes on Brain Activity. Sustainability 2020, 12, 6601. [Google Scholar] [CrossRef]
  15. Van den Berg, A.E.; Jorgensen, A.; Wilson, E.R. Evaluating restoration in urban green spaces: Does setting type make a difference? Landsc. Urban Plan. 2014, 127, 173–181. [Google Scholar] [CrossRef]
  16. Song, C.; Ikei, H.; Lee, J.; Park, B.J.; Kagawa, T.; Miyazaki, Y. Individual differences in the physiological effects of forest therapy based on Type A and Type B behavior patterns. J. Physiol. Anthr. 2013, 32, 14. [Google Scholar] [CrossRef] [PubMed] [Green Version]
  17. Gidlow, C.J.; Jones, M.V.; Hurst, G.; Masterson, D.; Clark-Carter, D.; Tarvainen, M.P.; Smith, G.; Nieuwenhuijsen, M. Where to put your best foot forward: Psycho-physiological responses to walking in natural and urban environments. J. Environ. Psychol. 2016, 45, 22–29. [Google Scholar] [CrossRef]
  18. Moher, D.; Liberati, A.; Tetzlaff, J.; Altman, D.G. Preferred reporting items for systematic reviews and meta-analyses: The PRISMA statement. BMJ 2009, 339, b2535. [Google Scholar] [CrossRef] [Green Version]
  19. Ewert, A.; Chang, Y. Levels of Nature and Stress Response. Behav. Sci. 2018, 8, 49. [Google Scholar] [CrossRef] [Green Version]
  20. Suyin Chalmin-Pui, L.; Roe, J.; Griffiths, A.; Smyth, N.; Heaton, T.; Clayden, A.; Cameron, R. “It made me feel brighter in myself”—The health and well-being impacts of a residential front garden horticultural intervention. Landsc. Urban Plan. 2021, 205, 103958. [Google Scholar] [CrossRef]
  21. Li, D.; Sullivan, W.C. Impact of views to school landscapes on recovery from stress and mental fatigue. Landsc. Urban Plan. 2016, 148, 149–158. [Google Scholar] [CrossRef] [Green Version]
  22. Elsadek, M.; Liu, B.; Xie, J. Window view and relaxation: Viewing green space from a high-rise estate improves urban dwellers’ wellbeing. Urban Urban Gree 2020, 55, 126846. [Google Scholar] [CrossRef]
  23. Honold, J.; Lakes, T.; Beyer, R.; van der Meer, E. Restoration in Urban Spaces: Nature Views From Home, Greenways, and Public Parks. Environ. Behav. 2016, 48, 796–825. [Google Scholar] [CrossRef]
  24. Ward Thompson, C.; Roe, J.; Aspinall, P.; Mitchell, R.; Clow, A.; Miller, D. More green space is linked to less stress in deprived communities: Evidence from salivary cortisol patterns. Landsc. Urban Plan. 2012, 105, 221–229. [Google Scholar] [CrossRef] [Green Version]
  25. Roe, J.J.; Thompson, C.W.; Aspinall, P.A.; Brewer, M.J.; Duff, E.I.; Miller, D.; Mitchell, R.; Clow, A. Green space and stress: Evidence from cortisol measures in deprived urban communities. Int. J. Environ. Res. Public Health 2013, 10, 4086–4103. [Google Scholar] [CrossRef] [Green Version]
  26. Lin, W.; Chen, Q.; Jiang, M.; Tao, J.; Liu, Z.; Zhang, X.; Wu, L.; Xu, S.; Kang, Y.; Zeng, Q. Sitting or Walking? Analyzing the Neural Emotional Indicators of Urban Green Space Behavior with Mobile EEG. J. Urban Health 2020, 97, 191–203. [Google Scholar] [CrossRef] [PubMed]
  27. Yoshino, A.; Wilson, J.; Velazquez, E.J.; Johnson, E.; Marquez-Magana, L. Healthy Parks Healthy People as an Upstream Stress Reduction Strategy. Recreat. Park Tour. Public Health 2018, 2, 35–56. [Google Scholar] [CrossRef] [PubMed]
  28. Reeves, J.P.; Knight, A.T.; Strong, E.A.; Heng, V.; Neale, C.; Cromie, R.; Vercammen, A. The Application of Wearable Technology to Quantify Health and Wellbeing Co-benefits From Urban Wetlands. Front. Psychol. 2019, 10, 1840. [Google Scholar] [CrossRef] [PubMed] [Green Version]
  29. Roe, J.; Mondschein, A.; Neale, C.; Barnes, L.; Boukhechba, M.; Lopez, S. The Urban Built Environment, Walking and Mental Health Outcomes Among Older Adults: A Pilot Study. Front. Public Health 2020, 8, 575946. [Google Scholar] [CrossRef]
  30. Song, C.; Joung, D.; Ikei, H.; Igarashi, M.; Aga, M.; Park, B.-J.; Miwa, M.; Takagaki, M.; Miyazaki, Y. Physiological and psychological effects of walking on young males in urban parks in winter. J. Physiol. Anthropol. 2013, 32, 18. [Google Scholar] [CrossRef] [Green Version]
  31. Song, C.; Ikei, H.; Igarashi, M.; Takagaki, M.; Miyazaki, Y. Physiological and Psychological Effects of a Walk in Urban Parks in Fall. Int. J. Environ. Res. Public Health 2015, 12, 14216–14228. [Google Scholar] [CrossRef]
  32. Song, C.; Ikei, H.; Igarashi, M.; Miwa, M.; Takagaki, M.; Miyazaki, Y. Physiological and psychological responses of young males during spring-time walks in urban parks. J. Physiol. Anthropol. 2014, 33, 8. [Google Scholar] [CrossRef] [Green Version]
  33. Pratiwi, P.I.; Xiang, Q.; Furuya, K. Physiological and Psychological Effects of Viewing Urban Parks in Different Seasons in Adults. Int. J. Environ. Res. Public Health 2019, 16, 4279. [Google Scholar] [CrossRef] [Green Version]
  34. Souter-Brown, G.; Hinckson, E.; Duncan, S. Effects of a sensory garden on workplace wellbeing: A randomised control trial. Landsc. Urban Plan. 2021, 207. [Google Scholar] [CrossRef]
  35. Tyrvainen, L.; Ojala, A.; Korpela, K.; Lanki, T.; Tsunetsugu, Y.; Kagawa, T. The influence of urban green environments on stress relief measures: A field experiment. J. Environ. Psychol. 2014, 38, 1–9. [Google Scholar] [CrossRef]
  36. Lanki, T.; Siponen, T.; Ojala, A.; Korpela, K.; Pennanen, A.; Tiittanen, P.; Tsunetsugu, Y.; Kagawa, T.; Tyrvainen, L. Acute effects of visits to urban green environments on cardiovascular physiology in women: A field experiment. Environ. Res. 2017, 159, 176–185. [Google Scholar] [CrossRef] [PubMed]
  37. Kabisch, N.; Püffel, C.; Masztalerz, O.; Hemmerling, J.; Kraemer, R. Physiological and psychological effects of visits to different urban green and street environments in older people: A field experiment in a dense inner-city area. Landsc. Urban Plan. 2021, 207, 103998. [Google Scholar] [CrossRef]
  38. Huang, S.; Qi, J.; Li, W.; Dong, J.; van den Bosch, C.K. The Contribution to Stress Recovery and Attention Restoration Potential of Exposure to Urban Green Spaces in Low-Density Residential Areas. Int. J. Environ. Res. Public Health 2021, 18, 8713. [Google Scholar] [CrossRef]
  39. Kabisch, N.; Haase, D. Green spaces of European cities revisited for 1990–2006. Landsc. Urban Plan. 2013, 110, 113–122. [Google Scholar] [CrossRef]
  40. Li, L.-W. Green Networks: Guidelines for Developing Taipei as an Eco-City Based on Case Studies of Three Greenways in Sheffield. J. Art Des. 2019, 7, 103–141. [Google Scholar]
  41. Hartig, T.; Mitchell, R.; de Vries, S.; Frumkin, H. Nature and Health. Ann. Rev. Public Health 2014, 35, 207–228. [Google Scholar] [CrossRef] [Green Version]
  42. Daniels, B.; Zaunbrecher, B.S.; Paas, B.; Ottermanns, R.; Ziefle, M.; Roß-Nickoll, M. Assessment of urban green space structures and their quality from a multidimensional perspective. Sci. Total Environ. 2018, 615, 1364–1378. [Google Scholar] [CrossRef]
  43. Daniel, T.C. Whither scenic beauty? Visual landscape quality assessment in the 21st century. Landsc. Urban Plan. 2001, 54, 267–281. [Google Scholar] [CrossRef]
  44. Lesage, F.X.; Berjot, S. Validity of occupational stress assessment using a visual analogue scale. Occup. Med. 2011, 61, 434–436. [Google Scholar] [CrossRef] [Green Version]
  45. Gong, Y.; Palmer, S.; Gallacher, J.; Marsden, T.; Fone, D. A systematic review of the relationship between objective measurements of the urban environment and psychological distress. Environ. Int. 2016, 96, 48–57. [Google Scholar] [CrossRef] [PubMed] [Green Version]
  46. Jo, H.; Song, C.; Miyazaki, Y. Physiological Benefits of Viewing Nature: A Systematic Review of Indoor Experiments. Int. J. Environ. Res. Public Health 2019, 16, 4739. [Google Scholar] [CrossRef] [Green Version]
  47. Hofmann, M.; Young, C.; Binz, T.M.; Baumgartner, M.R.; Bauer, N. Contact to Nature Benefits Health: Mixed Effectiveness of Different Mechanisms. Int. J. Environ. Res. Public Health 2018, 15, 31. [Google Scholar] [CrossRef] [Green Version]
  48. de Vries, S.; van Dillen, S.M.E.; Groenewegen, P.P.; Spreeuwenberg, P. Streetscape greenery and health: Stress, social cohesion and physical activity as mediators. Soc. Sci. Med. 2013, 94, 26–33. [Google Scholar] [CrossRef] [Green Version]
  49. Hartig, T.; Johansson, G.; Kylin, C. Residence in the Social Ecology of Stress and Restoration. J. Soc. Issues 2003, 59, 611–636. [Google Scholar] [CrossRef]
  50. Beil, K.; Hanes, D. The influence of urban natural and built environments on physiological and psychological measures of stress—A pilot study. Int. J. Environ. Res. Public Health 2013, 10, 1250–1267. [Google Scholar] [CrossRef] [Green Version]
  51. Stigsdotter, U.K.; Grahn, P. Stressed individuals’ preferences for activities and environmental characteristics in green spaces. Urban Urban Gree 2011, 10, 295–304. [Google Scholar] [CrossRef]
  52. Nisbet, E.K.; Zelenski, J.M.; Murphy, S.A. The Nature Relatedness Scale:Linking Individuals’ Connection With Nature to Environmental Concern and Behavior. Environ. Behav. 2009, 41, 715–740. [Google Scholar] [CrossRef]
  53. Chrousos, G.P.; Gold, P.W. The Concepts of Stress and Stress System Disorders: Overview of Physical and Behavioral Homeostasis. JAMA 1992, 267, 1244–1252. [Google Scholar] [CrossRef]
  54. Hartig, T.; Mang, M.; Evans, G.W. Restorative Effects of Natural Environment Experiences. Environ. Behav. 1991, 23, 3–26. [Google Scholar] [CrossRef]
  55. Song, C.; Ikei, H.; Kobayashi, M.; Miura, T.; Taue, M.; Kagawa, T.; Li, Q.; Kumeda, S.; Imai, M.; Miyazaki, Y. Effect of Forest Walking on Autonomic Nervous System Activity in Middle-Aged Hypertensive Individuals: A Pilot Study. Int. J. Environ. Res. Public Health 2015, 12, 2687–2699. [Google Scholar] [CrossRef] [Green Version]
  56. Howley, P. Landscape aesthetics: Assessing the general publics’ preferences towards rural landscapes. Ecol. Econ. 2011, 72, 161–169. [Google Scholar] [CrossRef]
  57. Ekkel, E.D.; de Vries, S. Nearby green space and human health: Evaluating accessibility metrics. Landsc. Urban Plan. 2017, 157, 214–220. [Google Scholar] [CrossRef]
  58. Egorov, A.I.; Griffin, S.M.; Converse, R.R.; Styles, J.N.; Sams, E.A.; Wilson, A.; Jackson, L.E.; Wade, T.J. Vegetated land cover near residence is associated with reduced allostatic load and improved biomarkers of neuroendocrine, metabolic and immune functions. Environ. Res 2017, 158, 508–521. [Google Scholar] [CrossRef]
  59. Larkin, A.; Hystad, P. Evaluating street view exposure measures of visible green space for health research. J. Expo. Sci. Environ. Epidemiol. 2019, 29, 447–456. [Google Scholar] [CrossRef] [PubMed]
  60. Wang, R.; Helbich, M.; Yao, Y.; Zhang, J.; Liu, P.; Yuan, Y.; Liu, Y. Urban greenery and mental wellbeing in adults: Cross-sectional mediation analyses on multiple pathways across different greenery measures. Environ. Res. 2019, 176, 108535. [Google Scholar] [CrossRef] [Green Version]
  61. Jiang, X.R.; Larsen, L.; Sullivan, W. Connections between Daily Greenness Exposure and Health Outcomes. Int. J. Environ. Res. Public Health 2020, 17, 3965. [Google Scholar] [CrossRef]
  62. Daniel, T.C.; Vining, J. Methodological Issues in the Assessment of Landscape Quality. In Behavior and the Natural Environment; Altman, I., Wohlwill, J.F., Eds.; Springer: Boston, MA, USA, 1983; pp. 39–84. [Google Scholar] [CrossRef]
Figure 1. PRISMA Diagram.
Sustainability 15 09240 g001
Figure 2. A Systematic Overview of the Relationship Between Urban Green Infrastructure and Stress Resilience.
Sustainability 15 09240 g002
Table 5. Summary of characteristics and stress measurements of the 19 studies included.
Study No.Study DesignParticipant
N = Valid in Result
Psychological StressPhysiological StressCognitive TaskMoodMental Wellbeing
Satisfaction
RestorationPhysical ActivityHealth
1RCT
(real-time)
N = 94 (Green W: 30, Gray W: 32, No W: 32)VASECG: BVP, SCL, BT, HRVTSST
(DSF/DSB)
2Cross-over (real-time)N = 30SD, POMSEmotiv EPOC + EEG + HR
PPG:BVP, HR, HRV; EDA:SL
3Cross-sectional
View & Usage
N = 32IPCSHC LS-5
(absence stress)
GH
SF-36
4Longitudinal (pre–post)N = 42 A: 8; B: 8
(pre–post)
PSSsCort (2 × 4): DAC, AUCg, CCL SWEMWB PAL
5Cross-sectional
LG vs. HG
N = 106 (LG: 73%, HG: 27%)PSSsCort (2 × 3): DAC, CSP SWEMWB PAL
6RCT
(pre–post)
N = 164 (SG:57; UP: 51; CG: 56)PANE (NEG)CCL PANE
(POS)
FS HPQ
7Pre–postN = 105PSQCCL, α-amylase
8Pre–postN = 52 (32,31,35)PSS-4CCL, α-amylase, HR (Garmin) IPANAS SRRS-8Garmin Vivofit: Steps account
9Cross-overN = 15SSS, PSSsCort, sAA PRS
10Cross-over
Real time and pre–post
Cortisol: 77, of which 36 extra measure real-time EEGPANAS
(NEG)
Holter: EEG, HRV
Oscillometric: BP, HR
CCL
PANAS
(POS)
TFOAS
SVS (energy), CS
ROS, PRS
11Cross-over
(real-time)
N = 36HRSI-SRRS
DASS-21
Emotiv EPOC+EEG+HR
PPG: BVP, HR, HRV; EDA:SL
PANA
12Cross-over (real-time)N = 40STAIPAD, EAP, AV, EEGTMT
(8 min)
SCS-R
13Cross-over (real-time)N = 33PRSEDA, EMG, RESP, SKT, PPG
14RCT
(real-time)
N = 11 PPG:HRV
SW:WS
SRT, memoryMACL (stress)SWEMWB
15RCT
(real-time + pre–post)
N = 38PSSCCL (3t)
HR& HRV
BDSTTMD
(BRUMS)
SF12v2ROS-6RPE
(BS)
BMI
16Cross-over (real-time)N = 33STAIBVP
HR
POMS
SF12
17Cross-over (real-time)N = 12STAIECG POMS
18Real-timeN = 13, 20, 13STAIECG: HR, HRV, LF/HF ratio POMS BMI
19CohortN = 85SSCS, SCI, LSEHC Type, Duration
Abbreviations: AUCg: Total Daily Salivary Cortisol; BVP: Blood Volume Pulse; CCL(t): Changes in Salivary Cortisol Levels; CSP: Cortisol Slope Profiles (managed times); DASS: Depression, Anxiety, and Stress Scale; ECG: Portable Electrocardiography; EDA: Electrodermal Activity EEG: Electroencephalograpy; EID: Environmental Identity; FS: Flourishing Scale; HR: Heart Rate; HRV: Heart Rate Variability; IPCS: Inventory of Perceived Chronic Stress; LS: Life Satisfaction; NRS: Nature Relatedness Scale; PAL: Level of Physical Activity; PPG: Photoplethysmography; PRE: Rate of Perceived Exertion (Borg scale for exercise intensity); PSS: Perceived Stress Scale; SCL: Skin Conductance Level; SF: Short Form Health Survey; SWEMWB: Short Warwick and Edinburgh Mental Wellbeing Scale; SL: Skin Conductance; SPANE: Scale of Positive and Negative Experience; TSST: Trier Social Stress Test; VAS: Visual Analogue Scale.
Disclaimer/Publisher’s Note: The statements, opinions and data contained in all publications are solely those of the individual author(s) and contributor(s) and not of MDPI and/or the editor(s). MDPI and/or the editor(s) disclaim responsibility for any injury to people or property resulting from any ideas, methods, instructions or products referred to in the content.

