Article

Evaluating the Feedback of the Reservoir Methane Cycle to Climate Warming under Hydrological Uncertainty

Guangdong Provincial Key Laboratory of Water Quality Improvement and Ecological Restoration for Watersheds, Institute of Environmental and Ecological Engineering, Guangdong University of Technology, Guangzhou 510006, China
*
Author to whom correspondence should be addressed.
Sustainability 2023, 15(12), 9197; https://doi.org/10.3390/su15129197
Submission received: 26 April 2023 / Revised: 27 May 2023 / Accepted: 5 June 2023 / Published: 7 June 2023

Abstract

:
Freshwater reservoirs are widely recognized as methane (CH4) emission hotspots. Existing research has shown that temperature and hydrological conditions significantly affect wetland CH4 cycling processes. However, the feedback of the CH4 cycle to climate warming remains unclear for deep reservoirs where seasonal water thermal stratification exists. This study combined a reservoir CH4 cycling model and a Statistical DownScaling Model (SDSM) to evaluate reservoir CH4 cycling feedbacks under multiple climate change scenarios while accounting for hydrological uncertainty. Daily air temperatures in 2100 were predicted by the combination of the CanESM5 model and a SDSM. To address hydrological uncertainty, we selected three representative hydrological years (i.e., wet, normal, and dry) to create hydrological scenarios. Results showed that annual sediment CH4 production increased with warming, ranging 323.1–413.7 × 10³ t C year−1 among multiple scenarios. Meanwhile, the CH4 oxidation percentage decreased with warming, which meant warming promoted sediment CH4 release non-linearly; 67.8–84.6% of sediment ebullient flux was ultimately emitted to the atmosphere (51.3–137.7 × 10³ t C year−1), which showed ebullition was the dominant emission pathway. Higher air temperatures and drier conditions generally promote reservoir emissions. This study is helpful for predicting reservoir emissions while directing decision-making for reservoir sustainability.

1. Introduction

Methane (CH4) is a typical greenhouse gas (GHG), contributing to approximately 21% of the increase in radiative forcing since pre-industrial times [1]. Compared to carbon dioxide (CO2), the climate warming potential of CH4 is greater (i.e., by a factor of 28). Moreover, CH4 concentrations in the near-surface atmosphere have increased by a factor greater than 1.5 compared to pre-industrial levels [2]. Freshwater systems contribute greatly to the global CH4 budget, being responsible for approximately 42% of all global emissions from natural and anthropogenic sources [3]. Among these sources, reservoirs that are constructed by means of river damming have been recognized as CH4 emission hotspots [4,5]. A recent modeling assessment estimated that global reservoirs emitted 1076 Tg of CO2-equivalent in 2020, of which CH4 contributed 70% [6]. Moreover, under the ongoing expansion of hydropower engineering projects, reservoirs will likely have an increasing effect on global warming over the coming decades, while their CH4 emissions are expected to increasingly dominate reservoir-induced effects [7]. Therefore, the quantitative prediction of reservoir emissions under conditions of environmental change is critical to accurately assessing reservoir-based climatic effects while also estimating global budgets.
Damming changes upstream river environments from lotic to lentic, leading to significant organic carbon (C) sedimentation and accumulation in reservoir sediment [8]. This makes reservoir sediment CH4 hotspots [9,10]. Many studies have investigated reservoir emission budgets and CH4 cycling processes. Generally, organic C is degraded and mineralized to generate CH4 in anoxic sediment, except for a small fraction that is permanently buried [11]. Then, CH4 is partially oxidized in oxic sediment [12], while the remaining fraction is released from sediment via diffusion and ebullition [13]. Extensive research has been conducted to measure and monitor CH4 emissions in rivers and reservoirs [13,14,15]. Meanwhile, modeling approaches have been developed and applied to simulate CH4 cycling processes and calculate their respective budgets [16,17]. It has been widely found that reservoir CH4 emissions are subject to considerable variability and are regulated by multiple influencing factors [4,18,19].
Climatic factors (i.e., air temperature, precipitation, atmospheric pressure, etc.) have frequently been shown to affect CH4 cycling processes and emissions in aquatic ecosystems [3,20,21]. Temperature affects the rate of microbiological processes, thereby influencing both CH4 production and consumption. Wetland experiments have shown that climate warming leads to a disproportionate increase in CH4 production over oxidation, which is indicative of a positive feedback loop (i.e., where warming can cause increases in wetland emissions) [3]. Moreover, temperature affects CH4 solubility and thereby impacts CH4 release pathways (i.e., through diffusion or ebullition) [22]. On the other hand, precipitation affects hydrological conditions, which strongly impact CH4 cycling processes [20]. It has recently been shown that both water depth variation and submerged conditions affect C emissions in reservoirs and wetlands [5,23]. The effects of temperature increases on wetland emissions vary with wetland water tables [24].
The effect of climate warming on CH4 cycling is complex in deep reservoirs due to the existence of seasonal thermal stratification [25]. The water level has a significant effect on water and sediment temperature distribution [26], thereby affecting reservoir emission feedback as air temperatures increase. Global warming is increasingly impacting the world’s environments, where hydrological conditions are subject to significant variability and uncertainty. CH4 emission feedback to climate change has been explored for wetlands with comparatively low water depths [2,24,27]. However, deep reservoirs differ from wetlands in multiple ways, such as water depth, sediment condition, and biological communities. Feedbacks of sediment CH4 processes and emissions on climate warming have rarely been investigated in deep reservoirs, especially under hydrological uncertainty. It is important to understand reservoir feedbacks to project future global reservoir emissions under climate change and to direct anthropogenic emission reduction planning to achieve sustainable development goals.
This study combines a reservoir CH4 cycling model and a Statistical DownScaling Model (SDSM) to evaluate reservoir CH4 cycling feedback to climate warming under hydrological uncertainty. We selected the Danjiangkou Reservoir, China’s second-largest reservoir, as a case study. The projections of air temperature in 2100 under the shared socioeconomic pathways (SSPs) simulated by the CanESM5 model were downscaled on the SDSM platform. To address hydrological uncertainty, three representative hydrological years (i.e., wet, normal, and dry) were selected through means of historical reservoir inflow analysis. After combining temperature and hydrological scenarios, the reservoir CH4 cycling model simulates how climate change influences spatiotemporal CH4 cycling through hydrodynamic and biogeochemical processes in the Danjiangkou Reservoir. This study can help predict reservoir CH4 emission dynamics and direct decision-making in the pursuit of reservoir sustainability.

2. Materials and Methods

2.1. Study Area

The Danjiangkou Reservoir (Figure 1), located in the Yangtze River basin, is China’s second-largest reservoir. It plays a vital role in providing water to the South–North Water Transfer Project. At its normal pool level (i.e., 170 m), its storage capacity is 29.05 × 10⁹ m3, with a total area of 1023 km2. The main functions of the reservoir are to provide water, generate hydropower, control floods, and discharge environmental flow. For the reasons explained below, the Danjiangkou Reservoir is a good case study candidate. Firstly, along with agricultural development, the land adjacent to its upstream reaches is high in soil organic carbon content and subject to water degradation and soil erosion [28]. This eroded soil is then washed into the Han River, where it is trapped by the Danjiangkou Reservoir. This increases organic C content in reservoir sediment, which provides substrates for methanogens to produce CH4 [9]. Secondly, hypolimnetic hypoxia in this deep reservoir is induced by seasonal water stratification and algal growth [25]. Incremental air temperature lengthens the period of hypolimnetic hypoxia [29] and stimulates algal growth [30], which may promote CH4 production in reservoir sediment [31,32]. Finally, precipitation variation affects runoff in upstream river reaches and water storage levels in the reservoir [33], which could influence reservoir sediment CH4 emission pathways [34,35].

2.2. Reservoir Methane Cycling Simulations

The Environmental Fluid Dynamics Code (EFDC) is a surface water modeling system originally developed by Hamrick [36]. The EFDC has been used to build models for different waterbody types, including rivers [37], reservoirs [38], lakes [30], estuaries [39], etc. For this study, we used a quasi-three-dimensional reservoir model developed on the EFDC platform for the Danjiangkou Reservoir, which has previously been calibrated and validated [40]. The reservoir model couples hydrodynamic, water quality, and sediment diagenesis modules on the EFDC to simulate interactions of multiple variables in the water body and sediment. The hydrodynamic module simulates water flow and material transportation in the horizontal direction with orthogonal curvilinear coordinates and in the vertical direction with sigma coordinates. The water quality module simulates C, nitrogen (N), and phosphorus (P) transformations, dissolved oxygen (DO) variation, and algal dynamics. Meanwhile, these organic matter forms are composed of labile particulate, refractory particulate, and dissolved organic matter. The sediment diagenesis module simulates organic and inorganic matter flux at the sediment-water interface and biogeochemical processes in sediment. More details on EFDC theory can be found in the existing document [41].
To simulate CH4 production and consumption in reservoir sediment as well as CH4 emissions from sediment to the overlying water and subsequently to the atmosphere, the specific processes are introduced as follows. Particulate organic carbon (POC), derived from terrestrial organic matter, wastewater, and/or autochthonous algae, deposits in sediment. Next, labile and refractory POC are degraded, and CH4 is produced within anoxic sediment, while permanently buried POC is only negligibly degraded. Then, the produced CH4 moves up into the upper oxic sediment layer, which is partly oxidized by oxygen diffusing from overlying water. The remaining CH4 is released into the water column via diffusion or ebullition. Additionally, the rising bubbles (ebullition) lose a fraction of CH4 in the water column, and the remaining CH4 is subsequently released into the atmosphere. Following the empirical model proposed by Ostrovsky [42], we calculated the CH4 ebullient flux to the atmosphere.
During the process of building the reservoir model, we first input the boundary of Danjiangkou Reservoir into the EFDC platform, which was drawn from the map using the Universal Transverse Mercator (UTM) Coordinate System. Before this, the coordinate system of the map needed to be converted from the World Geodetic System (WGS) to the UTM Coordinate System due to standard cartography (Figure 1) using WGS. Subsequently, bottom elevation, hydrological, meteorological, and water quality data were input to the EFDC software (version 10.3) step by step, and the water body of the reservoir was divided into six layers averagely in order to simulate the change of variables in the vertical direction [40]. Additionally, calibration and verification had been done previously [40,43]. To improve its running efficiency, the model was run by setting the dynamic time-step to 2 s as the initial value.

2.3. Air Temperature Prediction and Hydrological Uncertainty

This section introduces the prediction method that we used for the air temperature above the surface of the Danjiangkou Reservoir in 2100. In this study, we chose the modeling results of air temperature simulated by the newest version of the Canadian Earth System Model (CanESM5) because its early versions had great performance in simulating climate change in China [44,45,46]. Additionally, according to historical runoff, we selected representative hydrological years to address hydrological uncertainty. Through runoff data from different hydrological years, discharges from the Danjiangkou Reservoirs were simulated by a reservoir operation model [25]. The corresponding air temperature, runoff, and discharge data for all scenarios were input into the Danjiangkou Reservoir model developed on the EFDC. The model was then run in all scenarios. Following this, we analyzed the spatiotemporal feedback of reservoir CH4 cycling to climate warming during all three hydrological years.

2.3.1. Near-Surface Air Temperature Prediction

The Statistical DownScaling Model (SDSM) [47], a hybrid model between a stochastic weather generator and multiple regression equations, enhances the efficiency of generating multiple, low-cost, and single-site scenarios of surface weather variables under present and future climate forcing. To generate the scenarios, the first step was to obtain observed near-surface air temperature and predictor variable data in the study area. The daily air temperature monitored by the Laohekou Meteorological Station between 1979 and 2014, which this study regarded as the air temperature above the surface of the Danjiangkou Reservoir, was obtained from the National Centers for Environmental Information (NCEI), the United States of America (https://www.ncei.noaa.gov/maps/daily, accessed on 26 April 2023). For this study, we selected one grid box covering the Laohekou Meteorological Station from all the grid boxes on the Canadian Climate Impacts and Scenarios (CCIS) project website (https://climate-scenarios.canada.ca/?page=pred-cmip6, accessed on 26 April 2023). Next, in this grid box, we downloaded modeling results from the National Centers for Environmental Prediction-Department of Energy (NCEP-DOE) Reanalysis 2 model between 1979 and 2014, which contains data sets of 26 predictor variables. In the same grid box, we simultaneously downloaded other predictor variable data sets, namely, modeling results under the SSPs (i.e., SSP1-2.6, SSP2-4.5, and SSP5-8.5) simulated by the CanESM5 model between 2015 and 2100. The second step was to develop a statistical model. To do so, we screened 26 predictor variables simulated by the NCEP-DOE Reanalysis 2 model on the SDSM platform to find predictor variables whose optimal statistical relationships corresponded to observational data. Two predictor variables were subsequently selected: air temperature at 2 m (temp) and mean sea level pressure (mslp). The observational and the selected predictor variable data were, respectively, sectioned into two: (1) that which ranged between 1979 and 1996 and (2) that which ranged between 1997 and 2014. The first observational and predictor variable data were used to develop the statistical model and calibrate it on the SDSM platform. The second predictor variable data were input into the statistical model to obtain predictand, which was used to calculate deviations from the observed data. Lastly, after verification, we input temp and mslp under the SSPs simulated by the CanESM5 model into the statistical model to obtain the air temperature above the surface of the Danjiangkou Reservoir in 2100.

2.3.2. Hydrological Uncertainty Analysis

The main source of uncertainty between Global Climate Models (GCMs) and within the GCM was runoff projections under climate change, which were obtained by the combination of a downscaling method and a hydrological model [48]. Additionally, hydrological uncertainty distinctly increased over time under future climate scenarios and was larger under high than low emission scenarios [49]. Given the difficulty in predicting precipitation, we used historical runoff data from the Han River as inflow to the Danjiangkou Reservoir when predicting the impact of climate warming on reservoir sediment CH4 cycling processes. To comprehensively account for future variation, we selected three hydrological years (i.e., wet, normal, and dry) from a total of fifty years of runoff data, following the method proposed by Cai and Rosegrant [50]. Based on the SSPs under the different hydrological years, a total of nine scenarios were selected for this study (Table 1), which were subsequently used to analyze climate warming impacts on reservoir sediment C cycling processes under different hydrological conditions.

3. Results and Discussion

3.1. Air Temperature Prediction

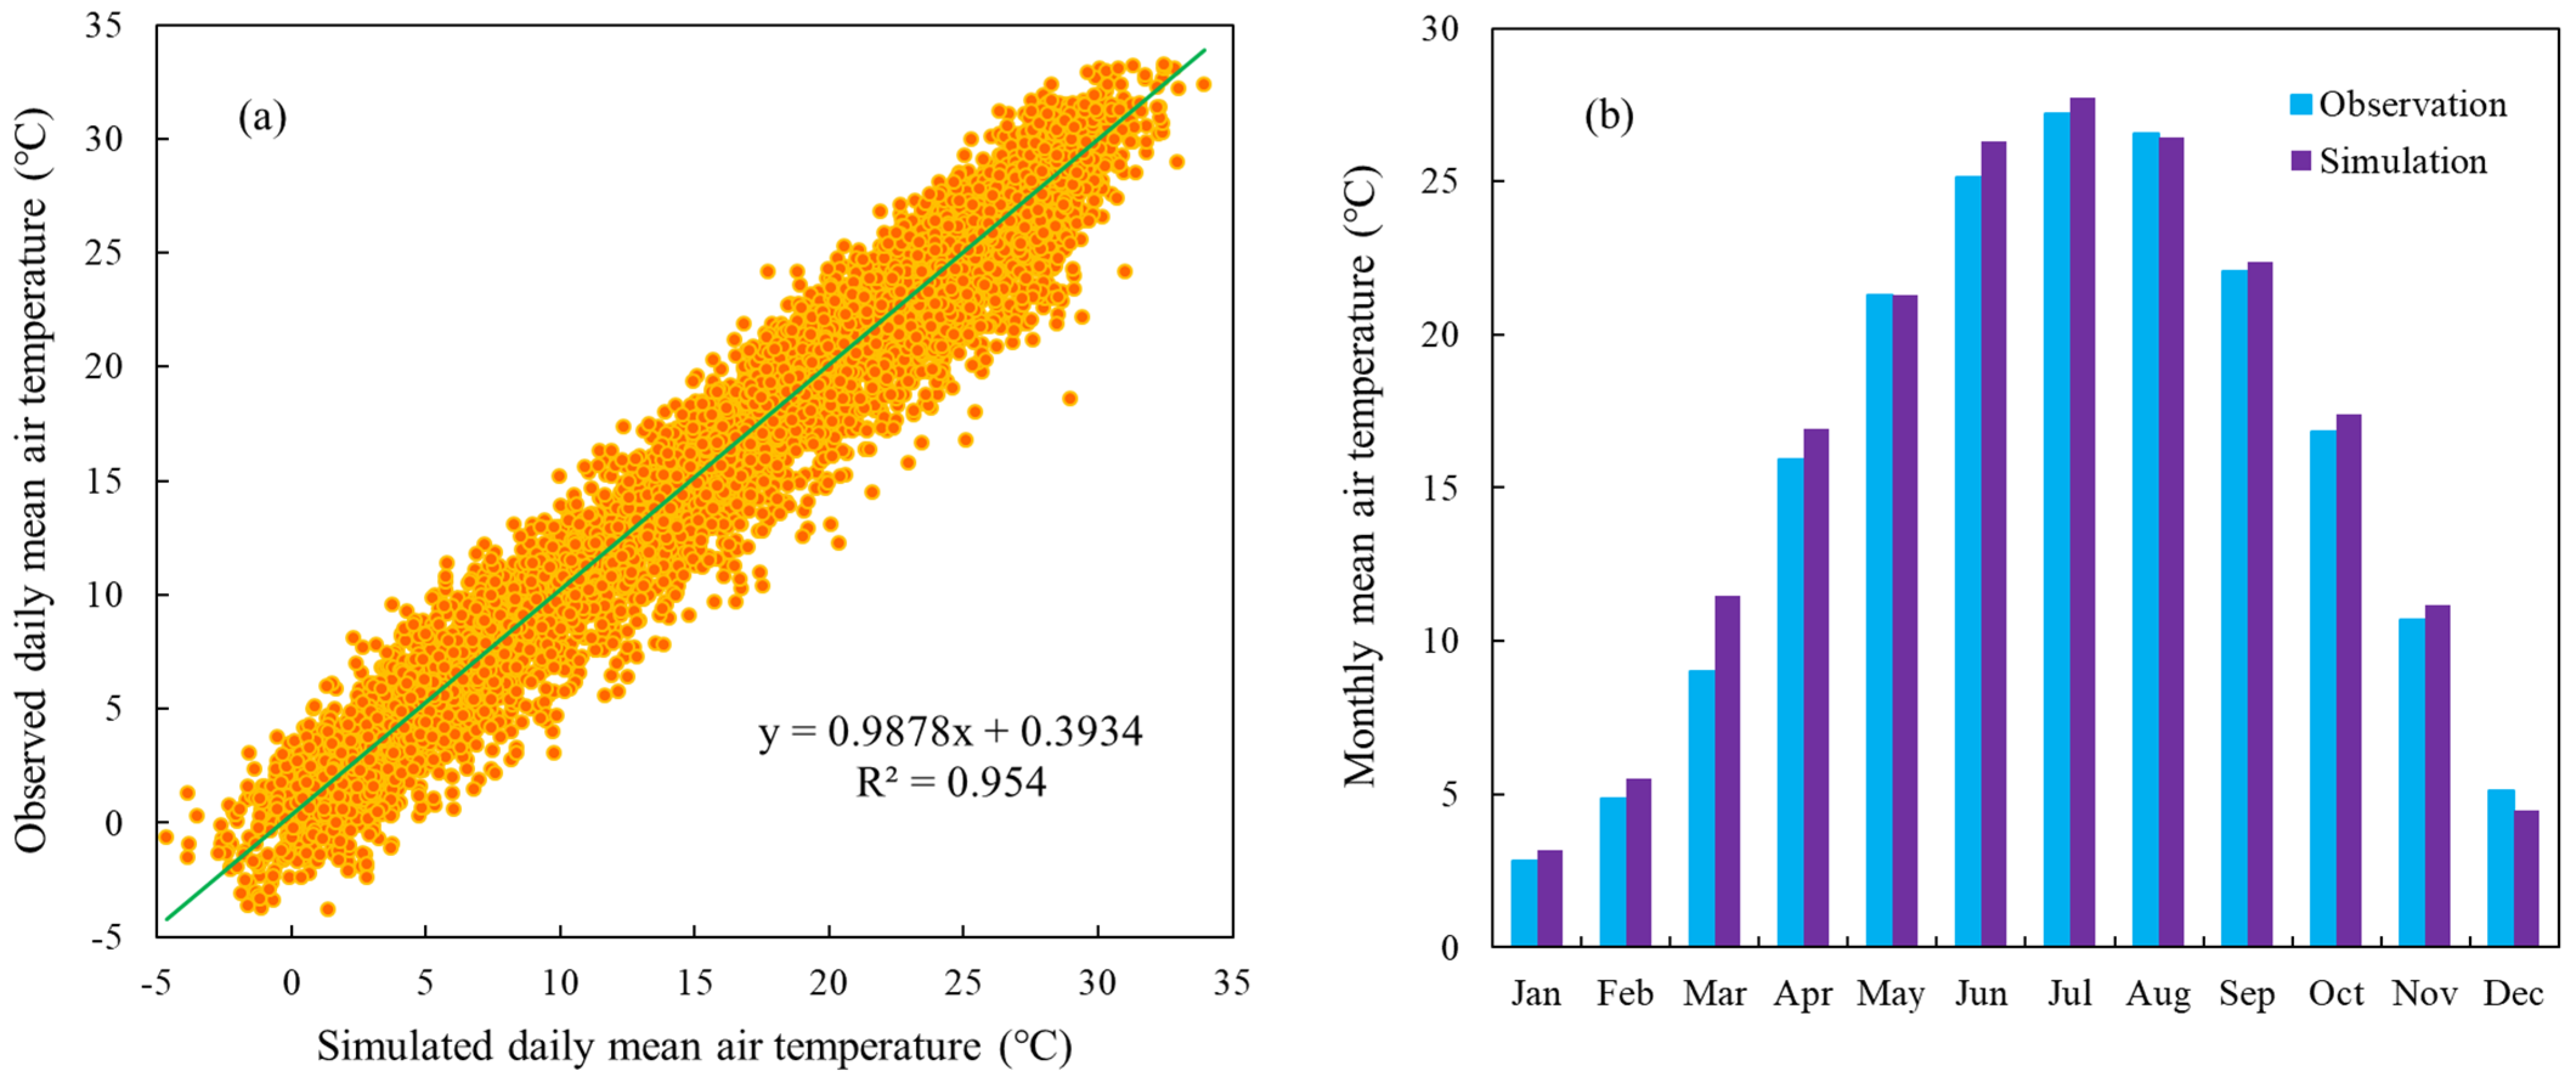
The predictor variables (i.e., temp and mslp) simulated by the NCEP-DOE Reanalysis 2 model and observed daily near-surface air temperature data between 1979 and 1996 were used to calibrate the statistical model for downscaling on the SDSM platform. Then, the predictor variables and air temperature data between 1997 and 2014 were used to verify the statistical model. As Figure 2 shows, the statistical model could perform well during the downscaling process. The determination coefficient (R2) and curve slope of the daily mean air temperature are 0.95 and 0.99, respectively (Figure 2a). The variance of the monthly mean air temperature ranged from 0.34 to 0.88 (Figure 2b).
Near-surface air temperatures in 2100 under the SSP1-2.6, SSP2-4.5, and SSP5-8.5 simulated by the CanESM5 model were downscaled by using the statistical model (Figure 3). Annual mean air temperatures under the SSP1-2.6, SSP2-4.5, and SSP5-8.5 were 17.7 °C, 19.7 °C, and 22.6 °C, respectively. Although the annual mean air temperature under the SSP2-4.5 was significantly higher than that under the SSP1-2.6 (2.0 °C), the mean difference between them was negligible from mid-June to August (0.6 °C). Generally, the daily air temperature under the SSP5-8.5 was distinctly the highest among the three SSPs.

3.2. Dynamic Variations of Sediment Methane Budgets

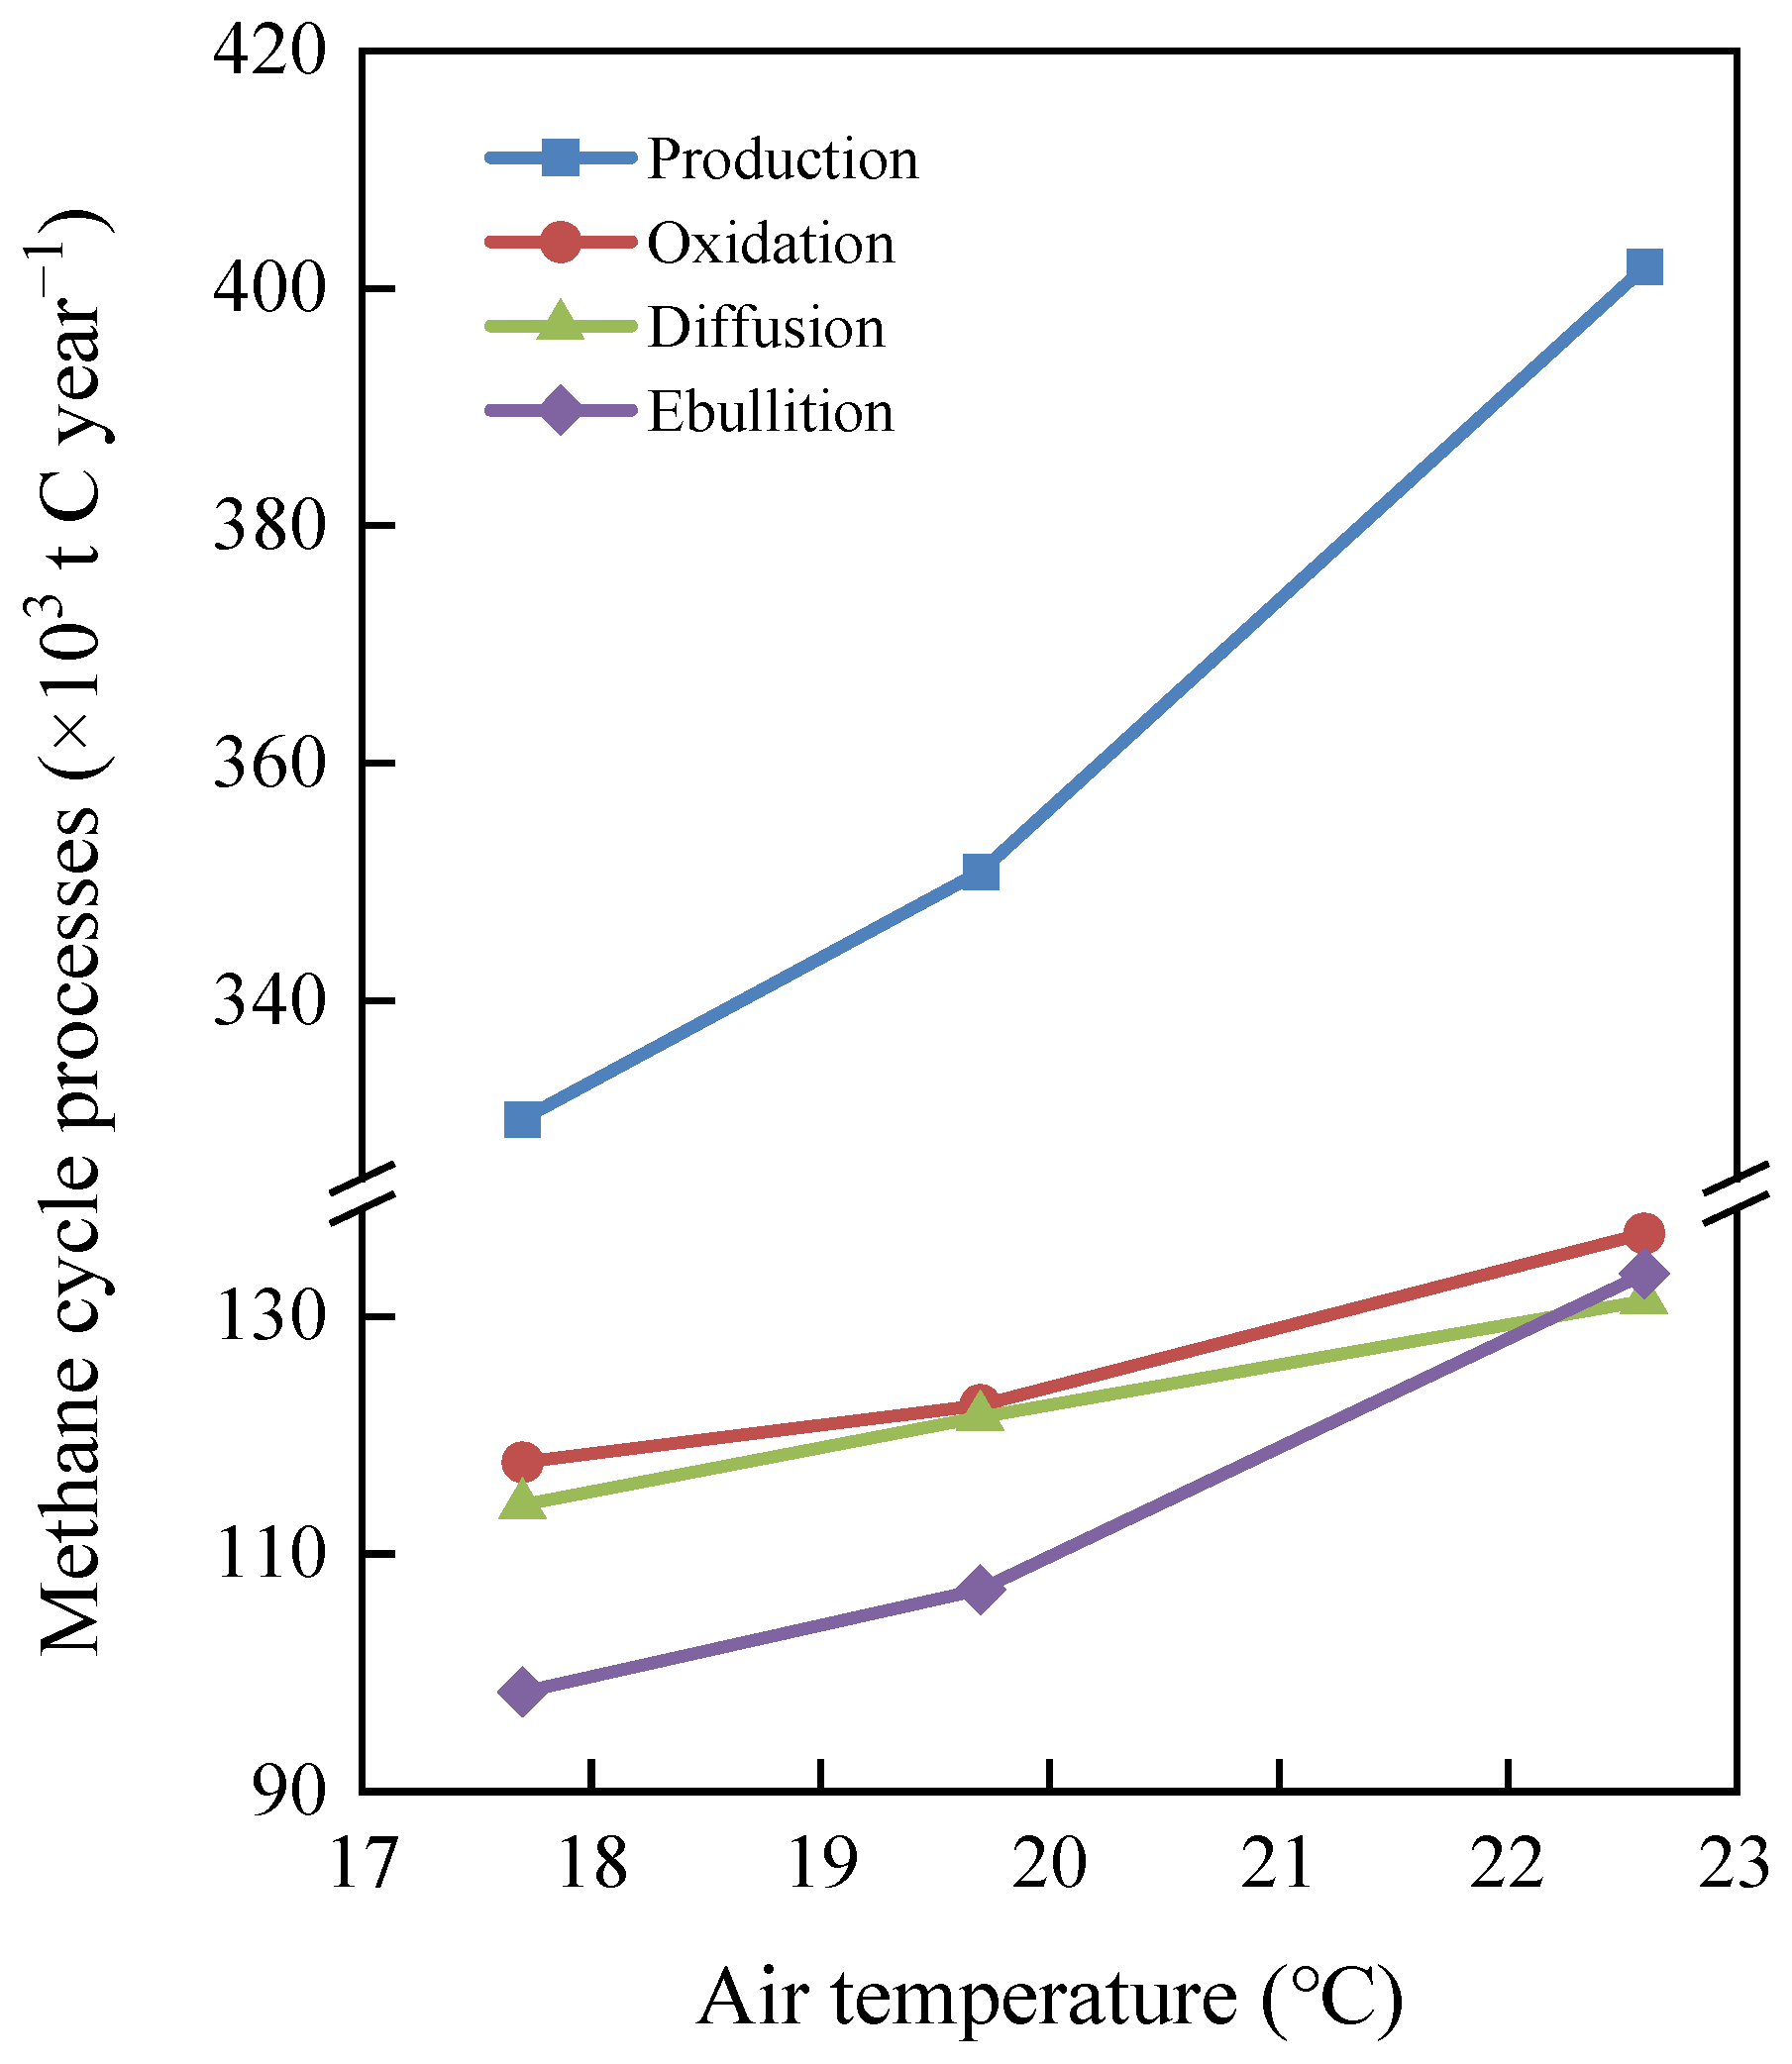
Results show that annual sediment CH4 cycle flux increased under the warmer SSPs (Figure 4 and Table 1). As the annual mean air temperature increased from 17.7 °C (SSP1-2.6) to 19.7 °C (SSP2-4.5), annual CH4 production and ebullition increased by 10.4 × 10³ t C year−1 per °C and 4.3 × 10³ t C year−1 per °C, respectively. Likewise, as annual mean air temperature increased from 19.7 °C to 22.6 °C (SSP5-8.5), annual CH4 production and ebullition increased by 17.5 × 10³ t C year−1 per °C and 9.2 × 10³ t C year−1 per °C, respectively. These modeling results indicated a significant nonlinear relationship between annual CH4 production (or ebullition) and annual mean near-surface air temperature (Figure 4). Additionally, the CH4 oxidation growth rate was slower compared to CH4 production among all SSPs (Figure 4), resulting in a decrease in the CH4 oxidation percentage of CH4 production (Table 1). Meanwhile, the CH4 ebullient flux percentage in CH4 production increased under the warmer SSPs, while the CH4 diffusive flux percentage in CH4 production decreased.
Furthermore, hydrological conditions influence the response of sediment CH4 cycling processes to climate warming. Under the same SSP, even though the differences in annual CH4 production (or oxidation) among the hydrological years were insignificant (less than 5%), the CH4 oxidation percentage in CH4 production decreased as annual runoff decreased (Table 1). In summary, when the annual mean air temperature increased and runoff decreased, the CH4 oxidation percentage in CH4 production decreased. Likewise, the variations in hydrological conditions significantly affected CH4 diffusive (8.1–12.6%) and ebullient (23.6–28.9%) fluxes. Accompanied by a decrement in runoff, the CH4 ebullient flux percentage in CH4 production increased rapidly, while the CH4 diffusive flux percentage in CH4 production decreased slowly (Table 1). This means that diffusion was not always the dominant reservoir sediment CH4 emission pathway, while annual CH4 ebullient flux surpassed diffusive flux and dominates CH4 emissions during the dry year.

3.3. Spatiotemporal Feedback of Sediment Methane Production and Oxidation

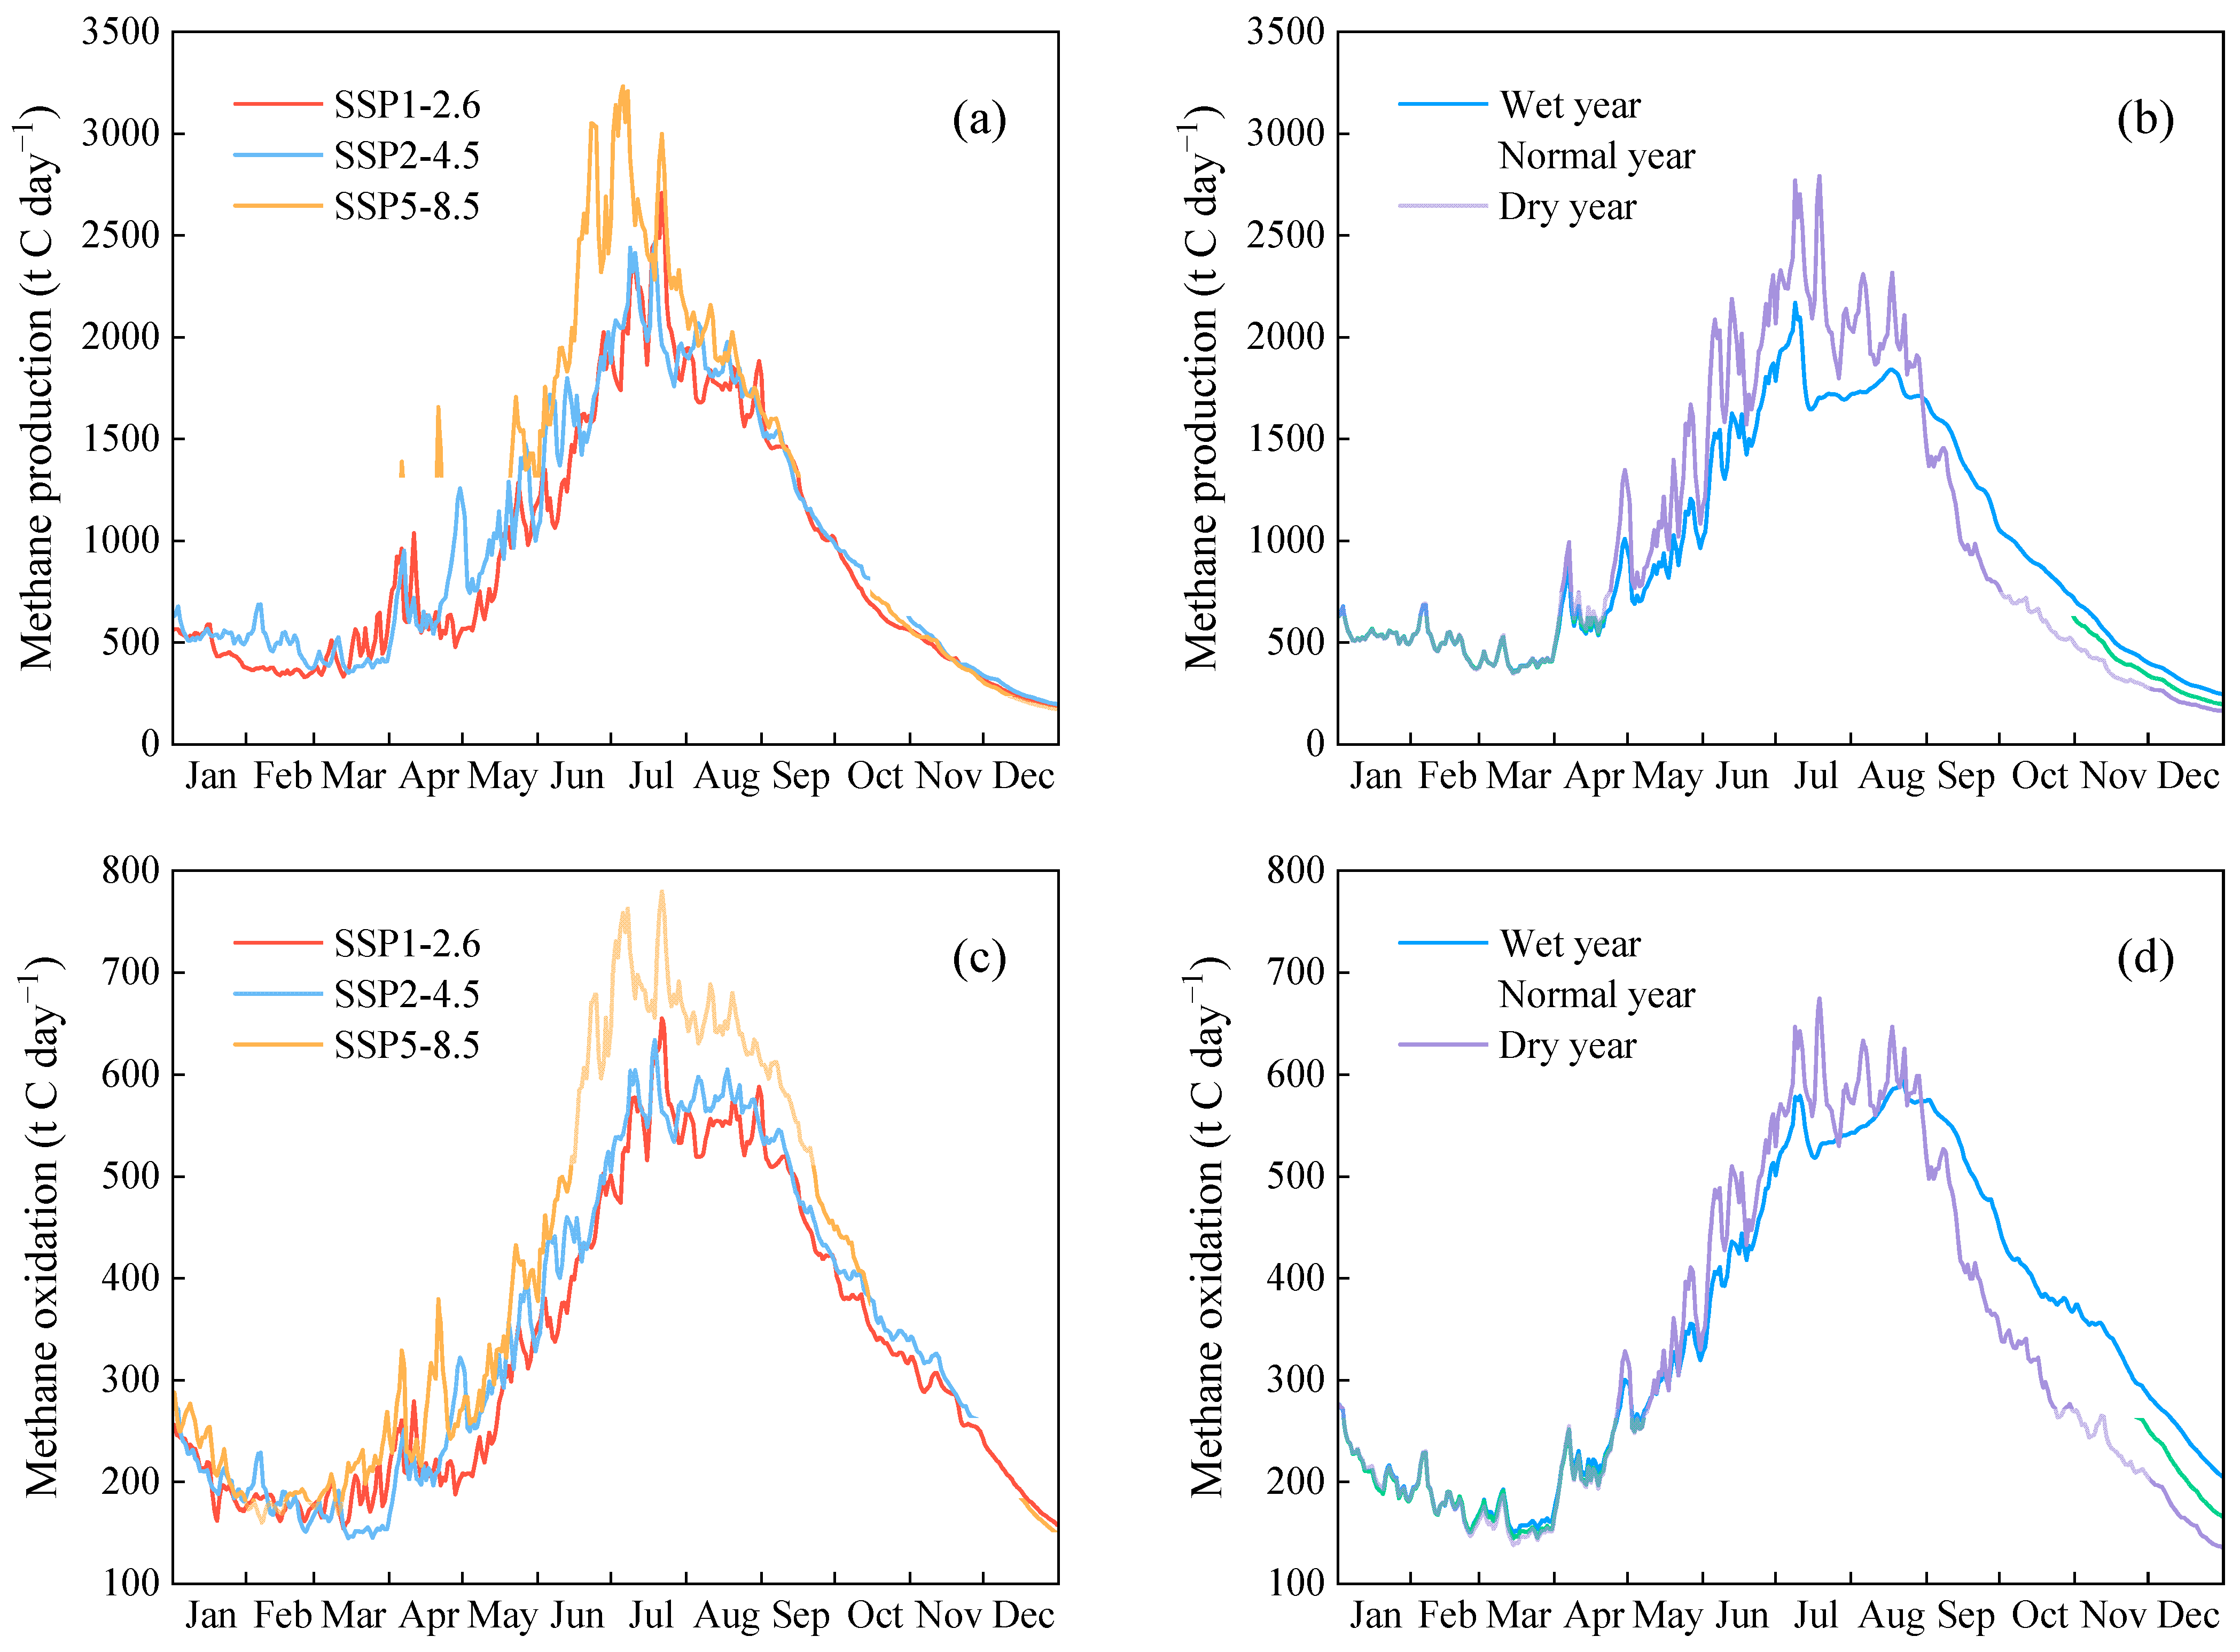
Generally, daily reservoir sediment CH4 production increased as air temperatures increased from January to July and decreased as air temperatures decreased from August to December under the three SSPs (Figure 3 and Figure 5a). This indicated that the methanogenic rate varies with air temperature. Accounting for air temperature differences among the SSPs, daily CH4 production under the SSP2-4.5 was generally higher than under the SSP1-2.6 from January to early June (Figure 3 and Figure 5a). Between mid-June and August, the mean air temperature under the SSP2-4.5 was slightly higher compared to the SSP1-2.6 (0.6 °C). This means that there was no significant difference in CH4 production (29.1 t C day−1). Meanwhile, daily CH4 production was generally highest under the SSP5-8.5 before September, while mean CH4 production was 444.8 t C day−1 (or 415.8 t C day−1) higher compared to the SSP1-2.6 (or SSP2-4.5) from mid-June to August. After August, differences in daily CH4 production among the three SSPs were not significant. Two reasons could explain this phenomenon. Firstly, under the warmer SSPs, given that more POC was consumed in reservoir sediment from January to August, especially in the shallow-water zone and the drawdown area (Figure 6), there was less POC for CH4 production after August. Secondly, less CH4 was produced under the cooler SSPs. Because CH4 was mainly produced in sediment from mid-June to August, differences in CH4 production among the SSPs during this period mainly resulted in a nonlinear relationship between annual CH4 production and annual mean air temperature.
Temporal and spatial CH4 production showed significant differences under the same SSP during all three representative hydrological years (Figure 5b and Figure 6). Under dryer conditions, the sediment temperature response rate to air temperature variation increased in both the reservoir’s shallow- and deep-water zones, causing a time-lag decrease in CH4 production variation. Moreover, compared with CH4 production in shallow- and deep-water zones, CH4 production in the drawdown area is highest during the period when temperatures increased and lowest during the period when temperatures decreased. These led to larger intra-year variations of CH4 production under drier conditions (Figure 5b and Figure 6). Additionally, among the three hydrological years, CH4 production differences during the former period were nearly cancelled out by differences during the latter period, leading to non-significant differences in annual CH4 production under the same SSP.
In general, the feedback trend in daily sediment CH4 oxidation to warming under all three hydrological conditions was similar to that of CH4 production (Figure 5). Nevertheless, daily CH4 oxidation under the SSP5-8.5 was slightly higher than the other SSPs from September to October (Figure 5c). This is because methanotrophic rates increased under the warmer SSPs, which were subject to similar daily CH4 production among all SSPs during this period. Besides, the CH4 oxidation percentage in CH4 production in the reservoir’s drawdown area is inversely proportional to air temperature. That is, as the air temperature increased, the percentage of CH4 oxidation decreased. Under the warmer SSPs, this phenomenon became more apparent.

3.4. Feedback of Sediment Methane Emissions

The feedback trend in daily sediment CH4 diffusive flux to warming was similar to that of CH4 production (Figure 5a and Figure 7a). Additionally, mean diffusive flux between mid-June and August under the SSP5-8.5 was significantly larger, being 85.5 t C day−1 and 80.1 t C day−1 larger than that under the SSP1-2.6 and SSP2-4.5, respectively. In other words, the difference in mean diffusive flux during that period between SSP1-2.6 and SSP2-4.5 was insignificant (Figure 7a). Besides, the impacts of hydrological conditions on diffusive flux differed from CH4 production under the same SSP (Figure 5b and Figure 7b). Due to different runoff during three hydrological years, the differences in water level became apparent. At the same time, as air temperature increased, the differences in daily CH4 diffusive flux became gradually significant (Figure 7b). As the air temperature decreased, the differences became insignificant (Figure 7b). The maximum differences occurred in mid-September. That is, daily CH4 diffusive flux in mid-September during the wet year is 129.9 t C day−1 and 283.1 t C day−1 larger than that during the normal and dry years, respectively. Consequently, different hydrological conditions could enlarge the differences in daily CH4 diffusive flux under the SSPs.
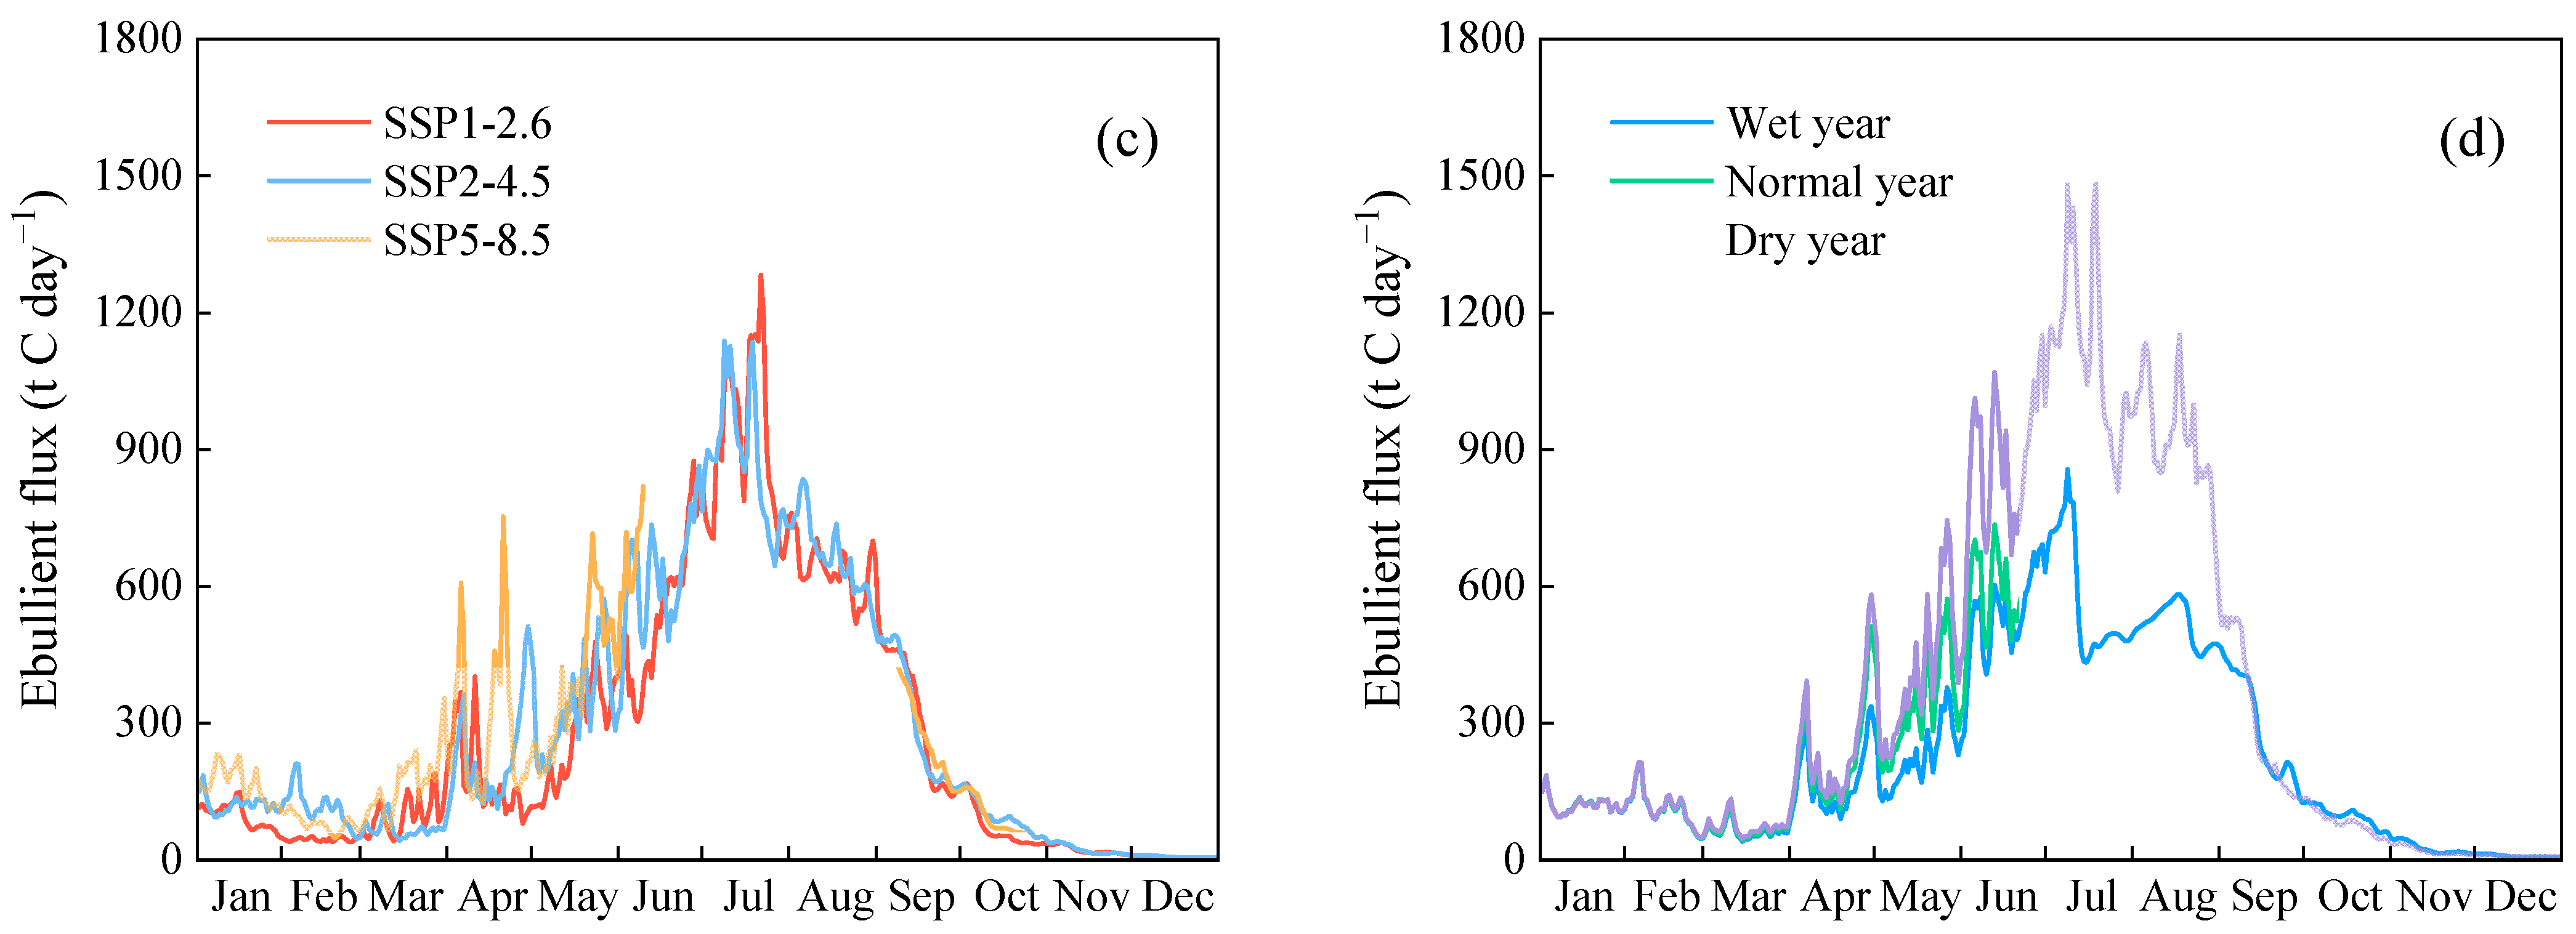
Compared with the feedback trend in daily sediment CH4 diffusive flux to warming, daily sediment CH4 ebullient flux increased or decreased more rapidly as air temperature (Figure 7c). Additionally, mean ebullient flux between mid-June and August under the SSP5-8.5 was significantly larger, being 231.6 t C day−1 and 227.0 t C day−1 larger than that under the SSP1-2.6 and SSP2-4.5, respectively. During this period, the differences in CH4 ebullient flux between SSP5-8.5 and SSP1-2.6 (or SSP2-4.5) were more significant than those in diffusive flux. Compared Figure 7b and Figure 7d, in general, ebullition was the main sediment CH4 emission pathway in the summer. Moreover, the variations in hydrological conditions affected the time duration of ebullition as the main emission pathway, lasting nearly four months, less than three months, and several days during the dry, normal, and wet years, respectively. Additionally, the increment in time duration resulted in reservoir CH4 released into the atmosphere increasing sharply.

3.5. Reservoir Methane Emission to the Atmosphere

When CH4 was transported from sediment to the water column and then to the atmosphere via diffusion, most was oxidized in the water column while only 0.1–0.2 × 10³ t C year−1 was released to the atmosphere under the SSPs during all three hydrological years (less than 0.2%). Nevertheless, CH4 in bubbles is seldom released into the water column. In other words, most CH4 in bubbles is released into the atmosphere under the SSPs during all three hydrological years (51.3–137.7 × 10³ t C year−1, 67.8–84.6%). Consequently, the CH4 ebullient flux feedback to climate warming is more important than that of diffusive flux, the former of which will mainly affect future climate change. CH4 ebullient flux to the atmosphere was higher under the warmer SSPs (i.e., 76.8, 82.7, and 103.3 × 10³ t C year−1 under the SSP1-2.6, SSP2-4.5, and SSP5-8.5 during the normal year, respectively). Meanwhile, CH4 ebullient flux to the atmosphere increased as runoff decreased (i.e., 56.8, 82.7, and 110.6 × 10³ t C year−1 under the SSP2-4.5 during the wet, normal, and dry year, respectively). Thus, annual CH4 ebullient flux (137.7 × 10³ t C year−1) was highest under the SSP5-8.5 during the dry year, accounting for 33% of CH4 production. Likewise, annual CH4 ebullient flux (51.3 × 10³ t C year−1) was the lowest under the SSP1-2.6 during the wet year, accounting for 16% of CH4 production.

4. Conclusions

Climatic and hydrological conditions influence both reservoir methane (CH4) cycling processes and emissions. This study combined a reservoir CH4 cycle model and a Statistical DownScaling Model (SDSM) to evaluate reservoir CH4 cycling feedbacks under multiple climate change scenarios while accounting for hydrological uncertainty. China’s Danjiangkou Reservoir was used as a case study to evaluate the impact of climate change on spatiotemporal reservoir CH4 cycling processes. Due to differences in daily summer air temperatures under the three SSPs, annual CH4 production and ebullition showed a significant and increasing nonlinear relationship with the annual mean near-surface air temperature. The annual CH4 oxidation percentage in annual CH4 production decreased when the annual mean air temperature increased and runoff decreased. At the same time, the phenomenon that the CH4 oxidation percentage in CH4 production in the reservoir’s drawdown area was inversely proportional to air temperature became more apparent under the warmer SSPs. Besides, although diffusion was the main CH4 emission pathway in sediment during the wet and normal years, CH4 ebullient flux surpassed diffusive flux and dominated CH4 emissions during the dry year. Likewise, less than 0.2% of CH4 released from sediment via diffusion was released to the atmosphere (0.1–0.2 × 10³ t C year−1), while 67.8–84.6% of CH4 released from sediment via ebullition was released to the atmosphere (51.3–137.7 × 10³ t C year−1). Thus, the CH4 ebullient flux feedback to climate warming was more important than that of diffusive flux. CH4 ebullient flux increased as air temperatures increased, and runoff decreased. That is, annual CH4 ebullient flux was highest (137.7 × 10³ t C year−1) under the SSP5-8.5 during the dry year, while it was lowest (51.3 × 10³ t C year−1) under the SSP1-2.6 during the wet year. This means that high air temperatures and low runoff aggravated CH4 emissions as well as climate warming, while low air temperatures and high runoff were beneficial in reducing reservoir CH4 emissions. This study could help researchers predict reservoir CH4 emission dynamics while directing decision-making policies for reservoir sustainability.
This study did not account for the impacts of future precipitation changes on reservoir CH4 cycling processes due to the difficulty of accurate precipitation prediction. Meanwhile, POC loading varied in reservoir sediment under different hydrological conditions. This could affect the modeling results of reservoir CH4 cycling flux. After the improvement in GCMs and decrease in uncertainty, accounting for the impacts of multiple factors (air temperature, precipitation, and POC loading affected by runoff) on reservoir CH4 cycling will be a prospective research topic. Besides, reservoir CH4 emissions could be effectively controlled by reservoir operation policy adjustments. A reservoir operation policy that considers both economic benefit improvements and CH4 emission reductions is urgently needed to mitigate the positive feedback between reservoir CH4 emissions and climate warming.

Author Contributions

Conceptualization, Z.X. and Y.L.; methodology, Y.L. and W.F.; software, Y.L. and G.X.; writing—original draft preparation, Y.L.; writing—review and editing, Z.X.; supervision, Z.X. All authors have read and agreed to the published version of the manuscript.

Funding

This research was funded by Guangdong Basic and Applied Basic Research Foundation (No. 2022A1515010184), Guangzhou Science and Technology Planning Project (2023A04J2014), and Guangdong Provincial Key Laboratory of Water Quality Improvement and Ecological Restoration for Watersheds (No. 2022-02).

Institutional Review Board Statement

Not applicable.

Informed Consent Statement

Not applicable.

Data Availability Statement

Partial data can be obtained from the websites and references mentioned in the text. Partial data on the case study are available from the corresponding author upon reasonable request.

Acknowledgments

The authors acknowledge the Guangdong Basic and Applied Basic Research Foundation, Guangzhou Science and Technology Planning Project, and Guangdong Provincial Key Laboratory of Water Quality Improvement and Ecological Restoration for Watersheds for support.

Conflicts of Interest

The authors declare no conflict of interest.

References

  1. IPCC. Climate Change 2013: The Physical Science Basis. Contribution of Working Group I to the Fifth Assessment Report of the Intergovernmental Panel on Climate Change; Cambridge University Press: Cambridge, UK; New York, NY, USA, 2013. [Google Scholar]
  2. Gedney, N.; Huntingford, C.; Comyn-Platt, E.; Wiltshire, A. Significant feedbacks of wetland methane release on climate change and the causes of their uncertainty. Environ. Res. Lett. 2019, 14, 084027. [Google Scholar] [CrossRef] [Green Version]
  3. Zhu, Y.; Purdy, K.J.; Eyice, Ö.; Shen, L.; Harpenslager, S.F.; Yvon-Durocher, G.; Dumbrell, A.J.; Trimmer, M. Disproportionate increase in freshwater methane emissions induced by experimental warming. Nat. Clim. Chang. 2020, 10, 685–690. [Google Scholar] [CrossRef]
  4. Deemer, B.R.; Harrison, J.A.; Li, S.; Beaulieu, J.J.; DelSontro, T.; Barros, N.; Bezerra-Neto, J.F.; Powers, S.M.; Dos Santos, M.A.; Vonk, J.A. Greenhouse gas emissions from reservoir water surfaces: A new global synthesis. Bioscience 2016, 66, 949–964. [Google Scholar] [CrossRef] [PubMed] [Green Version]
  5. Keller, P.S.; Marcé, R.; Obrador, B.; Koschorreck, M. Global carbon budget of reservoirs is overturned by the quantification of drawdown areas. Nat. Geosci. 2021, 14, 402–408. [Google Scholar] [CrossRef]
  6. Harrison, J.A.; Prairie, Y.T.; Mercier-Blais, S.; Soued, C. Year-2020 global distribution and pathways of reservoir methane and carbon dioxide emissions according to the Greenhouse Gas from Reservoirs (G-res) model. Glob. Biogeochem. Cycles 2021, 35, e2020GB006888. [Google Scholar] [CrossRef]
  7. Soued, C.; Harrison, J.A.; Mercier-Blais, S.; Prairie, Y.T. Reservoir CO2 and CH4 emissions and their climate impact over the period 1900–2060. Nat. Geosci. 2022, 15, 700–705. [Google Scholar] [CrossRef]
  8. Maavara, T.; Lauerwald, R.; Regnier, P.; Van Cappellen, P. Global perturbation of organic carbon cycling by river damming. Nat. Commun. 2017, 8, 15347. [Google Scholar] [CrossRef] [Green Version]
  9. Maeck, A.; Delsontro, T.; McGinnis, D.F.; Fischer, H.; Flury, S.; Schmidt, M.; Fietzek, P.; Lorke, A. Sediment trapping by dams creates methane emission hot spots. Environ. Sci. Technol. 2013, 47, 8130–8137. [Google Scholar] [CrossRef]
  10. Sobek, S.; DelSontro, T.; Wongfun, N.; Wehrli, B. Extreme organic carbon burial fuels intense methane bubbling in a temperate reservoir. Geophys. Res. Lett. 2012, 39, L01401. [Google Scholar] [CrossRef] [Green Version]
  11. Berberich, M.E.; Beaulieu, J.J.; Hamilton, T.L.; Waldo, S.; Buffam, I. Spatial variability of sediment methane production and methanogen communities within a eutrophic reservoir: Importance of organic matter source and quantity. Limnol. Oceanogr. 2020, 65, 1336–1358. [Google Scholar] [CrossRef] [Green Version]
  12. Sawakuchi, H.O.; Bastviken, D.; Enrich-Prast, A.; Ward, N.D.; Camargo, P.B.; Richey, J.E. Low diffusive methane emissions from the main channel of a large Amazonian run-of-the-river reservoir attributed to high methane oxidation. Front. Environ. Sci. 2021, 9, 655455. [Google Scholar] [CrossRef]
  13. DelSontro, T.; McGinnis, D.F.; Sobek, S.; Ostrovsky, I.; Wehrli, B. Extreme methane emissions from a Swiss hydropower reservoir: Contribution from bubbling sediments. Environ. Sci. Technol. 2010, 44, 2419–2425. [Google Scholar] [CrossRef] [PubMed]
  14. Paranaíba, J.R.; Barros, N.; Mendonça, R.; Linkhorst, A.; Isidorova, A.; Roland, F.; Almeida, R.M.; Sobek, S. Spatially resolved measurements of CO2 and CH4 concentration and gas-exchange velocity highly influence carbon-emission estimates of reservoirs. Environ. Sci. Technol. 2018, 52, 607–615. [Google Scholar] [CrossRef] [Green Version]
  15. Wu, S.; Li, S.; Zou, Z.; Hu, T.; Hu, Z.; Liu, S.; Zou, J. High methane emissions largely attributed to ebullitive fluxes from a subtropical river draining a rice paddy watershed in China. Environ. Sci. Technol. 2019, 53, 3499–3507. [Google Scholar] [CrossRef] [PubMed]
  16. Delwiche, K.B.; Harrison, J.A.; Maasakkers, J.D.; Sulprizio, M.P.; Worden, J.; Jacob, D.J.; Sunderland, E.M. Estimating drivers and pathways for hydroelectric reservoir methane emissions using a new mechanistic model. J. Geophys. Res. Biogeosci. 2022, 127, e2022JG006908. [Google Scholar] [CrossRef]
  17. Li, G.; Yang, M.; Zhang, Y.; Grace, J.; Lu, C.; Zeng, Q.; Jia, Y.; Liu, Y.; Lei, J.; Geng, X.; et al. Comparison model learning methods for methane emission prediction of reservoirs on a regional field scale: Performance and adaptation of methods with different experimental datasets. Ecol. Eng. 2020, 157, 105990. [Google Scholar] [CrossRef]
  18. Liu, L.; Yang, Z.J.; Delwiche, K.; Long, L.H.; Liu, J.; Liu, D.F.; Wang, C.F.; Bodmer, P.; Lorke, A. Spatial and temporal variability of methane emissions from cascading reservoirs in the Upper Mekong River. Water Res. 2020, 186, 116319. [Google Scholar] [CrossRef]
  19. Johnson, M.S.; Matthews, E.; Bastviken, D.; Deemer, B.; Du, J.; Genovese, V. Spatiotemporal methane emission from global reservoirs. J. Geophys. Res. Biogeosci. 2021, 126, e2021JG006305. [Google Scholar] [CrossRef]
  20. Dean, J.F.; Middelburg, J.J.; Röckmann, T.; Aerts, R.; Blauw, L.G.; Egger, M.; Jetten, M.S.M.; de Jong, A.E.E.; Meisel, O.H.; Rasigraf, O.; et al. Methane feedbacks to the global climate system in a warmer world. Rev. Geophys. 2018, 56, 207–250. [Google Scholar] [CrossRef] [Green Version]
  21. Turetsky, M.R.; Kotowska, A.; Bubier, J.; Dise, N.B.; Crill, P.; Hornibrook, E.R.; Minkkinen, K.; Moore, T.R.; Myers-Smith, I.H.; Nykanen, H.; et al. A synthesis of methane emissions from 71 northern, temperate, and subtropical wetlands. Glob. Chang. Biol. 2014, 20, 2183–2197. [Google Scholar] [CrossRef]
  22. Taherdangkoo, R.; Liu, Q.; Xing, Y.; Yang, H.; Cao, V.; Sauter, M.; Butscher, C. Predicting methane solubility in water and seawater by machine learning algorithms: Application to methane transport modeling. J. Contam. Hydrol. 2021, 242, 103844. [Google Scholar] [CrossRef] [PubMed]
  23. Zou, J.; Ziegler, A.D.; Chen, D.; McNicol, G.; Ciais, P.; Jiang, X.; Zheng, C.; Wu, J.; Wu, J.; Lin, Z.; et al. Rewetting global wetlands effectively reduces major greenhouse gas emissions. Nat. Geosci. 2022, 15, 627–632. [Google Scholar] [CrossRef]
  24. Chen, H.; Xu, X.; Fang, C.; Li, B.; Nie, M. Differences in the temperature dependence of wetland CO2 and CH4 emissions vary with water table depth. Nat. Clim. Chang. 2021, 11, 766–771. [Google Scholar] [CrossRef]
  25. Xu, Z.; Cai, X.; Yin, X.; Su, M.; Wu, Y.; Yang, Z. Is water shortage risk decreased at the expense of deteriorating water quality in a large water supply reservoir? Water Res. 2019, 165, 114984. [Google Scholar] [CrossRef]
  26. Liu, M.; Zhang, Y.; Shi, K.; Zhu, G.; Wu, Z.; Liu, M.; Zhang, Y. Thermal stratification dynamics in a large and deep subtropical reservoir revealed by high-frequency buoy data. Sci. Total Environ. 2019, 651, 614–624. [Google Scholar] [CrossRef]
  27. Thompson, R.L. Satellite constraints on the latitudinal distribution and temperature sensitivity of wetland methane emissions. AGU Adv. 2021, 2, e2021AV000408. [Google Scholar]
  28. Zhang, Y.; Zhang, G.; Pan, J.; Fan, Z.; Chen, F.; Liu, Y. Soil organic carbon distribution in relation to terrain & land use—A case study in a small watershed of Danjiangkou reservoir area, China. Glob. Ecol. Conserv. 2019, 20, e00731. [Google Scholar]
  29. Jenny, J.-P.; Arnaud, F.; Dorioz, J.-M.; Covex, C.G.; Frossard, V.; Sabatier, P.; Millet, L.; Reyss, J.-L.; Tachikawa, K.; Bard, E.; et al. A spatiotemporal investigation of varved sediments highlights the dynamics of hypolimnetic hypoxia in a large hard-water lake over the last 150 years. Limnol. Oceanogr. 2013, 58, 1395–1408. [Google Scholar] [CrossRef]
  30. Tong, Y.; Xiwen, X.; Miao, Q.; Jingjing, S.; Yiyan, Z.; Wei, Z.; Mengzhu, W.; Xuejun, W.; Yang, Z. Lake warming intensifies the seasonal pattern of internal nutrient cycling in the eutrophic lake and potential impacts on algal blooms. Water Res. 2021, 188, 116570. [Google Scholar]
  31. D’Ambrosio, S.L.; Harrison, J.A. Methanogenesis exceeds CH4 consumption in eutrophic lake sediments. Limnol. Oceanogr. Lett. 2021, 6, 173–181. [Google Scholar] [CrossRef]
  32. Hounshell, A.G.; McClure, R.P.; Lofton, M.E.; Carey, C.C. Whole-ecosystem oxygenation experiments reveal substantially greater hypolimnetic methane concentrations in reservoirs during anoxia. Limnol. Oceanogr. Lett. 2020, 6, 33–42. [Google Scholar] [CrossRef]
  33. Dai, Z.; Zhang, C.; Wang, L.; Fu, Y.; Zhang, Y. Interpreting the influence of rainfall and reservoir water level on a large-scale expansive soil landslide in the Danjiangkou Reservoir region, China. Eng. Geol. 2021, 288, 106110. [Google Scholar] [CrossRef]
  34. Beaulieu, J.J.; Balz, D.A.; Birchfield, M.K.; Harrison, J.A.; Nietch, C.T.; Platz, M.C.; Squier, W.C.; Waldo, S.; Walker, J.T.; White, K.M.; et al. Effects of an experimental water-level drawdown on methane emissions from a eutrophic reservoir. Ecosystems 2018, 21, 657–674. [Google Scholar] [CrossRef] [PubMed] [Green Version]
  35. Harrison, J.A.; Deemer, B.R.; Birchfield, M.K.; O’Malley, M.T. Reservoir water-level drawdowns accelerate and amplify methane emission. Environ. Sci. Technol. 2017, 51, 1267–1277. [Google Scholar] [CrossRef]
  36. Hamrick, J.M. A Three-Dimensional Environmental Fluid Dynamics Computer Code: Theoretical and Computational Aspects; Virginia Institute of Marine Science and School of Marine Science, The College of William and Mary: Gloucester Point, VA, USA, 1992. [Google Scholar]
  37. Xu, S.; He, G.; Fang, H.; Bai, S.; Wu, X. Parameter uncertainty and sensitivity analysis of the three Gorges Reservoir and Xiangxi River EFDC model. J. Hydrol. 2022, 610, 127881. [Google Scholar] [CrossRef]
  38. Shin, S.; Her, Y.; Song, J.-H.; Kang, M.-S. Integrated sediment transport process modeling by coupling Soil and Water Assessment Tool and Environmental Fluid Dynamics Code. Environ. Model. Softw. 2019, 116, 26–39. [Google Scholar] [CrossRef]
  39. Zhang, H.; Sun, T.; Yang, W. Short-term environmental flow assessment of a functional estuarine tidal flat ecosystem: A nonlinear ecological response to flow alteration. Water Resour. Res. 2020, 56, e2020WR027084. [Google Scholar] [CrossRef]
  40. Chen, L.; Yang, Z.; Liu, H. Assessing the eutrophication risk of the Danjiangkou Reservoir based on the EFDC model. Ecol. Eng. 2016, 96, 117–127. [Google Scholar] [CrossRef]
  41. DSI LLC. EFDC+ Theory, Version 10.3; DSI LLC: Edmonds, WA, USA, 2022. [Google Scholar]
  42. Ostrovsky, I.; McGinnis, D.F.; Lapidus, L.; Eckert, W. Quantifying gas ebullition with echosounder: The role of methane transport by bubbles in a medium-sized lake. Limnol. Oceanogr. Methods 2008, 6, 105–118. [Google Scholar] [CrossRef] [Green Version]
  43. Xu, Z.; Yu, C.; Sun, H.; Yang, Z. The response of sediment phosphorus retention and release to reservoir operations: Numerical simulation and surrogate model development. J. Clean. Prod. 2020, 271, 122688. [Google Scholar] [CrossRef]
  44. Birkinshaw, S.J.; Guerreiro, S.B.; Nicholson, A.; Liang, Q.; Quinn, P.; Zhang, L.; He, B.; Yin, J.; Fowler, H.J. Climate change impacts on Yangtze River discharge at the Three Gorges Dam. Hydrol. Earth Syst. Sci. 2017, 21, 1911–1927. [Google Scholar] [CrossRef] [Green Version]
  45. Chen, L.; Frauenfeld, O.W. Surface air temperature changes over the twentieth and twenty-first centuries in China simulated by 20 CMIP5 models. J. Clim. 2014, 10, 3920–3937. [Google Scholar] [CrossRef]
  46. Zhang, Y.; You, Q.; Chen, C.; Ge, J. Impacts of climate change on streamflows under RCP scenarios: A case study in Xin River Basin, China. Atmos. Res. 2016, 178–179, 521–534. [Google Scholar] [CrossRef]
  47. Wilby, R.L.; Dawson, C.W.; Murphy, C.; O’Connor, P.; Hawkins, E. The Statistical DownScaling Model—Decision Centric (SDSM-DC): Conceptual basis and applications. Clim. Res. 2014, 61, 259–276. [Google Scholar] [CrossRef] [Green Version]
  48. Wang, H.M.; Chen, J.; Xu, C.Y.; Zhang, J.; Chen, H. A framework to quantify the uncertainty contribution of GCMs over multiple sources in hydrological impacts of climate change. Earth’s Future 2020, 8, e2020EF001602. [Google Scholar] [CrossRef]
  49. Shen, M.; Chen, J.; Zhuan, M.; Chen, H.; Xu, C.-Y.; Xiong, L. Estimating uncertainty and its temporal variation related to global climate models in quantifying climate change impacts on hydrology. J. Hydrol. 2018, 556, 10–24. [Google Scholar] [CrossRef]
  50. Cai, X.; Rosegrant, M.W. Irrigation technology choices under hydrologic uncertainty: A case study from Maipo River Basin, Chile. Water Resour. Res. 2004, 40, W04103. [Google Scholar] [CrossRef]
Figure 1. Geographic location and boundary of the Danjiangkou Reservoir at its normal pool level (170 m).
Sustainability 15 09197 g001
Figure 2. Comparison between observed and simulated (a) daily mean near-surface air temperature as well as (b) monthly mean air temperature in the verification process.
Sustainability 15 09197 g002
Figure 3. Prediction of daily near-surface air temperature above the surface of the Danjiangkou Reservoir in 2100 under the three SSPs.
Sustainability 15 09197 g003
Figure 4. Flux variations in annual sediment CH4 cycling in the Danjiangkou Reservoir under the SSPs (i.e., 17.7 °C, 19.7 °C, and 22.6 °C in annual mean near-surface air temperature under the SSP1-2.6, SSP2-4.5, and SSP5-8.5, respectively).
Sustainability 15 09197 g004
Figure 5. Temporal variation in (a) methane production and (c) oxidation in the Danjiangkou Reservoir during the normal year under all three SSPs as well as (b) production and (d) oxidation during the wet, normal, and dry years under the SSP2-4.5.
Sustainability 15 09197 g005
Figure 6. Spatial distribution of sediment methane production in the Danjiangkou Reservoir on 20 June during the (a) normal and (b) dry years under the SSP2-4.5.
Sustainability 15 09197 g006
Figure 7. Temporal variation in sediment methane (a) diffusive and (c) ebullient flux in the Danjiangkou Reservoir during the normal year under all three SSPs as well as (b) diffusive and (d) ebullient flux during the wet, normal, and dry years under the SSP2-4.5.
Sustainability 15 09197 g007aSustainability 15 09197 g007b
Table 1. Methane cycle in the Danjiangkou Reservoir under various scenarios.
Hydrological
Year a
SSPs bProductionOxidationDiffusionEbullition
×103 t C Year−1×10³ t C Year−1Percent c×103 t C Year−1Percent c×103 t C Year−1Percent c
WetSSP1-2.6323.1121.538125.93975.723
SSP2-4.5342.7125.637133.73983.424
SSP5-8.5388.2139.136144.837104.327
NormalSSP1-2.6331.1118.436115.13597.629
SSP2-4.5352.0123.235122.935105.830
SSP5-8.5403.3137.934132.833132.533
DrySSP1-2.6335.8113.134101.130121.636
SSP2-4.5357.9118.633107.830131.637
SSP5-8.5413.7133.832116.128163.840
a Annual mean water storage levels were 159.1 m, 152.9 m, and 146.9 m during the wet, normal, and dry years, respectively. b Annual mean near-surface air temperatures under the shared socioeconomic pathway (SSP) 1-2.6, SSP2-4.5, and SSP5-8.5 were 17.7 °C, 19.7 °C, and 22.6 °C, respectively. c Percentage of methane (CH4) oxidation, CH4 diffusive flux, or CH4 ebullient flux in CH4 production.
Disclaimer/Publisher’s Note: The statements, opinions and data contained in all publications are solely those of the individual author(s) and contributor(s) and not of MDPI and/or the editor(s). MDPI and/or the editor(s) disclaim responsibility for any injury to people or property resulting from any ideas, methods, instructions or products referred to in the content.