
Analysis of Carbon Emissions Embodied in the Provincial Trade of China Based on an Input–Output Model and k-Means Algorithm


Abstract
1. Introduction
2. Methodology
2.1. Defining System Boundaries
2.2. Establishment of Provincial IO Table
2.3. Calculation of Embodied Carbon Emissions
2.4. The Relationship between Monetary Trade Flow and Embodied Carbon Emissions
2.5. Clustering Provinces by the Machine Learning Clustering Algorithm
2.6. Data Sources
3. Results
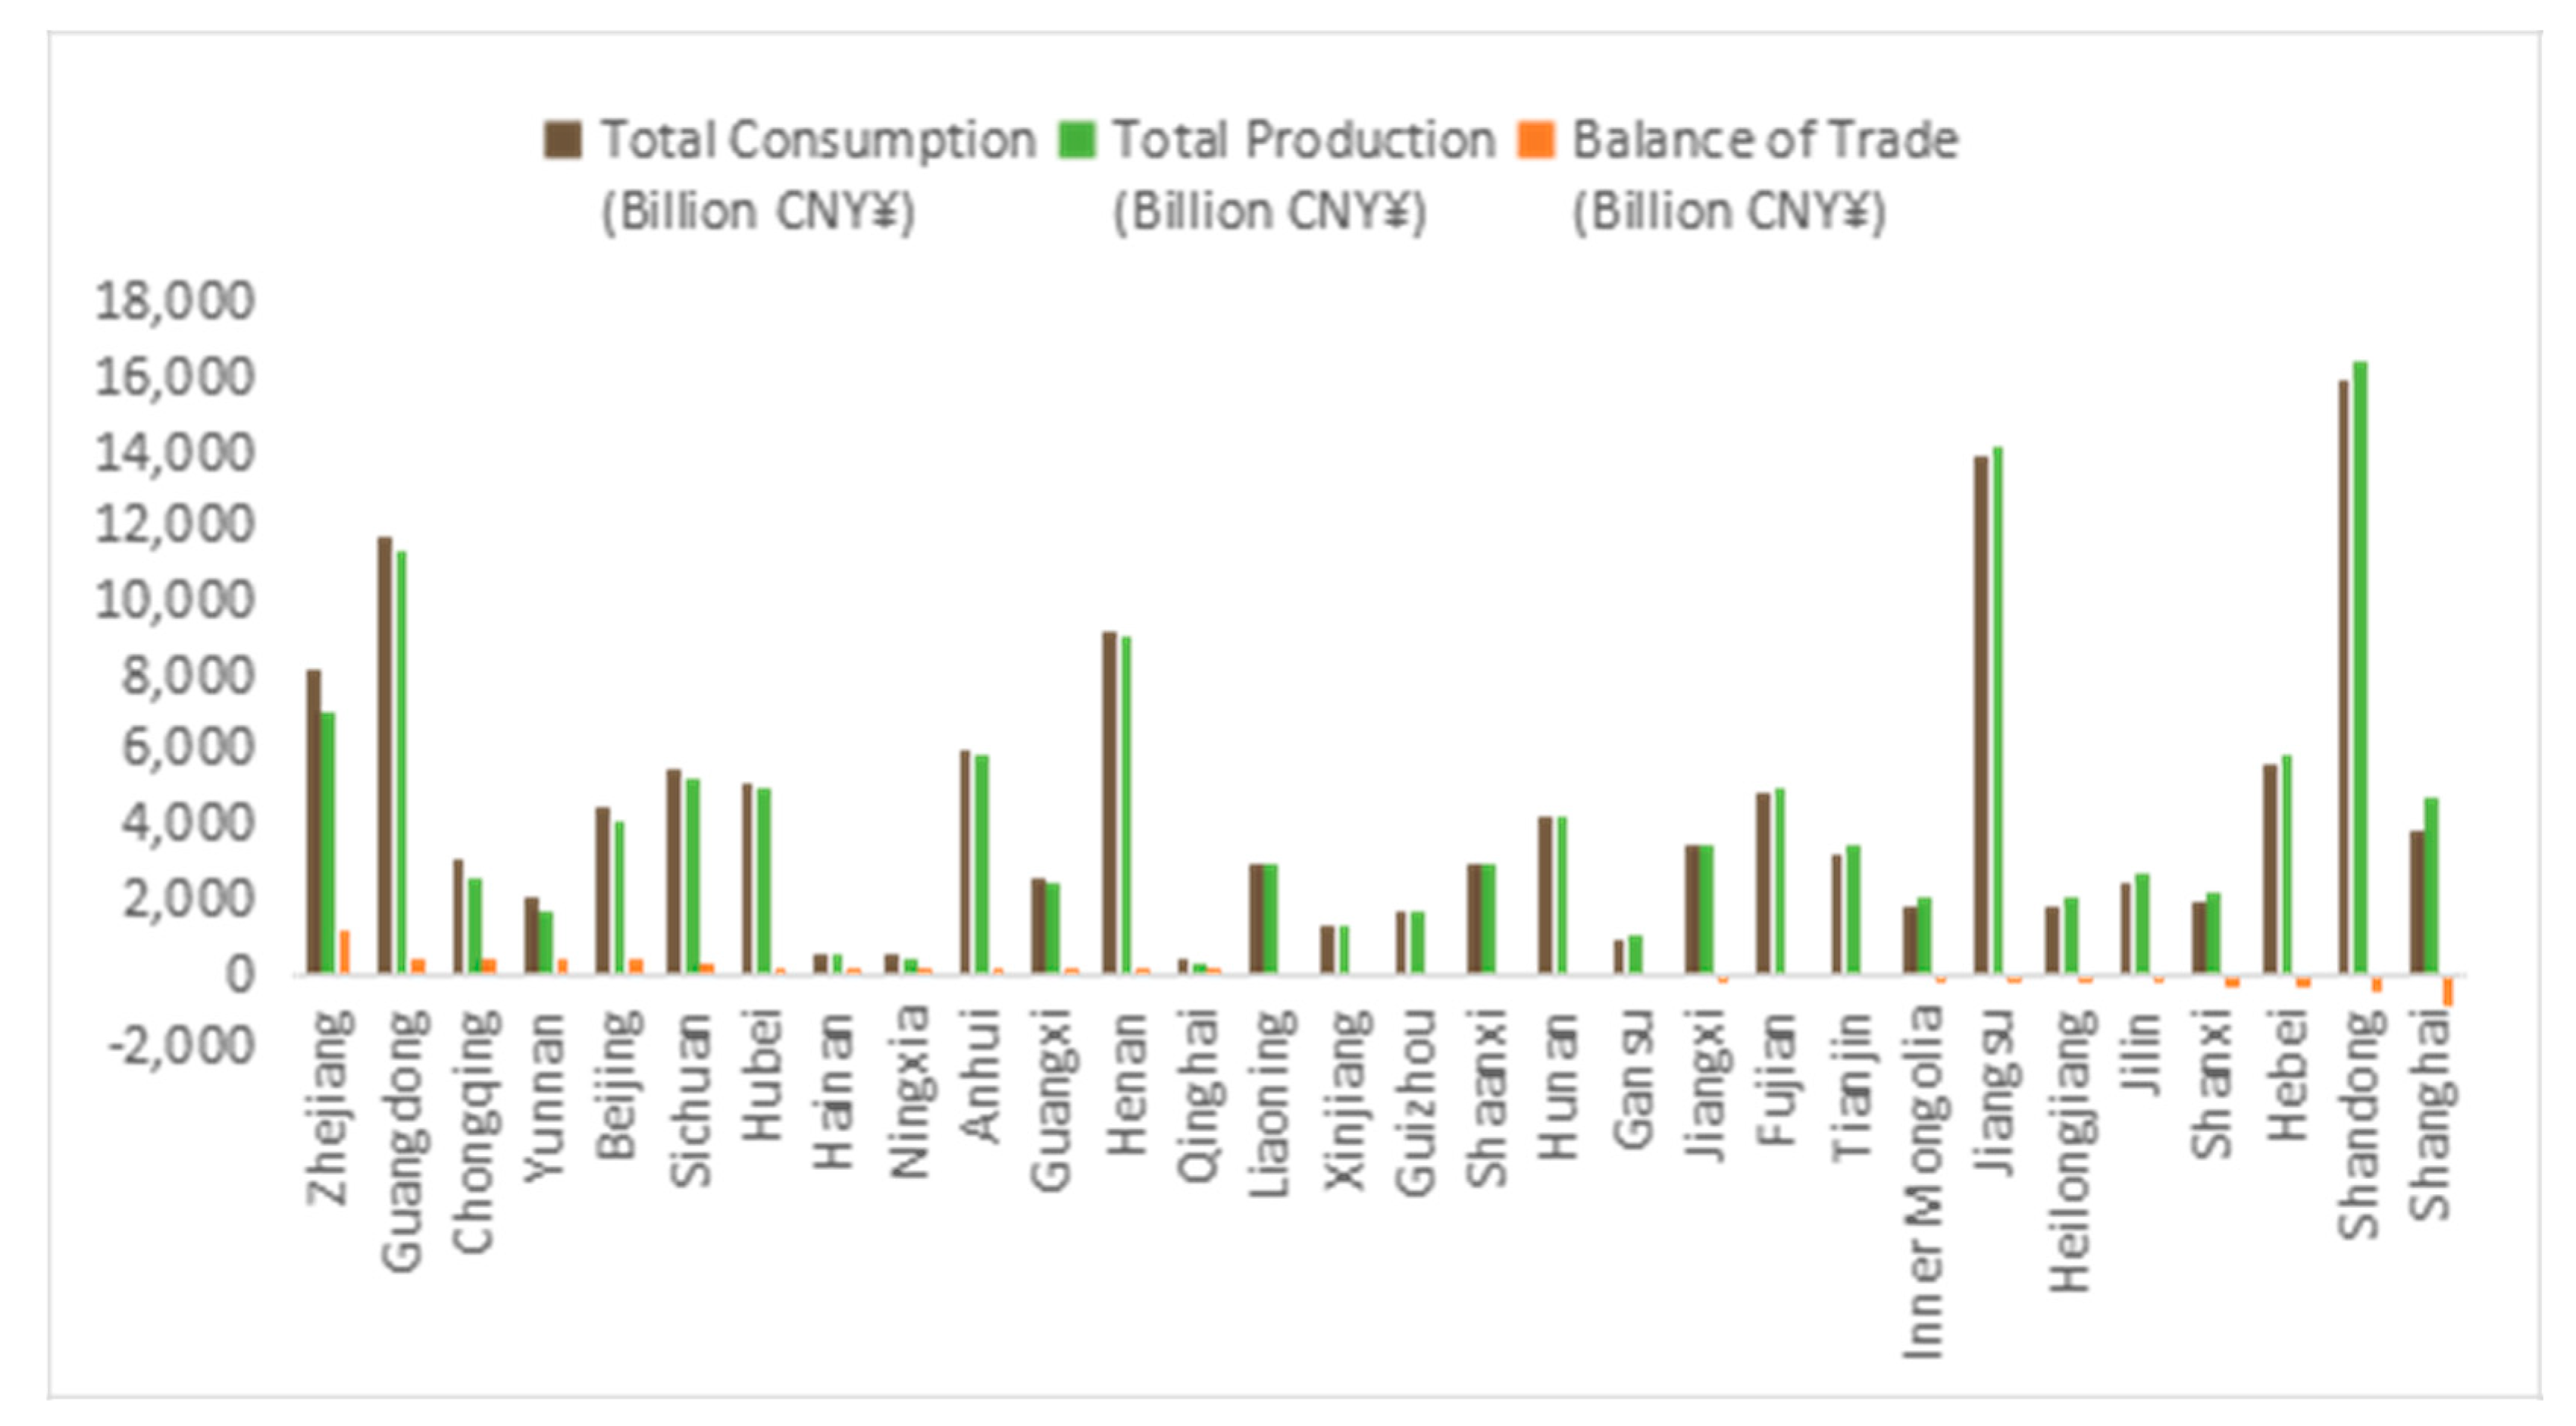
3.1. Carbon Flows Based on Production and Consumption between 30 Provinces
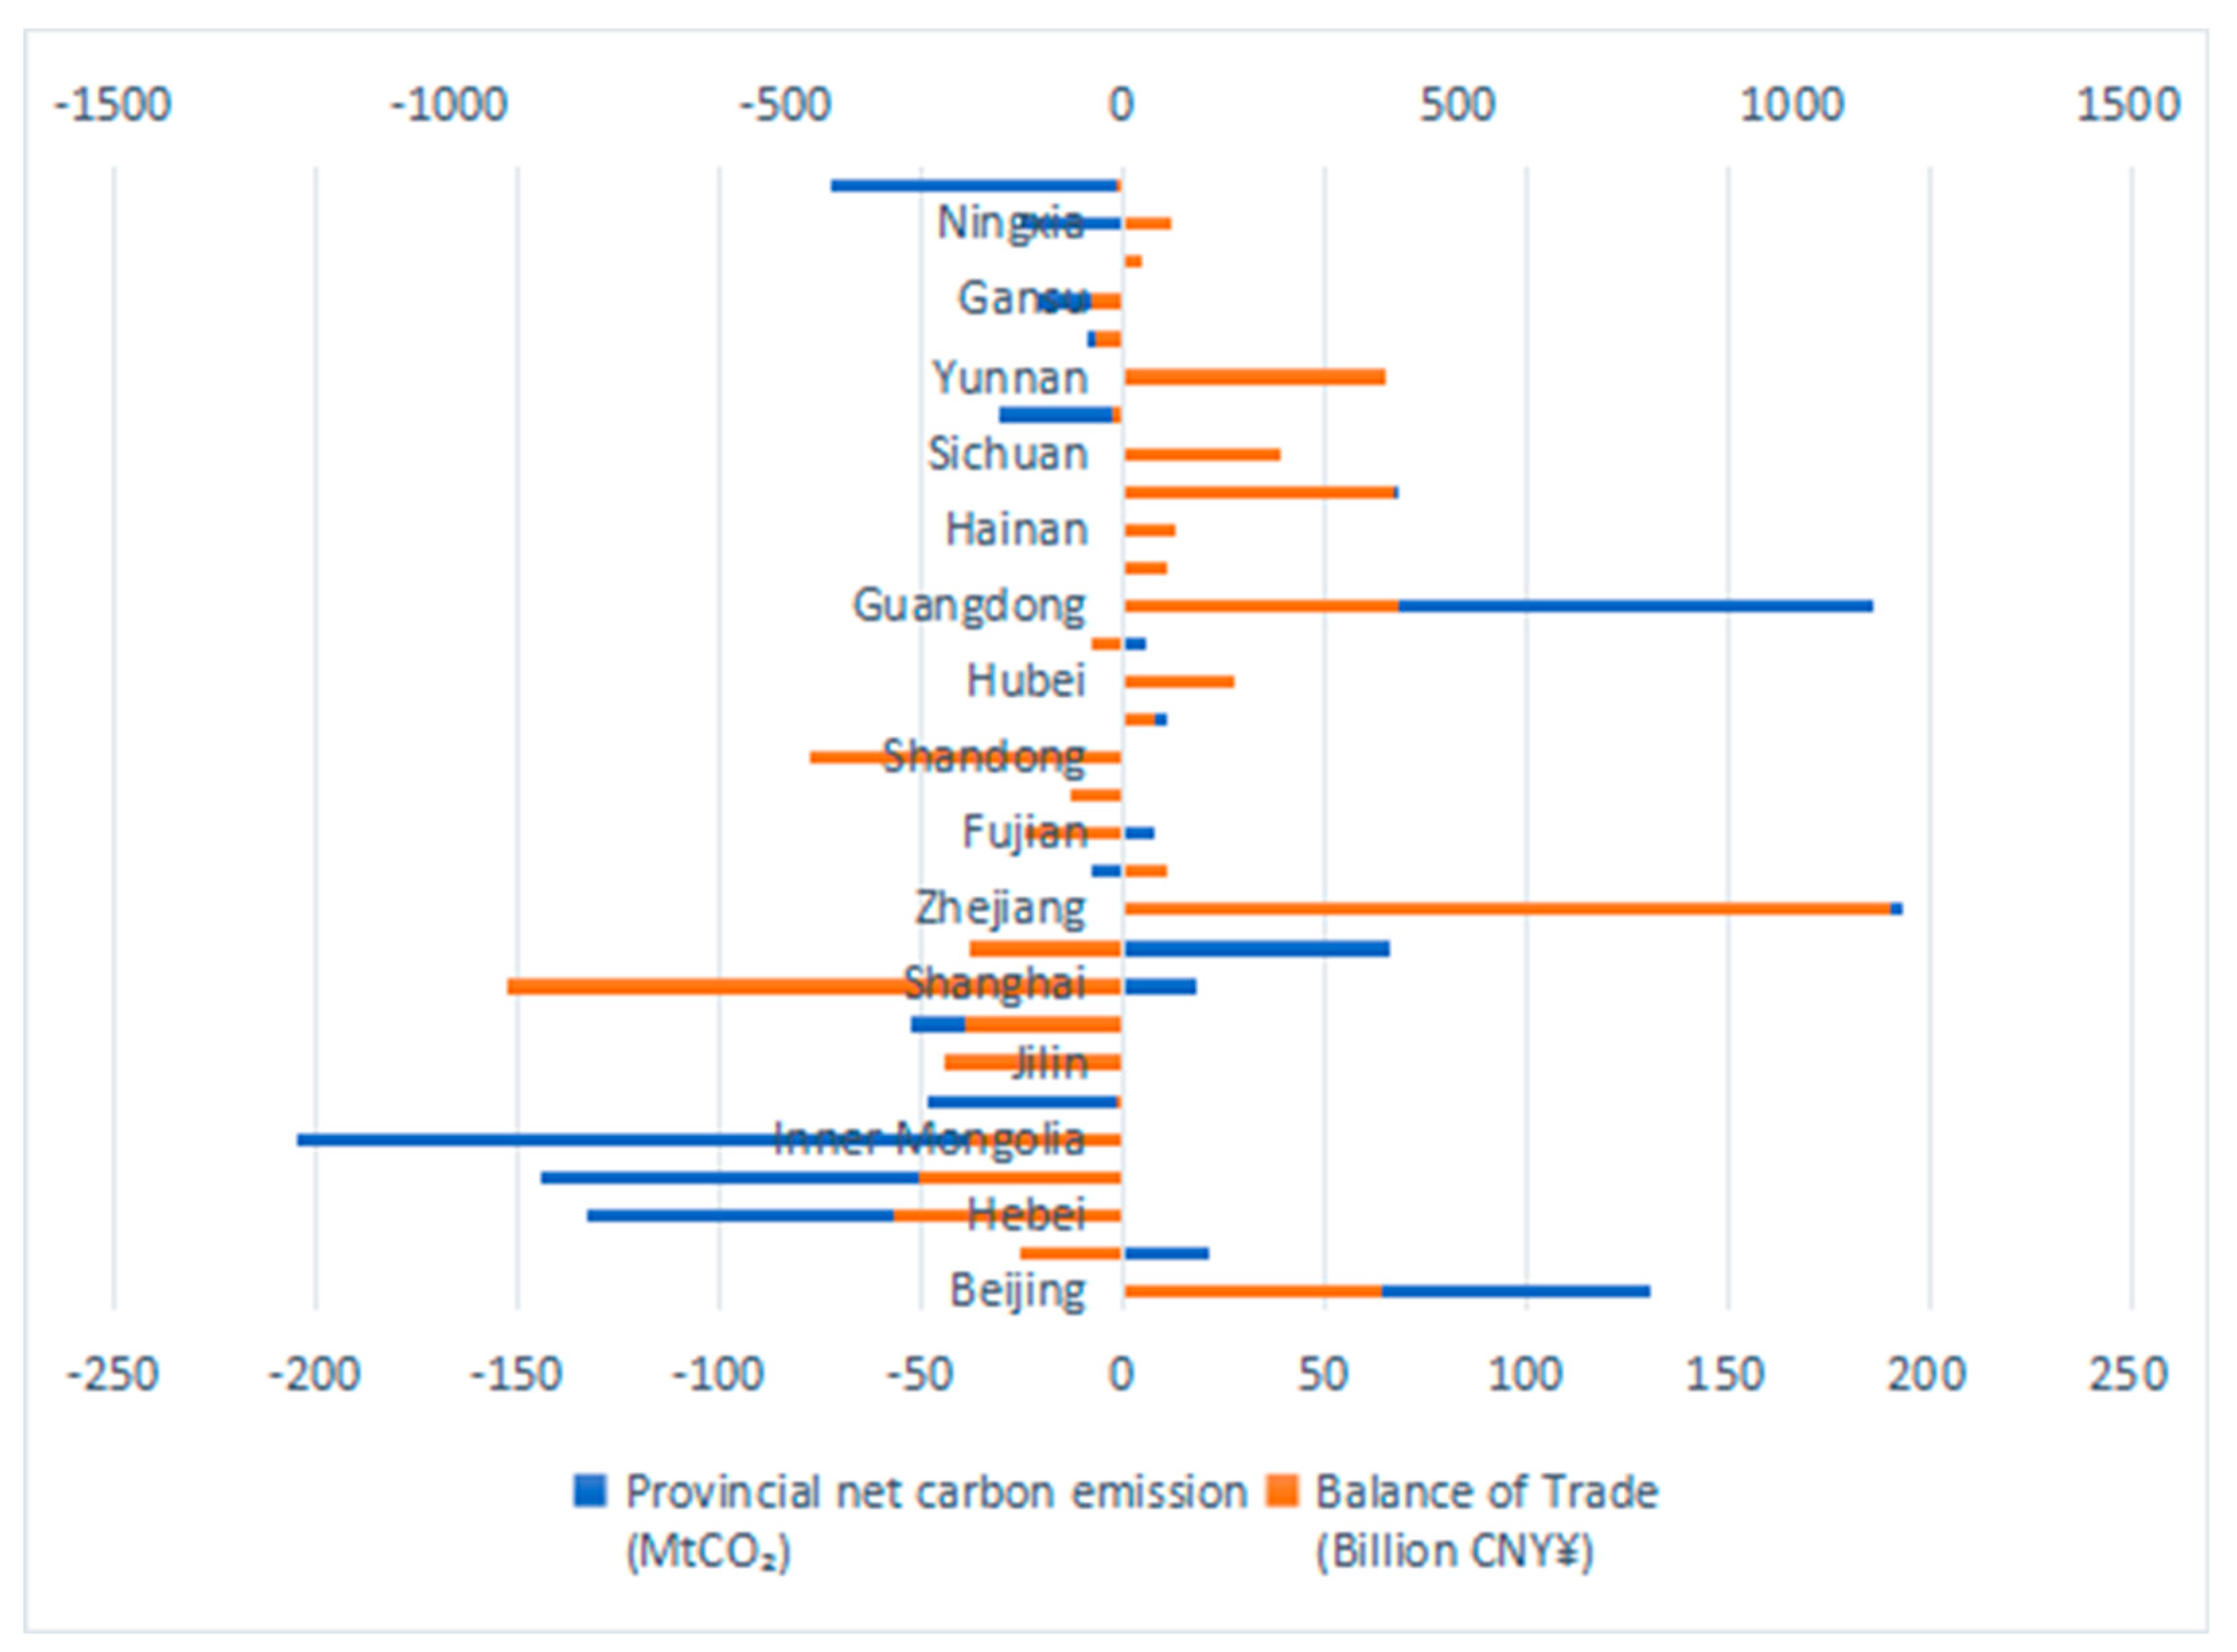
3.2. Carbon Flows Based on Interprovincial Trade
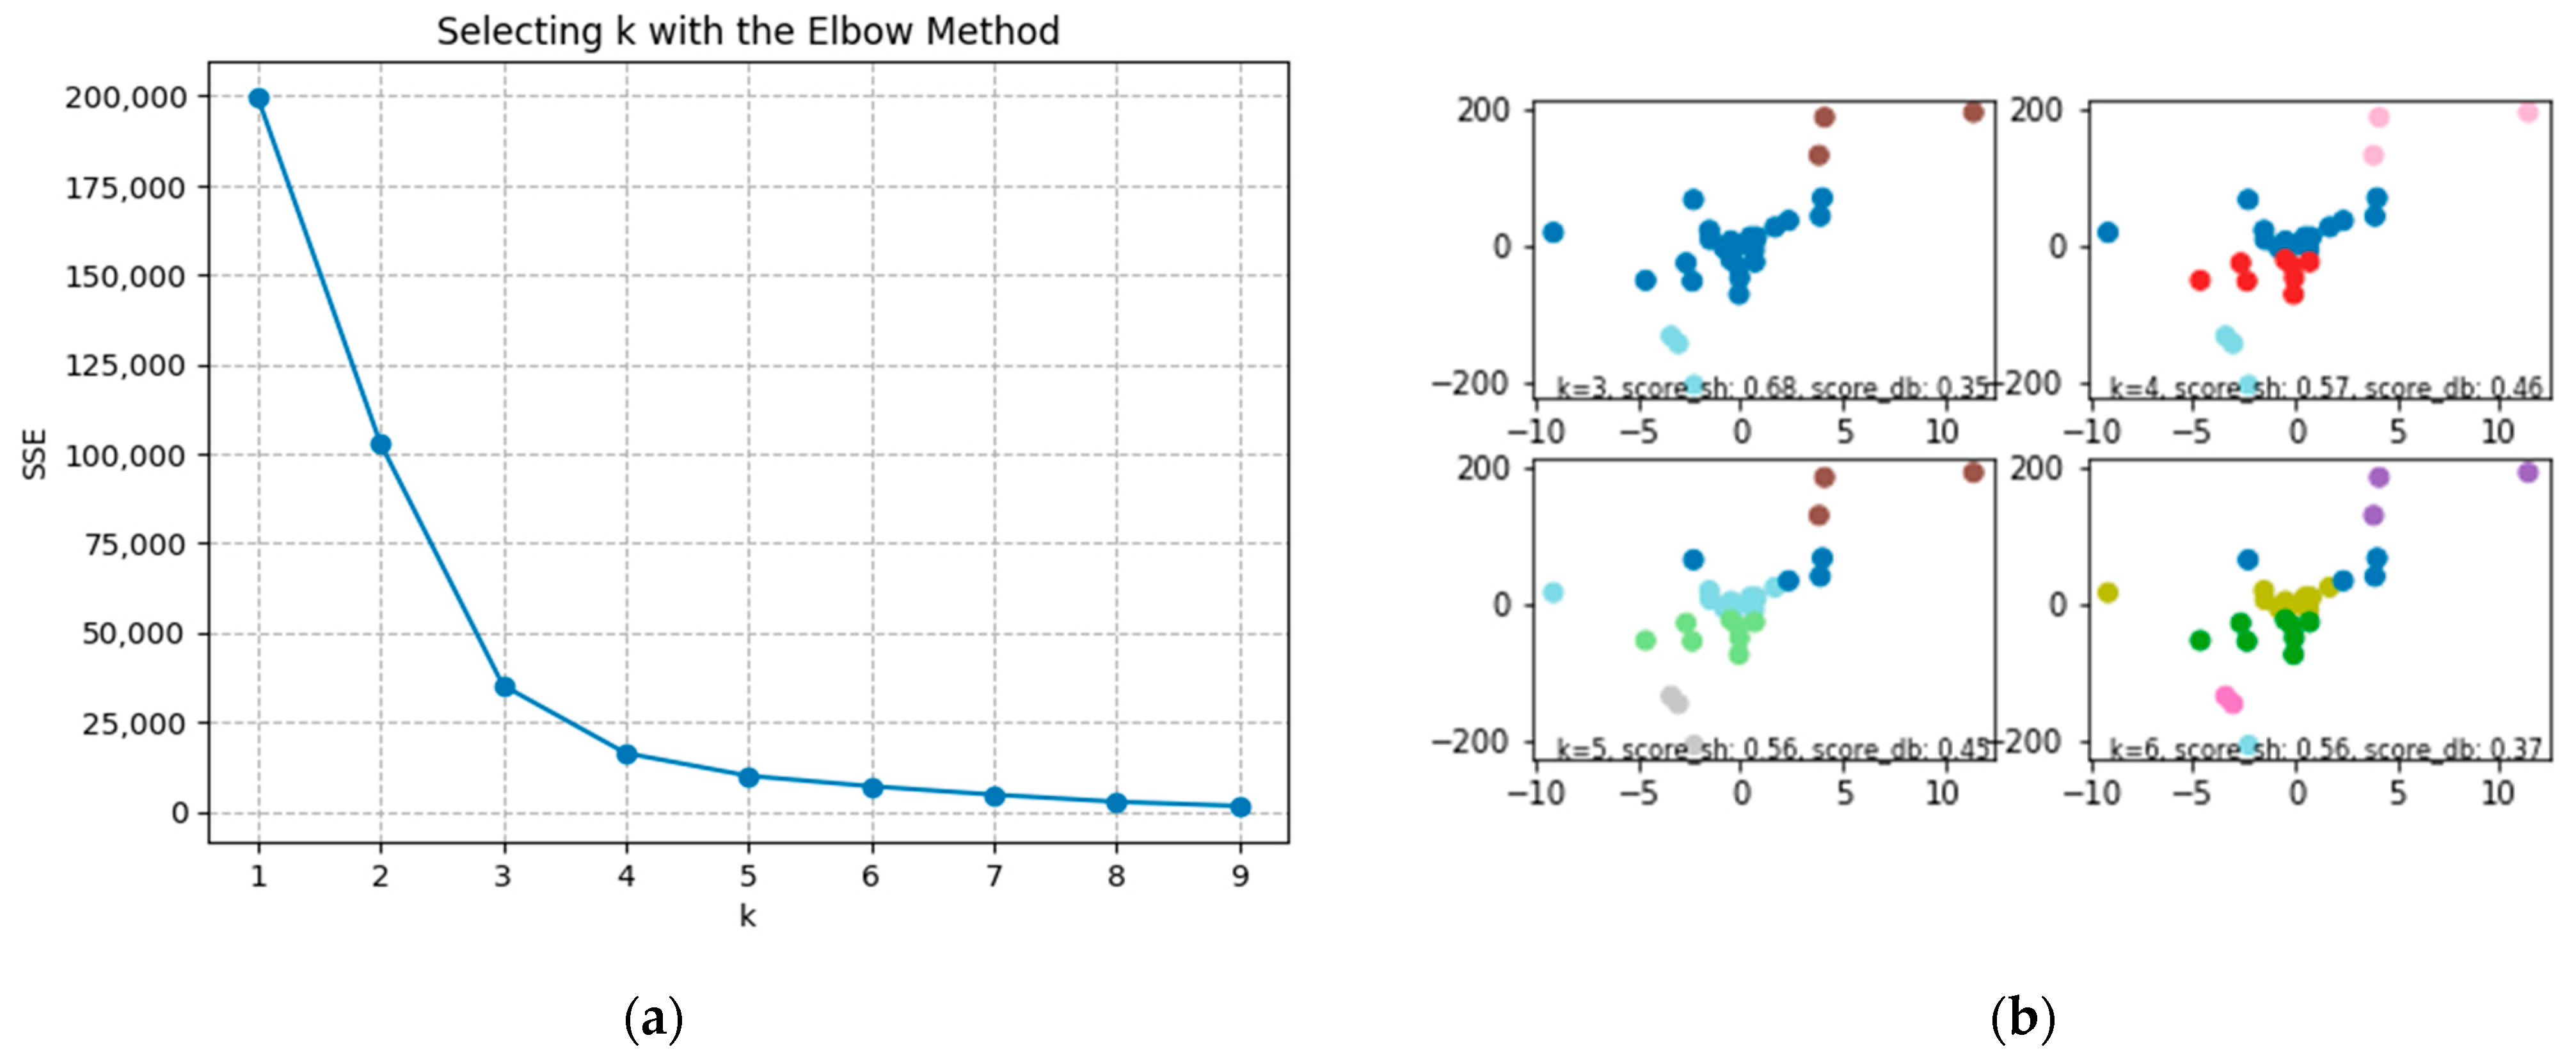
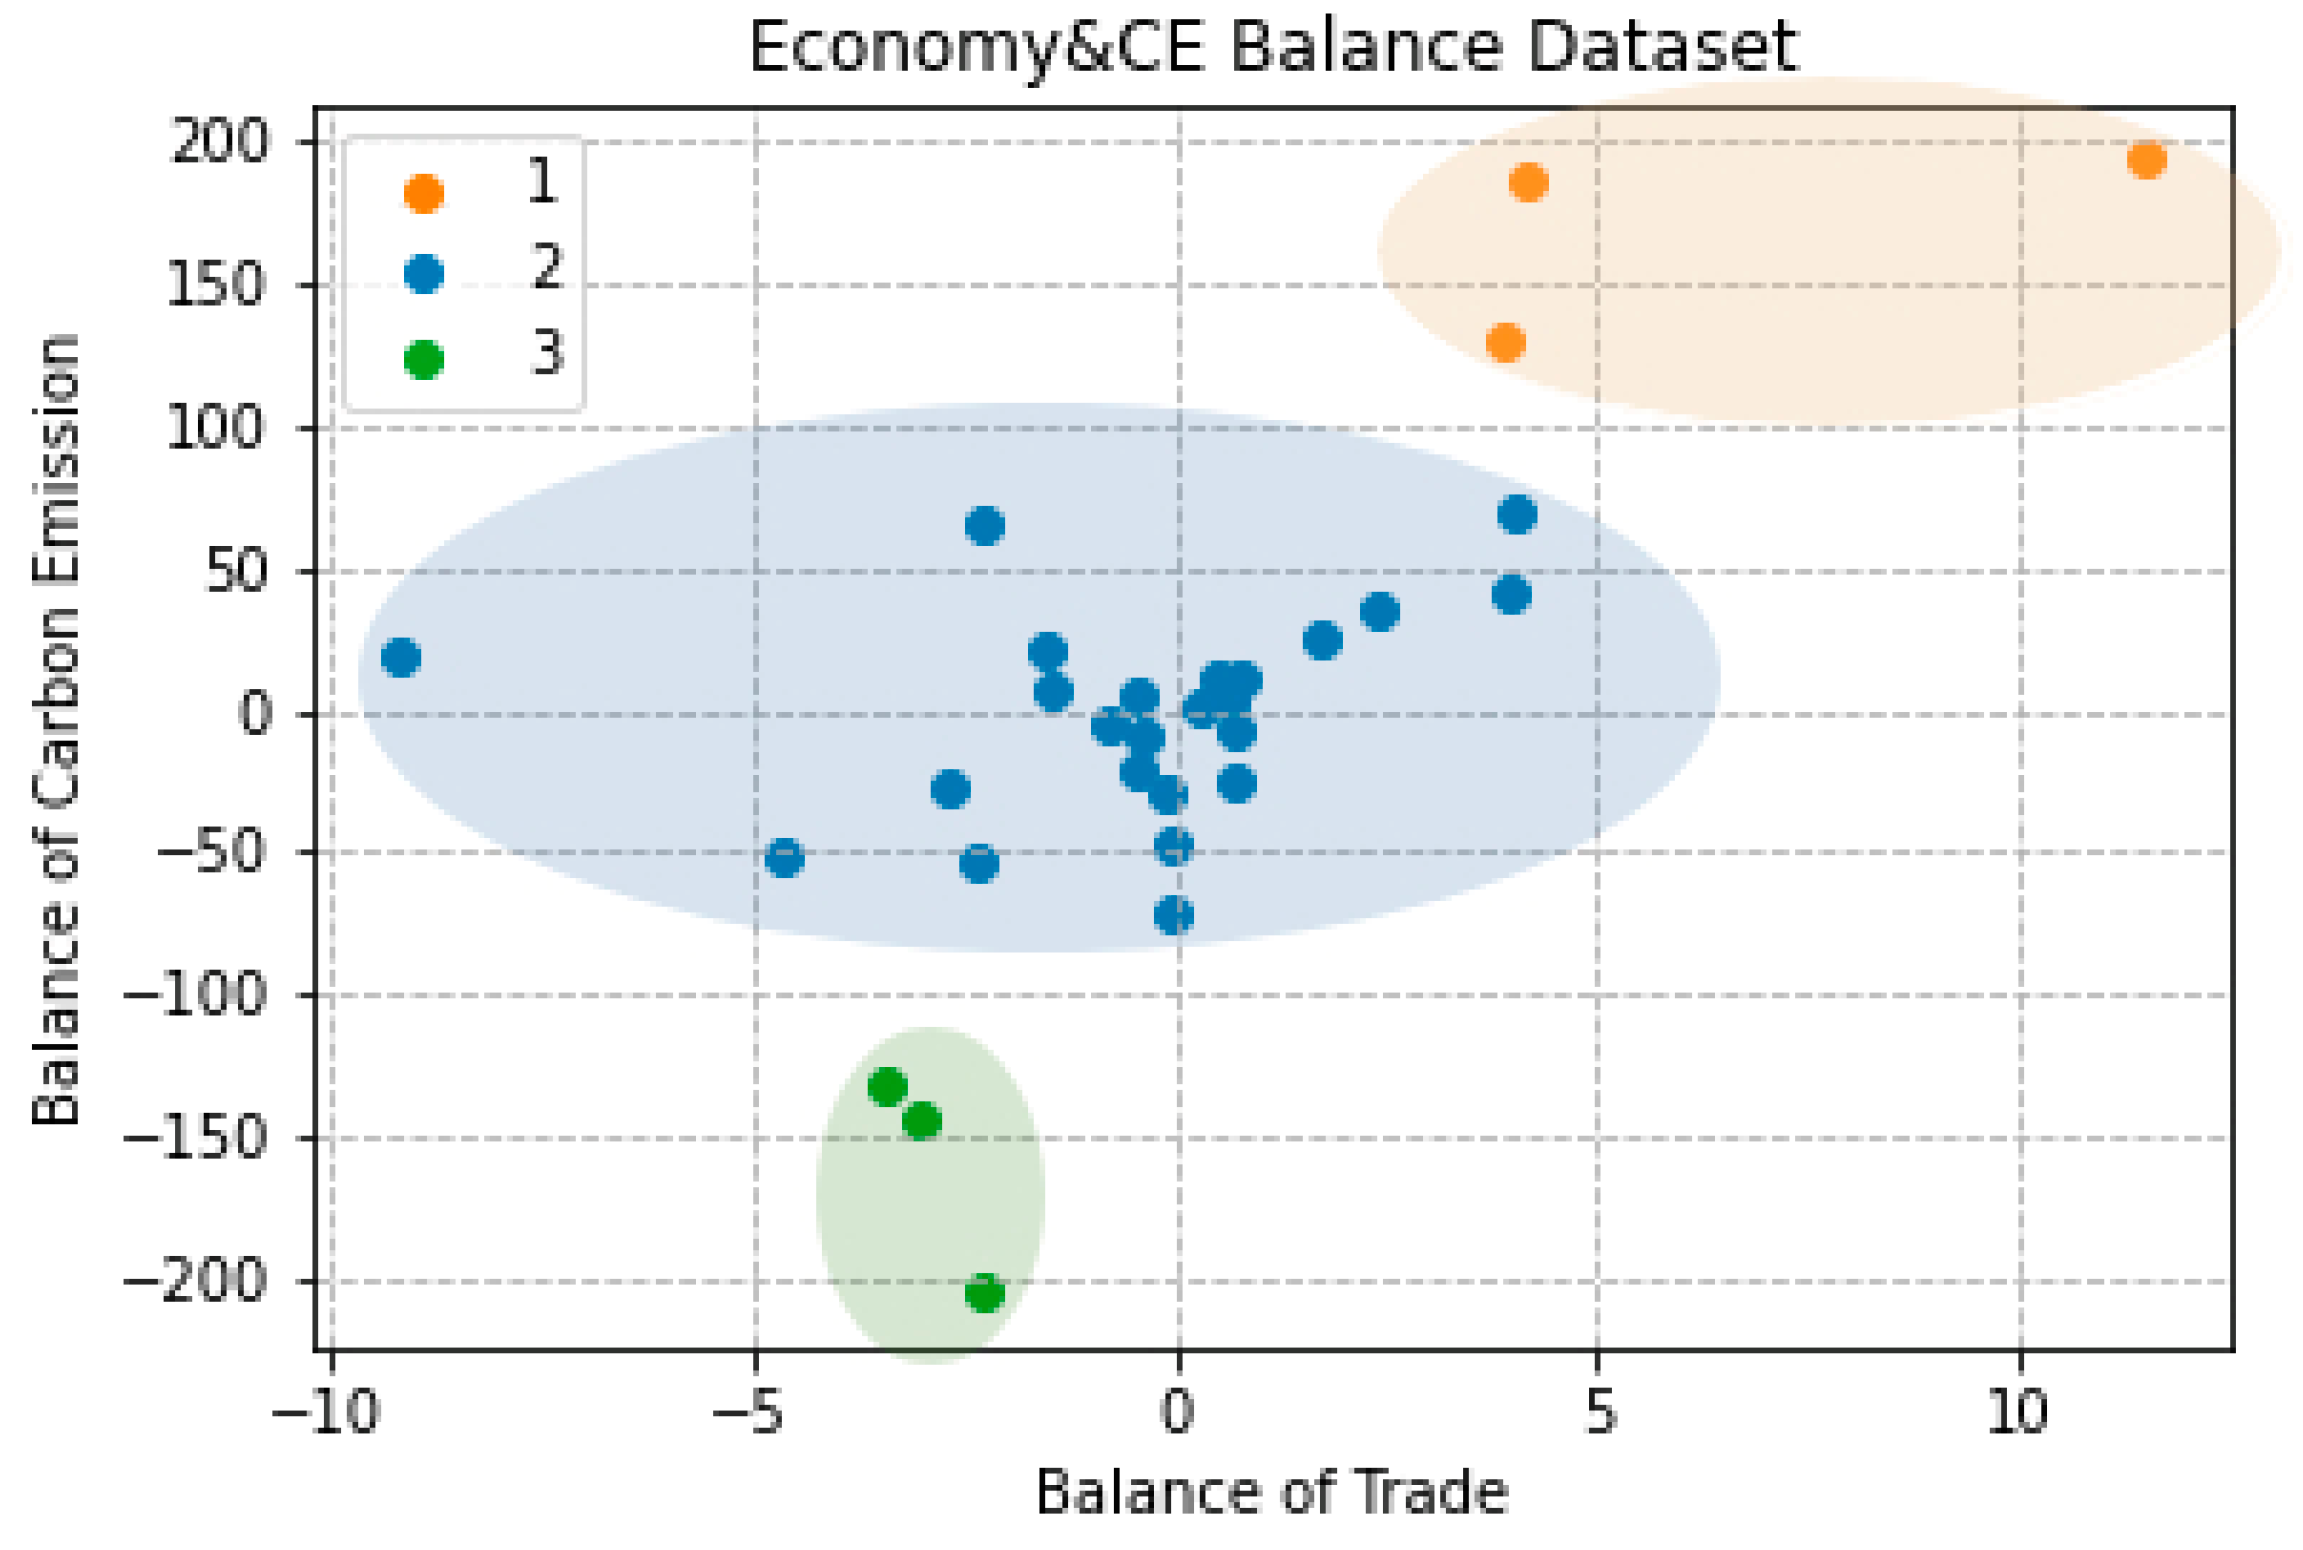
3.3. K-Means Clustering Results
4. Discussion and Policy Implementation
4.1. Distinct Roles of Different Regions in the Domestic Carbon Emission Network
4.2. Policy Implementation
5. Conclusions
Author Contributions
Funding
Institutional Review Board Statement
Informed Consent Statement
Data Availability Statement
Acknowledgments
Conflicts of Interest
References
- WRI. Climate Watch Historical GHG Emissions; World Resources Institute: Washington, DC, USA, 2021. [Google Scholar]
- Chen, Z.; Song, P.; Wang, B. Carbon emissions trading scheme, energy efficiency and rebound effect–Evidence from China’s provincial data. Energy Policy 2021, 157, 112507. [Google Scholar] [CrossRef]
- Shan, Y.; Huang, Q.; Guan, D.; Hubacek, K. China CO2 emission accounts 2016–2017. Sci. Data 2020, 7, 54. [Google Scholar] [CrossRef] [PubMed]
- Shan, Y.; Guan, D.; Zheng, H.; Ou, J.; Li, Y.; Meng, J.; Mi, Z.; Liu, Z.; Zhang, Q. Data descriptor: China CO2 emission accounts 1997–2015. Sci. Data 2018, 5, 170201. [Google Scholar] [CrossRef] [PubMed]
- Shan, Y.; Liu, J.; Liu, Z.; Xu, X.; Shao, S.; Wang, P.; Guan, D. New provincial CO2 emission inventories in China based on apparent energy consumption data and updated emission factors. Appl. Energy 2016, 184, 742–750. [Google Scholar] [CrossRef]
- Li, X.; Wang, J.; Zhang, M.; Ouyang, J.; Shi, W. Regional differences in carbon emission of China’s industries and its decomposition effects. J. Clean. Prod. 2020, 270, 122528. [Google Scholar] [CrossRef]
- Wang, Y.; Zheng, Y. Spatial effects of carbon emission intensity and regional development in China. Environ. Sci. Pollut. Res. 2021, 28, 14131–14143. [Google Scholar] [CrossRef]
- Chen, X.; Lin, B. Towards carbon neutrality by implementing carbon emissions trading scheme: Policy evaluation in China. Energy Policy 2021, 157, 112510. [Google Scholar] [CrossRef]
- Zhang, P.; Hu, J.; Zhao, K.; Chen, H.; Zhao, S.; Li, W. Dynamics and decoupling analysis of carbon emissions from construction industry in China. Buildings 2022, 12, 257. [Google Scholar] [CrossRef]
- Peters, G.P.; Hertwich, E.G. CO2 embodied in international trade with implications for global climate policy. Environ. Sci. Technol. 2008, 42, 1401. [Google Scholar] [CrossRef]
- Chen, G.; Hadjikakou, M.; Wiedmann, T. Urban carbon transformations: Unravelling spatial and inter-sectoral linkages for key city industries based on multi-region input–output analysis. J. Clean. Prod. 2017, 163, 224–240. [Google Scholar] [CrossRef]
- Zhang, W.; Peng, S. Analysis on CO2 emissions transferred from developed economies to China through trade. China World Econ. 2016, 24, 68–89. [Google Scholar] [CrossRef]
- Long, R.; Li, J.; Chen, H.; Zhang, L.; Li, Q. Embodied carbon dioxide flow in international trade: A comparative analysis based on China and Japan. J. Environ. Manag. 2018, 209, 371–381. [Google Scholar] [CrossRef]
- Xu, M.; Allenby, B.; Chen, W. Energy and air emissions embodied in China–US trade: Eastbound assessment using adjusted bilateral trade data. Environ. Sci. Technol. 2009, 43, 3378–3384. [Google Scholar] [CrossRef]
- Davis, S.J.; Caldeira, K. Consumption-based accounting of CO2 emissions. Proc. Natl. Acad. Sci. USA 2010, 107, 5687–5692. [Google Scholar] [CrossRef] [PubMed]
- Zhu, Y.; Shi, Y.; Wu, J.; Wu, L.; Xiong, W. Exploring the characteristics of CO2 emissions embodied in international trade and the fair share of responsibility. Ecol. Econ. 2018, 146, 574–587. [Google Scholar] [CrossRef]
- Cheng, H.; Dong, S.; Li, F.; Yang, Y.; Li, S.; Li, Y. Multiregional input-output analysis of spatial-temporal evolution driving force for carbon emissions embodied in interprovincial trade and optimization policies: Case study of northeast industrial district in China. Environ. Sci. Technol. 2018, 52, 346–358. [Google Scholar] [CrossRef] [PubMed]
- Fan, J.; Meng, S.; Wang, J.; Zhang, X. Coordinated emission mitigation mechanism of Beijing-Tianjin-Hebei region in China: A perspective from CO2 emissions embodied in domestic trade. Energy Procedia 2019, 158, 3893–3900. [Google Scholar] [CrossRef]
- Su, B.; Ang, B. Input–output analysis of CO2 emissions embodied in trade: A multi-region model for China. Appl. Energy 2014, 114, 377–384. [Google Scholar] [CrossRef]
- Li, W.; Wang, Q.; Jin, B.; Li, G.; Su, B. Multiregional input–output analysis of carbon transfer in interprovincial trade and sectoral strategies for mitigation: Case study of Shanxi province in China. J. Clean. Prod. 2023, 391, 136220. [Google Scholar] [CrossRef]
- Leontief, W.W. Quantitative input and output relations in the economic systems of the United States. Rev. Econ. Stat. 1936, 18, 105–125. [Google Scholar] [CrossRef]
- Miller, R.E.; Blair, P.D. Input-Output Analysis: Foundations and Extensions; Cambridge University Press: Cambridge, UK, 2009. [Google Scholar]
- Ackerman, F.; Ishikawa, M.; Suga, M. The carbon content of Japan–US trade. Energy Policy 2007, 35, 4455–4462. [Google Scholar] [CrossRef]
- Shepard, J.U.; Pratson, L.F. Hybrid input-output analysis of embodied energy security. Appl. Energy 2020, 279, 115806. [Google Scholar] [CrossRef] [PubMed]
- Tarne, P.; Lehmann, A.; Finkbeiner, M. A comparison of Multi-Regional Input-Output databases regarding transaction structure and supply chain analysis. J. Clean. Prod. 2018, 196, 1486–1500. [Google Scholar] [CrossRef]
- Chen, G.; Wu, X.; Guo, J.; Meng, J.; Li, C. Global overview for energy use of the world economy: Household-consumption-based accounting based on the world input-output database (WIOD). Energy Econ. 2019, 81, 835–847. [Google Scholar] [CrossRef]
- Beylot, A.; Secchi, M.; Cerutti, A.; Merciai, S.; Schmidt, J.; Sala, S. Assessing the environmental impacts of EU consumption at macro-scale. J. Clean. Prod. 2019, 216, 382–393. [Google Scholar] [CrossRef]
- Albert, O.-O.K.; Richard, W.; Lekve, B.E.; Dario, C.; Marianne, T. Understanding the trends in Denmark’s global food trade-related greenhouse gas and resource footprint. J. Clean. Prod. 2021, 313, 127785. [Google Scholar]
- Mi, Z.; Wei, Y.-M.; Wang, B.; Meng, J.; Liu, Z.; Shan, Y.; Liu, J.; Guan, D. Socioeconomic impact assessment of China’s CO2 emissions peak prior to 2030. J. Clean. Prod. 2017, 142, 2227–2236. [Google Scholar] [CrossRef]
- Mi, Z.; Zhang, Y.; Guan, D.; Shan, Y.; Liu, Z.; Cong, R.; Yuan, X.-C.; Wei, Y.-M. Consumption-based emission accounting for Chinese cities. Appl. Energy 2016, 184, 1073–1081. [Google Scholar] [CrossRef]
- Wang, P.; Li, Y.; Huang, G.; Wang, S.; Suo, C.; Ma, Y. A multi-scenario factorial analysis and multi-regional input-output model for analyzing CO2 emission reduction path in Jing-Jin-Ji region. J. Clean. Prod. 2021, 300, 126782. [Google Scholar] [CrossRef]
- Chen, Q.; Su, M.; Meng, F.; Liu, Y.; Cai, Y.; Zhou, Y.; Yang, Z. Analysis of urban carbon metabolism characteristics based on provincial input-output tables. J. Environ. Manag. 2020, 265, 110561. [Google Scholar] [CrossRef]
- Zheng, H.; Zhang, Z.; Wei, W.; Song, M.; Dietzenbacher, E.; Wang, X.; Meng, J.; Shan, Y.; Ou, J.; Guan, D. Regional determinants of China’s consumption-based emissions in the economic transition. Environ. Res. Lett. 2020, 15, 074001. [Google Scholar] [CrossRef]
- Pan, J.; Phillips, J.; Chen, Y. China’s balance of emissions embodied in trade: Approaches to measurement and allocating international responsibility. Oxf. Rev. Econ. Policy 2008, 24, 354–376. [Google Scholar] [CrossRef]
- Lloyd, S.P. Least Squares Quantization in PCM. IEEE Trans. Inf. Theory 1982, 28, 129–137. [Google Scholar] [CrossRef]
- Sammut, C.; Webb, G.I. (Eds.) K-Means Clustering. In Encyclopedia of Machine Learning; Springer Science & Business Media: Berlin/Heidelberg, Germany, 2011. [Google Scholar] [CrossRef]
- CEADS. Available online: http://www.ceads.net (accessed on 19 April 2023).
- Lai, S.; Lu, J.; Luo, X.; Ge, J. Carbon emission evaluation model and carbon reduction strategies for newly urbanized areas. Sustain. Prod. Consum. 2022, 31, 13–25. [Google Scholar] [CrossRef]
- Geng, Y.; Sarkis, J. Achieving National Emission Reduction Target—China’s New Challenge and Opportunity. Environ. Sci. Technol. 2012, 46, 107–108. [Google Scholar] [CrossRef]
- Tian, G.; Yu, S.; Wu, Z.; Xia, Q. Study on the emission reduction effect and spatial difference of carbon emission trading policy in China. Energies 2022, 15, 1921. [Google Scholar] [CrossRef]
- Zhong, Z.; Jiang, L.; Zhou, P. Transnational transfer of carbon emissions embodied in trade: Characteristics and determinants from a spatial perspective. Energy 2018, 147, 858–875. [Google Scholar] [CrossRef]
- Qu, S.; Yang, Y.; Wang, Z.; Zou, J.-P.; Xu, M. Great divergence exists in Chinese provincial trade-related CO2 emission accounts. Environ. Sci. Technol. 2020, 54, 8527–8538. [Google Scholar] [CrossRef]
- Lv, K.; Feng, X.; Kelly, S.; Zhu, L.; Deng, M. A study on embodied carbon transfer at the provincial level of China from a social network perspective. J. Clean. Prod. 2019, 225, 1089–1104. [Google Scholar] [CrossRef]
- Liu, L.-C.; Liang, Q.-M.; Wang, Q. Accounting for China’s regional carbon emissions in 2002 and 2007: Production-based versus consumption-based principles. J. Clean. Prod. 2015, 103, 384–392. [Google Scholar] [CrossRef]
- Yang, M.; Hou, Y.; Wang, Q. Rethinking on regional CO2 allocation in China: A consideration of the carbon sink. Environ. Impact Assess. Rev. 2022, 96, 106822. [Google Scholar] [CrossRef]
- Li, R.; Wang, Q.; Wang, X.; Zhou, Y.; Han, X.; Liu, Y. Germany’s contribution to global carbon reduction might be underestimated—A new assessment based on scenario analysis with and without trade. Technol. Forecast. Soc. Chang. 2022, 176, 121465. [Google Scholar] [CrossRef]
- Liu, Y.; Tang, L.; Liu, G. Carbon Dioxide Emissions Reduction through Technological Innovation: Empirical Evidence from Chinese Provinces. Int. J. Environ. Res. Public Health 2022, 19, 9543. [Google Scholar] [CrossRef] [PubMed]
- Eggleston, H.; Buendia, L.; Miwa, K.; Ngara, T.; Tanabe, K. 2006 IPCC Guidelines for National Greenhouse Gas Inventories; Institute for Global Environmental Strategies (IGES): Hayama, Japan, 2006. [Google Scholar]
- Yi, W.-J.; Zou, L.-L.; Guo, J.; Wang, K.; Wei, Y.-M. How can China reach its CO2 intensity reduction targets by 2020? A regional allocation based on equity and development. Energy Policy 2011, 39, 2407–2415. [Google Scholar] [CrossRef]
- Wesseh, P.K., Jr.; Lin, B.; Atsagli, P. Carbon taxes, industrial production, welfare and the environment. Energy 2017, 123, 305–313. [Google Scholar] [CrossRef]
- Jorgenson, D.W.; Slesnick, D.T.; Wilcoxen, P.J.; Joskow, P.L.; Kopp, R. Carbon taxes and economic welfare. Brook. Pap. Econ. Act. Microecon. 1992, 1992, 393–454. [Google Scholar] [CrossRef]
- Sun, X.; Zhang, H.; Wang, X.; Qiao, Z.; Li, J. Towards Sustainable Development: A Study of Cross-Regional Collaborative Carbon Emission Reduction in China. Sustainability 2022, 14, 9624. [Google Scholar] [CrossRef]


| Province | (MtCO2) | (Billion CNY) | Value of Total Output X (Billion CNY) | Carbon Emission Intensity (CO2 Emissions Per X in kg/Billion CNY) |
|---|---|---|---|---|
| Beijing | 130.8447534 | 386.25 | 8057.62595353 | 0.10618573 |
| Tianjin | 21.30661562 | −151.43 | 5477.25936850 | 0.26288875 |
| Hebei | −132.8549652 | −339.44 | 9048.22766085 | 0.875669578 |
| Shanxi | −144.092038 | −303.39 | 3552.66430072 | 1.43156913 |
| Inner Mongolia | −204.7213401 | −226.33 | 3432.71953823 | 1.913488243 |
| Liaoning | −47.8913827 | −2.85 | 5655.79638150 | 0.878448236 |
| Jilin | −26.26580856 | −265.24 | 4168.24178385 | 0.490221102 |
| Heilongjiang | −52.87473351 | −235.29 | 3451.64238694 | 0.80225821 |
| Shanghai | 18.1690189 | −916.46 | 8595.22130804 | 0.228212284 |
| Jiangsu | 66.11943215 | −229.12 | 23,163.05044022 | 0.327193738 |
| Zhejiang | 193.5345881 | 1144.43 | 13,686.24859557 | 0.280985829 |
| Anhui | −7.563860822 | 68.53 | 8880.76230130 | 0.430386974 |
| Fujian | 7.737647196 | −146.74 | 8613.30414124 | 0.272798681 |
| Jiangxi | −4.671829386 | −78.45 | 5425.54276535 | 0.422039993 |
| Shandong | −51.70723951 | −463.87 | 23,655.20768753 | 0.353334056 |
| Henan | 11.57950805 | 49.27 | 13,630.94432928 | 0.368173852 |
| Hubei | 25.9937036 | 170.06 | 8667.56873359 | 0.382590306 |
| Hunan | 5.831142998 | −45.97 | 7531.59592419 | 0.429733686 |
| Guangdong | 186.450015 | 413.68 | 23,171.18855864 | 0.24032389 |
| Guangxi | 3.454222982 | 67.18 | 4494.85337619 | 0.507005601 |
| Hainan | 11.54509415 | 80.70 | 1051.87564881 | 0.400775434 |
| Chongqing | 68.57056298 | 403.01 | 5101.27381082 | 0.314724855 |
| Sichuan | 35.49972612 | 237.48 | 9195.37610680 | 0.346740327 |
| Guizhou | −30.18334765 | −13.11 | 3072.79321962 | 0.838513195 |
| Yunnan | 41.92336883 | 392.45 | 3705.88377753 | 0.537007932 |
| Shaanxi | −8.33299848 | −40.84 | 5134.13032839 | 0.533741104 |
| Gansu | −21.43795239 | −46.71 | 1709.14735799 | 0.889090504 |
| Qinghai | 1.145232259 | 26.77 | 621.48655149 | 0.860616388 |
| Ningxia | −24.98614166 | 71.46 | 827.83322521 | 2.157734511 |
| Xinjiang | −72.12099436 | −6.04 | 2579.73318038 | 1.58061342 |
| Amount of Clusters | Silhouette Score | Davies–Bouldin Score | Calinski–Harabasz Score |
|---|---|---|---|
| 3 | 0.6781 | 0.3464 | 63.0233 |
| 4 | 0.5678 | 0.4575 | 97.5296 |
| 5 | 0.5646 | 0.4543 | 118.9320 |
| 6 | 0.5571 | 0.3676 | 131.2678 |
| Cluster | Provinces |
|---|---|
| Cluster 1 | Beijing, Zhejiang, Guangdong |
| Cluster 2 | Tianjin, Liaoning, Jilin, Heilongjiang, Shanghai, Jiangsu, Anhui, Fujian, Jiangxi, Shandong, Henan, Hubei, Hunan, Guangxi, Hainan, Chongqing, Sichuan, Guizhou, Yunnan, Shaanxi, Gansu, Qinghai, Ningxia, Xinjiang |
| Cluster 3 | Hebei, Shanxi, Inner Mongolia |
Disclaimer/Publisher’s Note: The statements, opinions and data contained in all publications are solely those of the individual author(s) and contributor(s) and not of MDPI and/or the editor(s). MDPI and/or the editor(s) disclaim responsibility for any injury to people or property resulting from any ideas, methods, instructions or products referred to in the content. |
© 2023 by the authors. Licensee MDPI, Basel, Switzerland. This article is an open access article distributed under the terms and conditions of the Creative Commons Attribution (CC BY) license (https://creativecommons.org/licenses/by/4.0/).
Share and Cite
Liu, D.; Liang, J.; Xu, S.; Ye, M. Analysis of Carbon Emissions Embodied in the Provincial Trade of China Based on an Input–Output Model and k-Means Algorithm. Sustainability 2023, 15, 9196. https://doi.org/10.3390/su15129196
Liu D, Liang J, Xu S, Ye M. Analysis of Carbon Emissions Embodied in the Provincial Trade of China Based on an Input–Output Model and k-Means Algorithm. Sustainability. 2023; 15(12):9196. https://doi.org/10.3390/su15129196
Chicago/Turabian StyleLiu, Danzhu, Jinqiang Liang, Shuliang Xu, and Mao Ye. 2023. "Analysis of Carbon Emissions Embodied in the Provincial Trade of China Based on an Input–Output Model and k-Means Algorithm" Sustainability 15, no. 12: 9196. https://doi.org/10.3390/su15129196
APA StyleLiu, D., Liang, J., Xu, S., & Ye, M. (2023). Analysis of Carbon Emissions Embodied in the Provincial Trade of China Based on an Input–Output Model and k-Means Algorithm. Sustainability, 15(12), 9196. https://doi.org/10.3390/su15129196