

What Type of Energy Structure Improves Eco-Efficiency? A Study Based on Statistical Data of 285 Prefecture-Level Entities in China

Abstract
1. Introduction
2. Theoretical Background and Hypotheses
2.1. Energy Structure Optimization for Pollution Emission Reduction and Ecological Efficiency Improvement
2.2. Energy Structure Transition for Improvement of Energy Efficiency and Ecological Efficiency
2.3. Energy Structure Transition Affects Economic Returns and Ecological Efficiency through Production Cost
2.4. Energy Structure Has a Spatial Spillover Effect on Eco-Efficiency
3. Methodology and Data
3.1. Model Specification
3.2. Measurement and Explanation of Variables
3.2.1. Explanation of Variables
- Ecological efficiency (EE)
3.2.2. Core Explanatory Variables
3.2.3. Control Variables
3.3. Data Sources and Descriptive Statistics
- a.
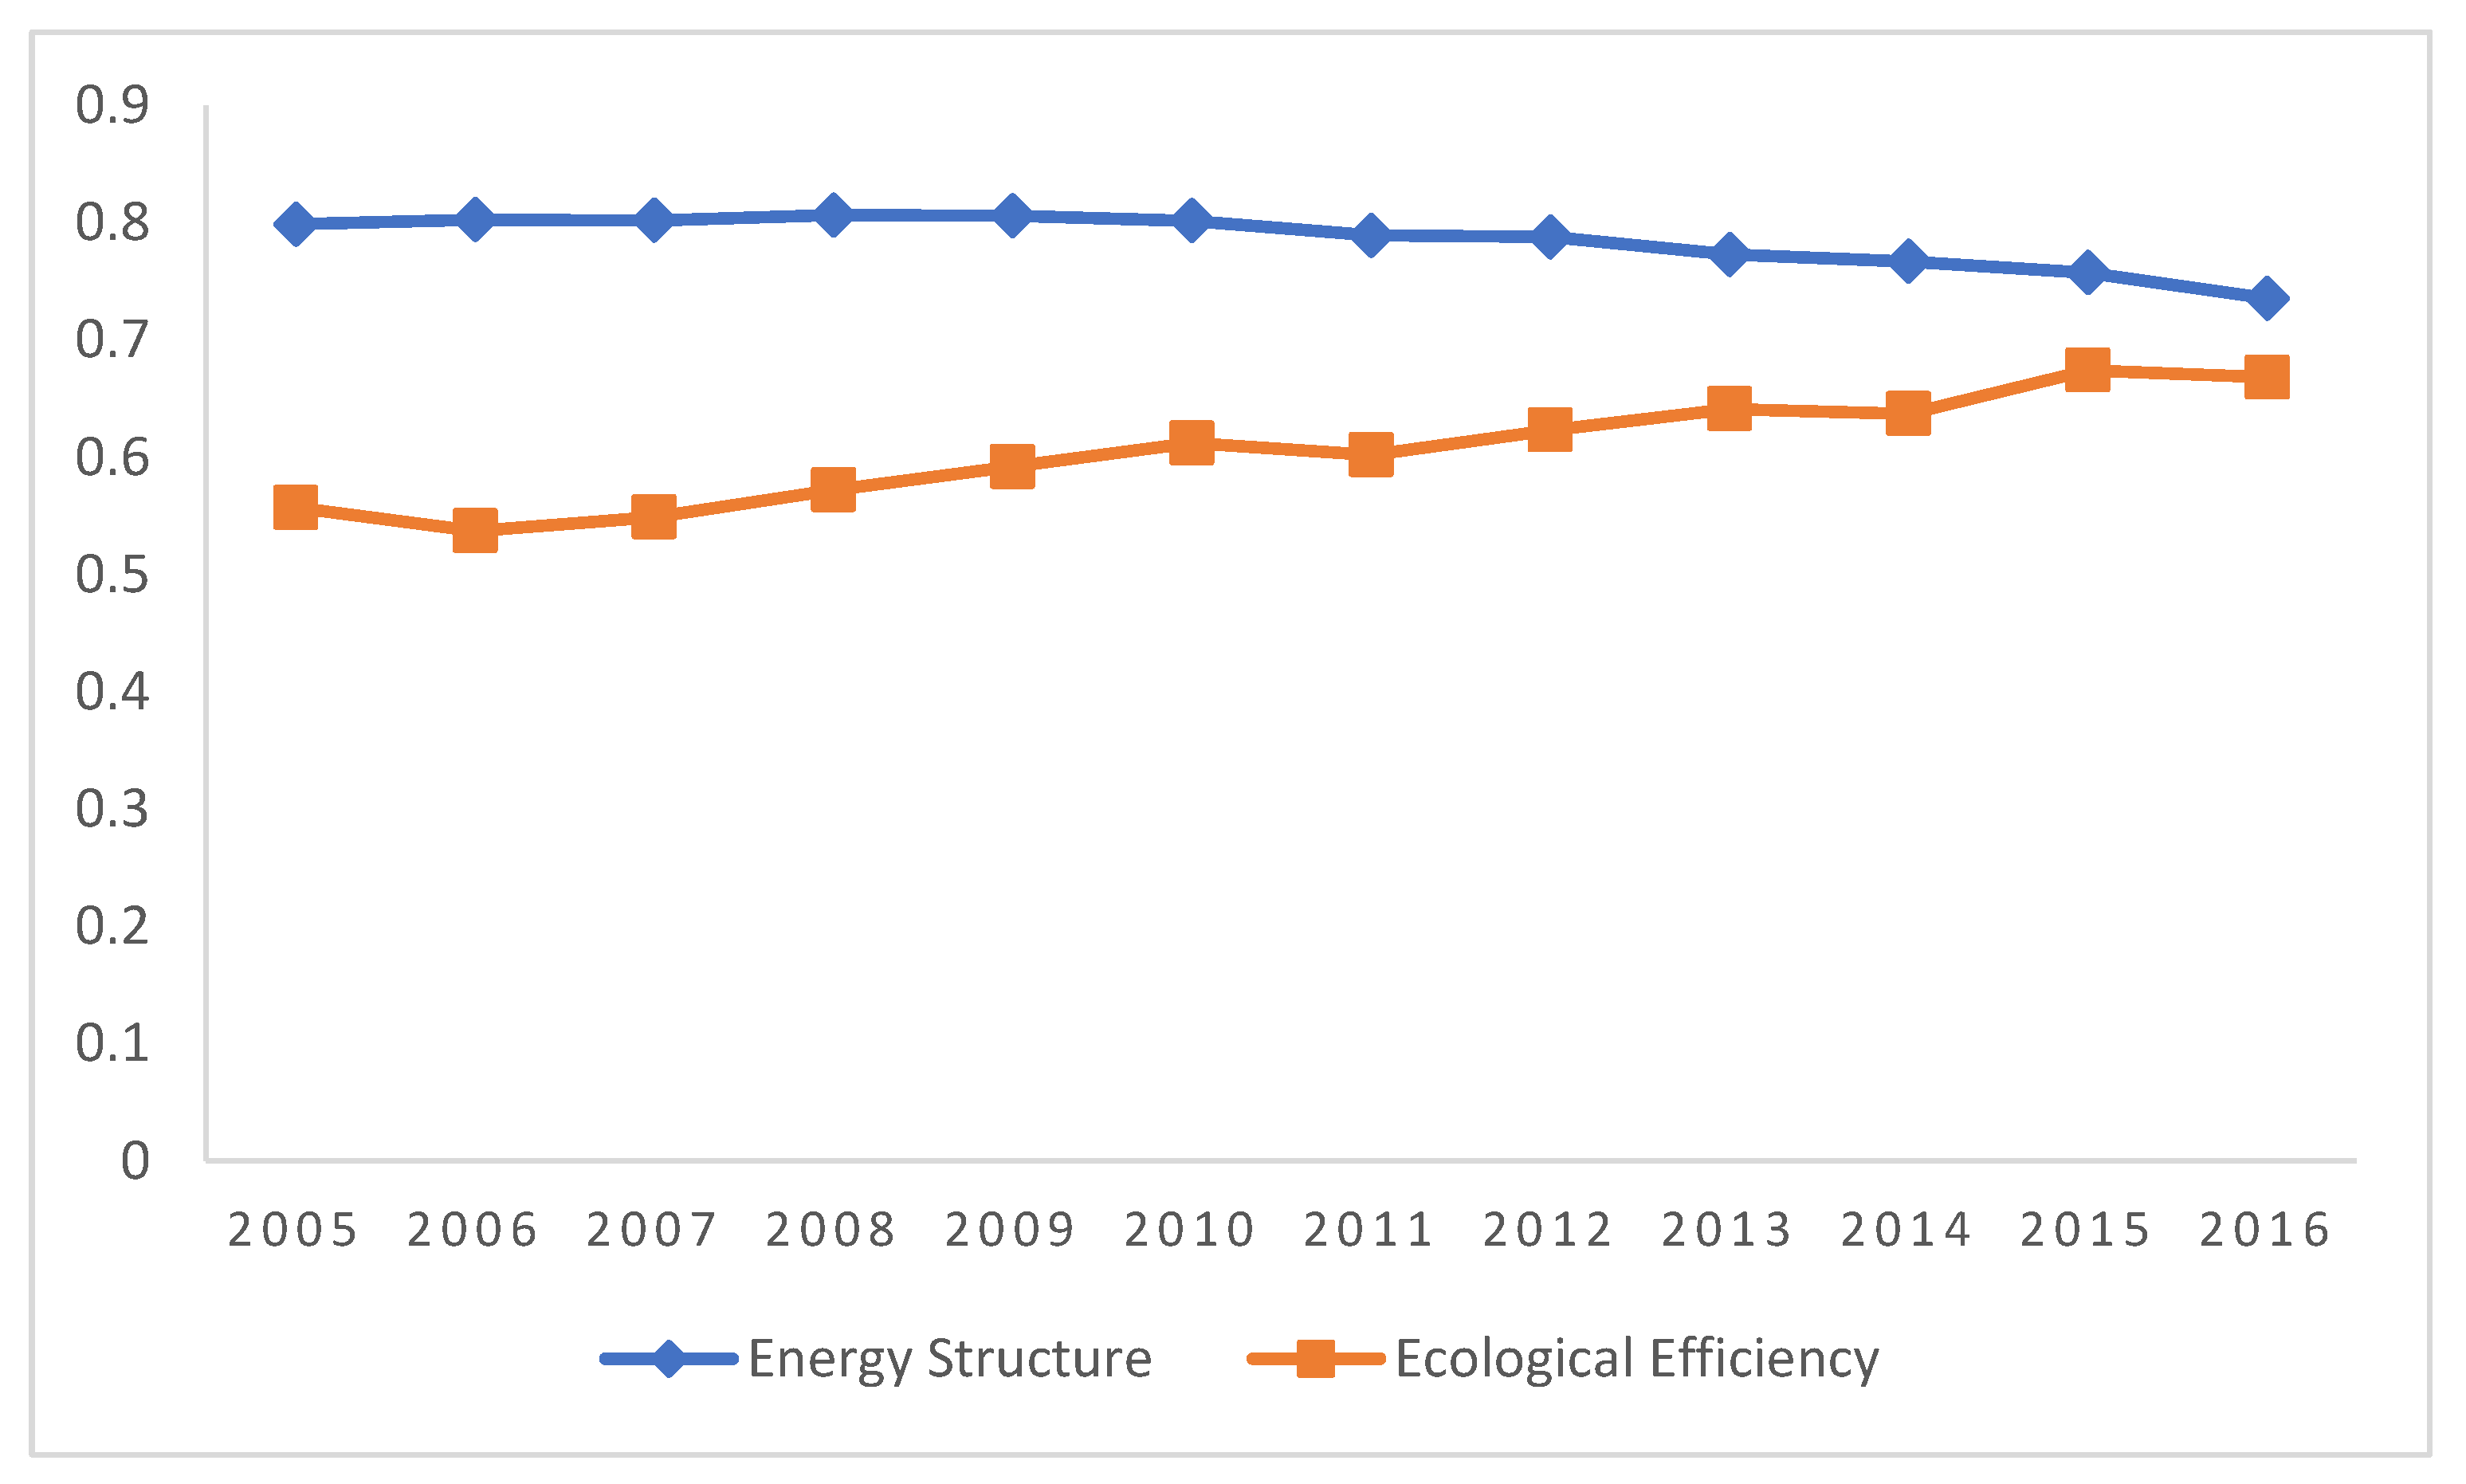
- Overall situation
- b.
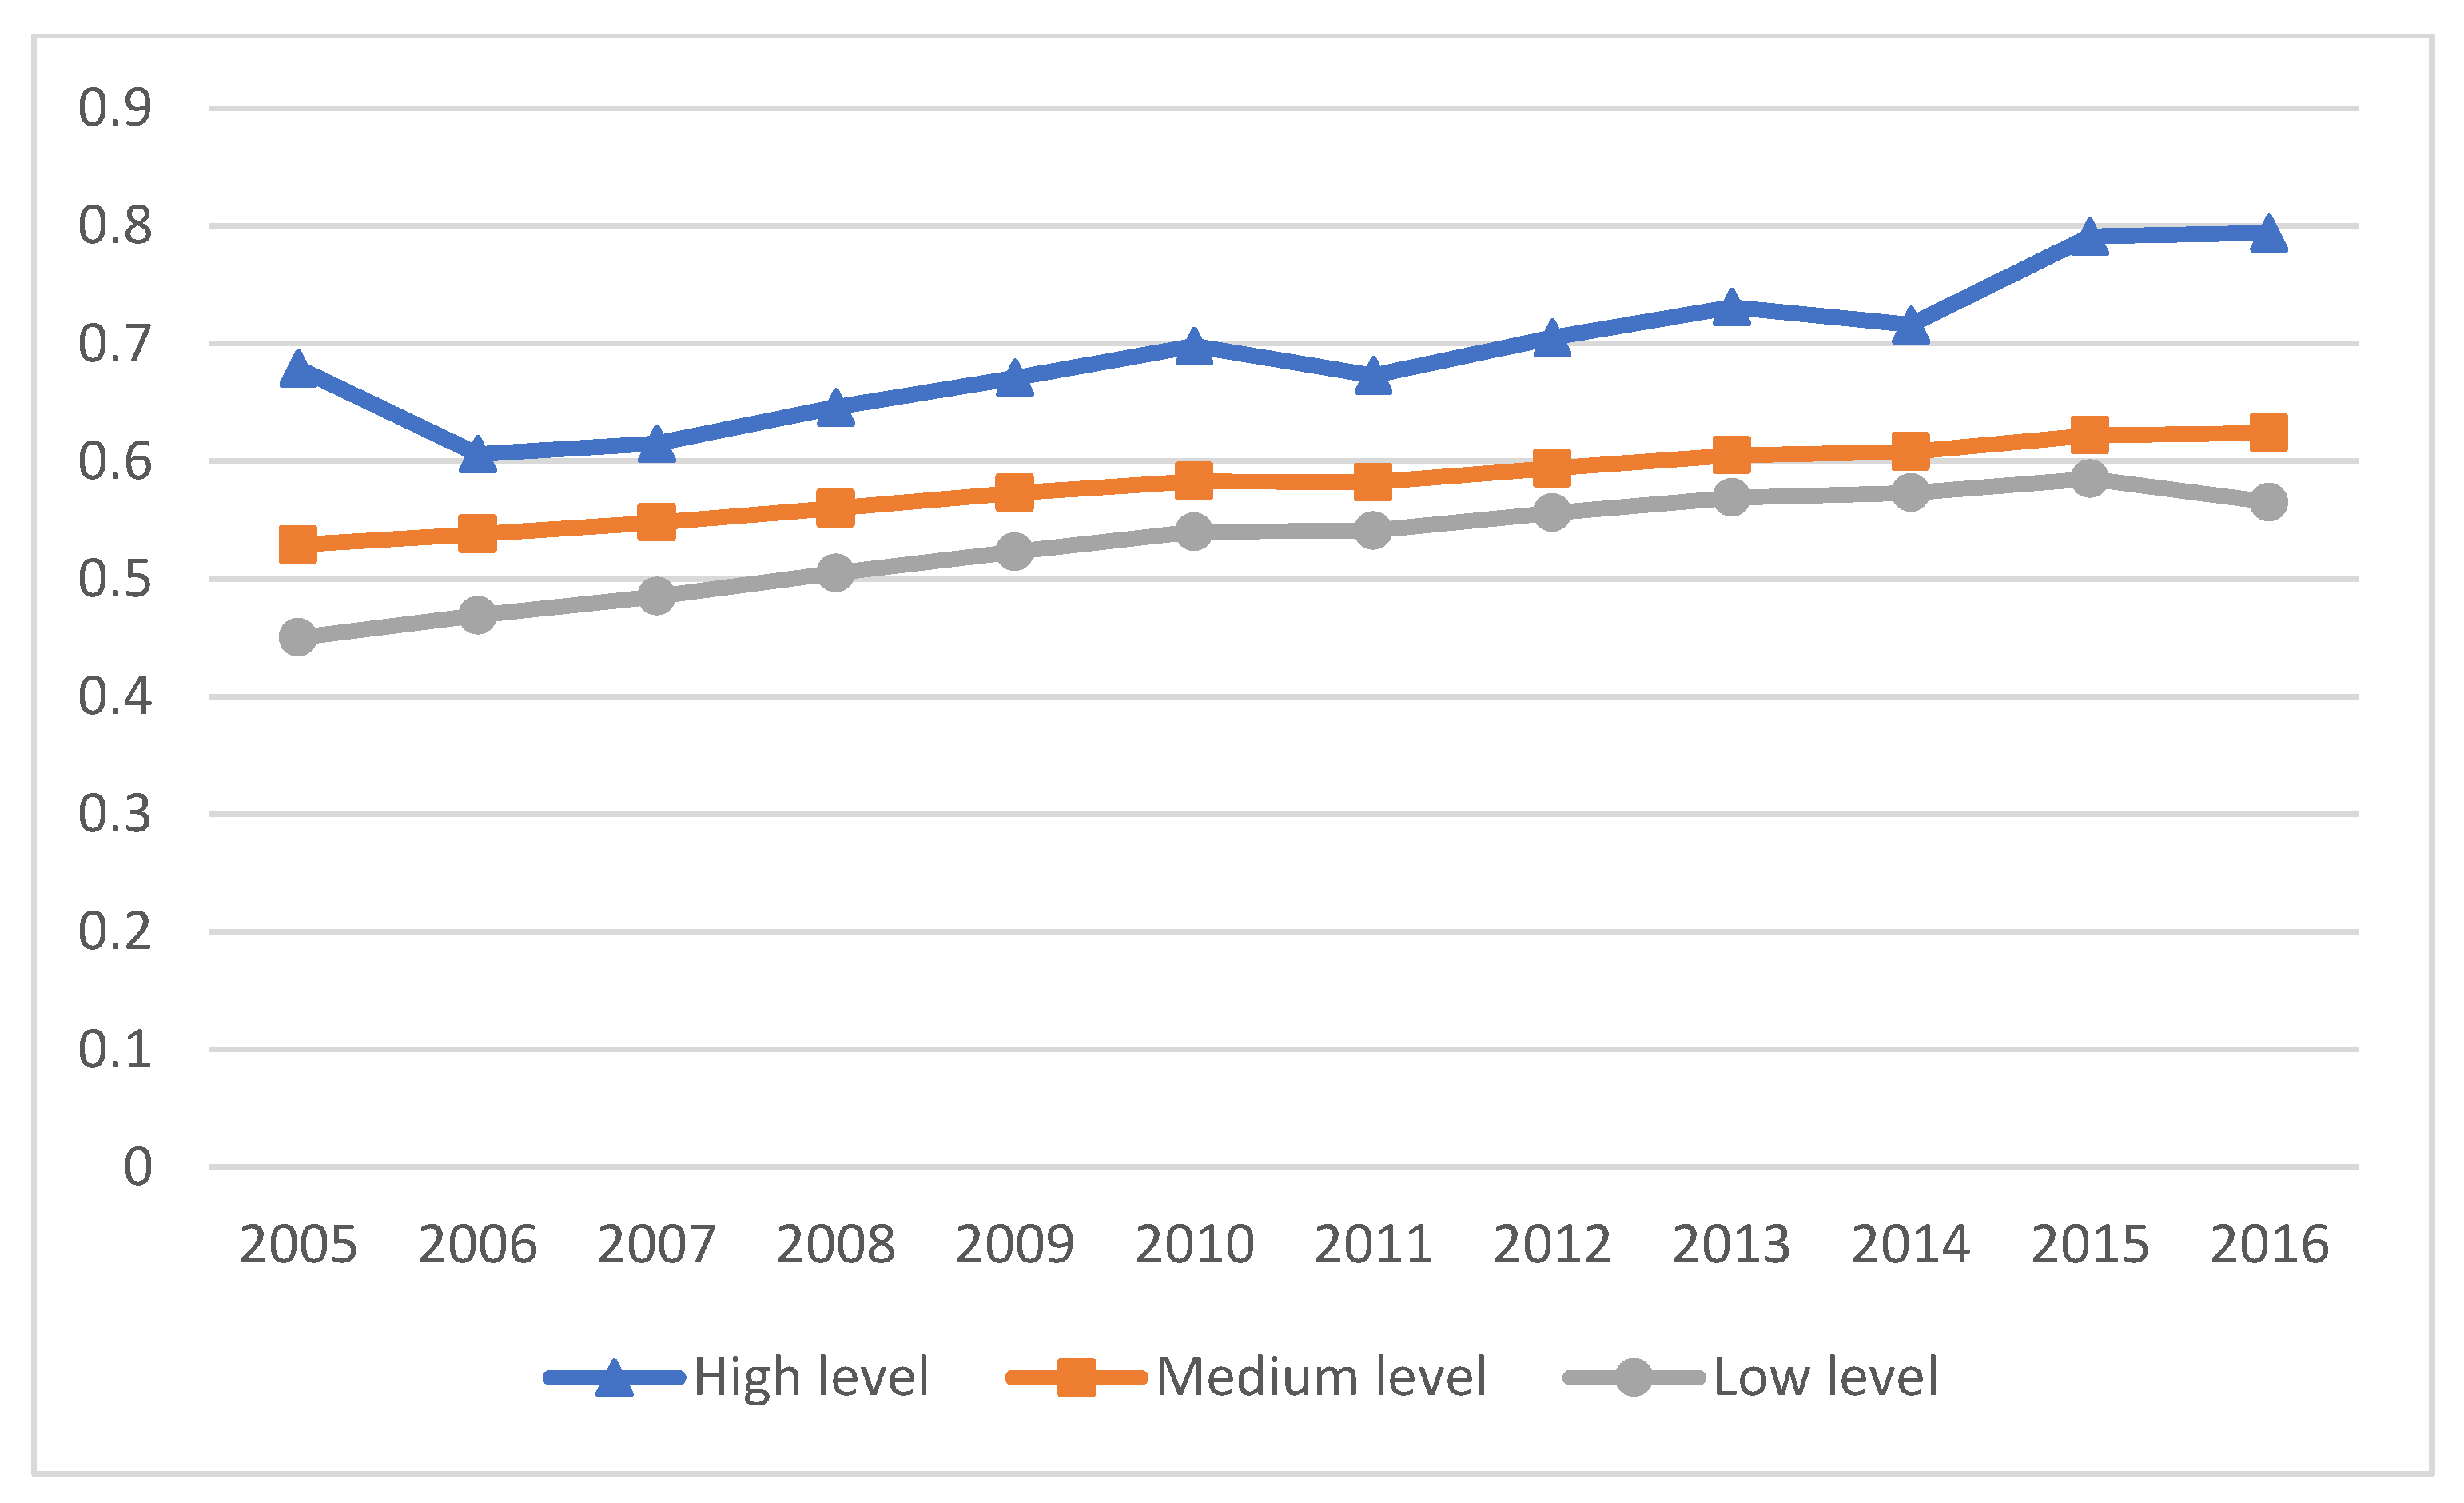
- City-level situation
4. Empirical Results and Analysis
- (1)
- Baseline regression results
- (2)
- Nonlinear effect analysis
- (3)
- Heterogeneity analysis
- (4)
- Robustness test
- a.
- Excluding the influence of some outliers. Firstly, the mean values of the urban energy structure and eco-efficiency in the whole sample period were calculated, and then the top and bottom 10% of cities were excluded to obtain 266 cities. The instrumental variable regression was then carried out. The research results remained basically unchanged, and the regression coefficient of the energy structure was always negative at the 1% significance level.
- b.
- The influence of provincial capitals and municipalities was excluded. Due to the particularity of administrative and economic status of provincial capitals and municipalities directly under the Central Government, to eliminate their interference in the regression results, we removed 27 provincial capitals (e.g., Shijiazhuang and Taiyuan) and four municipalities directly under the Central Government (including Beijing, Shanghai, Tianjin, and Chongqing) from the whole sample and conducted an instrumental variable regression. The regression results remained robust, which reconfirmed the reliability of the empirical results in this study.
- c.
- The full-log model was used for empirical analysis. Natural logarithms were taken for explained, core explanatory, and control variables, and econometric regression was then performed to investigate the sensitivity of regression results to the model setting. The promoting effect of the energy structure on urban ecological efficiency remained significant. Although there were differences in the relevant estimation coefficients, there was a negative relationship between the energy structure and the urban eco-efficiency level, which was manifested in that the improvement of the energy structure (namely the reduction in energy with coal consumption as the core) played a promoting role in the improvement of urban ecology. In conclusion, the above research conclusions are robust and reliable.
5. Spatial Spillover Effect Test
- (1)
- Moran’s index
- (2)
- Spatial baseline regression
6. Discussion
- (1)
- We explored the relationship between energy structure and eco-efficiency with more cities as objects. Further, Zhang [41] and Zhang [42], based on provincial data, refined the research object and enriched the discussion on the influencing factors of ecological efficiency by Shah [39] and Hu [40]. These studies held that the overall trend of urban energy structure adjustment and ecological efficiency improvement is good, supporting the conclusion of Chen [25], which is also based on provincial data. The difference is that they concluded that carbon dioxide emissions can be reduced through energy structure adjustment, which can be expressed as the increase in the coal-based energy structure had a negative effect on the improvement of urban eco-efficiency. This study finds that such results remain valid after a series of robustness tests, including a replacement regression model and outlier. However, based on the analysis of regional heterogeneity, the influence of energy structure on eco-efficiency varies substantially in space. Resource-based and old industrial cities have greater difficulty in energy structure adjustment, but the effect of such adjustment is more significant. Reducing coal consumption and optimizing energy structure has become an important driving force for improving urban ecological efficiency.
- (2)
- The effect of energy structure on eco-efficiency meets the nonlinear change characteristic of an inverted U-shape. According to model (2), this study finds that in Table 3, the primary term factor is significantly negative, but the secondary term coefficient is significantly positive. In other words, continuous substitution of clean energy and reduction in coal consumption to optimize the energy structure will eventually raise the cost of urban operation and development, notably affect the sustainable and stable economic development, and inhibit the improvement of ecological efficiency. Lin [27] concluded that the increase in energy cost caused by the change in energy structure would have a certain negative impact on the macro-economy. Wang [43] proposed that the adjustment of energy consumption structure had no significant effect on the improvement of energy efficiency.
- (3)
- The change in energy structure among cities and the level of urban eco-efficiency have spatial interaction effects and heterogeneity. Cities may race to the bottom and to the top simultaneously. The spillover effect of eco-efficiency on neighboring areas is obvious: when the eco-efficiency of the neighboring area increases, the eco-efficiency of the local area also tends to increase. Geographical and economic spatial effects have an important influence on the change in eco-efficiency between cities. Further study of the local–neighborhood spillover effect shows that the local and neighborhood effects of energy structure on eco-efficiency are different in the inverse and economic distance matrices, indicating that the energy structure reflects more local effects. However, looking at the direct and indirect effects of economic distance, we found that the energy structure in the direct effect has a significant impact on the ecological efficiency, indicating that the closer the economic connection between two places, the more noticeable the impact of local energy structure on the ecological efficiency of neighboring cities. It has a certain spatial spillover effect, which provides support for local governments and other relevant institutions to understand and improve ecological efficiency. Such is an important complementary finding to the existing literature, which rarely provides such evidence.
7. Conclusions and Policy Recommendations
7.1. Conclusions
7.2. Policy Recommendations
7.3. Deficiencies and Prospects
Author Contributions
Funding
Data Availability Statement
Conflicts of Interest
Appendix A. Energy Structure, Ecological Efficiency, and Industrial Pollution Index of Major Cities in China

| 2005 | 2010 | 2015 | 2020 | |
|---|---|---|---|---|
| Beijing | 0.455 | 0.740 | 0.594 | 0.550 |
| Tianjin | 0.534 | 0.518 | 0.564 | 0.554 |
| Shijiazhuang | 0.865 | 0.891 | 0.768 | 0.768 |
| Taiyuan | 0.780 | 0.697 | 0.623 | 0.611 |
| Huhehaote | 0.885 | 0.768 | 0.784 | 0.775 |
| Shenyang | 0.686 | 0.761 | 0.618 | 0.486 |
| Dalian | 0.533 | 0.473 | 0.345 | 0.336 |
| Changchun | 0.519 | 0.449 | 0.426 | 0.337 |
| Harbin | 0.865 | 0.865 | 0.770 | 0.786 |
| Shanghai | 0.462 | 0.436 | 0.416 | 0.402 |
| Nanjing | 0.150 | 0.243 | 0.559 | 0.546 |
| Hangzhou | 0.600 | 0.589 | 0.450 | 0.405 |
| Ningbo | 0.708 | 0.725 | 0.701 | 0.654 |
| Hefei | 0.748 | 0.721 | 0.697 | 0.659 |
| Fuzhou | 0.695 | 0.799 | 0.742 | 0.726 |
| Xiamen | 0.395 | 0.443 | 0.407 | 0.382 |
| Nanchang | 0.590 | 0.734 | 0.586 | 0.559 |
| Jinan | 0.781 | 0.793 | 0.802 | 0.748 |
| Qingdao | 0.797 | 0.811 | 0.807 | 0.798 |
| Zhengzhou | 0.788 | 0.715 | 0.562 | 0.561 |
| Wuhan | 0.710 | 0.762 | 0.762 | 0.754 |
| Changsha | 0.854 | 0.882 | 0.832 | 0.824 |
| Guangzhou | 0.611 | 0.619 | 0.559 | 0.549 |
| Shenzhen | 0.346 | 0.425 | 0.463 | 0.479 |
| Zhuhai | 0.343 | 0.318 | 0.265 | 0.277 |
| Shantou | 0.100 | 0.223 | 0.041 | 0.668 |
| Nanning | 0.676 | 0.747 | 0.734 | 0.683 |
| Haikou | 0.642 | 0.591 | 0.546 | 0.346 |
| Chongqing | 0.682 | 0.619 | 0.566 | 0.538 |
| Chengdu | 0.714 | 0.632 | 0.711 | 0.673 |
| Guiyang | 0.634 | 0.651 | 0.745 | 0.568 |
| Kunming | 0.5577 | 0.5909 | 0.6279 | 0.593 |
| Xi’an | 0.576 | 0.697 | 0.553 | 0.453 |
| Lanzhou | 0.417 | 0.648 | 0.655 | 0.718 |
| Xining | 0.712 | 0.728 | 0.731 | 0.692 |
| Yinchuan | 0.662 | 0.757 | 0.551 | 0.501 |
| Urumqi | 0.632 | 0.743 | 0.652 | 0.511 |
| 2005 | 2010 | 2015 | 2020 | |
|---|---|---|---|---|
| Beijing | 0.707 | 1.037 | 1.073 | 1.073 |
| Tianjin | 0.568 | 0.689 | 1.026 | 1.020 |
| Shijiazhuang | 0.553 | 0.670 | 0.621 | 0.608 |
| Taiyuan | 0.525 | 0.590 | 0.611 | 0.596 |
| Huhehaote | 0.532 | 0.681 | 1.017 | 0.670 |
| Shenyang | 0.575 | 0.666 | 0.664 | 0.642 |
| Dalian | 0.582 | 0.641 | 0.671 | 0.612 |
| Changchun | 0.573 | 0.639 | 1.047 | 1.051 |
| Harbin | 0.554 | 0.643 | 0.703 | 0.680 |
| Shanghai | 0.581 | 1.022 | 1.021 | 1.058 |
| Nanjing | 0.534 | 0.585 | 0.619 | 0.663 |
| Hangzhou | 0.558 | 0.575 | 0.617 | 0.635 |
| Ningbo | 0.607 | 0.610 | 0.707 | 0.668 |
| Hefei | 0.543 | 0.605 | 0.596 | 0.602 |
| Fuzhou | 0.561 | 0.647 | 0.712 | 0.697 |
| Xiamen | 0.544 | 0.604 | 0.600 | 0.642 |
| Nanchang | 0.549 | 0.573 | 0.602 | 0.593 |
| Jinan | 0.578 | 0.640 | 0.739 | 0.676 |
| Qingdao | 0.600 | 0.761 | 1.021 | 1.054 |
| Zhengzhou | 1.088 | 0.588 | 0.599 | 0.645 |
| Wuhan | 0.705 | 0.567 | 0.680 | 0.644 |
| Changsha | 0.585 | 0.629 | 0.789 | 0.724 |
| Guangzhou | 0.855 | 0.642 | 1.015 | 0.680 |
| Shenzhen | 0.658 | 1.049 | 1.104 | 1.082 |
| Zhuhai | 1.055 | 0.557 | 0.601 | 0.607 |
| Shantou | 0.536 | 0.592 | 0.642 | 0.601 |
| Nanning | 0.497 | 0.527 | 0.587 | 0.609 |
| Haikou | 0.715 | 1.052 | 0.706 | 1.025 |
| Chongqing | 0.536 | 0.573 | 0.592 | 0.595 |
| Chengdu | 0.512 | 0.598 | 0.651 | 0.644 |
| Guiyang | 0.620 | 0.546 | 0.593 | 0.570 |
| Kunming | 0.800 | 0.824 | 0.744 | 0.591 |
| Xi’an | 0.438 | 0.571 | 0.645 | 0.710 |
| Lanzhou | 0.439 | 0.568 | 0.591 | 0.594 |
| Xining | 0.336 | 0.503 | 0.552 | 0.529 |
| Yinchuan | 0.456 | 0.519 | 0.533 | 0.541 |
| Urumqi | 0.407 | 0.532 | 0.584 | 0.505 |
| 2005 | 2010 | 2015 | 2020 | |
|---|---|---|---|---|
| Beijing | 0.19255 | 0.16940 | 0.08367 | 0.11572 |
| Tianjin | 1.28407 | 1.35075 | 0.78253 | 0.82359 |
| Shijiazhuang | 1.04330 | 0.64560 | 0.70688 | 0.95091 |
| Taiyuan | 0.37284 | 0.35658 | 0.09073 | 0.05729 |
| Huhehaote | 0.39472 | 0.09695 | 0.09523 | 0.43430 |
| Shenyang | 0.19096 | 0.85804 | 0.25738 | 0.19084 |
| Dalian | 1.07077 | 0.62495 | 1.28314 | 1.36554 |
| Changchun | 0.24794 | 1.93706 | 0.08641 | 0.06805 |
| Harbin | 0.31270 | 0.22824 | 0.08172 | 0.09816 |
| Shanghai | 2.64373 | 1.67917 | 2.28399 | 2.49098 |
| Nanjing | 1.49987 | 1.04506 | 0.70874 | 0.82118 |
| Hangzhou | 4.13948 | 4.02527 | 1.14154 | 1.31229 |
| Ningbo | 0.46036 | 0.50896 | 0.42923 | 0.52541 |
| Hefei | 0.03698 | 0.04105 | 0.08293 | 0.04891 |
| Fuzhou | 0.11644 | 0.12462 | 0.10380 | 0.29201 |
| Xiamen | 0.04804 | 0.03391 | 0.42929 | 0.48500 |
| Nanchang | 0.07155 | 0.08242 | 0.11140 | 0.20456 |
| Jinan | 0.09921 | 0.15376 | 0.17151 | 0.21379 |
| Qingdao | 0.20825 | 0.17996 | 0.17960 | 0.08463 |
| Zhengzhou | 1.41584 | 0.68183 | 0.57090 | 0.22013 |
| Wuhan | 0.62636 | 0.40698 | 0.32341 | 0.34993 |
| Changsha | 0.14008 | 0.17277 | 0.02891 | 0.03167 |
| Guangzhou | 0.39831 | 0.50110 | 0.36187 | 0.58008 |
| Shenzhen | 0.03894 | 0.05840 | 0.33730 | 0.17393 |
| Zhuhai | 0.01185 | 0.04895 | 0.04136 | 0.03196 |
| Shantou | 0.02214 | 0.03367 | 0.04039 | 0.06463 |
| Nanning | 0.24716 | 0.26287 | 0.06702 | 0.03144 |
| Haikou | 0.00009 | 0.00015 | 0.00052 | 0.00039 |
| Chongqing | 8.52802 | 6.94691 | 4.58626 | 3.73594 |
| Chengdu | 2.29472 | 0.30924 | 0.14756 | 0.16261 |
| Guiyang | 0.56265 | 0.11427 | 0.06721 | 0.15907 |
| Kunming | 0.08321 | 0.12090 | 0.11441 | 0.59916 |
| Xi’an | 0.31496 | 0.24130 | 0.05261 | 0.02571 |
| Lanzhou | 0.05874 | 0.07500 | 0.09041 | 0.05468 |
| Xining | 0.10216 | 0.16062 | 0.07816 | 0.40604 |
| Yinchuan | 0.00542 | 0.04094 | 0.09849 | 0.07291 |
| Urumqi | 0.17753 | 0.34601 | 0.08143 | 0.20048 |
References
- Lansink, A.O.; Wall, A. Frontier models for evaluating environmental efficiency: An overview. Econ. Bus. Lett. 2014, 3, 43–50. [Google Scholar] [CrossRef]
- Schaltegger, S.; Sturm, A. Okologische rationalitatan-satzpunkte-zur ausgestalung von okologieorientierten management instrumenten. Untemehmung 1990, 4, 273–290. [Google Scholar]
- Kuosmanen, T.; Kortelainen, M. Measuring eco-efficiency of production with data envelopment analsis. J. Ind. Ecol. 2005, 9, 59–72. [Google Scholar] [CrossRef]
- Rashidi, K.; Saen, R.F. Measuring eco-efficiency based on green indicators and potentials in energy saving and undesirable output abatement. Energy Econ. 2015, 50, 18–26. [Google Scholar] [CrossRef]
- Yang, L.; Zhang, X. Assessing regional eco-efficiency from the perspective of resource, environmental and economic performance in China: A bootstrapping approach in global data envelopment analysis. J. Clean. Prod. 2018, 173, 100–111. [Google Scholar] [CrossRef]
- Charnes, A.; Cooper, W.W.; Rhodes, E. Measuring the efficiency of decision making units. Eur. J. Oper. Res. 1978, 2, 429–444. [Google Scholar] [CrossRef]
- Banker, R.D.; Charnes, A.; Cooper, W.W. Some models for estimating technical and scale inefficiencies in DEA. J. Manag. Sci. 1984, 30, 1078–1092. [Google Scholar]
- Zuo, Z.M.; Yang, L. Analysis of total factor energy efficiency in China: Based on SBM model. Stat. Decis. 2011, 20, 105–107. [Google Scholar]
- Avkiran, N.K.; Tone, K.; Tsutsui, M. Bridging radial and non-radial measures of efficiency in DEA. Ann. Oper. Res. 2008, 164, 127–138. [Google Scholar] [CrossRef]
- Wu, J.; Liang, L. A multiple criteria ranking method based on game cross-evaluation approach. Ann. Oper. Res. 2012, 197, 191–200. [Google Scholar] [CrossRef]
- Moreno, P.; Lozano, S. A network DEA assessment of team efficiency in the NBA. Ann. Oper. Res. 2014, 214, 99–124. [Google Scholar] [CrossRef]
- Kuang, H.B.; Chen, S. Investigating cost efficiency of China port public companies based on SUP-CCR-DEA. J. Chin. Manag. 2007, 15, 142–148. [Google Scholar]
- Avkiran, N.K.; Cai, L. Identifying distress among banks prior to a major crisis using non-oriented super-SBM. Ann. Oper. Res. 2014, 217, 31–53. [Google Scholar] [CrossRef]
- Yu, Y.; Zhu, W.; Zhang, Q. DEA cross-efficiency evaluation and ranking method based on interval data. Ann. Oper. Res. 2019, 278, 159–175. [Google Scholar] [CrossRef]
- Song, M.L.; Wang, S.H. Environmental regulation, technological progress and economic growth. Econ. Res. 2013, 48, 122–134. [Google Scholar]
- Song, M.; Tao, J.; Wang, S. FDI, technology spillovers and green innovation in China: Analysis based on Data Envelopment Analysis. Ann. Oper. Res. 2015, 228, 47–64. [Google Scholar] [CrossRef]
- Fragkiadakis, G.; Doumpos, M.; Zopounidis, C.; Germain, C. Operational and economic efficiency analysis of public hospitals in Greece. Ann. Oper. Res. 2014, 247, 787–806. [Google Scholar] [CrossRef]
- Petridis, K.; Chatzigeorgiou, A.; Stiakakis, E. A spatiotemporal Data Envelopment Analysis (S-T DEA) approach: The need to assess evolving units. Ann. Oper. Res. 2016, 238, 475–496. [Google Scholar] [CrossRef]
- Chen, H.; Wu, Q.Y.; Cheng, J.Q.; Ma, Z.; Song, W. Scaling-up strategy as an appropriate approach for sustainable new town development? Lessons from Wujin, Changzhou, China. Sustainability 2015, 7, 5682–5704. [Google Scholar] [CrossRef]
- Wu, Q.Y.; Zhang, X.L.; Shang, Z.Y.; Li, Z. Political-economy based institutional industry complex and sustainable development: The case of the salt-chemical industry in Huai’an, China. Energy Policy 2015, 87, 39–47. [Google Scholar] [CrossRef]
- Li, Z.J.; Yao, Y.X.; Ma, Z.F.; Hu, M.J.; Wu, Q.Y. Spatial pattern of ecological efficiency in China and its influencing factors. J. Environ. Sci. 2016, 36, 4208–4217. [Google Scholar]
- Wu, B.A.; Gao, J.H.; Xu, C. The decomposition analysis of carbon emission in Henan Province based on the industrial structure and energy structure. Econ. Geogr. 2010, 30, 1902–1907. [Google Scholar]
- Zhou, Y.N.; He, Z.; Ma, L.; Yang, Y.; Zhang, T.Y.; Chen, L.Y. Spatial and temporal differentiation of China’s provincial scale energy consumption structure. Resour. Sci. 2017, 39, 2247–2257. [Google Scholar]
- Dong, M.; Xu, Z.Y.; Li, C.F. The impact of carbon intensity restriction on welfare of urban and rural residents: An analysis based on CGE Model. China’s Popul. Resour. Environ. 2018, 28, 94–105. [Google Scholar]
- Chen, Y.W.; Wang, M.Q.; Li, D. Study on China’s Inter-provincial Eco-efficiency Based on Improved SBM Model. Sci. Technol. Manag. Res. 2019, 39, 7. [Google Scholar]
- Yan, Q.; Wang, X.; Baležentis, T.; Streimikiene, D. Energy–economy–environmental (3E) performance of Chinese regions based on the data envelopment analysis model with mixed assumptions on disposability. Energy Environ. 2018, 29, 664–684. [Google Scholar] [CrossRef]
- Lin, B.Q.; Yao, X.; Liu, X.Y. China’s energy strategy adjustment under energy conservation and carbon emission constraints. Soc. Sci. China 2010, 1, 58–71. [Google Scholar]
- Lin, M.S. The clean energy consumption, environment governance and the sustainable economic growth in China. China J. Quant. Tech. Econ. 2017, 12, 3–21. [Google Scholar]
- Tao, X.P.; Wang, P.; Zhu, B.Z. Energy efficiency in APEC: A meta-frontier SBM-undesirable approach. China J. Beijing Inst. Technol. (Soc. Sci. Ed.) 2015, 17, 20–28. [Google Scholar]
- Wang, B.; Xie, J. International comparison of total factor energy efficiency—An empirical research from the perspective of energy structure. China J. Ind. Econ. Rev. 2015, 6, 72–86. [Google Scholar]
- Lv, B.B.; Chen, S.J. International comparison of total factor energy efficiency—An empirical study based on Malmquist index. Manag. Admin. 2015, 7, 71–74. [Google Scholar]
- Xu, W.X.; Xu, Z.X.; Liu, C.J. Energy structure, ecological environment and economic development: Analysis of threshold effect and heterogeneity. Stat. Inf. 2020, 10, 81–89. [Google Scholar]
- Xu, B.; Chen, Y.F.; Shen, X.B. Clean energy development, carbon dioxide emission reduction and regional economic growth. China Econ. Res. J. 2019, 7, 188–202. [Google Scholar]
- Dong, Z.Q.; Wang, H. Local-neighborhood effect of green technology of environmental regulation. China Ind. Econ. 2019, 1, 100–118. [Google Scholar]
- Scholz, R.W.; Wiek, A. Operational eco-efficiency: Comparing firms’ environmental investments in different domains of operation. J. Ind. Ecol. 2005, 9, 155–170. [Google Scholar] [CrossRef]
- Cheng, J.H.; Sun, Q.; Guo, M.J.; Xu, W.Y. Research on regional disparity and dynamic evolution of eco-efficiency in China. China Popul. Resour. Environ. 2014, 24, 47–54. [Google Scholar]
- Zheng, H.; Jia, S.; Zhao, X. An analysis of regional eco-efficiency in China under the background of new-type urbanization. Resour. Sci. 2017, 7, 1314–1325. [Google Scholar]
- Niu, W.Y. China’s New Urbanization Report; Science Press: Beijing, China, 2010. [Google Scholar]
- Shah, I.H.; Liang, D.; Park, H.S. Tracking urban sustainability transition: An eco-efficiency analysis on eco-industrial development in Ulsan, Korea. J. Clean. Prod. 2020, 262, 121286. [Google Scholar] [CrossRef]
- Hu, X.; Ali, N.; Malik, M.; Hussain, J.; Fengyi, J.; Nilofar, M. Impact of economic openness and innovations on the environment: A new look into ASEAN countries. Pol. J. Environ. Stud. 2021, 30, 3601–3613. [Google Scholar] [CrossRef]
- Zhang, B.; Bi, J.; Fan, Z. Eco-efficiency analysis of industrial system in China: A data envelopment analysis approach. J. Ecol. Econ. 2008, 68, 306–316. [Google Scholar] [CrossRef]
- Zhang, S.Y.; Li, D.S.; Liu, Y.Y. Study on evaluation and influencing factors of regional industrial eco-efficiency. J. Stat. Decis. 2013, 3, 61–64. [Google Scholar]
- Wang, Q.; Zheng, Y.; Wu, S.D.; Li, T.T. The response of energy efficiency to the evolution of industrial structure and energy consumption structure. J. Acta Geogr. Sin. 2011, 66, 741–749. [Google Scholar]


| Main Variables | Number of Samples | Mean Value | Standard Deviation | Minimum Value | Maximum Value |
|---|---|---|---|---|---|
| EE | 3420 | 0.605 | 0.123 | 0.320 | 1.258 |
| ES | 3420 | 0.785 | 0.148 | 0.041 | 0.9998 |
| IS | 3420 | 0. 490 | 0.109 | 0.09 | 0.910 |
| OPEN | 3420 | 2.355 | 2.405 | 0.001 | 16.476 |
| PUBLIC | 3420 | 0.501 | 1.302 | 0.006 | 24.956 |
| PD | 3420 | 425.844 | 326.508 | 5 | 2648 |
| TECH | 3420 | 0.126 | 0.0132 | 0.003 | 0.207 |
| FE (1) | FE (2) | ||
|---|---|---|---|
| ES | −0.1777 *** (−7.7261) | −0.1170 *** (−5.2347) | −0.1143 *** (−5.1030) |
| IS | −0.0838 *** (−2.6962) | −0.0903 *** (−2.8843) | |
| OPEN | 0.0004 (0.5944) | −0.0007 (−0.5458) | |
| PUBLIC | 0.0106 *** (6.3820) | 0.0107 *** (6.4313) | |
| lnPD | 0.3706 *** (10.3055) | 0.3738 *** (10.3903) | |
| TECH | 1.3168 *** (8.0395) | 1.3980 *** (8.1622) | |
| ES × TECH | 2.5446 * (1.6526) | ||
| Two-way fixed effect | Yes | Yes | Yes |
| _cons | 0.7450 *** (41.1105) | −1.4063 *** (−6.7717) | −1.4208 *** (−6.8401) |
| R2 | 0.4244 | 0.1103 | 0.1110 |
| N | 3420 | 3420 | 3420 |
| EE | ||
| ES | −0.0758 *** (−2.7952) | −0.0525 ** (−2.0194) |
| ES2 | −0.1609 *** (−6.9717) | −0.1192 *** (−5.3291) |
| IS | −0.0534 * (−1.7083) | |
| OPEN | 0.0005 (0.7189) | |
| PUBLIC | 0.0104 *** (6.2839) | |
| lnPD | 0.3523 *** (9.8346) | |
| TECH | 1.2770 *** (7.8463) | |
| Two-way fixation | YES | YES |
| _cons | 0.7974 *** (40.9101) | −0.2686 *** (−6.1187) |
| R2 | 0.1236 | 0.1236 |
| N | 3420 | 3420 |
| Resource-Based Cities | Non-Resource-Based Cities | Heavy Industrial Cites | Non-Heavy Industrial Cities | |
|---|---|---|---|---|
| ES | −0.1297 *** (−3.9268) | −0.0996 *** (−3.3297) | −0.1252 *** (−3.7979) | −0.1081 *** (−3.7336) |
| IS | −0.1955 *** (−4.6973) | 0.0137 (0.3056) | −0.0838 ** (−2.0000) | −0.0926 ** (−2.1865) |
| OPEN | 0.0014 (1.3199) | −0.0003 (−0.2863) | 0.0008 (0.8100) | 0.0003 (0.3144) |
| PUBLIC | 0.0108 *** (2.6588) | 0.0108 *** (5.6954) | 0.0155 *** (4.3103) | 0.0100 *** (5.1449) |
| lnPD | 0.4722 *** (8.5232) | 0.3197 *** (6.7853) | 0.4674 *** (8.2647) | 0.3487 *** (7.6424) |
| TECH | 1.2125 *** (4.9836) | 1.4607 *** (6.6752) | 1.8317 *** (7.0363) | 1.1468 *** (5.5219) |
| _cons | −0.7739 *** (−5.9041) | −0.2366 *** (−4.3751) | −0.9623 *** (−6.0583) | −0.2762 *** (−4.8285) |
| Two-way fixation | Yes | Yes | Yes | Yes |
| R2 | 0.3579 | 0.2629 | 0.5604 | 0.2223 |
| N | 1344 | 2076 | 1128 | 2292 |
| (1) | (2) | (3) | ||
|---|---|---|---|---|
| Elimination of Outliers | Elimination of Provincial Capitals and Municipalities | Taking the Logarithm | ||
| ES | −0.1280 *** (−8.6027) | −0.1412 *** (−5.8830) | lnES | −0.0455 *** (−2.9347) |
| IS | 0.0425 *** (2.8520) | −0.0561 * (−1.7795) | lnIS | −0.0768 *** (−4.1850) |
| OPEN | 0.0001 (0.1717) | 0.0008 (1.1297) | lnOPEN | 0.0093 *** (5.2452) |
| PUBLIC | 0.0055 *** (6.8897) | 0.0145 *** (5.5371) | lnPUBLIC | 0.0327 *** (15.6706) |
| lnPD | 0.2112 *** (12.1853) | 0.4227 *** (10.7831) | lnPD | 0.3292 *** (6.5362) |
| TECH | 0.8892 *** (11.2967) | 1.1945 *** (6.7625) | lnTECH | 0.0347 *** (11.1914) |
| _cons | −0.5523 *** (−5.4584) | −1.6710 *** (−7.4841) | _cons | −2.2514 *** (−7.6819) |
| Two-way fixation | Yes | Yes | Two-way fixation | Yes |
| R2 | 0.1733 | 0.1144 | R2 | 0.2219 |
| N | 3192 | 3048 | N | 3420 |
| Efficiency of Ecology | Energy Structure | |
|---|---|---|
| Moran Z Value | Moran Z Value | |
| 2005 | 0.037 *** (6.549) | 0.041 *** (7.103) |
| 2006 | 0.054 *** (9.300) | 0.043 *** (7.498) |
| 2007 | 0.045 *** (7.927) | 0.035 *** (6.242) |
| 2008 | 0.038 *** (6.705) | 0.031 *** (5.632) |
| 2009 | 0.038 *** (6.720) | 0.035 *** (6.218) |
| 2010 | 0.027 *** (4.952) | 0.026 *** (4.795) |
| 2011 | 0.046 *** (8.005) | 0.011 *** (2.368) |
| 2012 | 0.037 *** (6.604) | 0.019 *** (3.611) |
| 2013 | 0.042 *** (7.341) | 0.028 *** (5.087) |
| 2014 | 0.021 *** (3.910) | 0.041 *** (7.143) |
| 2015 | 0.022 *** (4.124) | 0.048 *** (8.221) |
| 2016 | 0.023 *** (4.255) | 0.048 *** (8.211) |
| SDM | SAR | |||
|---|---|---|---|---|
| (1) | (2) | (3) | (4) | |
| Inverse Distance | Economic Distance | Inverse Distance | Economic Distance | |
| ES | −0.0355 * (0.0201) | −0.0398 ** (0.0200) | 0.0326 (0.0201) | 0.0340 * (0.0200) |
| W × ES | −0.1378 (0.2266) | −0.0284 (0.0493) | ||
| Control variables | YES | YES | YES | YES |
| rho | 0.2787 ** (0.1214) | 0.1685 *** (0.0321) | 0.4158 *** (0.1086) | 0.1650 *** (0.0317) |
| sigma2_e | 0.0047 *** (0.0001) | 0.0047 *** (0.0001) | 0.0048 *** (0.0001) | 0.0047 *** (0.0001) |
| Direct effect | 0.0358 * (0.0206) | 0.0402 * (0.0206) | 0.0334 (0.0206) | 0.0348 * (0.0206) |
| Indirect effect | −0.1851 (0.346) | −0.0256 (0.0611) | 0.027 (0.0246) | 0.0069 (0.0046) |
| Total effect | −0.1493 (0.3471) | 0.0146 (0.0662) | 0.0604 (0.0418) | 0.0417 * (0.0249) |
| Two-way fixation | Yes | Yes | Yes | Yes |
| R2 | 0.0338 | 0.0286 | 0.0564 | 0.0496 |
| N | 3420 | 3420 | 3420 | 3420 |
| Log L | 4316.302 | 4322.5124 | 4291.325 | 4297.779 |
| AIC | −8580.603 | −8593.0247 | −8542.649 | −8555.558 |
Disclaimer/Publisher’s Note: The statements, opinions and data contained in all publications are solely those of the individual author(s) and contributor(s) and not of MDPI and/or the editor(s). MDPI and/or the editor(s) disclaim responsibility for any injury to people or property resulting from any ideas, methods, instructions or products referred to in the content. |
© 2023 by the authors. Licensee MDPI, Basel, Switzerland. This article is an open access article distributed under the terms and conditions of the Creative Commons Attribution (CC BY) license (https://creativecommons.org/licenses/by/4.0/).
Share and Cite
Zhang, F.; Luo, N.; Li, Y. What Type of Energy Structure Improves Eco-Efficiency? A Study Based on Statistical Data of 285 Prefecture-Level Entities in China. Sustainability 2023, 15, 9130. https://doi.org/10.3390/su15119130
Zhang F, Luo N, Li Y. What Type of Energy Structure Improves Eco-Efficiency? A Study Based on Statistical Data of 285 Prefecture-Level Entities in China. Sustainability. 2023; 15(11):9130. https://doi.org/10.3390/su15119130
Chicago/Turabian StyleZhang, Fan, Nengsheng Luo, and Yanfei Li. 2023. "What Type of Energy Structure Improves Eco-Efficiency? A Study Based on Statistical Data of 285 Prefecture-Level Entities in China" Sustainability 15, no. 11: 9130. https://doi.org/10.3390/su15119130
APA StyleZhang, F., Luo, N., & Li, Y. (2023). What Type of Energy Structure Improves Eco-Efficiency? A Study Based on Statistical Data of 285 Prefecture-Level Entities in China. Sustainability, 15(11), 9130. https://doi.org/10.3390/su15119130