Article

Benefit Sharing of Power Transactions in Distributed Energy Systems with Multiple Participants

1
School of Economics and Management, North China Electric Power University, Beijing 102206, China
2
School of Economics and Management, Wuhan University, Wuhan 430072, China
*
Author to whom correspondence should be addressed.
Sustainability 2023, 15(11), 9128; https://doi.org/10.3390/su15119128
Submission received: 20 April 2023 / Revised: 19 May 2023 / Accepted: 2 June 2023 / Published: 5 June 2023
(This article belongs to the Special Issue Low-Carbon Development in the Energy Sector)

Abstract

:
With the rapid advancement of China’s power system reform, various provinces have progressively recognized distributed energy systems as autonomous market participants, and their operational paradigm has transitioned from centralized procurement and sales to market competition. This paradigm shift has presented novel demands for the operational efficacy of distributed energy systems within the power market. Presently, China’s distributed energy systems are predominantly managed through collaborative efforts among multiple enterprises. Consequently, during the operational process, it becomes imperative to contemplate how to achieve efficient benefit allocation to ensure the system’s sustainable development. This endeavor also represents a pivotal undertaking in China’s pursuit of its dual-carbon objectives. Therefore, this study endeavors to construct a model for benefit sharing within distributed energy systems, predicated on the distinctive attributes of various stakeholders, in order to facilitate the system’s sustainable progression. Primarily, from the vantage point of the power market and the conduct of system stakeholders, this research scrutinizes key factors that influence benefit allocation, encompassing risk level, profit contribution, and predictive elements. Subsequently, utilizing the CIRTIC anti-entropy weight method Cloud–Shapley methodology, a benefit allocation model is formulated for multiple stakeholders participating in the distributed energy systems market. Finally, the efficacy of the model is substantiated through the simulation and analysis of core stakeholders within the distributed energy system. Simulation results manifest the actual allocation benefits for micro-gas turbines, wind power, and photovoltaics, which amount to CNY 0.941 million, CNY 0.858 million, and CNY 0.881 million, respectively. Moreover, the impacts of risk level, profit contribution, and prediction vary in magnitude concerning the benefit distribution among distinct stakeholders. In future endeavors encompassing post-operational benefit sharing in regional distributed energy systems, it is indispensable to consider the varying influence of different factors on stakeholders, as well as the significance of stakeholders within the system.

1. Introduction

Regional distributed energy systems can achieve complementarity among various energy sources by establishing a collaborative alliance. This strategy not only reduces the risk associated with the individual participation of regional distributed resource entities in the market, but also diminishes the impact of distributed energy instability on the security of the power system, while boosting the consumption of distributed energy. Distributed energy systems offer numerous benefits over conventional centralized energy systems, such as a greater reliability, enhanced energy efficiency, and reduced carbon emissions [1]. In China, most regional distributed energy systems are built by different market player types through investment and financing, providing a diverse range of actors. However, the enthusiasm of multiple stakeholders in the distributed energy system is influenced by the system’s benefit distribution measures, which have become one of the important factors for ensuring the system’s sustainable development [2,3]. Thus, it is crucial to examine the issue of benefit distribution among multiple stakeholders involved in the distributed energy system.
Currently, various researchers have offered policy recommendations at the policy level. For example, Reference [4] suggest the development of environmental policies in distributed energy, including energy sector decentralization, fiscal incentives, and market building, to promote the development of distributed energy. Other experts propose the use of green certificates and carbon emissions trading as policy tools to incentivize the application and development of distributed energy [5]. With regard to income factors affecting each participant in the distributed energy system, two main methods of benefit distribution have emerged. One method is the cost-based benefit allocation, which assigns the cost of the distributed energy system to different participants [6,7]. This approach is simple and easily implemented, but it cannot fully address the actual contributions and needs of different participants. Therefore, recent research has explored contribution and demand-based methods of benefit distribution [8]. The contribution-based approach allocates the benefits in the distributed energy system to participants with significant actual contributions [9,10,11]. While this method can promote participants’ eagerness, it may encounter difficulties in implementation and fairness in practical applications. The demand-based approach distributes benefits in the distributed energy system to participants with greater actual needs. While this solution can be tailored to meet the diverse needs of different participants, it may also lead to energy waste and unfairness.
Based on the advantages and disadvantages of the two methods, researchers generally advocate the adoption of diversified approaches that can address the varying interests of different participants, including economic and social interests. Reference [12] proposed a game theory model for benefit distribution in distributed energy, which factored in the interests of grid operators and users in relation to energy policies and other relevant factors. Meanwhile, Reference [13] recommended a user-centered approach for benefit distribution, whereby benefits accrued from distributed energy production are allocated to users who directly use the energy, with the aim of encouraging more active user participation in distributed energy. Ren Hongbo et al. [14] developed a comprehensive framework for cost-benefit analysis, encompassing the quantification and monetization of multiple benefits, employing a specific transfer method that takes into account the diverse advantages and stakeholders associated with distributed energy systems. Wu Qiong et al. [15] utilized the Shapley, Nucleolus, DP Equivalent, and Nash–Harsanyi methods to address benefit distribution among participants in distributed energy networks. Hafiz Abdul Muqeet et al. [16] conducted a case study at a university campus, proposing an astute coordination scheme for energy network load–storage, which considers the physical operating characteristics of multiple distributed energy systems and optimizes the efficient utilization of potential raw energy through energy storage systems. Li Songrui et al. [17] tackled the multi-objective challenge of the operation mode and revenue cycle mechanism in rural hybrid renewable energy systems, employing a bargaining model to realize an enhanced economic benefit cycle within the system. Li Jing et al. [18] explored the peer-to-peer energy trading paradigm, analyzing the incentive mechanisms of distributed energy systems and presenting a revenue distribution scheme based on core processes and a pricing mechanism rooted in a singular linear framework.
Additionally, some experts advocate for benefit distribution schemes based on blockchain technology, which leverages the characteristics of blockchain—that is, decentralization and non-tamperability to realize fair benefit distribution [19,20]. At present, most studies are based on the cooperative game bidding strategy in alliances, and use the traditional Shapley value model to allocate the cooperative game benefits. For example, Reference [21] constructed a profit allocation model for the cooperative game between virtual power plants and distribution companies using the traditional Shapley value method, but did not further investigate the profit allocation of internal stakeholders within the virtual power plant. Nevertheless, the model failed to explore the distribution of revenue in relation to the internal subjects of VPPs. References [22,23,24] used the Shapley model to allocate profits for the joint operation of members in virtual power plants, but this method only considers the marginal contribution of members and assumes that the probability of each scenario in the cooperative alliance is the same, thus neglecting the influence of the risk level on the members and leading to certain deviations from the actual situation. In addition, some scholars use the nucleolus method to minimize the maximum dissatisfaction degree of the allocation plan’s stakeholders for profit distribution, but this method also ignores the differences in risk and other characteristics among stakeholders [25]. Zhang Lihui et al. [26] devised a two-stage strategy for benefit sharing in renewable energy systems, incorporating Nash negotiation and enhanced Shapley values. They placed emphasis on analyzing system benefits across various equilibrium conditions. However, it should be noted that the primary objective of the sharing strategy is still to maximize overall the system benefits rather than individual benefits of system participants. Liu Shiyu et al. [27] developed a benefit-sharing mechanism grounded in the Shapley value method, wherein participants are rewarded based on their contributions to the industrial park. Lu et al. [28] introduced the Shapley model to incentivize different data centers for disaster recovery, leveraging insights from the bidding strategy of the demand response aggregator. Saeed Rahmani Dabbagh et al. [29] utilized the Shapley model to evaluate risk and distribute total profits among distributed energy subjects, considering both day-ahead and real-time markets. Qiong Wu et al. [30] designed a fair and rational cost-sharing mechanism for Renewable Integrated Energy Systems (RIES), taking into account the network relationships among stakeholders. Building upon this foundation, they conducted a benefit–cost (B/C) analysis for each stakeholder to assess commercial viability. Chen Ran et al. [31] employed various methods rooted in coalition game theory, such as proportional allocation, kernel allocation, Shapley value, and bargaining allocation, to allocate benefits among households engaged in cooperative electricity consumption. Similar to previous methods, this method ignores risk variability and other subject characteristics. Referring to the aforementioned, using the customary Shapley value method as a foundation, several scholars have suggested a cooperative evaluation criterion that centers on reward and penalty frameworks [32]. Consequentially, an allocation model was created, determining benefits based on the genuine weight of distributed resources’ output, along with preassigned rewards and penalties. However, the use of specific gravity parameters within the technique can be inherently subjective during parameter adjustment [33]. Conversely, a distribution model for benefits has been proposed that is based on negotiation game theory and employs utility functions to reflect the subject’s risk tendencies. The model, relying upon bargaining power levels, ensures that factors such as the marginal input of the subject, intermittent generation subjects’ projection capacity, and the equilibrium market’s penalty framework are systematically considered, thereby providing an effective and feasible solution to distributed resource cooperation benefits allocation. Qin Ting et al. [34] adopted bargaining game theory to quantify the degree of risk aversion via a utility function that reflects risk aversion levels, considering marginal contributions, the forecasting capacity of intermittent power sources, the penalty strength of equilibrium market levels, and the bargaining power of stakeholders. Subsequently, they established a revenue allocation model for the joint participation of distributed energy resources (DERs) in the short-term energy market. However, the model presupposes the rationality of trading individuals and is rooted in Nash bargaining theory, thus containing limitations for real-life market information constraints and restricted subject decision-making scenarios scrutinized in this research.
Due to distributed energy’s complex nature involving numerous participants, maintaining a stable balance of interests is of paramount importance. When contemplating benefit allocation in distributed energy systems, a comprehensive examination of various factors is imperative. Such factors encompass energy prices, production costs, operating expenditures, economic considerations, social policies and regulations, environmental matters, and social justice prerogatives. Diversity in approaches can be employed to attain an optimal distribution of benefits, including cost-based, contribution-based, and demand-based techniques.
The general Shapley value model fails to fully reflect the differences in the influences of stakeholders in distributed energy systems. Distributed energy systems are cooperative games, and different stakeholders play important roles in the operation and market transactions of the system. This study aims to explore the trading behaviors and value contributions of relevant stakeholders in regional distributed energy systems, taking into account their risk preferences, profit contributions, and predictive levels during transactions. Based on the initial Shapley value allocation plan, this study employs the CIRTIC anti-entropy weight Cloud model to modify the Shapley value method’s profit allocation plan. This method provides an auxiliary decision-making tool for aggregators of regional distributed energy systems in solving the actual interest allocation problems of stakeholders. The process can be summarized as follows:
  • Analyzing the characteristics of distributed energy systems and identifying the core subjects such as micro-combustion engines, wind power, and photovoltaic systems. Developing core indicators, including risk level, profit contribution, and forecast level, which are known to influence benefit distribution, based on the characteristics of these subjects.
  • Examining the calculation process of the traditional Shapley value model and its application to the initial benefit allocation scheme of the distributed energy system. This analysis provides a theoretical foundation for enhancing the Shapley value model and serves as the basis for the final allocation scheme data.
  • Utilizing a combination of inverse entropy weighting and critic to determine the weights of different subjects under various indicators, as defined by the structure of the benefit allocation index system. This step provides a foundation for optimizing the three-dimensional cloud model at the cloud center.
  • Constructing a three-dimensional cloud model and employing the comprehensive weights obtained in the previous step to adjust the center of gravity, resulting in weighted deviations of the three-dimensional comprehensive cloud.
  • Incorporating the weighted deviations of the three-dimensional integrated cloud into the Shapley model and recalculating the Shapley results to obtain the final benefit distribution outcomes.
  • To validate the effectiveness of the proposed model, this study compares the initial benefit allocation results with the revised final benefit allocation results. Furthermore, a sensitivity analysis is conducted to examine the impact of varying indicator weights, confirming the robustness of the proposed model. Lastly, the Propensity to Disrupt (PTD) method is employed to assess the stability of the allocation scheme for different subjects. The research framework of this chapter is illustrated in Figure 1.
The objective of this paper is to analyze the factors that influence the distribution of benefits among multiple stakeholders in distributed energy systems and to formulate a fair and rational benefit distribution scheme for such systems in China. The study focuses on a benefit distribution model that takes into account various impact indicators on multiple entities, and introduces several notable innovations as outlined below.
Firstly, after conducting an analysis of both internal and external scenarios of distributed energy systems, we propose a comprehensive set of indicators that influence these systems. These indicators serve not only as a means of assessing benefit distribution but also as evaluative measures of the operational capacity of the stakeholders involved.
Secondly, we introduce a novel benefit distribution model, the CIRTIC inverse entropy method Cloud–Shapley model, which builds upon the traditional Shapley value-based approach. This model effectively adjusts the weights associated with the conventional Shapley model, thereby enhancing the scientific and rational nature of benefit allocation.
Finally, we apply the proposed benefit distribution model to micro-generators, wind power, and photovoltaic systems within distributed energy systems, and perform a sensitivity analysis. The results demonstrate that different indicators exert varying effects on the allocation of benefits among different stakeholders, thereby validating the efficacy of the proposed benefit allocation model.

2. Basic Elements of Income Distribution in Distributed Energy System

The structure of components within a distributed energy system is intricate. The construction of distributed energy systems in various regions of China demonstrates a differentiated development; as such, a unified system framework has yet to develop. For this research, gas units, wind power, and photovoltaic systems serve as objects of benefit allocation analysis based on the basic elements of distributed energy systems. This study explores three indicators that impact the allocation of distributed energy systems.

2.1. Subject of Benefit Distribution

Gas-fired. Gas-fired units are a crucial energy supply resource for distributed energy systems and serve as a regulating agent for such systems. The inclusion of a significant amount of distributed energy in the composition of these systems results in an inherent level of uncertainty in the energy supply. The utilization of gas-fired units within these systems is vital to ensuring the basic energy demands are met, while simultaneously providing regulation to balance the supply and demand of the system, especially during times of significant fluctuation in the distributed energy. This regulation not only serves to enhance the resilience of the system but also improves the overall safety and stability of the distributed system.
Wind power and photovoltaics. Wind power and photovoltaics are capable of meeting China’s dual-carbon targets very well, and are also requirements for the construction of future new power systems. Therefore, addressing the issue of benefit distribution and development of wind power in distributed systems is in line with the sustainable development requirements of wind power and photovoltaics. The PVs in distributed energy systems mainly refer to rooftop PVs and distributed PVs. In this study, to address the issue of benefit distribution for PVs, it is assumed that rooftop and distributed PVs are under the same investment entity.

2.2. Benefit Distribution Impact Indicators

Uncertainty exists in the operation of distributed energy systems, resulting in differential stakeholder roles. Profit alone cannot determine benefit distribution, thus rendering the traditional profit-sharing model unsuitable. China’s power spot market is developing, allowing distributed energy to participate as an independent market entity. System operation is now influenced not only by internal operating models but also by market demand. This paper identifies key factors that influence benefit sharing among multiple stakeholders within distributed energy systems, which are outlined below based on an analysis of factors affecting benefit distribution by scholars and experts.
Risk level is a significant factor in determining the distribution of benefits within a distributed energy system. Equipment operation affects the safe functioning of the system, particularly in market environments. Adjusting system operation promptly for stable functioning and maximal profit leads to changes in the operating income of different equipment, thereby necessitating the inclusion of risk as a factor. As such, this paper selects risk as one of the influential factors in benefit distribution.
The profit contribution reflects the economic benefits of stakeholders. Distributed energy systems are not only a physical system but also an economic system. Therefore, how to reduce costs and increase returns is an important goal for the development of distributed energy systems. The distribution of benefits among stakeholders is a prerequisite for the development of the system, and each stakeholder can receive benefits from the system. As a result, profit contribution becomes an economic value representation of the distribution of benefits among stakeholders.
Forecasting is critical to players operating in the spot market, in which timely and precise evaluations of market trends inform judicious trading strategies. This is particularly relevant to distributed energy systems that heavily rely on wind power, photovoltaics, and other forms of distributed energy. The level of forecasting proficiency directly influences the accuracy of trading strategies, which has a significant impact on the healthy and sustainable evolution of these systems.

3. Benefit Distribution Model Based on the CIRTIC Anti-Entropy Weighting Method Cloud–Shapley Values

The Shapley value method for distribution can effectively promote market transaction enthusiasm among system participants while avoiding equalitarianism in distribution. Nevertheless, the income distribution based on Shapley value solely relies on the contribution of members, assuming that their impact on income risk is uniform. The paper, therefore, focuses on introducing risk level, profit contribution, and prediction ability to modify Shapley based on CIRTIC anti-entropy weight method Cloud model. This modification can consider the contribution level of various units in the regional distributed energy system during the transaction.

3.1. Initial Income Distribution Model Based on Shapley Value Theory

The allocation of benefits in regional distributed energy systems involves a dynamic interplay of cooperation and competition among the distributed power sources and gas turbines. Assuming a set of n stakeholders I = {1, 2, 3,..., n} in the regional distributed energy system, the subsets of I containing stakeholder i are represented by s, and  V ( s )  is the characteristic function that describes the profit of subset s in market transactions.  V ( s / i )  represents the profit obtained after excluding stakeholder i from participating in the transactions. Notably,  V ( s )  must satisfy the following conditions:
  • When the regional distributed energy system is involved in main grid trading, there are no benefits to be gained from cooperation among the interested parties, as indicated by V( ) = 0.
  • The inequality  V ( s 1 s 2 ) V ( s 1 ) + V ( s 2 )  holds true for any pair  s 1 , s 2 I  where  s 1 s 2 ϕ , signifying that the benefits of collaborative shareholder efforts surpass those of individual transactions.
  • V ( I ) i = 1 n V ( { i } )  has the equivalent meaning as b.
Given set I φ i ( V )  represents the income distribution acquired by the interest subject i, along with the distribution scheme  φ ( V ) = ( φ 1 ( V ) , φ 2 ( V ) , φ n ( V ) ) . If  φ i V  meets the aforementioned three standards, the stakeholders’ distribution scheme in the regional distributed energy system obtains a distinctive Shapley value, as represented by the Formulas (1) and (2).
φ i ( V ) = s s i W i · [ V ( s ) V ( s / i ) ]
W i = ( n s ) ! ( s 1 ) ! n !
Let a denote the distribution income of member  φ i ( V ) s i  be the set of all subsets within i s  signify the number of participants in a subset s W i  is the weighting factor representing the likelihood of subset s appearing, and  V ( s ) V ( s / i )  denote the member i’s marginal contribution to the income of subset s.

3.2. A Shapley-Valued Benefit Allocation Model Based on an Improved Cloud Centre of Gravity

3.2.1. Anti-Entropy Weight Method CIRTIC Correction Index Weight

The index’s weight value has a bearing on the ultimate weight of each member. This paper proposes the anti-entropy weight method and the CIRTIC model, which modify the index’s weight to guarantee rationality at the index level.
(1)
Anti-EWM
(a) A panel of experts score the factors that impact the allocation of benefits on a relative factor scale, which is then normalized to produce a judgement matrix [35].
A = [ x 11 x 1 n x m 1 x m n ]
The variable  x i j  represents the degree of importance of the i-th factor in relation to the j-th factor.
(b) Compute weight  ρ i j  of indicator  x i j  for the i-th participant considering indicator j.
ρ i j = x i j i = 1 m x i j
(c) Equation (5) depicts the entropy values of various factors that can be determined based on  ρ i j .
e i = i = 1 n ρ i j l n ( 1 ρ i j )
(d) Equation (6) can be used to calculate the weights of influencing factors based on  w i .
w i = e i i = 1 e i
The weight coefficients of various factors can be obtained using the formula mentioned above.
(2)
CIRTIC
The entropy weight method emphasizes the degree of differentiation of indicators but overlooks the important importance of the indicators themselves. Therefore, sometimes there may be significant differences between the expected results and the actual results when determining the weight. In order to solve this problem, this paper introduces the CRITIC model to perform comprehensive weighting. CRITIC is an objective weighting method, and its weight is mainly based on the comparative strength and conflict between indicators. The contrast intensity of the index enables calculation of the value gap of different schemes under the same index by assessing the difference [36]. The conflict of indicators denotes the correlation between qualitative changes, either positive or negative. While the conflict of CRITIC takes the form of difference, we note that every index utilized in this study has significant difference and negative correlation, and thus a single difference cannot fully reflect the difference of related factors. To address this limitation, this paper applies the coefficient of variation in place of difference to express the contrast intensity of indicators, adhering to the basic principle of CRITIC.
C v j = δ ( j ) μ ( j )
The formula expresses interest factors for subject j by using the difference coefficient  C v ( j ) , the difference of the influencing factors of the j subjects  δ ( j ) , and the average value  μ ( j )  of the influencing factors of interest. The information quantity of these influencing factors can be expressed as:
C j = C v j i n ( 1 r i j )
In the formula,  C j  represents the amount of information stored in the subject interest influencing factor j, and  r i j  represents the correlation between the subject interest influencing factor i and subject interest influencing factor j.
In Formulas (1)–(4),  W j  is the weight of the j-th subject interest influencing factor.
w j = C j j = 1 m C j
This paper builds the index weight by considering the weight of each subject’s interest influencing factors and the index weight of the interest factors.
w = w i × w j i = 1 , j = 1 n w i × w j

3.2.2. Modified Shapley Value of Cloud Barycenter Model

The Cloud model is an information processing framework that uses fuzzy theory and probability theory to transform uncertain qualitative data into numerical data. The model helps to reduce ambiguity and improve decision-making processes. The strengths of the Cloud model are its ability to manage both randomness and uncertainty, making it an essential tool for solving complex and practical problems [37]. In the Cloud model, a ‘cloud’ is defined as follows: For a universe U and a qualitative concept A in the universe U, let  μ x [ 0,1 ]  be the membership function of a quantitative value  x U , x in A which is a random variable ( U 0,1 , x U , x μ ( x ) ) with stable tendencies. The membership degree of a certain quantitative value x in the universe U to A is one-to-many mapping, where x is a random realization of the qualitative concept A. If  x ~ N ( E x , E n 2 ) , where  E n ~ ( E n , H e 2 ) , and the membership degree of A satisfies the Formula (11), then the distribution on the universe U obeys the normal cloud distribution.
μ x = e x E x 2 2 E n 2
The transformation from qualitative to quantitative data is achieved by the formation of cloud droplets represented by x. The combination of n cloud droplets forms the normal cloud model that expresses the qualitative concept in three numerical features: Expectation (Ex), Entropy (En), and Hyper-Entropy (He). The transformation to quantitative values can be entirely represented by the cloud generator, allowing for the integration of both ambiguity and randomness in the concept seamlessly.
The Ex represents the central tendency of a membership cloud and reflects the hierarchy of the subject’s revenue allocation indicators. The bounds of each indicator rank of the revenue distribution are defined as the double-constraint space  [ c m i n , c m a x ] , and boundary parameters are expressed as ascending and descending half-normal clouds that account for the randomness and ambiguity of the revenue distribution indicator rank boundary information. Equation (12) shows the formula that can be used to calculate the Ex.
E x j = c m i n + c m a x 2 ( 1 j m )
where the left and right boundaries are not defined, appropriate extensions are made.
The En presents a mathematical formulation for quantifying the level of uncertainty inherent in the indicator concept, thereby capturing the stochastic nature of the indicator data when assessing the trading capacity of the primary entity in the regional energy system. This characteristic aptly depicts the indeterminacy and stochasticity of the grading boundary in the evaluation procedure. Meanwhile, the He objectively delineates the extent of correlation between the vagueness and randomness of each assessment index. A pictorial depiction of these notions is illustrated in Figure 2.
Figure 2 encompasses three constituents: Ex, En, and He. Ex signifies the centroid of the cloud droplet assemblage, embodying the level of conceptual cohesion within said assemblage. En delineates the granularity of the cloud, signifying the interplay between ambiguity and randomness, whilst capturing the permissible range of concept elements and their representative probabilities. He epitomizes the unity of uncertainty inherent in the linguistic values depicted by all points in the numerical field space, i.e., the cohesiveness of the cloud droplets. Furthermore, the size of the hyper-digit obliquely characterizes the dispersion and density of the cloud. Within the conceptual domain, each datum confers its distinctive contribution to concept formulation, and the extent of this contribution is gauged by the potential in the concept space of the cloud droplet population. The magnitude of this potential hinges upon both the location and the radial luminosity of the cloud droplets. Greater radiance engenders a heightened influence of its data energy.
The cloud center of gravity approach is an innovative assessment methodology rooted in cloud theory, that epitomizes the transformation of uncertainty from qualitative to quantitative aspects. This approach effectively addresses the ambiguity and randomness inherent in decision-making, whilst also mitigating the potential for strong subjectivity. By employing the cloud model, the cloud center of gravity is determined by the combined center of gravity position and height. Specifically, a represents the expected value Ex, which is the center of gravity position of a normal cloud, and b is the cloud center of gravity height. Hence, the cloud center of gravity can be mathematically expressed as T = a × b. The construction of a Shapley-valued benefit allocation model based on the cloud center of gravity follows the ensuing steps:
Step one: Develop a cloud model depicting each influencing factor.
The regional distributed energy system power trading revenue distribution model is structured based on three factors, namely risk sharing, profit contribution, and forecast level, to develop a cloud model. Equations (13) and (14) display the expected value of the cloud model and the cloud entropy value of each indicator, respectively.
E x = ( E x 1 + E x 2 + + E x m ) / m
E n = [ m a x ( E x 1 , E x 2 , , E x m ) m i n ( E x 1 , E x 2 , , E x m ) ] / 6
where m is the number of experts invited.
Step two: Building a three-dimensional integrated cloud.
Constructing a three-dimensional integrated cloud model can represent the three indicators. The cloud center of gravity changes in response to changes in the shape and position of the integrated cloud. Hence, the shift in the cloud center of gravity can indicate the system’s state. The vector T = ( T 1 , T 2 , T 3 ) represents the three-dimensional cloud center of gravity, where  T i = a i × b i , i = 1, 2, 3 and  a i  represents the cloud model expectation of the i-th index, while  b i  denotes the normalized weight of the i-th index.
Step three: Determining the weight of each indicator.
This paper uses the comprehensive weight derived from the inverse entropy weight method CIRTIC model, represented by Formula (10), as the index weight coefficient.
Step four: Determine the weighted deviation of the three-dimensional integrated cloud.
The weighted deviation degree (−1 < θ < 0) of the three-dimensional comprehensive cloud in varying environments represents the degree of difference between the index cloud model and the ideal comprehensive cloud model. As the θ value increases, the deviation from the ideal comprehensive cloud becomes greater. The ideal comprehensive cloud state signifies a state in a particular regional distributed energy system with the highest risk, the highest profit contribution, and the highest prediction level. Equation (15) displays the cloud center of gravity for the state.
T 0 = a × b = ( T 1 0 , T 2 0 , T 3 0 )
Formula  a  represents the expected value of each index for the ideal state. Equation (16) displays the calculations for the vectors  T G = ( T 1 G , T 2 G , T 3 G )  and  T G , which are based on normalizing the center of gravity vector T of the three-dimensional integrated cloud.
T G = T i T i 0 T i 0 T i < T i 0 T i T i 0 T T i T i 0 i = 1 , 2 , 3
The weighted deviation θ can be expressed as Equation (17).
θ = i = 1 n ( ω i * T i G )
Step five: Calculation of the revised value of benefits for each stakeholder in the regional energy system.
By normalizing the θ of each stakeholder and applying the CIRTIC anti-entropy weight method Cloud model, we can obtain the weight  θ *  of each member. The Formulas (18) and (19) indicate the income correction value  φ i ( V )  of each stakeholder in the regional distributed energy system.
φ i ( V ) = V ( n ) × M i
M i = 1 n + θ *
Formula  M i  represents the adjusted weight of benefits for each stakeholder, while  V ( n )  depicts the maximum benefit obtained by trading the regional distributed energy system with the main grid.
Step six: Calculate the actual income of each subject.
The actual benefits allocated to each stakeholder are therefore Equation (20).
φ i ( V ) * = φ i ( V ) + φ i ( V )

3.3. Stability Evaluation of Allocation Results

The Propensity to Disrupt (PTD) method is commonly applied to quantitatively evaluate the stability of cooperative game solutions. It represents the proportion of the alliances’ loss to the member i’s loss suffered by member i leaving the alliance under a specific allocation [38]:
x i = φ i ( V ) * i = 1 n φ i ( V ) *
P T D i = m i x m φ ( C { i } ) x i φ i ( V ) *
where  P T D i  is the propensity to disrupt member i under a specific allocation;  x i  is the income obtained from the allocation of member i in the alliance;  φ i ( V ) *  is the income obtained when member i implements a single operation; and  φ ( C { i } )  is the total income of the alliance that lost member i.
The higher the PTD of various energy equipment in a distributed energy system, the lower the profit of energy equipment compared to the contribution of the entire alliance, implying that the greater the possibility of leaving the alliance, the lower the PTD, and the greater the willingness to cooperate or stay in the alliance. This demonstrates the ability of various energy equipment in the system to negotiate. Energy equipment with a higher PTD value has greater bargaining power than equipment with a lower PTD value. Despite the fact that the PTD of all energy equipment in a distributed energy system is extremely near in a distribution scheme, all relevant stakeholders are prepared to accept the equitable sharing of cooperative advantages.

4. Simulation Analysis

4.1. Benefit Distribution Results of Conventional Shapley Value

In this paper, we consolidate the existing literature [39] and conduct a simulation analysis to validate the efficacy of the enhanced Shapley value method. To illustrate our approach, we employ a distributed energy system featuring scenic and combustion elements. Specifically, the micro-gas turbine has a capacity of 4 MW, the wind turbine has a capacity of 10 MW, and the low carbon community incorporates 2 MW of rooftop PVs. For precise technical specifications of each component, please refer to Table 1.
Building upon the findings of prior research, we postulated a peak electrical load demand of 10 MW, a maximum thermal load of 4 MW, and a maximum cooling load of 2.5 MW. By adhering to the principles of supply–demand equilibrium and cost optimization, the distributed energy system can exhibit both independent and collaborative operations during market transactions. These distinct operational modes yield varying advantages, which we elucidate in greater detail below.
Let N = {1, 2, 3} represent the stakeholders in the electricity transaction, consisting of a subset s{ },  s { 1 } s { 2 } s { 3 } s { 1 { 2 } s { 1 , 3 } s { 2 , 3 } s { 1 , 2 , 3 } . The 1–3 distribution contains the main body of gas turbines, wind power, and photovoltaic sectors. Table 2 displays the benefits of the independent and joint participation of stakeholders in the regional energy system.
The data presented in Table 2 illustrate the financial outcomes when the micro-gas turbine, wind power, and photovoltaic systems operate independently. In this scenario, the system’s total operational revenue amounts to CNY 19,400. However, when these entities collaborate, the system’s total operational revenue significantly increases to CNY 26,800, resulting in a substantial income appreciation of CNY 7400. This observation underscores the advantageous nature of cooperative operations among the system’s key components. It is important to note that the benefits derived from collaboration among different entities are not uniformly distributed, emphasizing the distinct roles played by each entity within the system and the consequent need for a non-uniform benefit sharing mechanism.
Table 3, Table 4 and Table 5 illustrate the results of using the Shapley value method to calculate the initial revenue allocation for the subjects in the system.
After analyzing Table 3, it is apparent that the value-added benefits of micro-gas turbines are subject to fluctuations based on distinct alliance models. Employing the appropriate formula, one can calculate the preliminary benefit distribution value for micro-gas turbines, which yields  φ 1 ( V ) = 0 .9183 million. The outcomes of this study demonstrate that the advantages garnered from the micro-gas turbine and photovoltaic (PV) alliance surpass those of the wind alliance. This observation suggests that micro-gas turbines and PVs possess greater synergism, playing a pivotal role in augmenting the system’s productivity and profitability.
Table 4 shows that the value added by wind power varies depending on different alliance scenarios due to fluctuations, and its initial return distribution value of y = 0.8533 million can be computed using the formula. The findings indicate that the disparity between wind power and the other two primary alliances is not particularly pronounced.
Table 5 reveals that PV’s value added varies under distinct alliance scenarios due to fluctuations, and its initial return distribution value of y = 0.9083 million can be computed using the formula. The Shapley values’ original allocation ratios for micro-combustion, wind, and PVs were 0.343, 0.318, and 0.339, respectively.
Thus, the advantages of regionalized distributed energy systems participating in power trading satisfy the following conditions:
φ 1 ( V ) > V ( 1 ) φ 2 ( V ) > V ( 2 ) φ 3 ( V ) > V ( 3 ) φ 1 ( V ) + φ 2 ( V ) > V ( 1 2 ) φ 1 ( V ) + φ 3 ( V ) > V ( 1 3 ) φ 2 ( V ) + φ 3 ( V ) > V ( 2 3 ) φ 1 ( V ) + φ 2 ( V ) + φ 3 ( V ) = 2.6799 V ( 1 ) + V ( 2 ) + V ( 3 ) = 1.94
It is evident that when the revenue obtained by participants through the regional energy system operator participating in transactions with the main grid exceeds the total revenue from independent participation, and the revenue allocated by both parties through transactions with the system is greater than the sum of their independent transaction revenues, it can encourage participation in distributed energy system transactions.

4.2. Profit Distribution Results Based on Revised Shapley Value

Using the modified Shapley value method, the calculation of modified revenue coefficients is necessary for participants in micro-combustion engines, wind power, and photovoltaics within the regional distributed energy system. The judgment of experts’ ideal states regarding the indicators for revenue distribution in regional power trading can be obtained by evaluating the contribution to profits and level of forecasting for each participant in the system’s main network trading. We can establish the cloud model’s expectation and entropy for each micro-combustion engine indicator and obtain it according to Equations (13) and (14), as shown in Table 6.
Utilizing both CIRTIC and the inverse entropy weighting method, we were able to calculate the weight  ω i  of every influencing factor, which amounted to (0.272, 0.424, 0.304). From here, we determined the centre of gravity of the three-dimensional cloud for the micro-combustion engine  T , which was (0.100, 0.224, 0.074), while the centre of gravity for the ideal three-dimensional integrated cloud is represented by  T 0 = ( 0.272 , 0.424 , 0.304 ) . To normalize the three-dimensional integrated cloud using the Formula (16), we arrived at  T G = ( 0.6313 , 0.4725 , 0.75625 )  and found the deviation of the micro-combustion engine’s three-dimensional integrated cloud from the ideal cloud to be  θ =  0.6019. Similarly, we gathered expert judgments for every index of wind power and the photovoltaic main body and recorded them in Table 7 and Table 8.
In a similar manner to the aforementioned process, we calculated the three-dimensional cloud center of gravity for the wind power system ( T ) to be (0.166, 0.118, 0.155). By adopting Formula (16), we were able to normalize the three-dimensional comprehensive cloud and obtain  T G = ( 0.6188 , 0.48375 , 0.5375 ) , from which we concluded that the deviation degree ( θ ) between the comprehensive cloud and the ideal cloud was −0.561.
We can obtain the three-dimensional cloud center of gravity for the photovoltaic main body in a similar manner, which is  T = ( 0.196 , 0.203 , 0.121 )  and  T G = ( 0.4 94 , 0.4 75 , 0.4625 ) , with a deviation degree ( θ ) between the three-dimensional comprehensive cloud of the photovoltaic system and the ideal cloud of −0.479.
By weighting deviations, we can normalize these data and obtain the deviation for the micro-gas turbine, wind power, and photovoltaic systems. Specifically, we arrived at  θ 1 *  = 0.367,  θ 2 *  = 0.341 and  θ 3 *  = 0.292. Lastly, the Shapley-corrected income distribution result of the corrected cloud gravity center was obtained using the Formula (20), and it is presented in Table 9.
Consequently, the initial allocation for micro-turbines, wind power, and photovoltaics amounted to 9183 CNY, 8533 CNY, and 9083 CNY, respectively. However, their revised actual distribution income stood at 9410 CNY, 8580 CNY, and 8810 CNY, respectively. Notably, the final distribution income of micro-turbines experienced an increase of 227 CNY, while wind power observed a marginal increase of 47 CNY, and photovoltaic encountered a decrease of 273 CNY. These outcomes demonstrate that by considering not only the individual subject’s profit contribution but also the selected risk level, profit contribution, and predictive capability, as showcased in this study, a more comprehensive assessment of each subject’s value within the system’s operations can be achieved. Moreover, this distribution pattern aligns harmoniously with the multi-energy complementary attributes inherent in distributed energy systems..

4.3. Result Analysis

Based on the aforementioned measurements, when multiple subjects within a regional distributed energy system operate individually, the returns obtained from both the traditional Shapley value and the improved Shapley value are consistent. Micro-gas turbines yield the highest returns, followed by photovoltaics, while wind power generates the lowest returns. This observation validates the efficacy of the proposed model in accurately reflecting the actual returns of each subject within the distributed energy system. Furthermore, the returns derived from the regional distributed energy self-consumption residual feed-in model surpass those obtained from independent participation in transactions.
After applying the modified Shapley value method to distribute the benefits among the subjects, the gas turbine units experienced an increase of approximately 220 CNY in their benefits compared to the traditional Shapley value distribution method. Similarly, the wind turbine subjects observed a 50 CNY increase, while the PV subjects encountered a slight decrease of 270 CNY in their benefits. This improved allocation scheme not only aligns with the correction factor but also better showcases the pivotal role played by gas turbine units in the trading dynamics of distributed energy systems.
Analyzing the results of the benefit sharing ratios obtained from the traditional Shapley values and the improved Shapley values, we observe minimal changes in the allocation ratio for wind power before and after the improvements. Conversely, there are more significant changes in the allocation ratios for micro-gas turbines and PVs. This discrepancy arises due to the higher level of risk and forecasting involved in the case of PVs. Furthermore, when micro-gas turbines choose to form an alliance with PVs, they generate greater benefits compared to wind power. This realistic linkage results in more reasonable allocation outcomes.
For a comprehensive comparison of the allocated benefits received by participating main grid trading entities within the regional distributed energy system, please refer to Table 10 and Figure 3.
In Figure 3, green represents the revenue of three independent agents. The income distribution of three agents under Shapley value is shown in brown, while the income distribution of three agents under improved Shapley value is shown in purple.The results show that the cloud center of gravity method evaluated three benefit allocation indicators of gas-fired units, wind power subjects, and photovoltaic subjects in power trading. The evaluation was carried out in terms of the risk coefficient, profit contribution, and forecasting ability of the subjects. The method was also used to determine the correction factors. The correction factors were then used to revise the initial Shapley value allocation scheme. The revised allocation scheme integrates various benefit allocation influencing factors, which reasonably reflect the value of the subjects in trading.

4.4. Sensitivity Analysis

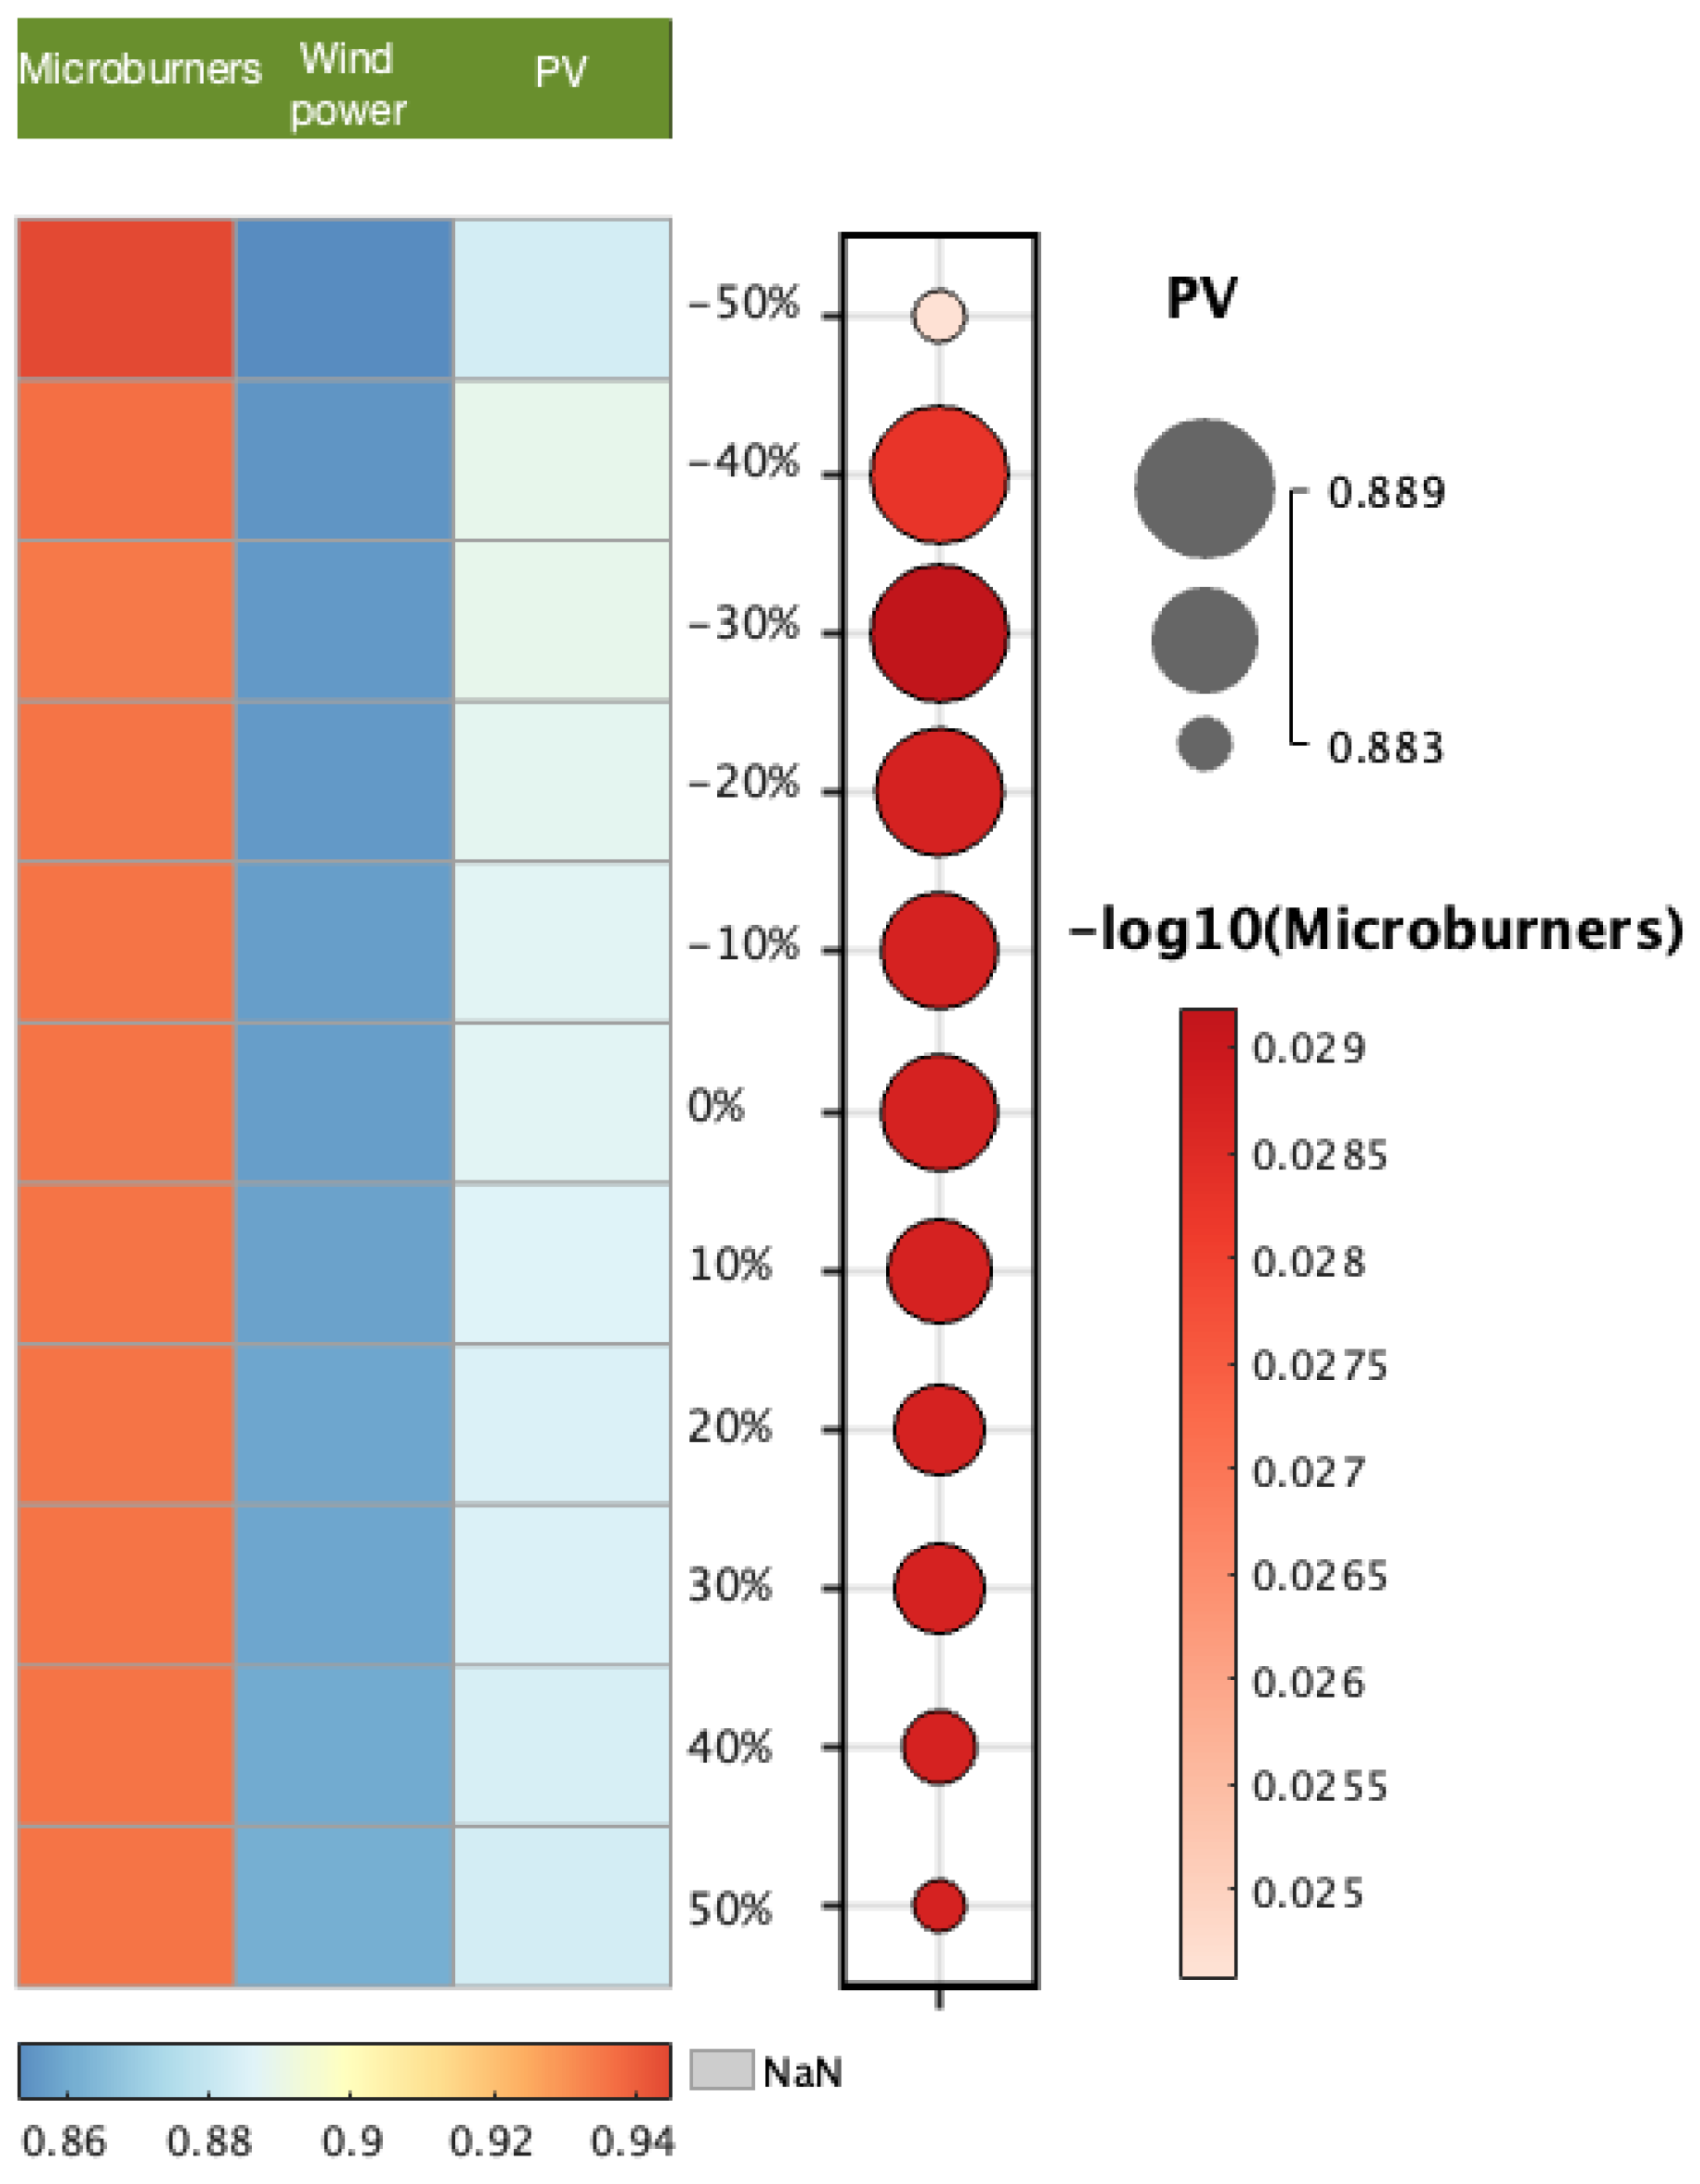
To verify the model’s robustness and assess the impact of revenue allocation influencing factors’ weighting on the allocation results, we varied the weighting of the risk factors, profit contribution, and forecast level by ±50%. We then calculated the variation in revenue allocation for microburners, wind power, and PV subjects, respectively. The presented results illustrate the variation in revenue allocation for the regional distributed resource system subject with different influence factor weights, as shown in Figure 4, Figure 5 and Figure 6.
The structure of Figure 4, Figure 5 and Figure 6 includes a matrix diagram on the left side, representing the change in income distribution and the interval for the three subjects with changes in the index weight. Meanwhile, the bubble diagram on the right side demonstrates the change trend of the log for micro-gas turbines with variations in the index weight. Additionally, the upper right corner displays the maximum and minimum interval of photovoltaic income.
Figure 4 portrays the dynamics of benefit allocation among the entities as the risk indicator undergoes variations. The shifting colors of the indicators on the left side reveal the gradual decline in benefit sharing for the micro-combustion engine as the risk indicator spans from −50% to 50%. Notably, the rate of decline is more pronounced within the −50% to −40% range, followed by a deceleration in the pace of change. Meanwhile, within the −50% to −20% range, the wind power entity experiences a gradual increase in benefit sharing, albeit at a diminishing rate. Additionally, as the risk indicator increases, the risk associated with the benefits received by PV entities gradually escalates, demonstrating the disparate impact of risk factors on each entity. This phenomenon is primarily driven by the diminishing system regulation capacity of the micro-combustion engine as the risk decreases, leading to a reduction in the benefits it receives. Moreover, the legend on the right side reveals maximum variations of 90 CNY, 80 CNY, and 60 CNY for gas turbines, wind power, and PV, respectively. These variations reflect the distinct perceptions of risk levels and the consequent adjustments in benefit allocation for each subject.
According to Figure 5, the allocation of benefits among different entities undergoes transformations as the profit contribution indicator fluctuates. The left side of the graph reveals a varying downward trajectory in benefit gains for micro-combustion and wind power as the profit contribution indicator increases, while PVs demonstrate an upward trend. These observations align with the earlier analysis on the benefits derived from the micro-combustion alliance. Moreover, the disparity in benefit distribution between micro-combustion, wind power, and PV amounts to CNY 0.0106, CNY 0.0021, and CNY 0.0126, respectively, highlighting that the fluctuation in profit contribution has the most profound impact on PVs.
Figure 6 illustrates the shifting distribution of benefits among different subjects in response to forecast levels. It is evident from the figure that as the forecast level increases from −50% to 50%, the benefit allocation for micro-combustion turbines displays a fluctuating upward trajectory, whereas both wind and PVs experience a decline in benefit distribution. This pattern primarily arises due to the inherent volatility of wind and PVs, which can compromise the system’s operational stability, necessitating the support of micro-combustion turbines to maintain the supply–demand equilibrium. Furthermore, the benefit allocations for micro-combustion, wind, and PVs are subject to forecast levels, with a maximum impact of 130 CNY, 60 CNY, and 60 CNY, respectively.
The results illustrate that when the index weight of the influencing factors changes within the range of positive and negative 50%, the income distribution of different subjects changes slightly, proving the robustness of the improved model. When the weight of the risk coefficient index changes by the same amount, the impact on income distribution within microburners, wind power, and photovoltaic subjects is 90 CNY, 80 CNY, and 60 CNY, respectively. Similarly, a weight adjustment of the profit contribution level results in changes of 110 CNY, 20 CNY, and 130 CNY, while a change in the prediction level weight results in changes of 130 CNY, 60 CNY, and 60 CNY. The results indicate that the risk level has a greater impact on the benefit distribution of gas turbines than that of wind power and photovoltaic units. The influence of profit contribution on the income distribution of photovoltaics is greater than that of gas turbines and wind turbines. Meanwhile, the prediction level has a greater impact on the income distribution of gas turbines than wind power and photovoltaic entities. The achieved results better reflect the output characteristics of different entities in power transactions and are in line with reality.

4.5. Stability Evaluation of Allocation Results

In this paper, we employ the Propensity to Disrupt (PTD) method to evaluate the stability of the benefit allocation scheme in distributed energy systems. By examining Equation (22), we can compare the stability between the traditional Shapley model and the improved Shapley model for allocation. The improved Shapley model, introduced in this study, reveals smaller PTD values for micro-combustion and PVs compared to wind power. This signifies the substantial contributions of micro-combustion and PVs to the overall alliance, where their departure would result in significant losses to the entire system. Remarkably, micro-combustion engines exhibit the lowest PTD values, indicating their paramount contribution. Hence, in situations where complete coordination among multiple entities is unattainable, it is imperative to ensure the harmonious operation of micro-combustion turbines and PVs within the system. Specifically, micro-combustion turbines play a vital role in regulating system uncertainty stemming from renewable energy sources. Moreover, the contribution of PVs outweighs that of wind power, which does not hold a prominent position within the overall coalition. Therefore, when the system achieves a supply–demand equilibrium, priority can be given to leveraging the synergistic contribution of PVs and microgrids for selling electricity in the external market, thereby gaining additional revenue. Wind power, with its comparatively weaker regulation capability, can compensate for the higher revenue gained by other entities, making it more readily accepted by other facilities involved in joint dispatch. The proposed model yields small and consistent PTD values, indicating a relatively stable benefit allocation scheme that can be applied to various scenarios and different types of equipment. Table 11 presents the PTD values for each entity of interest.

5. Conclusions

A just distribution of benefits plays a vital role in enhancing the enthusiasm of key stakeholders within a regional distributed energy system, thereby fostering its sustainable development. This study focuses on the operational aspects of micro-combustion engines, wind power, and photovoltaics—core components of distributed energy systems. Three critical factors are considered: the risk level, profit contribution, and forecast level of these entities in electricity trading within the regional system. To achieve a reasonable allocation of participation in grid trading revenue, the CIRTIC anti-EWM Cloud–Shapley method is introduced. Through a simulation analysis, the improved model demonstrates a redistribution of revenue in the distributed energy system. Specifically, the final revenue allocation for micro-combustion turbines increases by RMB 227, wind power by RMB 47, and for photovoltaics it decreases by RMB 273—aligning with the actual distribution ratio observed in the system. The model’s enhanced representativeness stems from the inclusion of multiple indicators for adjustment, allowing for a more accurate reflection of the subject’s value within the system. Moreover, variations in indicators exert differential impacts on the allocation ratio of each subject, yet the allocation amounts exhibit relatively minor fluctuations, ranging from a maximum of RMB 106 to a minimum of RMB 21. This underscores the model’s robustness, mitigating subjective biases in allocation and aligning closely with the practical operation of distributed energy systems. The PTD model’s evaluation of the allocation scheme highlights the significant contributions made by micro-combustion turbines and photovoltaics to the system. Their departure from the alliance would result in substantial losses. Conversely, wind power, despite its comparatively smaller contributions, reaps considerable benefits. These findings underscore the potential of multi-subject coalitions in guiding regional distributed energy system operators to enhance trading motivation and promote sustainable system development. In this paper, our current focus lies in the post-operation distribution of benefits within distributed energy systems, utilizing an enhanced Shapley value model. Moving forward, our future plans involve amalgamating optimization models and game models that align with the operational characteristics of distributed energy systems. This integration aims to incorporate the distribution of benefits into the optimization process of distributed energy systems, thus achieving a dual mechanism that optimizes both benefit distribution and energy system operation. The ultimate goal is to attain an optimized distribution and equitable sharing of benefits.

Author Contributions

Conceptualization, J.D. and X.D.; methodology, D.L.; software, X.D. and D.L.; validation, J.D., X.D. and D.L.; formal analysis, X.D.; investigation, D.L.; resources, Y.Z. and P.J.; data curation, A.B.; writing—original draft preparation, X.D.; writing—review and editing, D.W.; visualization, X.D.; supervision, J.D.; project administration, J.D. All authors have read and agreed to the published version of the manuscript.

Funding

This research received no external funding.

Institutional Review Board Statement

Not applicable.

Informed Consent Statement

Not applicable.

Data Availability Statement

Not applicable.

Acknowledgments

The authors would like to thank the library of North China Electric Power University for its literature support.

Conflicts of Interest

The authors declare no conflict of interest.

Nomenclature

A. Abbreviations
RDESRegional distributed energy systemsDERADistributed energy system aggregators
PTDPropensity to Disrupt (PTD) methodEnEntropy
ExExpectationHeHyper-Entropy
B. Indices
ITotal number of stakeholders s The number of different subject alliances in the system
i/j/m/nIndexes of different indicators s cooperation s inthe number of elements
C. Parameters
s i All subsets containing member i V ( s / i ) Obtainable after removing i from cooperation sIncome
φ i ( V ) Income allocated to member i W i Weighting factor
x i j Importance of factors ρ i j Entropy values of different factors
w i The weights of influencing factors δ ( j ) Difference coefficient
μ ( j ) The average value of the influencing factors of the subject’s interests C v ( j ) The difference coefficient
C j The amount of information stored w Comprehensive weight
μ x The distribution on the universe U obeys the normal cloud distribution c m i n c m a x The double-constraint space
T 0 Three-dimensional cloud center of gravity M i The adjusted weight of benefits for each stakeholder
φ i ( V ) * The actual benefits allocated to each stakeholder

References

  1. Shuai, X.; Wang, X.; Wu, X.; Wang, Y.; Song, Z.; Wang, B.; Ma, Z. Peer-to-peer multi-energy distributed trading for interconnected microgrids: A general Nash bargaining approach. Int. J. Electr. Power Energy Syst. 2022, 138, 107892. [Google Scholar] [CrossRef]
  2. Voswinkel, S.; Höckner, J.; Khalid, A.; Weber, C. Sharing congestion management costs among system operators using the Shapley value. Appl. Energy 2022, 317, 119039. [Google Scholar] [CrossRef]
  3. Li, B.; Yang, Q.; Kamwa, I. A Novel Stackelberg-Game-Based Energy Storage Sharing Scheme under Demand Charge. IEEE/CAA J. Autom. Sin. 2023, 10, 1–12. [Google Scholar] [CrossRef]
  4. Wen, J.; Okolo, C.V.; Ugwuoke, I.C.; Kolani, K. Research on influencing factors of renewable energy, energy efficiency, on technological innovation. Does trade, investment and human capital development matter? Energy Policy 2022, 160, 112718. [Google Scholar] [CrossRef]
  5. Yu, X.; Dong, Z.; Zhou, D.; Sang, X.; Chang, C.; Huang, X. Integration of tradable green certificates trading and carbon emissions trading: How will Chinese power industry do? J. Clean. Prod. 2021, 279, 123485. [Google Scholar] [CrossRef]
  6. Karami, M.; Madlener, R. Business models for peer-to-peer energy trading in Germany based on households’ beliefs and preferences. Appl. Energy 2022, 306, 118053. [Google Scholar] [CrossRef]
  7. Andoni, M.; Robu, V.; Couraud, B.; Früh, W.; Norbu, S.; Flynn, D. Analysis of strategic renewable energy, grid and storage capacity investments via Stackelberg-cournot modelling. IEEE Access 2021, 9, 37752–37771. [Google Scholar] [CrossRef]
  8. Safdarian, A.; Divshali, P.H.; Baranauskas, M.; Keski-Koukkari, A.; Kulmala, A. Coalitional game theory based value sharing in energy communities. IEEE Access 2021, 9, 78266–78275. [Google Scholar] [CrossRef]
  9. Wang, N.; Wu, Q.; Ren, H.; Shi, S.; Su, Y.; Lu, J. Multi-Objective Design of Reward Mechanism under Coupling Effects Considering Customer Classification and Demand Response Behavior. Energy Rep. 2023, 9, 11–24. [Google Scholar] [CrossRef]
  10. Zheng, Z.; Sun, Z.; Pan, J.; Luo, X. An integrated smart home energy management model based on a pyramid taxonomy for residential houses with photovoltaic-battery systems. Appl. Energy 2021, 298, 117159. [Google Scholar] [CrossRef]
  11. Good, N.; Ceseña, E.A.M.; Heltorp, C.; Mancarella, P. A transactive energy modelling and assessment framework for demand response business cases in smart distributed multi-energy systems. Energy 2019, 184, 165–179. [Google Scholar] [CrossRef] [Green Version]
  12. Norbu, S.; Couraud, B.; Robu, V.; Andoni, M.; Flynn, D. Modelling the redistribution of benefits from joint investments in community energy projects. Appl. Energy 2021, 287, 116575. [Google Scholar] [CrossRef]
  13. Pressmair, G.; Kapassa, E.; Casado-Mansilla, D.; Borges, C.E.; Themistocleous, M. Overcoming barriers for the adoption of Local Energy and Flexibility Markets: A user-centric and hybrid model. J. Clean. Prod. 2021, 317, 128323. [Google Scholar] [CrossRef] [PubMed]
  14. Ren, H.; Wu, Q.; Zhu, Q.; Gao, W. Cost–benefit analysis of distributed energy systems considering multi-benefits and multi-stakeholders. Energy 2019, 189, 116382. [Google Scholar] [CrossRef]
  15. Wu, Q.; Ren, H.; Gao, W.; Ren, J. Benefit allocation for distributed energy network participants applying game theory based solutions. Energy 2017, 119, 384–391. [Google Scholar] [CrossRef]
  16. Muqeet, H.A.; Shahzad, M.; Shehzad, M.; Akhter, J.; Almohaimeed, Z.M.; Akram, R.; Hussain, M.M. IoT-based intelligent source–load–storage coordination scheme for prosumer campus microgrids. Front. Energy Res. 2022, 10, 960104. [Google Scholar] [CrossRef]
  17. Li, S.; Zhang, L.; Liu, X.; Zhu, C. Collaborative operation optimization and benefit-sharing strategy of rural hybrid renewable energy systems based on a circular economy: A Nash bargaining model. Energy Convers. Manag. 2023, 283, 116918. [Google Scholar] [CrossRef]
  18. Li, J.; Ye, Y.; Papadaskalopoulos, D.; Strbac, G. Computationally efficient pricing and benefit distribution mechanisms for incentivizing stable peer-to-peer energy trading. IEEE Internet Things 2020, 8, 734–749. [Google Scholar] [CrossRef]
  19. Wang, Y.; Cao, Y.; Li, Y.; Jiang, L.; Long, Y.; Deng, Y.; Zhou, Y.; Nakanishi, Y. Modelling and analysis of a two-level incentive mechanism based peer-to-peer energy sharing community. Int. J. Electr. Power Energy Syst. 2021, 133, 107202. [Google Scholar] [CrossRef]
  20. Moniruzzaman, M.; Yassine, A.; Benlamri, R. Blockchain and cooperative game theory for peer-to-peer energy trading in smart grids. Int. J. Electr. Power Energy Syst. 2023, 151, 109111. [Google Scholar] [CrossRef]
  21. Zhou, Y. Energy sharing and trading on a novel spatiotemporal energy network in Guangdong-Hong Kong-Macao Greater Bay Area. Appl. Energy 2022, 318, 119131. [Google Scholar] [CrossRef]
  22. Ma, X.F.; Yu, S.Y.; Zhu, S.J.; Wang, G. Profit distribution of virtual power plants based on multi-factor improved Shapley. J. Electr. Technol. 2020, 35, 585–595. [Google Scholar]
  23. Liu, R.H.; Zhao, Z.K.; Sun, G.P.; Mi, Y.; Pan, Z.N. Optimization strategy and profit distribution of virtual power plant considering different risk preferences. Electr. Power Autom. Equip. 2021, 41, 154–161. [Google Scholar]
  24. Liu, L.Z.; Gong, J.X. Analysis of virtual power plant game model based on improved Shapley algorithm. Electr. Meas. Instrum. 2022, 59, 41–47. [Google Scholar]
  25. Yan, Q.Y.; Yu, Z.H. Research on profit distribution of park distributed integrated energy system based on Shapley value. Shandong Electr. Power Technol. 2020, 47, 25–30. [Google Scholar]
  26. Zhang, L.; Li, S.; Nie, Q.; Hu, Y. A two-stage benefit optimization and multi-participant benefit-sharing strategy for hybrid renewable energy systems in rural areas under carbon trading. Renew. Energy 2022, 189, 744–761. [Google Scholar] [CrossRef]
  27. Liu, S.; Zhang, Z.; Liu, X.; Ren, Y.; Wang, H.; Xue, M.; Wu, Z.; Bie, Z. “Energy Red Packet” Incentive-based Bidding Mechanism and Its Benefit Sharing in the Transactive Energy Market. In Proceedings of the 2021 IEEE 5th Conference on Energy Internet and Energy System Integration (EI2), Taiyuan, China, 22–24 October 2021; pp. 3592–3597. [Google Scholar]
  28. Lu, X.; Zhang, P.; Li, K.; Wang, F.; Li, Z.; Zhen, Z.; Wang, T. Data center aggregators’ optimal bidding and benefit allocation strategy considering the spatiotemporal transfer characteristics. IEEE Trans. Ind. Appl. 2021, 57, 4486–4499. [Google Scholar] [CrossRef]
  29. Dabbagh, S.R.; Sheikh-El-Eslami, M.K. Risk-based profit allocation to DERs integrated with a virtual power plant using cooperative Game theory. Electr. Power Syst. Res. 2015, 121, 368–378. [Google Scholar] [CrossRef]
  30. Wu, Q.; Ren, H.; Shi, S.; Su, Y.; Lu, J.; Li, Q. Research on benefit distribution mode of regional integrated energy system considering both direct and indirect benefits. Energy Rep. 2023, 9, 626–633. [Google Scholar] [CrossRef]
  31. Chen, R.; Wang, R.; Zhao, W.; Sun, H.; Wu, X.; Xie, J. Cooperative benefit allocation for domestic electricity of smart communities based on coalitional game theory. In Proceedings of the 2020 International Conference on Intelligent Computing, Automation and Systems (ICICAS), Chongqing, China, 11–13 December 2020; pp. 185–189. [Google Scholar]
  32. Ceng, H.J. Research on Income Distribution of Each Subject in Electricity Market Based on Modified Shapley Value. Master’s Thesis, Nanchang University, Nanchang, China, 2020. [Google Scholar]
  33. Borges, P.V.D.S.; Da Silva, A.M.L.; Lima, D.A.; Nascimento, L.C. Allocation of Feeder Usage, Losses and Peak Load in Distribution Systems with DG Using Shapley Value. In Proceedings of the 2021 IEEE Madrid PowerTech, Madrid, Spain, 28 June–2 July 2021; pp. 1–6. [Google Scholar]
  34. Qin, T.; Liu, H.D.; Wang, J.Q.; Fang, W.; Feng, Z.Q. An income distribution model of distributed energy cooperation based on bargaining game theory. Power Autom. Equip. 2019, 39, 134–140. [Google Scholar]
  35. Zhang, H.; Han, D.; Liu, Y.; Song, Y.Q.; Yan, Z.; Sun, Q.; Zhang, Y.B. Smart grid evaluation based on anti-entropy weight method. Power Syst. Prot. Control 2012, 40, 24–29. [Google Scholar]
  36. Dong, J.; Dou, X.; Bao, A.; Zhang, Y.; Liu, D. Day-Ahead Spot Market Price Forecast Based on a Hybrid Extreme Learning Machine Technique: A Case Study in China. Sustainability 2022, 14, 7767. [Google Scholar] [CrossRef]
  37. Chen, H.B.; Wang, D.H. Evaluation of urban rail transit cross-line operation effect based on AHP-entropy weight-extension cloud mode. Railw. Transp. Econ. 2023, 45, 118–125. [Google Scholar]
  38. Wang, L.; Li, Y.; Wang, Y.; Guo, J.; Xia, Q.; Tu, Y.; Nie, P. Compensation benefits allocation and stability evaluation of cascade hydropower stations based on Variation Coefficient-Shapley Value Method. J. Hydrol. 2021, 599, 126277. [Google Scholar] [CrossRef]
  39. Dong, J.; Dou, X.; Liu, D.; Bao, A.; Wang, D.; Zhang, Y.; Jiang, P. Energy trading support decision model of distributed energy resources aggregator in day-ahead market considering multi-stakeholder risk preference behaviors. Front. Energy Res. 2023, 11. [Google Scholar] [CrossRef]
Figure 1. Research flowchart of benefits distribution based on improved cloud center of gravity Shapley value.
Sustainability 15 09128 g001
Figure 2. Schematic diagram of cloud characteristics.
Sustainability 15 09128 g002
Figure 3. Benefits distribution comparison with the different models.
Sustainability 15 09128 g003
Figure 4. The impact of risk coefficient weights on benefits distribution of entities.
Sustainability 15 09128 g004
Figure 5. The impact of profit contribution weights on benefits distribution of different entities.
Sustainability 15 09128 g005
Figure 6. The impact of forecast level weights on benefits distribution of different entities.
Sustainability 15 09128 g006
Table 1. Technical and economic parameters.
EquipmentMaximum Output Power (MW)Minimum Output Power (MW)Efficiency (%)Energy Loss Rate (%)Climbing Speed (MW/h)Operation and Maintenance Cost (CNY/MWh)
MT40.40.80.10.6168.5
Wind power100--6120
PV20--1.580
Table 2. The basic revenue scenarios.
StakeholdersRevenue/CNY
{ 1 } 6700
{ 2 } 6100
{ 3 } 6600
{ 1 , 2 } 12,900
{ 1 , 3 } 13,500
{ 2 , 3 } 12,800
{ 1 , 2 , 3 } 26,800
Table 3. Basic revenue distributions of DERS participant—micro-gas turbine.
s 1 {1}{1, 2}{1, 3}{1, 2, 3}
V ( s ) 0.671.291.352.68
V ( s i ) 00.610.661.28
V ( s ) V ( s i ) 0.670.680.691.4
s 1223
W i 1/31/61/61/3
W i · [ V ( s ) V ( s / i ) ] 2/91/91/94/9
Table 4. Basic revenue distributions of DERS participant—wind power.
s 2 {2}{2, 1}{2, 3}{1, 2, 3}
V ( s ) 0.611.291.282.68
V ( s i ) 00.670.661.35
V ( s ) V ( s i ) 0.610.620.621.33
s 1223
W i 1/31/61/61/3
W i · [ V ( s ) V ( s / i ) ] 1/51/91/94/9
Table 5. Basic revenue distributions of DERS participant—solar power.
s 3 {3}{1, 3}{2, 3}{1, 2, 3}
V ( s ) 0.661.351.282.68
V ( s i ) 00.670.611.29
V ( s ) V ( s i ) 0.660.680.671.39
s 1223
W i 1/31/61/61/3
W i · [ V ( s ) V ( s / i ) ] 2/91/91/94/9
Table 6. Ideal states of micro-gas turbo’s revenue distribution indicators.
SpecialistLevel of RiskProfit ContributionPredictive Ability
Specialist10.250.350.275
Specialist20.1750.5150.325
Specialist30.350.5350.15
Specialist40.4750.4750.225
Desired value111
Expectations0.3130.4690.244
Entropy0.0500.0310.029
Table 7. Ideal states of wind power’s revenue distribution indicators.
SpecialistLevel of RiskProfit ContributionPredictive Ability
Specialist10.3250.350.35
Specialist20.2250.5150.5
Specialist30.350.50.4
Specialist40.4250.4750.5
Desired value111
Expectations0.3310.460.4375
Entropy0.0330.02750.025
Table 8. Ideal states of solar power’s revenue distribution indicators.
SpecialistLevel of RiskProfit ContributionPredictive Ability
Specialist10.550.650.25
Specialist20.550.550.325
Specialist30.450.50.425
Specialist40.5750.60.325
Desired value111
Expectations0.5310.5750.33125
Entropy0.0210.0250.029
Table 9. Modified revenues for DERS participants.
Micro-Gas TurbineWind PowerPV
M i 0.0350.008−0.041
φ i ( V ) 0.0220.005−0.027
φ i ( V ) * 0.9410.8580.881
Table 10. Comparison of distribution benefits obtained by different methods.
Independent ParticipationShapley ValueImproved Shapley ValueBased on Shapley Value Benefit Sharing RatioBased on Improved Shapley Value Benefit Sharing Ratio
Microburners0.670.9180.9410.3430.351
Wind power0.610.8530.8580.3180.320
PV0.660.9080.8810.3390.329
Table 11. Stability assessment values for each apportionment scheme.
Method of Distribution of BenefitsPTD
MicroburnersWind PowerPV
Shapley value1.3812.7961.628
Improved Shapley value0.8621.1370.924
Disclaimer/Publisher’s Note: The statements, opinions and data contained in all publications are solely those of the individual author(s) and contributor(s) and not of MDPI and/or the editor(s). MDPI and/or the editor(s) disclaim responsibility for any injury to people or property resulting from any ideas, methods, instructions or products referred to in the content.

