Article

Characterization and Risk Assessment of Different-Origin Biochars Applied in Agricultural Experiments

by
Maria A. Lilli
1,*,
Nikolaos V. Paranychianakis
1,
Konstantinos Lionoudakis
1,
Maria L. Saru
1,
Styliani Voutsadaki
1,
Anna Kritikaki
2,
Konstantinos Komnitsas
2 and
Nikolaos P. Nikolaidis
1
1
School of Chemical and Environmental Engineering, Technical University of Crete, 73100 Chania, Greece
2
School of Mineral Resources Engineering, Technical University of Crete, 73100 Chania, Greece
*
Author to whom correspondence should be addressed.
Sustainability 2023, 15(11), 9036; https://doi.org/10.3390/su15119036
Submission received: 10 May 2023 / Revised: 30 May 2023 / Accepted: 1 June 2023 / Published: 2 June 2023
(This article belongs to the Special Issue Upcycling Biowaste into Biobased Products)

Abstract

:
This study aimed to assess the impacts of biochar amendments derived from different feedstocks (sewage sludge (SS), olive-mill waste (OMW), compost, and sawdust) in land applications. Tomatoes were used as a test crop in four experiments both under greenhouse and field conditions. SS, OMW, and compost biochar treatments presented 17% to 178.5% higher tomato productivity than control, verifying that biochar behaves as a plant-growth bio-stimulant. This impact is related to the raw material since sawdust biochar did not present results as positive as the other types of biochars. The physicochemical characterization of biochars and their comparison with international and European standards confirmed the safety of their use. A risk-assessment analysis of tomato consumption was conducted in order to explore unfavorable effects on human health. The estimation of cumulative non-carcinogenic risk, found to be between 8.25 × 10⁻³ and 4.23 × 10⁻², and cancer risk for Cr(VI), found to be between 6.56 × 10⁻⁶ and 5.2 × 10⁻⁵, suggested no risk of potential chronic exposure due to tomato consumption cultivated in biochar-amended soils. This study may be used as a recommendation for farmers and agriculturists for maximizing the yield of agricultural crops in the Mediterranean region, improving soil health, and contributing to the sustainable management of agroecosystems.

1. Introduction

Biochar is a carbonized product that can be produced from numerous feedstocks, including agricultural and food-processing wastes, wood, manure, sewage sludge, etc. [1,2,3,4,5], and it derives from the pyrolysis of these biomasses under oxygen-limited conditions [6]. The notable characteristics of biochar, such as the high surface area, the chemical recalcitrance, the high sorption capacity, and its micro-structure, make it a beneficial material for a wide range of environmental applications (soil remediation/restoration, contaminant adsorption, wastewater treatment, climate-change mitigation, and energy production) [7,8,9]. Biochar application to land has attracted worldwide attention [10]. Numerous studies have demonstrated that biochar application to soil could increase soil-organic-matter (SOM) content [11], decrease greenhouse-gas emissions [12], improve soil structure [13], and boost crop yield [14] and soil fertility.
A major challenge of biochar application to land, however, is that biochar, depending on its origin feedstock, may release toxic substances with potential impacts on crop performance, quality of produce, groundwater, and soil functioning [15], thus increasing human-health risks [16]. These effects vary depending on several aspects [17]. The origin of the raw material, the biochar production conditions and process, the pore structure, the residence time, and the application rate are some of the factors that influence the content and availability of the toxic substances in biochar [18,19]. The contaminants in biochar are strongly dependent on the feedstock, especially for industrial or agricultural organic-waste feedstocks, such as sewage sludge (SS), which has greater potential ecological risk [20]. SS may contain potential trace elements of endocrine-disrupting compounds and polychlorinated dibenzodioxins, personal-care products, pharmaceuticals, etc. [21]. Moreover, 16 priority polycyclic aromatic hydrocarbons (PAHs) regulated by the United States Environmental Protection Agency (USEPA) have been associated with biochars derived from different feedstocks [10,22]. Only recently has the scientific community started to study the effects of biochar-origin pollutants on the (bio)availability of soil organic pollutants and their ecological impacts on plants, microorganisms, and soil faunas [23].
For these reasons, in the USA, Australia, and Europe, quality standards have been established to ensure the safe use of biochar. In the European Union (EU), the current regulation establishes the legal use of biochar as a soil amendment for agronomic purposes and in organic agriculture following defined criteria for the content of contaminants including heavy metals and PAHs [24]. In the USA, the International Biochar Initiative [25] has published guidelines for the safe use of biochar in soil, and in Australia, the Australian and New Zealand Biochar Initiative (ANZBI) was set in 2020 as the basis for a potential Australian standard on biochar use in soils.
Although previous research studies focused on examining the impact of biochar derived from different-origin feedstocks on soil characteristics and crop productivity, limited evidence is available for SS, especially olive-mill waste (OMW) and compost biochars. Furthermore, limited information is available for potential human-health risks due to biochar application to land raised from comprehensive greenhouse and field experiments. The main objective and originality of this work focus on these aspects and specifically aim to clarify the implications of biochars of different origin in soil using tomato as a reference crop and their potential use as bio-stimulants for crop growth, as well as the human-health risk associated with the consumption of tomatoes grown in biochar-amended soils.

2. Materials and Methods

2.1. Experimental-Design Procedure

The design of the analysis of the present work focused on the assessment of the impacts of biochar amendments derived from different feedstocks (SS, OMW, compost, and sawdust) in land application. Tomatoes were used as a test crop in four experiments under both greenhouse and field conditions. In order to assess the impacts of the biochar amendments, a three-pronged approach was followed:
  • A complete evaluation and synthesis of the results of the four experiments with respect to biochar quality as a bio-stimulant and soil improver was conducted.
  • All types of biochars used in the land applications were qualitatively and physico-chemically characterized and compared to International Biochar Initiative standards and European guidelines in order to confirm the safety of their use.
  • Finally, a risk-assessment analysis of tomato consumption using the outcomes of the four experiments was carried out in order to explore possible unfavorable effects on human health.

2.2. Origin and Production of Biochar Amendments

The local raw materials utilized for the production of different types of biochar were SS, OMWs produced from three-phase and two-phase olive mills, compost, and sawdust. The SS was supplied by the Municipal Enterprise for Water and Sewage of Chania. The “OMW-3-phase” was generated by a three-phase organic olive mill in Akrotiri, Chania. The “OMW-2-phase” was produced from two-phase olive mills at the olive-oil industry ABEA, in Chania. Sawdust was obtained from a local carpenter in Chania, and compost was provided by the Inter-Municipal Solid Waste Management Company of Chania (DEDISA). All feedstocks, except sawdust, were produced by thermal decomposition of biomass under oxygen-limited conditions at 400 °C and 99% pure nitrogen. The pilot-scale furnace used for the production of biochar was of 1 m3 capacity. The sawdust was subjected to slow pyrolysis at 300 °C in the same furnace. The heating rate and the residence time was 20 °C/min and 60 min, respectively. The temperature and the other production characteristics were based on the outcomes of earlier studies [26] in order to attain the desired yields and quality of the biochar products.

2.3. Field-Experiment Description

The biochars produced were used for land application prior to tomato cultivation. Four consecutive experiments were conducted in both greenhouse and field conditions between October 2020 and September 2022 (Table 1). The experimental design of the four studies was structured as follows:
  • The first step (first experiment) aimed to find the optimal dose of biochar addition to soil, using the basic feedstock (SS) used in the applications under controlled (greenhouse) conditions.
  • The second step (second experiment) aimed to confirm the optimal dose of biochar addition to soil found in the previous step, under field conditions, and also to assess the efficiency of an alternative biochar (OMW-3-phase).
  • In the final steps (third and fourth experiments), biochars of different origin (OMW-2-phase, sawdust, and compost) were added in order to evaluate their efficiency as bio-stimulants and soil improvers.
Specifically, the four experiments are described in detail as follows:
First experiment: The experiment was conducted between October 2020 and March 2021 at the campus of Technical University of Crete, Chania, Greece. Greenhouse tomatoes were grown in 30 L pots. Three treatments were evaluated: (i) control: no biochar amendment, (ii) SS dose 1: SS biochar corresponding to 10 t/ha, and (iii) SS dose 2: SS biochar of 25 t/ha. Each treatment was conducted using 8 pots of tomatoes. The variety of tomato cultivated in the greenhouse experiment was Elpida F1. Biochar was mixed prior to cultivation manually with 10 kg of topsoil. All treatments received the same amount of water through irrigation and water-soluble fertilizers. Specifically, each plant received in total 41 g N, 19 g P, and 61 g K, plus 205 L of water. Two soil samples were taken from each of the three treatments at the start of the experiment in October 2020 (after the application of biochar to soil) to determine the initial conditions. Two soil samples were also collected from each of the three treatments at the end of the growing period in March 2021 to determine the final conditions. Soil samples were collected from the whole volume of the pot, homogenized, air dried, and prepared for physicochemical analyses. The growth of the tomato plants was monitored by measuring the plant height, and the mass of the roots, shoots, and leaves for each plant was also measured after the completion of the experiment.
Second experiment: This experiment was carried out between May 2021 and September 2021 in an open field in the Akrotiri area of Chania, Greece (35°33′14.77″ N, 24°07′50.26″ E). The detailed description of this experiment was presented in Lilli et al., (2023) [26]. Four treatments were evaluated: (i) control: no biochar amendment, (ii) SS dose 1: SS biochar addition of 10 t/ha, (iii) SS dose 2: SS biochar of 25 t/ha, and (iv) OMW-3-phase: OMW biochar addition of 25 t/ha. Biochar was mixed manually with the surface soil prior to cultivation (0–20 cm). The plot size for treatment was 4 m2 and included 6 tomato plants. The variety of tomato cultivated in the field experiment was esculenta Bobcat F1. All treatments received the same amount of water through irrigation and water-soluble fertilizers. Specifically, each plant received in total 29 g N, 13 g P, and 36 g K, plus 161 L of water. Two soil samples were taken from each of the 4 treatments at the start of the experiment in May 2021 (after the application of biochar to soil) to determine the initial conditions. Two soil samples were also collected from each of the 4 treatments at the end of the growing period in September 2021 to determine the final conditions. Soil samples were collected from the top of 20 cm of the soil. Soil sampling and monitoring of the growth of the tomato plants was similar to the previous experiment.
Third experiment: The experiment was conducted between October 2021 and April 2022 at the campus of the Technical University of Crete, Chania, Greece. Greenhouse tomatoes were cultivated in pots. Four conditions were evaluated: (i) control: no biochar amendment, (ii) SS dose 2: SS biochar 25 t/ha, (iii) compost: 25 t/ha of compost derived biochar, and (iv) sawdust: 25 t/ha of sawdust biochar. Each treatment included 6 plants. The tomato variety used for the experiment was Elpida F1, as in the first experiment. The size of the pot used for this experiment was 50 L (1.5 times larger than in the first greenhouse experiment) to eliminate growth restrictions arising from the size of the pot. All treatments received the same amount of water through irrigation and water-soluble fertilizers. Specifically, each plant received in total 44 g N, 18 g P, and 54 g K, plus 156 L of water. Two soil samples were taken from each of the 4 treatments at the start of the experiment in October 2021 (after the application of biochar to soil) to determine the initial conditions. Two soil samples were also collected from each of the 4 treatments at the end of the growing period in April 2022 to determine the final conditions. Soil sampling and monitoring of the growth of the tomato plants was similar to the first greenhouse experiment.
Fourth experiment: The experiment was carried out between May 2022 and September 2022 in the same field as the second experiment of this study. Four treatments were evaluated: (i) control: no biochar amendment, (ii) SS dose 2: SS biochar 25 t/ha, (iii) OMW-2-phase: 25 t/ha of OMW-derived (produced from two-phase olive mills) biochar, and (iv) compost: 25 t/ha of compost-derived biochar. Biochar was mixed manually with the surface soil (0–20 cm) prior to cultivation. The plot size of each experimental unit was 4 m2 and included 6 tomato plants. The variety of tomato used for the experiment was esculenta Bobcat F1, as in the second experiment. All treatments received the same amount of water through irrigation and water-soluble fertilizers. Specifically, each plant received in total 29 g N, 15 g P, and 36 g K, plus 164 L of water. Two soil samples were taken from each of the 4 treatments at the start of the experiment in May 2022 (after the application of biochar to soil) to determine the initial conditions. Two soil samples were also collected from each of the 4 treatments at the end of the growing period in September 2022 to determine the final conditions. Soil samples were collected from the top 60 cm of the soil. Soil sampling and monitoring of the growth of the tomato plants was similar to the previous experiments.

2.4. Physico-Chemical Properties of Samples

Various physical and chemical properties were determined for the biochar and soil samples of the experiments. pH and electrical-conductivity (EC) values were measured using HACH LANGE probes, after moistening samples with deionized water, according to EPA Method 9045D/ASTM D4972-19. Dry matter/moisture, volatile solids, ash, volatile matter, and char were determined by implementing standard methodologies APHA-AWWA-WΕF 2540 B/ASTM D2216-19 and APHA-AWWA-WΕF 2540 G/ASTM E1755-01. Water-stable aggregates were distributed in different size classes according to the work published by Elliott (1986) [27] and Cambardella and Elliott (1993) [28]. Both soil–biochar samples and tissues (tomatoes, leaves, stems, roots) were also analyzed for moisture content, total organic carbon (TOC), total nitrogen (TN), trace elements, total phosphorus, nutrients, chlorides/sulfates, phenols, ammonium/nitrates, and available phosphorus (Olsen-P). TOC and TN values were determined by combustion at high temperature in an Analytik Jena elemental analyzer and NDIR/CLD detection, according to ASTM D6316. Trace elements and total phosphorus were measured after digestion of samples (according to EPA Method 3051a) and ICP-MS (EPA Method 6010b) and spectrophotometric (EPA Method 365.1) analysis, respectively. Chlorides, sulfates, and phenols were analyzed by SPLP extraction (EPA Method 1312) and spectrophotometric detection (EPA Method 9038, EPA Method 9251, DIN 38409-16:1984-06). The leachable (bioavailable) part of the chemical elements was measured, as well. Ammonium, nitrates, and Olsen-P were also determined after extraction and spectrophotometric detection. The elution method for the first two was ISO/TS 14256-1:2003, whereas for the last one it was ISO 11263:1994. Quantification was carried out according to EPA Method 350.2, ISO 7890-1-2:1986, and EPA Method 365.1, respectively.

2.5. Methodology of Human-Health Risk Assessment

To assess the potential health risk of chronic exposure due to tomato consumption, a risk-assessment analysis was carried out following USEPA methodologies. The hazards involve carcinogenic and non-carcinogenic assessments for all the trace elements through various pathways. Toxic elements can appear in humans through ingestion of contaminated food, skin exposure, and inhalation. For this assessment, only the pathway of ingestion was examined. The average metal concentrations found in the tomato samples from control, SS-dose-1-, SS-dose-2-, OMW-3-phase-, compost-, sawdust-, and OMW-2-phase-biochar treatments both from greenhouse and field studies were used to calculate the chronic daily intake (CDI), which was then used to characterize the exposure to metals resulting from tomato consumption. The metal concentrations of tomato samples used in this analysis are presented in Tables S4, S10, S16 and S22 (Supplementary Materials).
The following equation was used to calculate the CDI of the metals analyzed in this study:
C D I = C t o m a t o × I R t o m a t o × E F × E D B W × A T
where CDI is the chronic daily intake (mg kg−1 d−1), C is the concentration of each metal found in the tomato samples (mg kg−1), IR is the average daily-intake rate of tomato: 0.02 kg d−1 [29], BW is individual body weight: 70 kg [30], EF is the exposure frequency: 350 d year−1 [29], ED is the exposure duration: 30 years [29], and AT is the average time for non-carcinogens: 365 × 30 d [29]. The non-carcinogenic risk from individual heavy metals can be expressed as the hazard quotient:
H Q = C D I / R f D
where HQ is the non-cancer hazard quotient, and RfD is the chronic reference dose of the toxicant (mg kg−1 d−1). The oral RfDs for Al, Cr, Mn, Pb, Cu, and Zn (metals examined in this analysis) are 1, 0.003, 0.011, 0.14, 0.001, 0.40, and 0.3, respectively [31,32,33]. The cumulative non-carcinogenic risks were expressed as a hazard index (HI), which is the sum of the HQs from all the metals considered in this analysis [34]. This provides a worst-case-scenario assessment of the non-carcinogenic risks that these metals may pose due to tomato consumers.
H I = H Q C r + H Q A s + H Q C d + H Q H g + H Q P b + H Q M n + H Q Z n + H Q C u + H Q A l + H Q N i
As, Hg, Cd, and Ni concentrations determined in the tomato samples in all treatments of the four experiments were below detection limits, so these metals were not included in the calculation of HQ or HI. HI values > 1 indicate that there is a probability that non-carcinogenic risk may arise. Cancer risk represents a statistical probability of developing an individual-lifetime chronic health risk from carcinogens and can be estimated as follows:
C a n c e r   r i s k = L A D D × S F
where LADD is the lifetime average daily dose (mg kg−1 d−1), and SF is the oral slope factor of carcinogens. Since the only heavy metal that presented an oral slope factor from those used in our analysis was Cr(VI) (SF for Cr(VI): 0.5 mg kg−1 d−1 [31]), only this metal was used for the calculation of cancer risk. The hypothesis used in this case was that the total Cr determined in tomato samples was in the form of Cr(VI). This represents the worst-case scenario, since previous studies have shown the conversion of Cr(VI) to Cr(III) in plant tissues by endophytic bacteria and, specifically, root (core)-isolated endophytic bacteria can rapidly oxidize Cr(VI) [35,36].
The following equation was used to calculate LADD:
L A D D = C C r m g k g × 0.001 k g g × ( I R 1 12 m t h s × E D 1 12 m t h s A T + I R 1 2 y r s × E D 1 2 y r s A T + I R 2 5 y r s × E D 2 5 y r s A T + I R 5 12 y r s × E D 5 12 y r s A T + I R 12 19 y r s × E D 12 19 y r s A T + I R 19 49 y r s × E D 19 49 y r s A T + I R 49 70 y r s × E D 49 70 y r s A T )
where IRi is the body-weight-normalized tomato-consumption rate for the ith age group (g kg−1 d−1) [29], EDi is the exposure duration for the ith age group (years), and AT is the average lifetime (assumed 70 years). The USEPA recognizes a cancer risk as acceptable or tolerable for regulatory purposes if it is within the range of 10−6–10−4 [37].

3. Results and Discussion

3.1. Physical and Chemical Characterization of the Different Types of Biochars

The physico-chemical properties of the SS-, two types of OMW-, compost-, and sawdust-produced biochars are summarized in Table 2.
The yield ranged between 17% and 39% for the different types of biochars. This was due to the condensation of aliphatic compounds and the loss of CH4, H2, and CO during pyrolysis. At temperatures higher than 500 °C for all biochars except sawdust, dehydration of hydroxyl groups and thermal degradation of lignocellulose structures took place, and the yield further decreased. This was the reason for the selection of 400 °C as the pyrolysis temperature. In the case of sawdust, an even lower pyrolysis temperature (300 °C) was selected, since the yield was much lower at higher temperatures. The biochars produced from compost and the two types of OMW presented a higher pH (>9) compared to those measured for the SS- and sawdust-based biochars (5.66 and 6.81, respectively). The high pH values in the compost- and OMW-based biochars make them suitable for application in acidic soils. The EC was 3.35, 1.66, 5.2, 4.36, and 2.53 mS/cm for the SS-, OMW-3-phase-, compost-, sawdust-, and OMW-2-phase-based biochars, respectively. The char content was lower in sawdust biochar (24.6%) compared to the other biochars, in which the char content ranged between 41.8 and 73.4%. Tu et al. (2022) presented that woody-plant-derived biochar exhibited a considerably greater amount of volatile matter, and as a result a lower amount of char, than herbaceous-plant-derived biochar, which may be related to the higher degree of carbonization of woody-plant-derived biochar and the higher lignin content but lower ash content [38]. The specific surface area for the SS-based biochar (130 m2/g) was much higher compared to the other biochars (16 m2/g, 2.6 m2/g, and 19 m2/g for the OMW-3-phase-, sawdust,- and OMW-2-phase-based biochars, respectively). Despite these differences, the values can be considered adequate to justify their application as soil amendments.
Table 3 presents the maximum thresholds used for the evaluation of the safety assessment for the use of the different-origin biochars, according to the International Biochar Initiative (IBI) standards and the European Biochar Certificate (EBC). Depending on the source of biomass, in addition to nutrients, biochar may contain traces of hazardous substances, mainly heavy metals. In this case, all produced biochars had contents of heavy metals that did not exceed the thresholds defined by the IBI standards (Table 3).
Biochars certified with EBC-Agro and EBC-AgroOrganic meet all requirements of the new EU fertilizer-product regulation [39]. Several EU countries have approved the use of biochar according to the requirements of EBC-Agro. In this case, sawdust biochar could be evaluated according to the requirements of EBC-AgroBio certification. For sawdust biochar, only Cu (89.96 mg/kg) (Table 2) exceeded the maximum threshold of 70 mg/kg (Table 3). SS, compost, and OMW biochars could be evaluated according to the requirements of EBC-Agro certification. For SS biochar, Cd (2.4 mg/kg), Cu (264 mg/kg), Pb (206 mg/kg), and Zn (1647 mg/kg) (Table 2) exceeded the maximum thresholds of 1.5 mg/kg, 100 mg/kg, 120 mg/kg, and 400 mg/kg for Cd, Cu, Pb, and Zn, respectively (Table 3). Ni in SS biochar was 53.5 ± 2.1 mg/kg (Table 2), which is not statistically different from the maximum threshold of Ni of 50 mg/kg (Table 3). OMW biochar produced from a three-phase olive mill had lower values of all heavy metals than the maximum thresholds. OMW biochar acquired from a two-phase olive mill also showed lower values of all heavy metals than the maximum thresholds, except for Ni (67.4 mg/kg) (Table 2), which exceeded the maximum threshold of 50 mg/kg (Table 3). For compost-derived biochar, Cu (218 mg/kg), Pb (237 mg/kg), and Zn (820 mg/kg) (Table 2) exceeded the maximum thresholds of 100 mg/kg, 206 mg/kg, and 400 mg/kg for Cu, Pb, and Zn, respectively (Table 3). Although the aforementioned heavy metals present in the different types of biochar exceeded the maximum thresholds of EBC, they were not leachable and, as a result, they were not available in the plants (Tables S1–S3, S8, S9, S14, S15, S20 and S21). In addition, the accumulation of heavy metals in the soil was very low because they showed downward transport migration to deeper soil layers [26,40,41].
Further studies are also required to evaluate the frequency of biochar application. Due to its recalcitrance to decomposition in soil, single applications can have positive impacts over several growing seasons [42,43]. Considering the optimal application rate, the biochar availability, and the soil-management method, biochar application can be conducted in increments. In this case, due to the limited addition of biochar as a soil amendment, no adverse effects on soil are anticipated [20,44].

3.2. Metal Uptake by Plants and Soils

Tables S1–S3, S8, S9, S14, S15, S20 and S21 (Supplementary Materials) summarize the physical and chemical characteristics of the soil samples collected from each treatment during the application of biochar at the start and the completion of each experiment in order to define the initial experimental conditions and final conditions to assess the impact of biochar addition. The leachable part of all heavy metals in soils was below the detection limit (DL) or close to zero (Tables S1–S3, S8, S9, S14, S15, S20 and S21, Supplementary Materials).
The nutrients and heavy-metal content in fruits in aboveground (shoots and leaves) and belowground (roots) plant tissues collected from each treatment at the end of each experiment are shown in Tables S4–S7, S10–S13, S16–S19 and S22–S25 (Supplementary Material) for each experiment. No differences were observed among the treatments of each experiment. As for the tomato fruits, the concentration of Ni, As, Hg, and Cd in all treatments of the four experiments were below the detection limit, whereas Cr concentration was below 1.94 mg/kg in all treatments, a value lower than the limit of 2.3 mg/kg for Cr in vegetables according to the FAO/WHO (2001) [45].

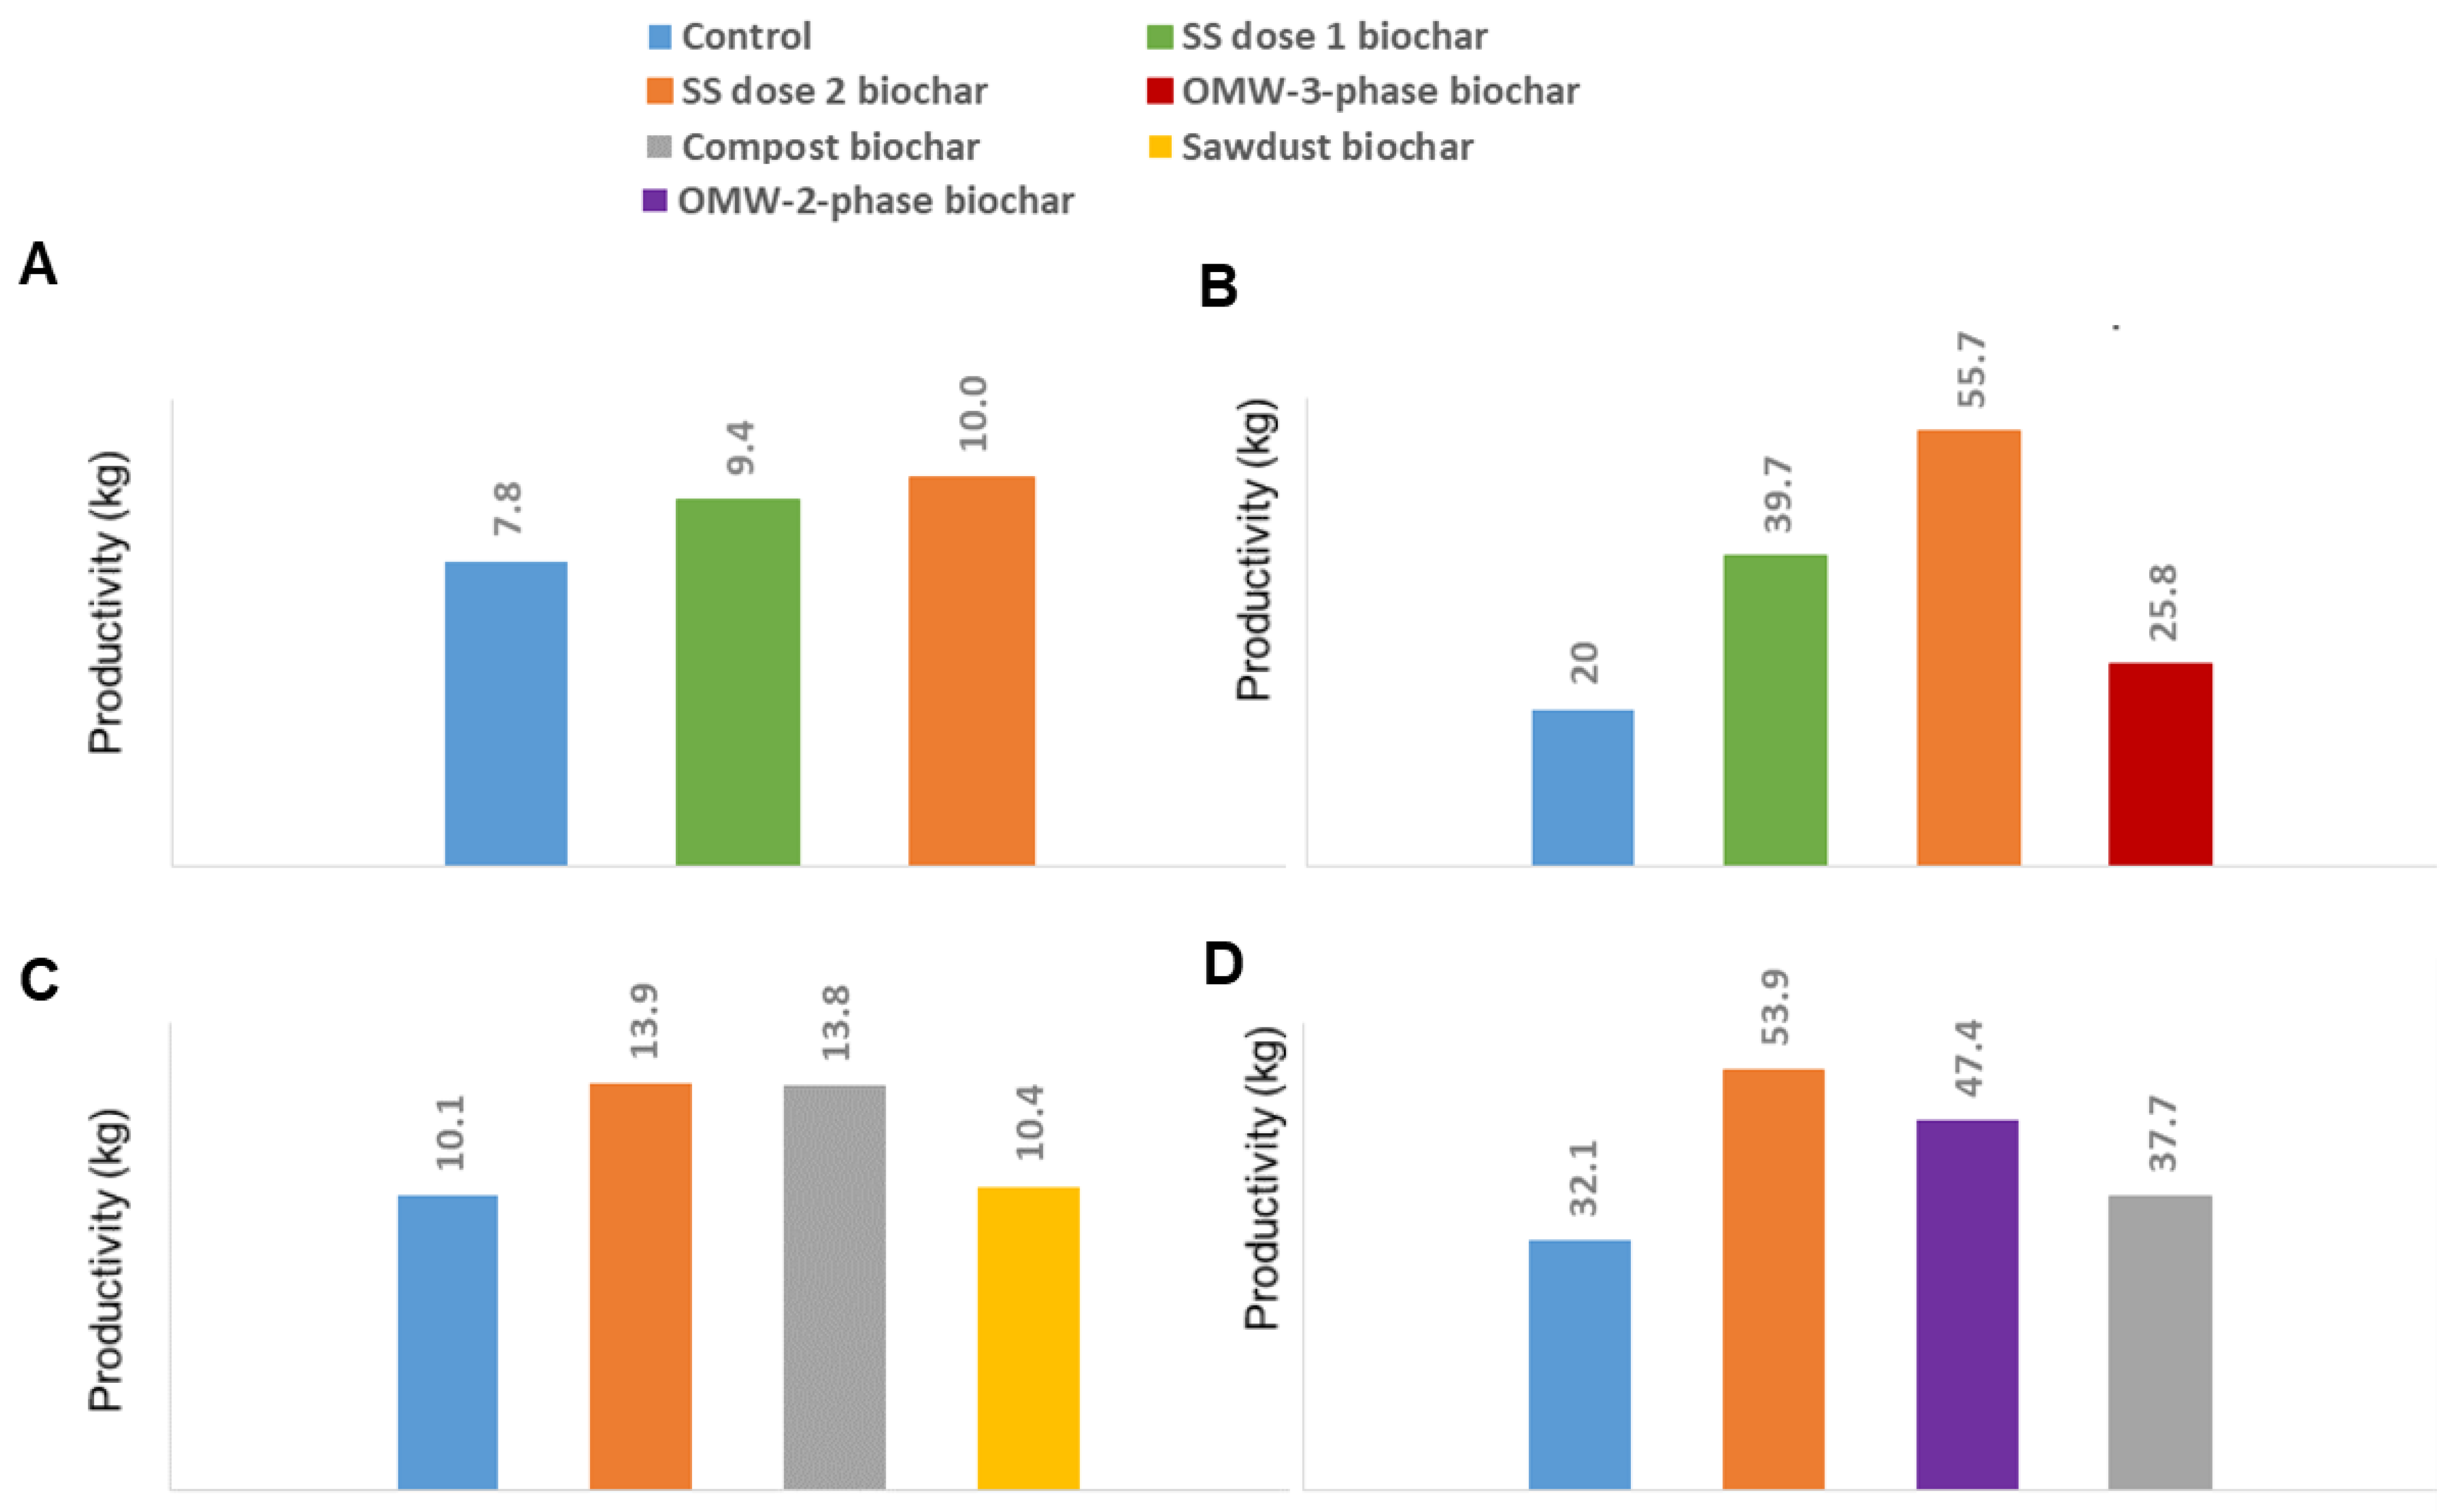
3.3. Effects of Biochar on Crop Yield

The yield of tomato plants harvested during the maturation period in each of the four experiments is summarized in Figure 1. The first experiment showed that higher production was observed in both SS-biochar treatments (application dose 1 and 2) compared to non-amended soil (Figure 1A). Specifically, 7.8 kg of tomatoes were produced from the control treatment, 9.4 kg of tomatoes were produced from the SS-dose-1-biochar treatment, and 10 kg of tomatoes were produced from the SS-dose-2-biochar treatment (Figure 1A). Tomato yield was 20% and 28% higher than control for the SS-dose-1 and SS-dose-2-biochar treatments, respectively.
The second experiment showed similarly that higher production was observed in both SS-biochar treatments (doses 1 and 2). Specifically, 20 kg of tomatoes were produced from the control treatment, 39.7 kg of tomatoes were produced from the SS-dose-1-biochar treatment, 55.7 kg of tomatoes were produced from the SS-dose-2-biochar treatment, and 25.8 kg of tomatoes were produced from the OMW-3-phase-biochar treatment (Figure 1B). Tomato yield was 98.5%, 178.5%, and 29% higher than the control for the SS-dose-1-, SS-dose-2-, and OMW-3-phase-biochar treatments, respectively.
The third experiment showed that higher production was observed in both SS-biochar and compost-biochar treatments. Specifically, 10.1 kg of tomatoes in total were produced from the control treatment, 13.9 kg were produced from the SS-dose-2-biochar treatment, 13.8 kg from the compost-biochar treatment, and 10.4 kg from the sawdust-biochar treatment (Figure 1C). Tomato yield was 38% and 37% higher than control for SS- and compost-biochar treatments, respectively. Tomato yield for sawdust biochar did not differ from that of control.
The fourth experiment showed that higher production was observed in both SS- and OMW-2-phase-biochar treatments. Specifically, 32.1 kg of tomatoes in total were produced from the control treatment, 53.9 kg from the SS-dose-2-biochar treatment, 47.4 kg from the OMW-2-phase-biochar treatment, and 37.7 kg from the compost-biochar treatment (Figure 1D). Tomato yield was 68%, 48%, and 17% higher than control for the SS-dose-2-biochar, OMW-2-phase-biochar, and compost-biochar treatments, respectively.
Overall, biochar stimulated higher yields except in the case of sawdust. In the second experiment, OMW-3-phase presented lower yield than an equal dose of SS biochar (Figure 1B). It is assumed that this was caused by phenol toxicity during the initiation phase of the development of the plant compared to the SS-based biochar or N availability [26]. Moreover, in the fourth experiment, the compost-biochar and OMW-2-phase-biochar treatments also stimulated lower productivity compared to the equivalent dose of SS biochar (Figure 1D). The findings clearly show that biochar is a bio-stimulant to plant growth, but that this action is strongly related to the origin of the raw material. Lilli et al. (2023) [26] provided support that the mechanism that stimulates plant growth is the microbiota structure in the presence of SS biochar.
The conditions of the experiment in terms of conducting it in the greenhouse or in the field had an impact on the growth and productivity of the plants. Higher yields were observed in the field (Figure 1B,D) than in the greenhouse experiments (Figure 1A,C). Moreover, the size of the pot in the greenhouse experiments and the mass of the substrate affected plant growth and, hence, biomass production. Previous studies conducted in smaller pots (10 L) in a greenhouse did not find a significant effect of SS biochar on tomato yield [46], likely due to pot restrictions on crop growth. The greenhouse experiments (Figure 1A,C) of this study in 30 L and 50 L pots showed up to 38% higher yield compared to control.

3.4. Effects of Biochar on Soil Improvement

TOC and TN in soil had increased for all treatments by the end of the first experiment compared to the start, with the largest increases detected in the soils treated with SS-dose-2 biochar. As far as the control treatment is concerned, TOC had increased from 2.57 at the start of the experiment to 4.86 g/kg by the end (Tables S1–S3). In addition, TN had increased from 0.4 at the start of the experiment to 0.59 g/kg by the end (Tables S1–S3). For the SS-dose-1 treatment, TOC increased from 3.65 to 8.19 g/kg and TN increased from 0.57 to 0.81 g/kg (Tables S1–S3). Finally, for the SS-dose-2 treatment, TOC increased from 4.2 to 11.12 g/kg and TN increased from 0.65 to 1.07 g/kg (Tables S1–S3). The increase in TOC in the biochar treatments was probably due to the amount of TOC contained, but also due to the structure of biochar, which contains chemically and biologically stable polycyclic and aromatic compounds, remaining in the environment for a long time [47]. Our analyses revealed significant sequestration of organic-C and -N in biochar treatments, particularly those with the highest application rate. In addition, water-stable aggregate fractionation showed beneficial effects of biochar on soil structure by increasing the mass distribution of macro-aggregates (75.06% and 72.05% for SS dose 1 and SS dose 2, respectively) compared to control (66%).
A detailed presentation of the effects of biochar In the second experiment is shown in Lilli et al. (2023) [26]. These findings also document higher TOC content in biochar treatments compared to the control. The amount of TOC had decreased in SS-biochar-amended soils by the end of the experiment, especially for the highest dose (SS dose 2). This effect likely shows that biochar may move to lower soil horizons, increasing the content of soil nutrients at deeper levels. As for the TN content, TN decreased in all treatments by the end of the experiment compared to the start. The C/N ratio increased in all treatments; however, soils amended with SS biochar showed a smaller increase compared to the control. The mass distribution of macro-aggregates increased in the highest doses of both feedstocks (SS dose 2: 21.3% and OMW-3-phase: 27.1%) compared to control and SS dose 1 (10.7% and 10.6%, respectively).
In the third experiment, the higher TOC content in the treatments compared to the control was consistent with the amended biochar. Specifically, following the application of biochar, the TOC in the sawdust-biochar soil increased by approximately 5 g C/kg (from 3.89 in the control to 9.09 g/kg), 2.2 g/kg in the compost-biochar (from 3.89 in the control to 6.19 g/kg), and 0.8 g/kg in the SS-biochar treatment (from 3.89 in the control to 4.70 g/kg) (Tables S14 and S15). On the other hand, the TN content remained approximately the same in the different biochar treatments compared to control. TOC content had decreased in sawdust-biochar- and compost-biochar-treated soils by the end of the experiment, and remained the same in SS-biochar-treated soil. However, the results are not statistically different. This was due to a downward movement of biochars (from the upper 20 cm to deeper soil layers) that was stimulated by the applied irrigation and the very small size of biochar particles. In the control treatment, soil TOC content had increased slightly by the end of the experiment. The TN content increased by 0.19 g/kg in the control treatment, 0.07 g/kg in the sawdust-biochar treatment, 0.18 g/kg in the compost-biochar treatment, and 0.09 g/kg for the SS-biochar treatment (Tables S14 and S15). The C/N ratio had decreased in all treatments by the end of the experiment.
In the fourth experiment, the higher TOC content in the treatments compared to the control was consistent with the findings of the previous experiments. Specifically, following the application of biochar, the TOC in the OMW-2-phase-biochar soil increased by approximately 4 g C/kg (from 16.58 in the control to 20.43 g/kg), 5 g/kg in the compost-biochar treatment (from 16.58 in the control to 21.74 g/kg) and 1 g/kg in the SS-biochar treatment (from 16.58 in the control to 17.44 g/kg) (Tables S20 and S21). Similar to TOC, the TN content slightly increased in the different biochar treatments compared to control. TOC content had decreased in SS-biochar- and compost-biochar-treated soils by the end of the experiment. This effect was also observed in the previous experiments. In the OMW-2-phase-biochar treatment, soil TOC content had increased by the end of the experiment from 20.43 g/kg to 31.86 g/kg (Tables S20 and S21). The C/N ratio increased significantly for the OMW-biochar treatment compared to control (from 12 to 19) (unamended), whereas the other treatments presented lower changes. TN had decreased in all treatments by the end of the experiment compared to the start. The TN content decreased by 0.27 g/kg in the control treatment and 0.10 g/kg, 0.86 g/kg, and 0.55 g/kg for the OMW-2-phase-biochar, compost-biochar, and SS-biochar treatments, respectively (Tables S20 and S21). These findings document a preferential stimulation of N mineralization that was likely induced by the properties of biochar and/or the increased crop demand for N.

3.5. Health-Risk Assessment of Heavy-Metal Exposure through Ingestion

The chronic daily intake (CDI) via ingestion was calculated to be 0–1.14 × 10⁻² mg kg−1d−1 for Al, 5 × 10⁻⁶–3.99 × 10⁻⁵ for Cr, 2.29 × 10⁻⁴–5.59 × 10⁻⁴ for Mn, 0–4.86 × 10⁻⁵ for Pb, 1.63 × 10⁻⁴–3.57 × 10⁻⁴ for Cu, and 3.35 × 10⁻⁴–3.36 × 10⁻³ for Zn in the different treatments (Table 4). The control treatment did not differ significantly from the other treatments in terms of CDI. The non-carcinogenic risk (HQ) via ingestion was calculated to be 0–6.78 × 10⁻³ for Al, 1.68 × 10⁻³–1.33 × 10⁻² for Cr, 1.64 × 10⁻³–3.99 × 10⁻³ for Mn, 0–4.86 × 10⁻² for Pb, 4.08 × 10⁻⁴–8.92 × 10⁻⁴ for Cu, and 1.12 × 10⁻³–1.12 × 10⁻² for Zn in the different treatments (Table 4). Similarly, the control treatment presented no significant differences compared to the other treatments in terms of HQ. For the evaluation of the cumulative non-carcinogenic risk, the hazard index (HI) was found to be between 8.25 × 10⁻³ for the SS-dose-1 treatment and 4.23 × 10⁻² for the OMW-2-phase treatment (Table 4). Similarly, the control treatment presented no significant differences compared to the other treatments in terms of HI. The above values did not exceed 1, indicating that the population is unlikely to present apparent risk of adverse effects as a result of the consumption of tomatoes cultivated in biochar-treated soils. The lifetime average daily dose (LADD) of Cr was found to be between 1.31 × 10⁻⁵ mg kg−1 d−1 and 1.04 × 10⁻⁴ mg kg−1 d−1 for the different treatments, if it is hypothesized that the total Cr found in tomato samples was in the form of Cr(VI). The control treatment presented no significant differences compared to the other treatments in terms of LADD.
The cancer risk for Cr(VI) was found to be between 6.56 × 10⁻⁶ and 5.2 × 10⁻⁵ for the different treatments (Table 4). Cancer risks of less than 1 in 100,000 additional cancers are within the acceptable range for regulatory purposes (1–100 additional cancers in one million cases). The results of the risk assessment suggest no adverse effects to human health due to the consumption of tomatoes cultivated in biochar-amended soils. The impact of different biochars on the risk of potential chronic exposure due to tomato consumption was found to be negligible.

4. Conclusions

The main focus of this research study and specifically of the four agricultural experiments conducted in both greenhouse and real field conditions was to evaluate the efficiency of biochar as an effective and safe soil improver and plant bio-stimulant for agricultural use. The physicochemical and risk assessment of the biochars originating from different kind of feedstock, namely, SS, OMW (3- and 2-phase process), compost, and sawdust, documented the perspective for their valorization and pointed out some main outcomes, which can be stated as shown below:
  • Biochar can be characterized as a plant-growth stimulator; however, this action is strongly related to the origin of the raw material. Fruit productivity greatly increased. The total mass of tomatoes produced from biochar-amended soils was significantly higher (up to 180%) compared to the non-amended soils. The sawdust-derived biochar did not present results as positive in terms of the total productivity as the SS, 2-phase-OMWs, 3-phase-OMW, and compost biochars.
  • All types of biochars showed lower heavy-metal contents than the maximum thresholds set in international standards. Although some heavy metals in the different types of biochar exceeded the maximum thresholds of the EBC, they were not leachable, and hence, a low bioavailability to crops can be assumed. The leachable part of all heavy metals was below the detection limit or close to zero.
  • The uptake and accumulation of heavy metals in the crop tissues was very low, rendering the biochar an appropriate product for land application and agricultural use. Similarly, the accumulation of heavy metals in the soil was very low because they often migrated to deeper soil layers.
  • Our findings provide evidence that the biochars had a positive impact on nutrient sequestration in the soil and improved its structure. In addition, biochar may move to lower soil horizons, increasing the content of soil nutrients at deeper levels.
  • The hazard index was estimated to be between 8.25 × 10⁻³ and 4.23 × 10⁻² for all treatments, and the cancer risk for Cr(VI), considering a worst-case scenario, was found to be between 6.56 × 10⁻⁶ and 5.2 × 10⁻⁵ for the different treatments. The risk-assessment analysis indicated that no harmful effects on human health would occur as a result of the consumption of tomatoes cultivated in biochar-amended soils. The impact of different biochars on the risk of potential chronic exposure due to tomato consumption was found to be negligible.

Supplementary Materials

The following supporting information can be downloaded at: https://www.mdpi.com/article/10.3390/su15119036/s1, Table S1. Characterization of the soil samples collected from each of the 3 treatments during the first application (initial conditions); Table S2. Characterization of the soil samples collected from each of the three treatments during the first application (initial conditions); Table S3. Characterization of the soil samples collected from each of the three treatments at the first application (final conditions); Table S4. Characterization of the tomato samples collected from each of the three treatments at the first application (final conditions); Table S5. Characterization of the leaf samples collected from each of the three treatments at the first application (final conditions); Table S6. Characterization of the shoot samples collected from each of the three treatments at the first application (final conditions); Table S7. Characterization of the root samples collected from each of the three treatments at the first application (final conditions); Table S8. Characterization of the soil samples collected from each of the four treatments during the second application (initial conditions); Table S9. Characterization of the soil samples collected from each of the four treatments at the second application (final conditions); Table S10. Characterization of the tomato samples collected from each of the four treatments at the second application (final conditions); Table S11. Characterization of the leaf samples collected from each of the four treatments at the second application (final conditions); Table S12. Characterization of the shoot samples collected from each of the four treatments at the second application (final conditions); Table S13. Characterization of the root samples collected from each of the four treatments at the second application (final conditions); Table S14. Characterization of the soil samples collected from each of the four treatments during the third application (initial conditions); Table S15. Characterization of the soil samples collected from each of the four treatments at the third application (final conditions); Table S16. Characterization of the tomato samples collected from each of the four treatments at the third application (final conditions); Table S17. Characterization of the leaf samples collected from each of the four treatments at the third application (final conditions); Table S18. Characterization of the shoot samples collected from each of the four treatments at the third application (final conditions); Table S19. Characterization of the root samples collected from each of the four treatments at the third application (final conditions); Table S20. Characterization of the soil samples collected from each of the four treatments during the fourth application (initial conditions); Table S21. Characterization of the soil samples collected from each of the four treatments at the fourth application (final conditions); Table S22. Characterization of the tomato samples collected from each of the four treatments at the fourth application (final conditions); Table S23. Characterization of the leaf samples collected from each of the four treatments at the fourth application (final conditions); Table S24. Characterization of the shoot samples collected from each of the four treatments at the fourth application (final conditions); Table S25. Characterization of the root samples collected from each of the four treatments at the fourth application (final conditions).

Author Contributions

The authors contributed as follows to the manuscript: conceptualization, M.A.L. and N.P.N.; methodology, M.A.L. and N.P.N.; formal analysis, M.A.L.; investigation, K.L., A.K., M.L.S. and S.V.; resources, K.L., A.K., M.L.S. and S.V.; data curation, M.A.L.; writing—original draft preparation, M.A.L.; writing—review and editing, N.V.P., K.K. and N.P.N.; visualization, M.A.L.; supervision, N.P.N.; project administration, N.P.N.; funding acquisition, K.K. and N.P.N. All authors have read and agreed to the published version of the manuscript.

Funding

This work was funded by the European Union’s Horizon 2020 research and innovation programme under grant agreement No. 818308 (WaysTUP! Project), https://waystup.eu/ (accessed on 1 September 2019).

Institutional Review Board Statement

Not applicable.

Informed Consent Statement

Not applicable.

Data Availability Statement

Data generated by this study are available in the Supplementary Materials.

Conflicts of Interest

The authors declare no conflict of interest.

References

  1. Domingues, R.R.; Trugilho, P.F.; Silva, C.A.; De Melo, I.C.N.A.; Melo, L.C.A.; Magriotis, Z.M.; Sánchez-Monedero, M.A. Properties of biochar derived from wood and high nutrient biomasses with the aim of agronomic and environmental benefits. PLoS ONE 2017, 12, e0176884. [Google Scholar] [CrossRef] [PubMed] [Green Version]
  2. Gupta, S.; Kua, H.W.; Koh, H.J. Application of biochar from food and wood waste as green admixture for cement mortar. Sci. Total Environ. 2018, 619, 419–435. [Google Scholar] [CrossRef]
  3. Qin, J.; Qian, S.; Chen, Q.; Chen, L.; Yan, L.; Shen, G. Cow manure-derived biochar: Its catalytic properties and influential factors. J. Hazard. Mater. 2019, 371, 381–388. [Google Scholar] [CrossRef] [PubMed]
  4. Singh, S.; Kumar, V.; Dhanjal, D.S.; Datta, S.; Bhatia, D.; Dhiman, J.; Samuel, J.; Prasad, R.; Singh, J. A sustainable paradigm of sewage sludge biochar: Valorization, opportunities, challenges and future prospects. J. Clean. Prod. 2020, 269, 122259. [Google Scholar] [CrossRef]
  5. Vamvuka, D.; Esser, K.; Komnitsas, K. Investigating the suitability of grape husks biochar, municipal solid wastes compost and mixtures of them for agricultural applications to Mediterranean soils. Resources 2020, 9, 33. [Google Scholar] [CrossRef] [Green Version]
  6. Lopez, J.E.; Builes, S.; Heredia Salgado, M.A.; Tarelho, L.A.C.; Arroyave, C.; Aristizabal, A.; Chavez, E. Adsorption of cadmium using biochars produced from agro-residues. J. Phys. Chem. C 2020, 124, 14592–14602. [Google Scholar] [CrossRef]
  7. Ye, S.; Zeng, G.; Wu, H.; Zhang, C.; Dai, J.; Liang, J.; Yu, J.; Ren, X.; Yi, H.; Cheng, M.; et al. Biological technologies for the remediation of co-contaminated soil. Crit. Rev. Biotechnol. 2017, 37, 1062–1076. [Google Scholar] [CrossRef]
  8. Zhang, W.; Tan, X.; Gu, Y.; Liu, S.; Liu, Y.; Hu, X.; Li, J.; Zhou, Y.; Liu, S.; He, Y. Rice waste biochars produced at different pyrolysis temperatures for arsenic and cadmium abatement and detoxification in sediment. Chemosphere 2020, 250, 126268. [Google Scholar] [CrossRef]
  9. Suliman, W.; Harsh, J.B.; Abu Lail, N.I.; Fortuna, A.M.; Dallmeyer, I.; Garcia-Perez, M. Influence of feedstock source and pyrolysis temperature on biochar bulk and surface properties. Biomass Bioenergy 2016, 84, 37–48. [Google Scholar] [CrossRef]
  10. Shen, X.; Meng, H.; Shen, Y.; Ding, J.; Zhou, H.; Cong, H.; Li, L. A comprehensive assessment on bioavailability, leaching characteristics and potential risk of polycyclic aromatic hydrocarbons in biochars produced by a continuous pyrolysis system. Chemosphere 2022, 287, 132116. [Google Scholar] [CrossRef]
  11. Liang, J.F.; Li, Q.W.; Gao, J.Q.; Feng, J.G.; Zhang, X.Y.; Hao, Y.J.; Yu, F.H. Biochar compost addition benefits Phragmites australis growth and soil property in coastal wet ands. Sci. Total Environ. 2021, 769, 145166. [Google Scholar] [CrossRef] [PubMed]
  12. Kalu, S.; Kulmala, L.; Zrim, J.; Peltokangas, K.; Tammeorg, P.; Rasa, K.; Kitzler, B.; Pihlatie, M.; Karhu, K. Potential of Biochar to Reduce Greenhouse Gas Emissions and Increase Nitrogen Use Efficiency in Boreal Arable Soils in the Long-Term. Front. Environ. Sci. 2022, 10, 914766. [Google Scholar] [CrossRef]
  13. Siedt, M.; Schaffer, A.; Smith, K.E.C.; Nabel, M.; Roß-Nickoll, M.; van Dongen, J.T. Comparing straw, compost, and biochar regarding their suitability as agricultural soil amendments to affect soil structure, nutrient leaching, microbial communities, and the fate of pesticides. Sci. Total Environ. 2021, 751, 141607. [Google Scholar] [CrossRef] [PubMed]
  14. Kizito, S.; Luo, H.; Lu, J.; Bah, H.; Dong, R.; Wu, S. Role of nutrient-enriched biochar as a soil amendment during maize growth: Exploring practical alternatives to recycle agricultural residuals and to reduce chemical fertilizer demand. Sustainability 2019, 11, 3211. [Google Scholar] [CrossRef] [Green Version]
  15. Godlewska, P.; Ok, Y.S.; Oleszczuk, P. The Dark Side of Black Gold: Ecotoxicological aspects of biochar and biochar-amended soils. J. Hazard. Mater. 2021, 403, 123833. [Google Scholar] [CrossRef]
  16. Wang, J.; Odinga, E.S.; Zhang, W.; Zhou, X.; Yang, B.; Waigi, M.G.; Gao, Y.Z. Polyaromatic hydrocarbons in biochars and human health risks of food crops grown in biochar-amended soils: A synthesis study. Environ. Int. 2019, 130, 104899. [Google Scholar] [CrossRef]
  17. Marmiroli, M.; Caldara, M.; Pantalone, S.; Malcevschi, A.; Maestri, E.; Keller, A.A.; Marmiroli, N. Building a risk matrix for the safety assessment of wood derived biochars. Sci. Total Environ. 2022, 839, 156265. [Google Scholar] [CrossRef]
  18. Huang, H.; Reddy, N.G.; Huang, X.L.; Chen, P.N.; Wang, P.Y.; Zhang, Y.T.; Huang, Y.X.; Lin, P.; Garg, A. Effects of pyrolysis temperature, feedstock type and compaction on water retention of biochar amended soil. Sci. Rep. 2021, 11, 7419. [Google Scholar] [CrossRef]
  19. Wu, C.; Liu, X.; Wu, X.; Dong, F.; Xu, J.; Zheng, Y. Sorption, degradation and bioavailability of oxyfluorfen in biochar-amended soils. Sci. Total Environ. 2019, 658, 87–94. [Google Scholar] [CrossRef]
  20. Brtnicky, M.; Datta, R.; Holatko, J.; Bielska, L.; Gusiatin, Z.M.; Kucerik, J.; Hammerschmiedt, T.; Danish, S.; Radziemska, M.; Mravcova, L.; et al. A critical review of the possible adverse effects of biochar in the soil environment. Sci. Total Environ. 2021, 796, 148756. [Google Scholar] [CrossRef]
  21. Zhang, J.; Hu, H.; Wang, M.; Li, Y.; Wu, S.; Cao, Y.; Liang, P.; Zhang, J.; Naidu, R.; Liu, Y.; et al. Land application of sewage sludge biochar: Assessments of soil-plant-human health risks from potentially toxic metals. Sci. Total Environ. 2021, 756, 144137. [Google Scholar] [CrossRef] [PubMed]
  22. Chen, P. The Determination and Migration of PAHs in Biochar-Based Fertilizer Used in Soil-Plant System; Shanghai Jiao Tong University: Shanghai, China, 2016. [Google Scholar]
  23. Lin, Q.; Tan, X.; Almatrafi, E.; Yang, Y.; Wang, W.; Luo, H.; Qin, F.; Zhou, C.; Zeng, G.; Zhang, C. Effects of biochar-based materials on the bioavailability of soil organic pollutants and their biological impacts. Sci. Total Environ. 2022, 826, 153956. [Google Scholar] [CrossRef] [PubMed]
  24. EBC. European Biochar Certificate—Guidelines for a Sustainable Production of Biochar; European Biochar Foundation (EBC): Arbaz, Switzerland, 2012–2022; Available online: http://european-biochar.org (accessed on 10 January 2022).
  25. IBI. Standardized Product Definition and Product Testing Guidelines for Biochar That Is Used in Soil; International Biochar Initiative: Canandaigua, NY, USA, 2015. [Google Scholar]
  26. Lilli, M.A.; Paranychianakis, N.V.; Lionoudakis, K.; Kritikaki, A.; Voutsadaki, S.; Saru, M.L.; Komnitsas, K.; Nikolaidis, N.P. The Impact of Sewage-Sludge- and Olive-Mill-Waste-Derived Biochar Amendments to Tomato Cultivation. Sustainability 2023, 15, 3879. [Google Scholar] [CrossRef]
  27. Elliott, E.T. Aggregate Structure and Carbon, Nitrogen, and Phosphorus in Native and Cultivated Soils. Soil Sci. Soc. Am. J. 1986, 50, 627–633. [Google Scholar] [CrossRef]
  28. Cambardella, C.A.; Elliott, E.T. Carbon and Nitrogen Distribution in Aggregates from Cultivated and Native Grassland Soils. Division S-6—Soil & Water Management & Conservation. Soil Sci. Soc. Am. J. 1993, 57, 1071–1076. [Google Scholar] [CrossRef] [Green Version]
  29. U.S. EPA. Exposure Factors Handbook (EPA/600/R-09/052F); National Center for Environmental Assessment, Office of Research and Development: Washington, DC, USA, 2011.
  30. U.S. EPA. Risk Assessment Guidance for Superfund (EPA/540/R-92/003), Volume I: Human Health Evaluation Manual (HHEM) Supplemental Guidance; Office of Emergency and Remedial Response: Washington, DC, USA, 1991.
  31. U.S. EPA. Integrated Risk Information System (IRIS): Chromium (VI) (CASRN 18540-29-9); Toxicological Review of Hexavalent Chromium (CAS No 18540-29-9); U.S. EPA. Support of Summary Information on the Integrated Risk Information System (IRIS): Washington DC, USA, 1998.
  32. Tvermoes, B.E.; Banducci, A.M.; Devlin, K.D.; Kerger, B.D.; Abramson, M.M.; Bebenek, I.G.; Monnot, A.D. Screening level health risk assessment of selected metals in apple juice sold in the United States. Food Chem. Toxicol. 2014, 71, 42–50. [Google Scholar] [CrossRef] [PubMed]
  33. U.S. EPA. Risk Assessment Guidance for Superfund. Human Health Evaluation Manual Part A. EPA/540/1-89/002; Office of Health and Environmental Assessment: Washington, DC, USA, 1989.
  34. U.S. EPA. Characterizing Risk and Hazard, Human Health Risk Assessment Protocol for Hazardous Waste Combustion Facilities (EPA530-R-05-006); Office of Solid Waste Management and Emergency Response: Washington, DC, USA, 2005.
  35. Lilli, M.A.; Syranidou, E.; Palliou, A.; Nikolaidis, N.P.; Karatzas, G.; Kalogerakis, N. Assessing the impact of geogenic chromium uptake by carrots (Daucus carota) grown in Asopos river basin. Environ. Res. 2017, 152, 96–101. [Google Scholar] [CrossRef]
  36. Dimitroula, H.; Syranidou, E.; Manousaki, E.; Nikolaidis, N.P.; Karatzas, G.P.; Kalogerakis, N. Mitigation measures for chromium-VI contaminated groundwater—The role of endophytic bacteria in rhizofiltration. J. Hazard. Mater. 2015, 281, 114–120. [Google Scholar] [CrossRef]
  37. U.S. EPA. Risk Assessment Guidance for Superfund (EPA/540/R-02/002), Volume III-Part A: Process for Conducting Probabilistic Risk Assessment; Office of Emergency and Remedial Response: Washington, DC, USA, 2001.
  38. Tu, P.; Zhang, G.; Wei, G.; Li, J.; Li, Y.; Deng, L.; Yuan, H. Influence of pyrolysis temperature on the physicochemical properties of biochars obtained from herbaceous and woody plants. Bioresour. Bioprocess. 2022, 9, 131. [Google Scholar] [CrossRef]
  39. EU-Commission Regulation (EU) 2019/1009—EU Fertilising Products and Amending Regulations; EU-Commission Regulation: Brussels, Belgium, 2019.
  40. Yang, S.; Feng, W.; Wang, S.; Chen, L.; Zheng, X.; Li, X.; Dongmei Zhou, D. Farmland heavy metals can migrate to deep soil at a regional scale: A case study on a wastewater-irrigated area in China. Environ. Pollut. 2021, 281, 116977. [Google Scholar] [CrossRef]
  41. Bartzas, G.; Komnitsas, K. Environmental Risk Assessment in Agriculture: The Example of Pistacia vera L. Cultivation in Greece. Sustainability 2020, 12, 5735. [Google Scholar] [CrossRef]
  42. Major, J.; Rondon, M.; Molina, D.; Riha, S.J.; Lehmann, J. Maize yield and nutrition during 4 years after biochar application to a Colombian savanna oxisol. Plant Soil 2010, 333, 117–128. [Google Scholar] [CrossRef]
  43. Gómez, N.; Rosas, J.G.; Singh, S.; Ross, A.B.; Sánchez, M.E.; Cara, J. Development of a gained stability index for describing biochar stability: Relation of high recalcitrance index (R50) with accelerated ageing tests. J. Anal. Appl. Pyrolysis 2016, 120, 37–44. [Google Scholar] [CrossRef]
  44. Paz-Ferreiro, J.; Nieto, A.; Méndez, A.; Askeland, M.P.J.; Gascó, G. Biochar from Biosolids Pyrolysis: A Review. Int. J. Environ. Res. Public Health 2018, 15, 956. [Google Scholar] [CrossRef] [PubMed] [Green Version]
  45. FAO/WHO. Food Additives and Contaminants. Joint Codex Alimentarius Commission. FAO/WHO Food Standards Programme, ALINORM 01/12A. 2001. Available online: https://www.fao.org/input/download/report/27/Al0112Ae.pdf (accessed on 12 March 2001).
  46. Velli, P.; Manolikaki, I.; Diamadopoulos, E. Effect of biochar produced from sewage sludge on tomato (Solanum lycopersicum L.) growth, soil chemical properties and heavy metal concentrations. J. Environ. Manag. 2021, 297, 113325. [Google Scholar] [CrossRef] [PubMed]
  47. Zhang, Y.; Wang, J.; Yu Feng, Y. The effects of biochar addition on soil physicochemical properties: A review. Catena 2021, 202, 105284. [Google Scholar] [CrossRef]
Figure 1. Tomato yields (in kg) per treatment at the end of the first (A), second (B), third (C), and fourth (D) study. “Dose 1” in the SS treatment refers to the application dose of 10 t of biochar per hectare (ha), and “dose 2” in the SS treatment refers to the application dose of 25 t of biochar per ha. All the other treatments correspond to an application dose of 25 t/ha.
Sustainability 15 09036 g001
Table 1. Summary of the characteristics of the biochar experiments. “V” refers to the treatments conducted in each experiment.
Experiment No.Greenhouse (G)/Field (F) ConditionsType and Dose of Biochar Used
No Biochar AdditionSS OMW-3-PhaseCompostSawdustOMW-2-Phase
0 t/ha10 t/ha25 t/ha25 t/ha25 t/ha25 t/ha25 t/ha
1GVVV
2FVVVV
3GV V VV
4FV V V V
Table 2. Properties of the different types of biochars used in the experiments. Parentheses show standard deviation of the replicates.
Type of Biochar
ParameterSSOMW-3-PhaseCompostSawdustOMW-2-Phase
Yield (%)25 (0.03)21 (0.06)39 (0.04)18 (0.08)17 (0.06)
pH6.81 9.869.195.66 (0.04)9.11
EC (mS/cm)3.35 (0.23)1.665.2 (0.95)4.36 (0.16)2.53 (0.10)
Dry Matter/(TS%)92.01 (0.01)97.85 (0.02)99.9 (0.02)90.17 (0.01)98.19 (0.02)
Moisture (%)7.98 (0.02)2.14 (0.03)0.14 (0.03)9.82 (0.02)1.80 (0.03)
Volatile solids (%)67.50 (0.65)86.35 (1.20)15.7 (0.84)98.73 (1.13)92.24 (0.30)
Ash (%)32.49 (0.13)13.64 (0.3)84.3 (0.45)1.26 (0.3)7.76 (0.3)
Volatile matter (%) (TG)34 (0.01)58.01 (0.01)36.2 (0.01)75.4 (0.01)54 (0.01)
Char (%) (TG)65 (0.01)41.98 (0.01)73.4 (0.01)24.6 (0.01)46 (0.01)
Specific surface area (m2/g)130 (0.02)16-2.619
S (%)0.95 (0.02)0.09 (0.01)0.51 (0.03)0.00.03
K (g/kg)3.4 (0.02)45.7 (0.4)15.6 (0.08)2.41 (0.01)23.8 (3.7)
Cr (mg/kg)68.4 (1.7)3.9 (0.04)44.5 (1.7)<DL11.1 (1.8)
Ni (mg/kg)53.5 (2.1)4.3 (0.1)39.6 (0.2)<DL67.4 (2.5)
Cd (mg/kg)2.4 (0.01)<DL<DL<DL<DL
Pb (mg/kg)206 (4.2)1.2 (0.03)237.3 (2.2)4.9 (0.05)0.35 (0.0)
Cu (mg/kg)263.6 (6.6)88.7 (0.8)217.6 (8.7)89.96 (1.1)52.9 (2.5)
Zn (mg/kg)1647 (6.4)81.9 (2.1)820.4 (33.8)59.4 (1.3)66.2 (3.2)
As (mg/kg)<DL<DL<DL<DL<DL
Hg (mg/kg)0.2 (0.01)<DL0.3 (0.02)<DL<DL
Co (mg/kg)<DL<DL<DL<DL<DL
Mo (mg/kg)16.4 (0.6)<DL1.6 (0.1)<DL0.38 (0.03)
Se (mg/kg)3.8 (0.06)<DL<DL<DL<DL
Cl (mg/kg)<8006551 (427)7956 (758)<8004136 (818)
SO4 (mg/kg)33,597 (2257)<60021,662 (474)2738 (978)<600
Phenols (mg/kg)4.4 (0.4)163.7 (26.3)21.3 (0.96)14.3 (0.65)104.1 (6.7)
N-NO3 (mg/kg)44.1 (4.2)32.7 (4.8)20.1 (3.7)72.1 (5.5)<10
N-NH4 (mg/kg)120.5 (6.9)4.58 (0.9)9.1 (0.9)80.1 (14.4)2.38 (0.53)
Olsen-P (mg/kg)564.9 (143)132.8 (9.9)636.4 (82.2)115.3 (7.5)148.9 (4.1)
TOC (%)20.0 (1.5)58.5 (3.04)13 (1.1)59.8 (3.98)64 (0.21)
TN (%)2.5 (0.2)3.9 (0.5)1.3 (0.2)0.7 (0.04) 2.9 (0.25)
Table 3. Maximum permitted concentrations of heavy metals in biochar.
Standard
Limit Value (mg/kg Dry wt)IBI (2015) [25]EBC-AgroBio [24]EBC-Agro [24]
As 13–1001313
Cd 1.4–390.71.5
Cr 93–12007090
Co 34–100--
Cu 143–600070100
Pb 121–30045120
Hg 1–170.41
Mo 5–75--
Ni 47–4202550
Se 2–200--
Zn 416–7400200400
Table 4. Potential health risks of metal intake through consumption of tomatoes for each biochar treatment.
ControlSS Dose 1SS Dose 2OMW-3-PhaseCompostSawdustOMW-2-Phase
CDI (mg kg−1d−1)
Al3.53 × 10−32.34 × 10−31.76 × 10−33.56 × 10−31.14 × 10−26.78 × 10−30.00 × 100
Cr1.47 × 10−56.11 × 10−61.85 × 10−55.03 × 10−62.39 × 10−51.97 × 10−53.99 × 10−5
Mn3.05 × 10−42.75 × 10−43.26 × 10−43.42 × 10−43.08 × 10−42.29 × 10−45.59 × 10−4
Pb1.18 × 10−60.00 × 1004.86 × 10−50.00 × 1001.48 × 10−51.03 × 10−61.29 × 10−5
Cu1.98 × 10−41.72 × 10−42.00 × 10−41.83 × 10−42.07 × 10−41.63 × 10−43.57 × 10−4
Zn6.51 × 10−44.43 × 10−48.98 × 10−44.17 × 10−41.17 × 10−33.35 × 10−43.36 × 10−3
HQ
Al3.53 × 10−32.34 × 10−31.76 × 10−33.56 × 10−31.14 × 10−26.78 × 10−30.00 × 100
Cr4.89 × 10−32.04 × 10−36.17 × 10−31.68 × 10−37.98 × 10−36.58 × 10−31.33 × 10−2
Mn2.18 × 10−31.97 × 10−32.33 × 10−32.44 × 10−32.20 × 10−31.64 × 10−33.99 × 10−3
Pb1.18 × 10−30.00 × 1004.86 × 10−20.00 × 1001.48 × 10−21.03 × 10−31.29 × 10−2
Cu4.96 × 10−44.30 × 10−45.00 × 10−44.58 × 10−45.18 × 10−44.08 × 10−48.92 × 10−4
Zn2.17 × 10−31.48 × 10−32.99 × 10−31.39 × 10−33.91 × 10−31.12 × 10−31.12 × 10−2
HI1.44 × 10−28.25 × 10−36.23 × 10−29.53 × 10−34.08 × 10−21.75 × 10−24.23 × 10−2
LADD (mg kg−1d−1)3.83 × 10−51.59 × 10−54.83 × 10−51.31 × 10−56.24 × 10−55.14 × 10−51.04 × 10⁻⁴
Cancer risk for Cr(VI)1.91 × 10−57.96 × 10−62.42 × 10−56.56 × 10−63.12 × 10−52.57 × 10−55.20 × 10⁻⁵
Disclaimer/Publisher’s Note: The statements, opinions and data contained in all publications are solely those of the individual author(s) and contributor(s) and not of MDPI and/or the editor(s). MDPI and/or the editor(s) disclaim responsibility for any injury to people or property resulting from any ideas, methods, instructions or products referred to in the content.

