Article

A Sustainable Development Evaluation Framework for Chinese Electricity Enterprises Based on SDG and ESG Coupling

College of Environmental Science and Engineering, Nankai University, 38 Tongyan Road, Jinnan District, Tianjin 300350, China
*
Author to whom correspondence should be addressed.
Sustainability 2023, 15(11), 8960; https://doi.org/10.3390/su15118960
Submission received: 5 March 2023 / Revised: 18 May 2023 / Accepted: 31 May 2023 / Published: 1 June 2023
(This article belongs to the Special Issue State of the Art of Assessment for Sustainable Development Goals)

Abstract

:
In 2021, China’s power generation industry took the lead in launching carbon emissions trading, ushering in a major challenge and opportunity for the sustainable development of power enterprises. Assessing the sustainable development performance of power enterprises has become the key to the sustainable financing and development of power enterprises in this new developmental stage. Based on the integration of the long-term UN Sustainable Development Goals (SDGs) and the ESG (Environmental, Social, and Governance) evaluation indicators of listed companies, this paper constructed an index system for the evaluation of the sustainable development of electric power companies consisting of 75 indicators corresponding to four dimensions: economic, social, environmental, and governance. Given the vision for the sustainable development of electric power companies, the assessment thresholds for each indicator were determined by the practical exploration and typical progress assessment of SDGs. Aggregate assessment and dashboard assessment techniques for the sustainable development of electric power companies were established, and we conducted a robustness analysis of the evaluation system. The results revealed the following details: (1) The disclosure of sustainable development indicators of Chinese electricity enterprises was 94.13%, among which the four dimensions of economy, environment, society, and governance were 99.89%, 82.62%, 94.00%, and 97.71%, respectively. (2) The aggregate sustainable development index for Chinese power companies was 59.34, and the environment, society, governance, and economic scores were 62.10, 64.49, 76.79, and 41.37, respectively. (3) Based on the results of the dashboard, investment in innovation, public welfare, emissions of greenhouse gases, and economic sustainability are the key factors limiting the achievement of sustainable development. (4) The framework’s robustness analysis showed that the results of the evaluation of this paper’s indicator framework fell within a reasonable range of variation using different ranking and weighting systems. Chinese electricity companies should comprehensively control costs and expenses, strengthen capital management, expand funding channels, focus on enhancing R&D capabilities, enhance their scientific and technological innovation management systems, and improve their disclosure of information about greenhouse gas emissions, resource consumption and use, and employee issues to improve the overall level of sustainable development. The evaluation system developed in this paper further enriches the evaluation of corporate sustainability performance. This paper explored the application of the SDG index and dashboard construction methods at the national level to the evaluation of sustainability at the corporate level, providing a clear picture of corporate performance with respect to various dimensions, issues, criteria, and indicators.

1. Introduction

Sustainable development strategies have become one of the key development strategies for all industries and sectors around the world. China set a peak carbon-neutral target in 2020 (referred to as the double carbon target) and is committed to forming a new energy structure by 2030 with a focus on non-fossil energy and natural gas [1]. Under the double carbon target, China’s power industry, as its main energy-consuming sector, was the first to be included in the carbon emissions trading target, and the first compliance cycle for the power generation industry in the national carbon market was also officially launched in 2021, making the green and low-carbon transformation of the power industry imperative [2]. As independently operated economic entities, the sustainability level of power enterprises directly restricts the development level of the entire power industry while significantly affecting the sustainability of national economic and social development [3]. In the current environment of energy scarcity, enhancing the competitiveness and achieving the sustainable development of electric power enterprises have become urgent. Therefore, the sustainable development performance of electric power enterprises is of great concern. The realization of such sustainable development requires the establishment of a set of effective evaluation mechanisms in order to assess the sustainable development performance of each enterprise and understand and analyze the performance of an enterprise to facilitate the enterprise’s sustainable development management and provide reference advice to stakeholders.
As a sustainable development evaluation that takes into account economic, environmental, social, and governance benefits, the ESG framework is an investment philosophy that pursues long-term value growth and adheres to a corporate governance mindset focusing on the big picture and a comprehensive approach [4]. The ESG evaluation system is based on ESG information disclosed by enterprises or provided by third parties and is based on three perspectives of the environment, social responsibility, and corporate governance. The ESG evaluation system, serving as a tool for measuring corporate sustainability performance, has received much attention from stakeholders in recent years. The ESG framework provides tools and methods for integrating governance considerations into enterprise-level sustainability. As tools and methods, ESG scores provide readily available data on corporate sustainability performance, and ESG scores, ESG ratings, and ESG evaluation systems are widely used in the literature to measure the sustainability performance of firms [5]. Some scholars have directly adopted existing ESG rating systems, such as those produced by Bloomberg [5] and Morgan Stanley Capital International (MSCI), into their studies [6].
Directly adopting the ESG evaluation frameworks of rating agencies to measure corporate sustainable performance is a common practice in current research. However, there are some problems in this regard, such as interagency ESG evaluation system disagreement [7], whether the analyzed ESG rating method incorporates sustainability principles into the evaluation system [8], and instances in which the relationship between ESG and corporate economic performance has not yet been harmonized [9,10]. The existing ESG frameworks need to be optimized in order to better measure corporate sustainability performance. This paper established a sustainable development evaluation system for electric power enterprises based on the existing ESG evaluation system and drawing on the practical exploration and typical experiences of the long-term progress assessment of the UN Sustainable Development Goals. The evaluation system established in this paper further enriches the evaluation of enterprises’ sustainable performance. Specifically, the evaluation system in this paper combines three aspects of ESG with three aspects of sustainability, namely, environmental, social, and economic, constituting an enterprise sustainability evaluation system supported by four dimensions: economic, environmental, social, and governance. This paper also explores the application of the country-level SDG index and dashboard construction methods to corporate-level sustainability evaluation to clearly demonstrate corporate performance across dimensions, issues, guidelines, and indicators.
The rest of the paper is structured as follows. Section 2 is a literature review that examines three related studies on corporate sustainable performance evaluation, the application and shortcomings of the ESG framework in measuring corporate sustainable performance, and the integration of ESG and SDGs. Section 3 provides the methodological and theoretical foundations of the study. Section 4 shows the results of the study. Section 5 provides a discussion and analysis of the results and robustness tests. Section 6 concludes the study.

2. Literature Review

2.1. Corporate Sustainability Performance Evaluation

An important extension of the concept of sustainable development is the concept of corporate sustainability. Corporate sustainability is the application of the concept of sustainable development at the corporate level [11]. Due to the complexity of sustainability, researchers have proposed theories such as environmental sustainability, eco-efficiency, business ethics, and the three bottom lines in an attempt to define corporate sustainability, which has led to the development of different frameworks for corporate sustainability performance constructed based on various theories. Researchers have developed many methodological frameworks in order to make corporate sustainability more easily quantifiable [12,13,14]. Initial sustainability assessments focused on the evaluation of single dimensions of sustainability, such as corporate environmental performance [15,16], as well as corporate social performance [17]. Measurement frameworks based on the environmental dimension cover indicators that measure corporate emissions of pollutants, resource use, erosion of biodiversity, and climate-warming impacts [18]. The measurement framework for the social dimension covers indicators for employees, supply chain management, equity, occupational health, and human rights [19]. In the economic dimension, the measurement framework measures the profitability, operating capacity, growth capacity, and credit-worthiness of a business with financial indicators, aiming to maximize wealth [20]. The shortcomings of one-dimensional measurement frameworks are not limited to their measurement of only one aspect of corporate sustainability [21]; there are also problems such as a lack of standardization techniques [16] and a lack of measurement of specific companies or sectors [22]. Triple performance was proposed to systematically measure the performance of the three perspectives of sustainability, and many researchers and institutions have conducted extensive and in-depth research on corporate sustainability based on triple performance [23]. The first edition of GRI’s Sustainability Reporting Guidelines (G1) was published by the Global Reporting Initiative and applied triple bottom line theory to provide a core framework for the measurement of an organization’s economic, environmental, and social performance [24].
Specifically for the evaluation of sustainability in the power generation sector, Qazi sought to analyze the impact of reform measures, such as structural transformation, institutional development, and policy advancement, on the sustainability of Pakistan’s power sector by using different indicators to measure the developmental performance of Pakistan’s power generation, transmission, and distribution sectors [3]. Wang applied the material element extension approach to economic, environmental, technological, and social aspects to establish a sustainability evaluation framework to assess and analyze the sustainability of five Chinese power generation industries [25]. Deng constructed a data envelopment analysis (DEA), hierarchical analysis (AHP), and dynamic evaluation system based on data envelopment analysis (DEA) to determine the economic sustainability performance of Chinese nuclear-related enterprises [26]. Gopal assessed the degree of sustainability and trends in the power sector in India using 11 indicators corresponding to three dimensions: economic, environmental, and social [27]. Simone assessed the sustainability performance of the Brazilian power sector based on the Global Reporting Initiative (GRI) energy sector indicators by applying the directed distance function (DDF) as specified by data envelopment analysis (DEA) [28].

2.2. Application of ESG in Corporate Sustainability

The above literature has generally considered three dimensions of sustainable development: economic, environmental, and social. In recent years, with the rise of responsible investment, governance, serving as a new dimension of sustainable development, has received the attention of many researchers [29,30]. Whether at the sectoral, national, or international levels or at the corporate level, governance is key to achieving sustainable development [31]. The ESG framework provides tools and methods for integrating governance factors into sustainable development at the corporate level. ESG scores provide readily available data on corporate sustainability performance, and ESG scores and ESG evaluation systems are widely used in the literature to measure corporate sustainability performance [5]. Some scholars have directly used existing ESG evaluation systems, such as those offered by Bloomberg (Bloomberg) [5], Morgan Stanley Capital International (MSCI) [6,32], Thomson Reuters [33,34], and Refinitiv [34], for their studies. Some researchers have also adopted measurement frameworks similar to international measurement methods, adapting specific indicators in the evaluation framework based on the research context [35,36].
The ESG framework can analyze and assess the ability of companies to incorporate environmental, social, and governmental sustainability principles into their policies [37]. However, as more and more companies, NGOs, and other organizations begin to offer their own views on the composition of indicators and the number of rating and ranking products continues to expand, several problems have emerged with regard to using the ESG framework for measuring corporate sustainability performance. First, the differences in the ESG evaluation frameworks belonging to different organizations cannot be underestimated because the specific connotations of ESG are not clearly defined. The shortcomings of evaluation frameworks are reflected in various aspects, such as topic selection, indicator selection, weight positioning, evaluation methods, and data sources [7,38,39]. The ESG evaluation frameworks also suffer from problems such as a lack of transparency [40], substitutability between criteria [41], and failure to meet all stakeholders’ expectations [42]. Although the development of the ESG rating system in China occurred later than in Western and developed countries and the advanced techniques of ESG evaluation abroad can be utilized, the divergence of ESG rating agencies still exists. Min Liu analyzed the ESG rating data of Chinese A-share-listed companies based on SynTao Green Finance, Sino-Securities Index CASVI, WIND ESG, FTSE Russell, and Rankins (six Chinese ESG rating agencies) and found that the six rating agencies had a low correlation, although quantitative disclosure could reduce the disagreements between the rating systems [43]. The basic question “which indicators or measures are the best” is not easy to answer, as they still lack uniform definitions and evaluation criteria [38]. However, the indisputable fact is that the comprehensive ESG evaluation framework has gained general acceptance. The second problem in the existing ESG evaluation frameworks is whether ESG evaluation can determine the true level of corporate sustainable performance. Escrig-Olmedo et al. divided the sustainability principles in the evaluation into four categories and carried out a comparative descriptive analysis based on publicly available information. They found that ESG rating agencies have incorporated the new criteria into their assessment models but have not fully integrated sustainability principles into their corporate sustainability assessment process [44]. More studies have analyzed existing sustainability evaluation frameworks in terms of strong and weak sustainability. Weak sustainability allows for adaptation to environmental issues without sacrificing economic growth and relinquishing power and control [8]. Landrum argued that current corporate sustainability and evaluation practices revolve around weak sustainability [45]. This implies that businesses are not truly sustainable and that the productivity of businesses is not changing in order to meet human needs [45]. Strong sustainability entails that economic and social relationships are closely related, but maintaining the economy is equally as important of a sustainability dimension as the environment and society [45]. ESG studies consider the economic benefits of corporate sustainability as an additional result of its environmental, social, and governance performance [46], failing to view corporate sustainability in terms of the sustainability economy and, therefore, failing to actually meet the definition of strong sustainability. Third, ESG evaluation focuses greatly on the non-financial performance of enterprises, such as the environmental, economic, and social elements, but lacks an evaluation of economic aspects [47]. The economic performance of corporate sustainability is considered an additional result of its environmental, social, and governance performance, and a significant amount of research on ESG in corporate economic performance can be found in the literature. However, the relationship between ESG and economic performance has not been uniformly addressed, and various relationships have been found, such as a significant positive correlations [9,48], negative correlations [10,49], non-significant relationships [8], and indirect relationships [50]. However, whichever framework is adopted, common problems, such as a lack of standardization, reliability issues, and structural failures, cannot be ignored. Establishing a universally accepted framework to measure corporate sustainability performance is a difficult task because the concept of sustainability encompasses a variety of complex terms and components from different scientific fields [51]. Therefore, measuring the true sustainability level of a firm through ESG evaluation requires optimization of the existing ESG evaluation frameworks.

2.3. ESG Integration with Sustainable Development Goals (SDG)

The use of ESG frameworks to measure corporate sustainability performance would not be as prevalent as it is today if only governance factors were included in corporate sustainability evaluations. In 2015, the United Nations (UN) 2030 Agenda for Sustainable Development identified 17 goals and 169 sub-goals of the Sustainable Development Goals (SDGs), which not only emphasize the important role of business in the process of achieving sustainable development [52] but also have far-reaching implications for corporate sustainability evaluation, including the inclusion of many human rights, cultural, and ethical factors in the assessment of sustainable development [53]. ESG evaluation acts as a tool for the implementation of the SDGs at the enterprise level and contributes to a better understanding of the contribution of organizational commitment to the SDGs. Some studies have used ESG frameworks to link corporate sustainability to the SDGs and have demonstrated the feasibility of using the ESG framework to measure corporate sustainability levels based on measuring corporate contribution to the SDGs through aspects of ESG [54,55,56,57]. DeMates and Phadke first used a mapping approach to map 30 SASB ESG categories to 17 SDGs, linking corporate sustainability activities to the SDGs [57]. Betti mapped 30 SASB ESG issues to SDGs and found that some ESG issues were more relevant to SDGs and their goals than others issues [54]. Similarly, Consolandi mapped SASB ESG questions to SDGs to examine how healthcare companies contribute to SDG 3 [55]. Khaled mapped/linked SDGs to Refinitiv ESG scores to contribute to the emerging research on SDGs, helping companies to identify and prioritize what is most relevant to their sustainable business practices based on the most relevant SDGs and indicators [56]. In terms of ESG–SDG relationships, the current research is limited to linking ESG topics to elements of the SDGs. There is a lack of research on linking the SDG indexes and the method of building the index base for ESG evaluation.

3. Methods

In this paper, we adopted a corporate sustainability evaluation system based on the ESG framework and the SDG index calculation method to establish the four dimensions of economic, environmental, social, and governance, with the aim of assessing the sustainability performance of Chinese power generation companies. We decomposed the measurement framework into multiple steps for its construction [58]. This section details the design principles and structure of the framework, the selection of data and samples, the indicator base and indicator selection processes of the measurement framework, the calculation of the sustainability index for Chinese power generation enterprises, and the establishment of the sustainability tool for the power generation industry. The research ideas are presented in Figure 1.
The sustainability evaluation system in this paper considered the coupling of ESG evaluation indicators and SDGs based on three aspects: indicator selection, evaluation method, and evaluation result characterization. In the process of establishing the indicator database, ESG disclosure criteria and ESG evaluation systems that are supported by the literature or documents with links to the SDGs were selected. For example, the GRI document “Linking the SDGs to the GRI Standards” contains a list of existing disclosures in the GRI standards that map the GRI indicator content to the 17 UN SDGs at the goal level, thereby helping companies to measure and report their impact and thus contribute to the achievement of the sustainable development goals [59]. Studies have generally used mapping methods to link existing ESG frameworks in indicator evaluation systems (e.g., SASB and Refinitiv evaluation systems) to SDGs, thus contributing to the emerging research on SDGs and helping companies to identify and prioritize the SDGs and indicators most relevant to their sustainable business practices [50,51,52,53]. During the execution of the indicator evaluation technique, the indicator evaluation method of the SDGs evaluation framework was determined with reference to current domestic and international practical explorations and typical experiences with SDG progress assessment, using the scenario method to determine indicator thresholds and using equal weights to assign weights to dimension-, issue-, and criterion-level indicators. With regard to the characterization of evaluation results, a method consisting of using the SDG index and indicator panel was applied to the process of sustainable development assessment of Chinese power generation enterprises, and the sustainable development index and dashboard of Chinese power generation enterprises were established with reference to the establishment method of SDG index aggregation and the dashboard, which were used to characterize the sustainable development level of Chinese power generation enterprises.

3.1. Framework Design Principles and Structure

This section validates the soundness of the proposed framework by conducting a bottom-up analysis of the relevant economic, environmental, social, and governance dimensions in the context of strong sustainability. The economic dimension is an important aspect of corporate sustainability, and for for-profit companies, improving financial performance is important [60]. The previous economic sustainability framework focused on evaluating the financial costs and benefits of firms, reflecting their long-term profitability and financial sustainability. In contrast, the sustainable economic framework constructed using key performance indicators (KPIs), such as return on equity (ROE), return on assets (ROA), and economic value added (EVA), is only useful for assessing the long-term profitability, earnings quality, and cash flow of a firm [61]. From the strong sustainability perspective, wherein economic activities are constrained by environmental limits, corporate economic sustainability should be linked to the intangible values possessed by environmentally friendly and socially responsible companies with sound governance policies [62]. Therefore, a framework for corporate sustainability constructed with consideration of economic, social, environmental, and governance factors would be reasonable from a sustainability economy perspective.
Effective environmental sustainability performance, such as reducing pollution and greenhouse gas emissions, can affect the economic performance of businesses [63]. In terms of stakeholder factors, excellent performance in environmental sustainability is one of the dimensions of corporate social performance that leads to greater access to finance and enhances sustainability value [64]. Ecological performance is a visual representation of an organization’s framework for environmental management, and good environmental performance reflects well on a firm’s ability to cope with increasing environmental challenges. For these reasons, the assessment of environmental dimensions is important.
The relationship between social performance and sustainability performance can be drawn from stakeholder theory, legitimacy theory, and signaling theory. By fulfilling social responsibility, a company communicates to the outside world its desire to conform to the norms and expectations of its stakeholders, thus establishing good relationships with multiple stakeholder groups that can improve sustainability performance in the long run by assisting in the development and maintenance of valuable intangible assets [65]. Many studies have found that corporate social responsibility brings benefits to companies in terms of human resource management, such as increased employee contribution to a company [66], improved employee retention [67], and an increased sense of organizational identity among employees [68]. Good corporate social performance also leads to increased productivity, lower training costs [69], and sustainable competitiveness and economic performance [70,71]. Social performance is inextricably linked to the economic performance and sustainability of a firm, and policies, measures, and outcomes under the social dimension of a firm must be considered in assessing its sustainability performance.
While the importance of the quality of corporate governance strategies and mechanisms to the operation and development of a firm is indisputable, a business is led by its Board of Directors, setting strategic goals for the business’s long-term success and survival. Effective corporate governance mechanisms ensure the effective implementation of a firm’s strategy. By implementing internal, goal-oriented corporate governance mechanisms such as board diversity, board independence, an appropriate board size, sustainability committees at the board level, CEO roles, ownership concentration, and disclosure and transparency practices, companies are able to implement goal-oriented sustainability measures [72]. The evaluation of the governance dimension is thus an integral part of the evaluation of corporate sustainability.

3.2. Indicator Bank and Indicator Selection

Figure 2 shows the creation of the indicator pool and the indicator-screening process, the latter of which consists of the following components.
  • The GRI guidelines;
  • Indicators mentioned in the literature on the sustainable development performance of power generation companies [3,17,25,26,27,28,47,51,73,74,75,76,77];
  • ESG issues and indicators that link ESG concerns to SDGs.
The selection of indicators is often based on many factors, such as the financial performance of a firm, the relevant level of economic development, and the corresponding evaluation target model, evaluation time, and social geography [78]. The indicator screening process performed in this study is as follows: In the first step, we grouped the indicators into four dimensions, namely, environmental, economic, social, and governance, based on the sustainability dimensions measured using the indicators. In the second step, duplicate indicators were eliminated. In the third step, we filtered out compliance indicators under the four dimensions, such as “number of administrative penalties imposed on the company” and “measures to avoid child labor and forced labor”. The framework developed in this paper aimed to measure the true sustainability level of a company. The compliance indicators only measure the degree to which a company meets its policy, whereas they do not show the company’s willingness to improve its true sustainability performance voluntarily. In this paper, compliance indicators were not included in the sustainability framework; they were used to exclude firms lacking the will to achieve sustainability. If a firm did not meet the requirements of the compliance indicators, it was dropped from the sample. In the fourth step, the remaining indicators were screened with respect to sustainability. The principle of the sustainability screening of indicators was based on the conceptual principles of sustainability proposed by Escrig, which, in turn, were based on seminal references in the field of sustainability [8]. According to the sustainability dimensions and the principle of balance, in the process of screening indicators, we aimed to achieve the same number of indicators under each dimension and avoid weighting one dimension more heavily than the others in order to achieve mutual balance between the sustainability dimensions. According to the intergenerational principle, the screened indicators reflected the current performance level of a company and the current impact of said company’s decisions on its long-term sustainability so as to achieve a balance between long-term performance and short-term performance. From the stakeholder perspective, the screened indicators should address the contemporary and future needs of stakeholders such as employees, product users, shareholders, social citizens, and the government. Life cycle principles require that companies be economically, environmentally, and socially responsible in order to achieve sustainability across legal organizational boundaries. In this regard, indicators should address managing the impact of upstream and downstream activities, such as supply chain management. In the fifth step, a final screening of the indicator framework was performed based on the availability of indicators. As sustainability disclosure in China is not yet mature, some indicators face challenges in data collection. Only when more than 60% of companies have data for the indicator will the indicator be included in the evaluation system.
In line with the principle of measuring the true sustainability of companies, we did not impute or model any missing data. We only addressed the following essential indicators.
  • The number of penalties received by enterprises from regulatory authorities for environmental issues: According to the regulations of the China Securities Regulatory Commission, for enterprises penalized for environmental issues, the number of penalties received and related information must be disclosed in their annual reports. For enterprises that did not disclose such information, we assumed that the number of occurrences of the event was 0.
  • The number of occurrences of major equipment accidents (times): According to the regulations of the China Securities Regulatory Commission, for enterprises suffering from major equipment accidents, the number of occurrences and related information must be reported. For enterprises that did not disclose information on this indicator, we assumed that the number of major equipment accidents was 0.
  • The number of patents granted per capita (items/person): For enterprises that did not disclose the annual number of patents granted, we assumed that the number of patents granted per capita for the year was 0.
It is worth noting that the differences in the types of power generation were taken into account when constructing the system of sustainability indicators at the environmental level. Different indicators were selected depending on the type of power generation (thermal and clean energy generation). Under the environmental dimension, there are common evaluation indicators for both types of power generators and differential indicators. Regarding atmospheric pollution, thermal power generation data can be used to measure the degree and level of protection and emissions reduction of an enterprise according to the air pollutants emitted from the units; the lower the emission equivalent, the higher the level of environmental sustainability. However, new forms of energy generation do not produce the air pollutants emitted by traditional thermal power generation companies, so we used the alternative indicator “air pollutant reduction through clean energy”, i.e., the reduction in air pollutants through clean energy generation compared to thermal power generation units of the same size (g/kwh). The higher the value of this indicator, the greater the reduction in emissions and the higher the level of environmental sustainability. In the selection of indicators, two types of indicators were considered: intensity analysis indicators, which measure the performance of a company in the current period, and progress analysis indicators, which measure the change in a company’s performance. The final established indicator framework is shown in Table 1.

3.3. Corporate Sustainability Index Calculation

3.3.1. Determination of Indicator Thresholds

In determining the upper limit of the indicator threshold, the optimal value of the indicator was determined using the scenario method with reference to the current practical exploration and typical experiences of domestic and international progress assessment of SDGs. In determining the lower limit of the indicator, considering that the worst value is more sensitive to outliers, the worst value after excluding the worst 2.5% of observation values of power generation industry performance was adopted as the lower limit of the indicator. The following scenarios were considered in the setting of the optimal values of the indicators.
  • The optimal value that can be achieved in the enterprise’s achievement of sustainable development, for example, 100% comprehensive utilization rate of fly ash in thermal power generation, 100% recycling and reuse rate of water and water extraction, 100% coverage rate of work-related injury insurance, and a number of occupational health and safety accidents equal to 0.
  • If the indicators are in line with the international context and the best-performing enterprises in China are also far behind the international level, the indicator values of the best-performing international enterprises were used.
  • For all other indicators in the base indicator pool, the average of the data of the three best-performing enterprises in the observed sample were used.

3.3.2. Normalization Process

To render the data comparable across indicators, each variable was reclassified from 0–100, with 0 indicating the worst performance (2.5 percentile) and 100 indicating the best sustainability performance. Therefore, all values above the upper limit were scored 100, while those below the lower limit were scored 0.
Data processing was performed using a modified deviation normalization method. After obtaining upper and lower limits for all indicators according to the method for determining indicator thresholds, the calculation of indicator variables was completed using Equations (1) and (2), depending on the polarity of the indicator (i.e., positive or negative).
Positive indicators:
x i = x i min x i max x i min x i
Negative indicators:
x i = min x i x i max x i min x i
where xi denotes the original data of the ith indicator; max (xi) and min (xi) denote the upper limit (best value) and lower limit (worst value) of the ith indicator, respectively; and xi′ is the calculated score of the ith indicator. After this calculation process was completed, all indicators were able to be compared, and a higher score meant a higher level of sustainability for the enterprise under that indicator dimension. For example, if a city scores 0.50 on an indicator, it means that the company has achieved 50% of the optimal value for that indicator under the current framework.

3.3.3. Weight Setting

The weight setting of each indicator will have an important impact on the performance and relative ranking of enterprises in the Corporate Sustainability Index. Referring to the weight setting of the SDG index, this paper adopted the same weights for the four dimensions of economic, social, environmental, and governance, as all four dimensions were considered equally important for companies to achieve sustainable development. Equal weights were also adopted for the issue dimension and the criteria dimension.

3.3.4. Aggregate Evaluation

The linear weighting function method was used to calculate the sustainability level of the topic- and criterion-level indicators in the sustainable development framework of electric power enterprises, and the corresponding calculation formula is shown in Equations (3) and (4):
f 3 x = w j f 2 x  
where j is the number of criterion indicators in each topic, and wj is the weight of different criterion indicators at each level, considering that the importance of criterion level indicators to topic indicators is equal, so each criterion level indicator was equally weighted, wj = 1/j.
f 3 x = w i x i  
where i is the number of indicators contained under a criterion indicator, wi is the weight of the indicator in the criterion-level indicator, and xi′ is the indicator score, while the formula for calculating the indicator score is shown in Equations (1) and (2). Dimension scores (f1(x)) were calculated in the same way as the criteria-level and issue-level indicators.
The composite score of the sustainability level of power enterprises was calculated in Equation (5).
f x = f 1 x   n  
where n is the number of dimensional layer indicators.
However, note that reserve data are dynamic and change with technology, mining costs, the discovery of new deposits, etc. Thus, the risk level of minerals will also change. Furthermore, this study considered only some energy technologies, and no other applications were considered. The evaluation results can only be regarded as an indication. Additionally, during risk assessment, the characteristics of extraction and production were uncertain because the most critical materials are produced as byproducts/coproducts together with other main materials.

3.4. Power Company Sustainability Dashboard

The purpose of the dashboard was to highlight sustainability dimensions and indicators that require special attention for each company and to help companies identify and act on sustainability issues as early as possible.
To assess a company’s progress with respect to a given metric, we considered four bands. The green band was delimited by the maximum achievable value for each variable (i.e., the upper limit) and the threshold for achieving the SDGs. The three bands from yellow to orange and red indicated an increasing distance from achieving sustainability. The red band was bounded at the bottom by the value of the 2.5th percentile of the distribution, with the same upper and lower limits as the Corporate Sustainability Index.
The dashboard ratings for each criterion were aggregated by estimating the two worst-performing indicators of the metrics measuring that criterion tier on the evaluation of the criterion tier. An additional rule was applied, i.e., if a criterion is rated green, the two worst-performing indicators measuring that criterion must be green; otherwise, the criterion is rated yellow. Similarly, a red rating was applied to the secondary indicator only if both of the worst-performing indicators were red. If the available indicators under the criterion were not disclosed, the dashboard color for the criterion was “gray”. If the criterion was not applicable to the company being evaluated, the color of the dashboard was “blue”.

3.5. Data and Samples

First, we set the sample to 52 companies after excluding 9 companies, aside from power generation companies, from the industry classification “Electricity, Heat Production and Supply” of the China Securities Regulatory Commission. In the second step, we screened the sample companies based on compliance indicators, and companies that did not meet the requirements of the compliance indicators were directly excluded. We believe that true sustainability is based on compliance, and only by meeting the compliance indicators requirements can we reflect a company’s autonomous will to achieve sustainable development. The compliance indicators are shown in Table 2. Finally, we eliminated companies with an excessive number of missing indicator data, and the final sample included 50 power generation companies in 2021 (E1–E50).
In the sample of this paper, in order to further analyze the impact of enterprise generation type on sustainable development performance, we classified enterprises into thermal power generation, clean energy generation, and integrated power generation, according to generation type. Among them, thermal power generation enterprises refer to those that only include one or more of the following four types of power generation: coal-fired power generation, oil-fired power generation, waste-to-energy power generation, and cogeneration. Clean energy power generation enterprises refer to those that only include nuclear power generation, hydro power generation, wind power generation, photovoltaic power generation, and biomass power generation. Integrated power generation enterprises refer to those that include both thermal power generation and clean energy power generation (see Appendix A for sample enterprises, types, and codes). The corporate sustainability data in this article were obtained from public announcements, information from the companies’ official websites, and publicly released reports, including ESG reports, sustainability reports, social responsibility reports, annual and semi-annual company reports, and environmental reports. Official websites included the China Emission Permit Management Information Platform, Publication China IPR Government Services Platform, and the official websites of local ecological and environmental bureaus.

4. Results

This section is divided into three parts. The first part introduces indicator disclosures on sustainability issues. In the second part, the results are presented to reflect the different perspectives of the different scenarios. In the last part, a correlation analysis and a robustness/sensitivity analysis of the results are carried out, thereby verifying this framework and its feasibility.

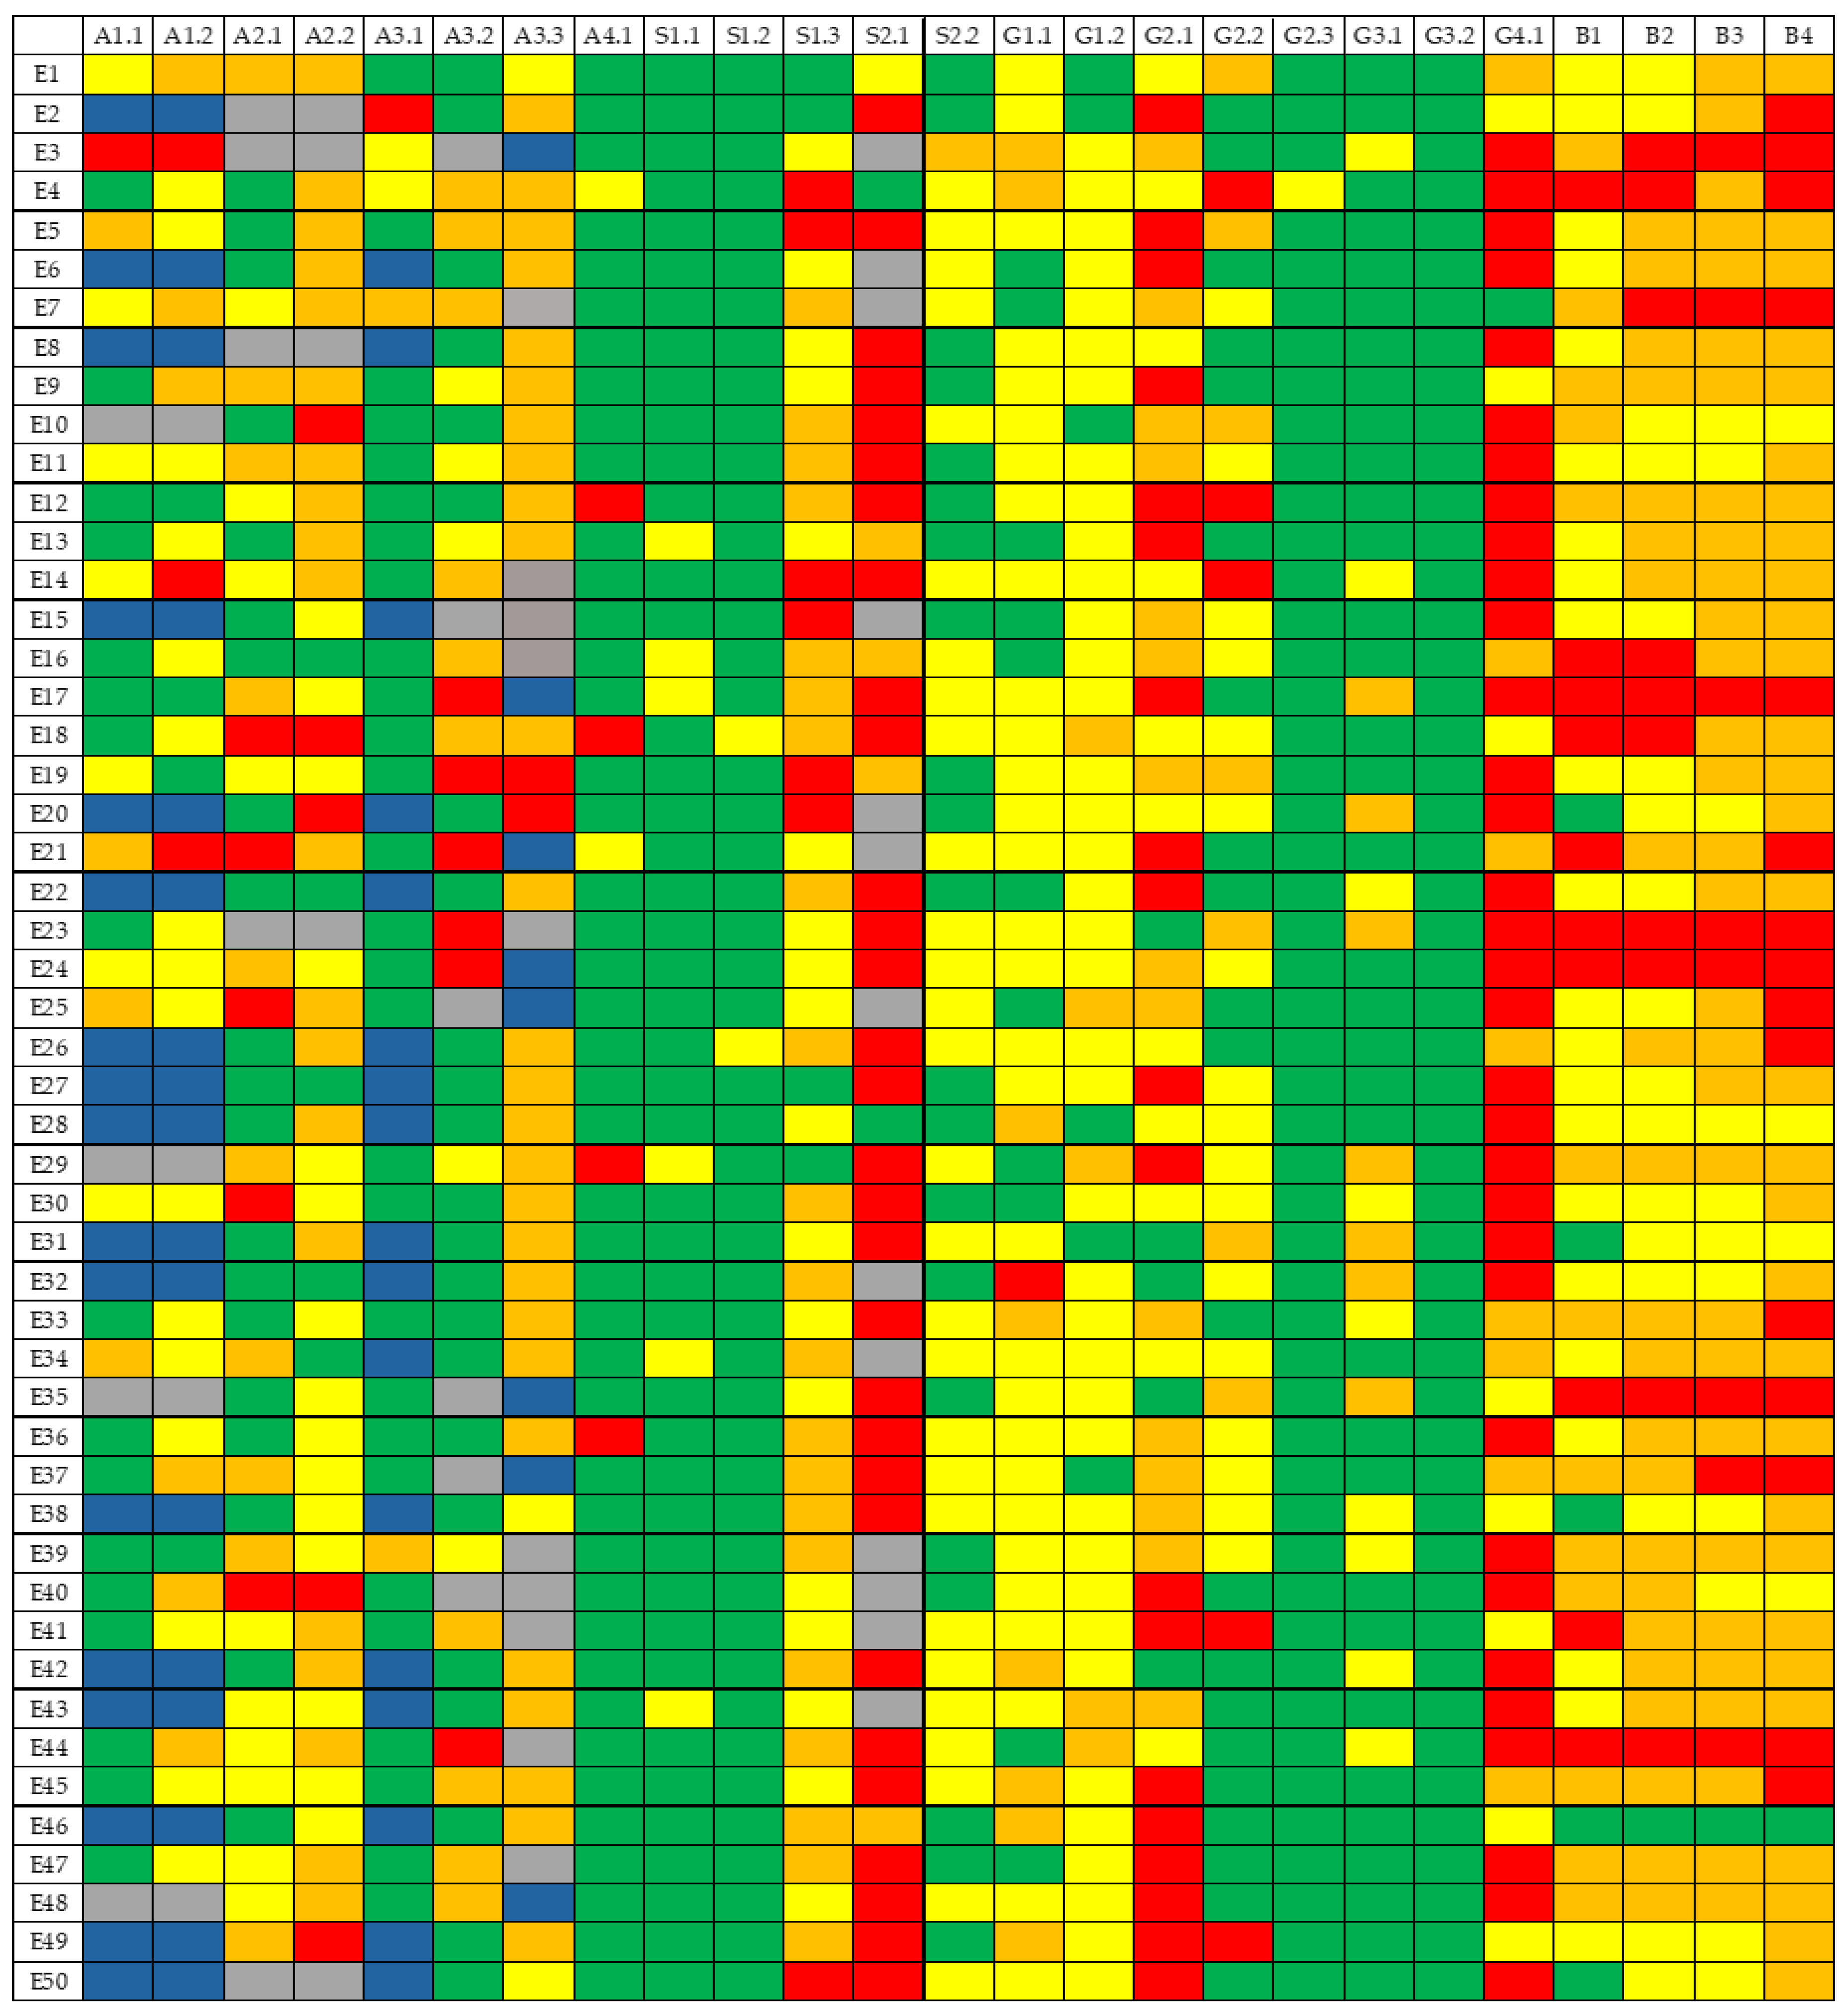
4.1. Sustainable Information Disclosure

The results of the disclosure can be seen in Figure 3, which shows that the companies had an absolute advantage in disclosing economic indicators, with a disclosure rate of more than 99%. Only E17 did not disclose an indicator under the economic dimension. The disclosure of environmental indicators was the least satisfactory, with a total disclosure rate of only 83%. Only 24 companies disclosed 100% of their environmental indicators, with the lowest disclosure rate being 41% (E35). Among the environmental dimensions, “GHG emissions and effectiveness” (A3.2) had the highest number of missing data, and “environmental risks” (A4) ranked first in terms of data completeness. Following further research on the indicators, the disclosure statuses of “GHG emission intensity” (A3.2.3) and “GHG emission reduction growth rate” (A3.2.2) were the most unsatisfactory, with undisclosed rates of the indicators of 20% and 27%. Regarding the social dimension, the undisclosed indicators were mainly concentrated on the topic of “employees” (S1). The missing data rates of “employee turnover rate” (S1.1.2), “av-erage training times of employees” (S1.2.4), and “ratio of male and female employees” (S1.3.3) were the top three, amounting to 42.3%, 27.0%, and 23.5%, respectively. Indicators under the “social” (S2) topic had a high level of disclosure (above 80%). In the governance dimension, only two indicators had a data missing rate of more than 10%: “proportion of employee supervisors” (G2.3.1:13.5%) and “patent grants per capita” (G4.1.3:28.8%). The disclosure rate of indicators in the economic dimension reached more than 99%. This may be related to the fact that many economic indicators are already used in traditional financial reporting [18]. Relevant studies have also shown that the definition of financial performance is clear and that the indicators are structured (such as return on assets and return on investment), while social and environmental performance is quite heterogeneous [18].

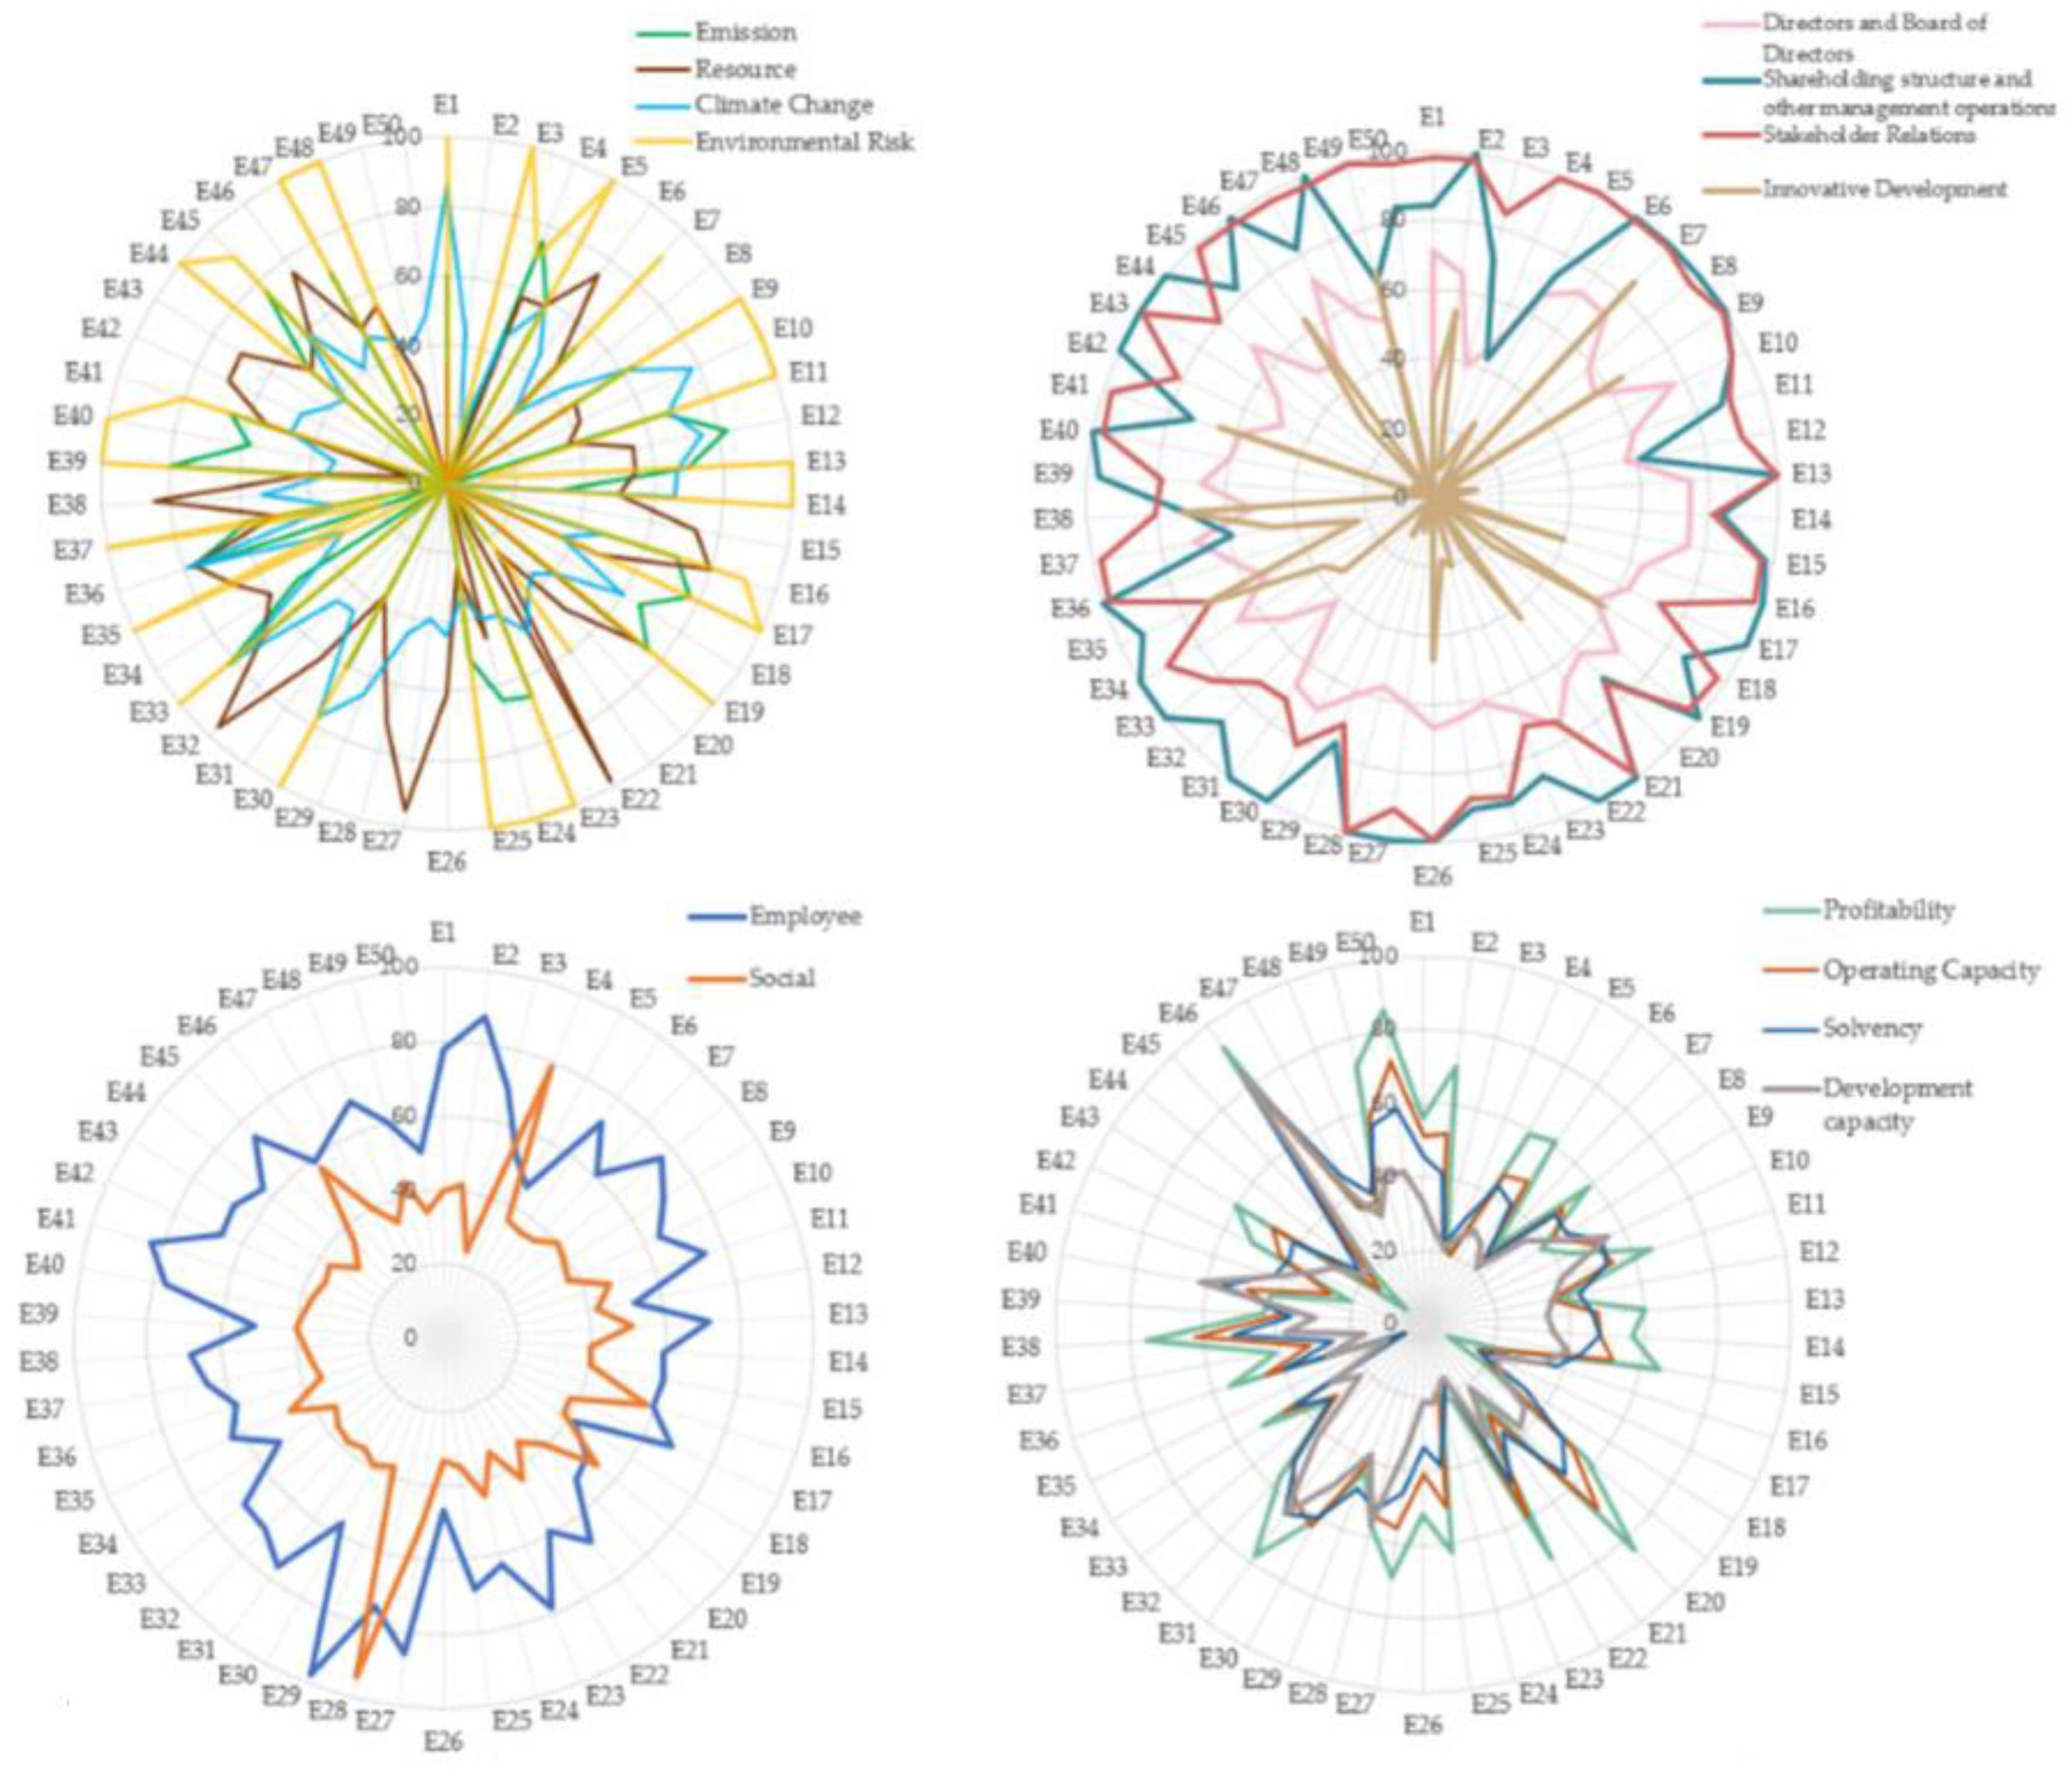
4.2. Corporate Sustainability Performance

In the evaluation framework of this paper, the governance dimension has the highest score, the economic dimension has the lowest score and the largest standard deviation, and the social dimension score has the smallest standard deviation value. Overall, the economic performance of Chinese power generation companies in 2021 was not satisfactory and varied significantly between companies, but the governance performance of Chinese power generation companies was good.
Table 3 shows that the corporate governance dimension has the highest score, the economic dimension has the lowest score and the largest standard deviation, and the social dimension score has the smallest standard deviation value. Overall, the economic performance of Chinese power generation companies in 2021 was unsatisfactory and varied greatly between companies, but the governance performance of Chinese power generation companies was good.
Figure 4 provides further analysis at the topic-level. The results of the study showed that the issues that most power companies value are “environmental risks” (A4), “stakeholder relations” (G3), and “ Shareholding structure and other management operations” (G2). Specifically, 22 of the 33 power generation companies regulated by the relevant authorities have not been penalized by the regulatory authorities for environmental issues. Half of the power companies have achieved a strong sustainability level in “shareholding structure and other management operations”, which are highly valued by power companies. In the “stakeholder relations” issue, although not many companies scored 100 points (E5, E14, E29: 100 points), the standard deviation for this topic was the smallest among all topics. This proved that, on average, power generation companies pay more attention to communication and exchange with their stakeholders. The largest number of companies scored zero on “innovation and development” (E20, E24, E28, E33, E43, E45, and EC51: 0).
Table 4 shows the overall performance of each criterion. As shown in Table 4, under the social dimension, the power industry focuses on employment (S1.1), employee health and development (S1.2), and safe and efficient production (S2.2). This can be easily explained by the fact that in the capital-intensive electricity sector, the focus is on the production process in the enterprise sector. A focus on employees not only leads to higher retention rates [67] but also increases productivity [69]. At the same time, we found that the performance of China’s power industry in terms of social contribution (S2.1) is not ideal, which has been reflected in the insufficient participation and enthusiasm of enterprises in the rural revitalization plan.
In terms of the environment, the highest-scoring criteria were environmental technology (A3.1), as almost all thermal power generation enterprises have installed desulfurization and denitrification facilities, and the operation rate of these facilities is maintained at quite a high level. China’s ultra-low-emission thermal power generation units reached about 90% of the total units in service 2021. High environmental technology scores seem to pay off, with power plants averaging over 60 on pollutant emissions (A1.1) and resource consumption (A2.1). At the same time, however, we note that companies have large standard deviations in these two areas. The high standard deviation of resource consumption is due to the high auxiliary power consumption rate and high standard coal consumption of thermal power generation compared with clean energy power generation. However, regarding pollutant emissions (A1.1) only applicable to thermal power generation enterprises, the scores of enterprises were still very different, which indicated that there is a large gap between pollutant emission levels and resource utilization levels among power generation enterprises. At the same time, we observed that although funds have been invested in the process of unit energy-saving transformation, the progress index scores of power generation enterprises, such as the “emission reduction effect” (A1.2:54.15 points) and “resource conservation” (A2.2:47.16), are not ideal. We reviewed the raw data and found that nearly half of the companies underwent negative growth in their auxiliary power consumption and coal consumption for power supply.
The type of electricity generation employed is an important factor affecting the level of sustainable development of power generation enterprises [25]. We examined the sustainability performance of firms with different generation types under each dimension and found that only environmental sustainability performance was related to a firm’s generation type. As shown in Figure 5, clean energy power generation enterprises had the highest total environmental score, while thermal power generation enterprises had the lowest total environmental score, and integrated power generation enterprises had scores that were in between.
Chinese electric power companies under the governance dimension perform poorly with respect to the two topics of equity structure (G2.1) and, especially, innovation development (G4.1). To further analyze the causes of the poorer performance in innovation development (G4.1), we examined the three indicators measuring this criterion, and the results showed that the scores of patents granted per capita (G4.1.3) were significantly higher than those of both innovation investment (G4.1.3) and innovation input (G4.1.3). This result indicates that although the Chinese power industry has made breakthroughs in key technologies and R&D innovation achievements, the Chinese power industry lacks investment in technology R&D and the cultivation of innovative talents in the development process. The Chinese power industry generally performs poorly with respect to the four criteria for measuring economic sustainability. This has resulted in economic sustainability being the worst-performing of the four dimensions.

4.3. Corporate Sustainability Index and Dashboard

The results of the enterprise sustainability index show that there is still more room for improving the sustainability level of Chinese electric power enterprises. Since the composite index is aggregated based on the geometric mean of the scores of each dimension, lower-scoring dimensions will have a greater impact on the aggregation result than the index aggregated by the arithmetic mean. According to the aggregation rules of the sustainability index, the sustainability index of Chinese power generation enterprises established in this paper is shown in Table 5.
We have created a sustainability dashboard for Chinese power generation companies at the criteria level (Figure 6). Please note that the dashboard-building rules are not based on a simple division of scores but on the methodology mentioned in Section 3.4. The purpose of the dashboard is to highlight sustainability dimensions and indicators that require special attention for each company and to help companies identify and act on sustainability issues as early as possible.

5. Discussion

In this section, we first analyze the independence of the selection of evaluation framework topics. Then, we use different weights and ranking schemes to verify the stability of the evaluation results. Finally, we delve into the causes of the research results.

5.1. Collinearity/Redundancy Analysis

To verify the independence of the framework, we analyzed the articulation (redundancy) of the four dimensions and the issues under each dimension. Table 6 and Table 7 show the pairwise Pearson correlations at the dimension and issue levels, respectively. The results show that there is no evidence of articulation (defined as >0.9) among the dimensions and issues, which proved the independence of the issue selection of the evaluation system.

5.2. Sensitivity Analysis

To further test the stability of the framework, we compared the difference between the arithmetic and geometric rankings in the corporate sustainability framework. The results are shown in Figure 7. The fluctuation between rankings was limited, with only one firm showing a difference of more than five positions between the arithmetic and geometric rankings. These differences were due to the nature of the geometric mean, which, unlike the arithmetic mean, penalizes very low scores on a particular goal.
Sensitivity testing was also performed to verify the sensitivity of the metrics created based on different weighting schemes. Monte Carlo (MC) simulations were run to test the sensitivity of the composite index to different weighting schemes. This technique uses 1000 sets of randomly generated simulated weights to calculate the possible composite indicator score for each country under different weighting schemes. This is equivalent to assuming uncertainty as to the most appropriate value for each weight assigned to construct the composite indicator.
The results are shown in Figure 8. The circles represent the scores assigned in the report, and the lines represent the range of scores possible using a random combination of 1000 weights. On average, corporate sustainability index scores varied by 13.8 percentage points upward and 9.6 percentage points downward. The weight of the goal also changed the scores and rankings of the businesses. However, no matter which weighting scheme was adopted, the top 11 enterprises always scored above the industry average, while the bottom 8 enterprises always scored below the industry average, which proved the stability of the framework established in this paper.

5.3. Analysis of Performance Causes

The results on GHG emissions disclosure diverge from those presented in the study by Eng et al. [74]. In the sample studied in this paper, GHG emissions were identified as the indicator with the highest rate of missing information, whereas Eng et al. found that GHG emissions constitute the indicator with the highest rate of disclosure by U.S. power producers. This is because although China has mandatory requirements for companies to disclose carbon emissions information, the relevant policies started late. On 16 July 2021, power generators were mandated to be included in the Chinese carbon emissions trading system in order to verify information related to the GHG emissions of power generators. Since the data node used in this paper is the end of 2021, the carbon information disclosure of enterprises is not satisfactory due to the lag in policy implementation.
The evaluation results show that the top-scoring issues were “Environmental risks”, “Shareholding structure and other management operations”, and “Stakeholder Relations”. These phenomena can be explained by legitimacy theory, in which the rise and fall of enterprises depend on the level of tolerance of their behavior in society, and only socially beneficial enterprises are allowed to operate. The Chinese government has issued a number of policy documents to monitor the environmental impacts of key polluters, which can face fines for negative behavior such as failing environmental impact assessment or exceeding pollutant emissions standards. This institutional environment has caused China’s power enterprises to pay particular attention to the environmental risks of enterprises. At the same time, the China Securities Regulatory Commission has clear regulations for the governance behavior and structure of listed companies. These rules and regulations constrain corporate governance behavior. Similarly, Sueyoshi and Goto believe that better regulation of poor power generators’ output and the implementation of strict policies are important to improve the performance of power companies [79].
As a response to unsatisfactory environmental sustainability performance, we distributed the electricity types to analyze the cause of this deficit. The economic losses of coal and electricity enterprises were mainly due to the periodic imbalance between the supply and demand of thermal coal in 2021, when the coal price reached an all-time high. Due to the irrational rise in thermal coal prices, fuel costs have risen sharply, and coal-fired power enterprises and cogeneration enterprises have continued to suffer substantial losses. For hydropower enterprises, due to factors such as less precipitation in the main basins in flood season and the rapid increase in power consumption, hydropower generation has shown negative growth, and the economic performance of hydropower enterprises is poor. Regarding wind and solar power, the reasons for their poor economic performance are twofold: First, the power industry is over capacity. In recent years, the average growth of China’s electricity demand has slowed, while the installed capacity of electric power in China is still growing rapidly. The growth rate of power supply capacity is faster than that of power demand, and the overall power generation capacity of wind power and photovoltaic power is limited. Second, the existing power operation management mechanism does not meet the needs of large-scale wind power and solar power grid connection. Most new energy power plants are concentrated in remote areas such as Xinjiang, Gansu, and Inner Mongolia, which are rich in wind energy and solar energy resources but lack the presence of a power load center. The construction speed and scale of power transmission and transformation channels for transmitting electric energy to domestic-power-load-concentrated areas cannot keep up with the construction speed and scale of forms of green energy such as wind power.
In the analysis of the sustainable development performance of companies’ different power generation types, Wang et al. applied the material element extension model to classify Chinese power enterprises into five categories, namely, thermal power, nuclear power, hydropower, wind power, and photovoltaic power, and constructed a sustainable development evaluation system for Chinese power enterprises consisting of 23 indicators [25]. This article is based on the coupling of the SDGs and ESG indicators and establishes a sustainable development evaluation framework for China’s power generation industry consisting of four dimensions and 75 indicators. We compared the environmental sustainability performance of enterprises with Wang’s research and found that although different methods were used to construct evaluation frameworks, the sustainable development level of new-energy-based power generation is always higher than that of thermal power generation. To improve the sustainability of thermal power and narrow the gap with clean energy, thermal power generation enterprises need to optimize the structures of their combustion systems and improve their energy utilization rates and CO2 capture technology, desulfurization technology, and denitrification technology in order to reduce their emission of pollutants.

6. Conclusions

This study constructed a sustainability evaluation framework for the power generation industry in China based on the SDG index and the dashboard-building method to evaluate the sustainability level of China’s power generation industry. The main findings are as follows:
  • A sustainable development evaluation index system for the power generation industry, consisting of a dimensional layer, an issue layer, a standard layer, and an indicator layer, was constructed. In order to comprehensively and systematically evaluate the sustainable development level of the power generation industry, an evaluation index system of 75 indicators was constructed with respect to four dimensions: economic, environmental, governance, and social. Compliance indicators were also used to eliminate companies that had no will to achieve sustainable development.
  • The status of sustainability disclosure in China’s electric power industry was analyzed. Overall, Chinese power companies need to improve their environmental, social, and governance disclosures. At the dimensional level, the environmental dimension showed the severest lack of information, with a missing rate of 17.38%. The disclosure of the social dimension was better, but companies should still focus on quantitative information disclosure related to employee issues (missing rate: 30.93%) and rural revitalization (missing rate: 24.00%). In terms of corporate governance, enterprises should strengthen the information disclosure of innovation investment and achievements; the completeness of indicators under the economic dimension reached over 99%. Regulators can set stricter disclosure regulations to enhance corporate information disclosure. Enterprises should increase investor participation and enhance the degree to which the profound notion of corporate sustainability through high corporate governance levels is understood in order to promote the improvement of corporate disclosure.
  • Considering the target of the sustainable development of electric power enterprises, a sustainable development evaluation index and indicator board for China’s electric power industry were established by drawing on the practical exploration and typical experience of SDG progress assessment. Economic sustainability is the dimension that Chinese power enterprises need to pay special attention to. Innovation investment, resource saving, and social welfare level constrain the overall sustainability level of China’s electric power industry. In conjunction with the results of this research, companies have actively disclosed the schemes of their environmental protection business, increased investment in environmental protection, vigorously promoted the transformation of low-carbon clean energy, and increased their low-carbon clean energy share. At the same time, companies should accelerate the modernization of the governance system and governance capacity and promote the soundness of the modern enterprise system, the rule of law, and risk control systems.
  • A robustness analysis was conducted on the framework system established in this paper. Firstly, an independence analysis was conducted for the selection of sustainable development topics, and the results showed that there was no significant correlation between the dimensions of the framework established in this paper and the topics. Second, the sensitivity of the framework was verified. Through running Monte Carlo (MC) simulations to assign different weighting schemes to the indicators, the results showed that the evaluation framework established in this study had good stability.
  • Although this framework used 75 indicators in four dimensions, namely, environmental, social, governance, and economic, some of the more important indicators for sustainable development were not selected due to the availability of indicators, such as water use and conservation, wastewater discharge, land use and conservation, other energy (e.g., oil) consumption indicators, carbon emission identification and measurement, green office indicators, species diversity conservation, etc. A more comprehensive evaluation of corporate sustainability would be based on a deeper understanding of sustainability and the more comprehensive disclosure of sustainability information. This paper only analyzed the sustainability performance in 2021; sustainability performance in previous years was not studied, and a future trend analysis could be conducted on sustainability performance in recent years.

Author Contributions

Data curation, R.D. and Z.L.; formal analysis, S.X.; investigation, R.D. and C.S.; supervision, C.S.; writing—original draft, R.D.; writing—review and editing, C.S. All authors have read and agreed to the published version of the manuscript.

Funding

This work was supported by the National key research and development program (NO. 2022YFC3802902) and the National Natural Science Foundation of China (SDGs Localized Assessment Technology Methodology and Application) (No. 42071292), The authors appreciate the insightful and constructive comments of each reviewer.

Institutional Review Board Statement

Not applicable.

Informed Consent Statement

Not applicable.

Data Availability Statement

The data used to support the findings of this study will be made available by the corresponding authors upon request.

Acknowledgments

The authors would like to thank the anonymous reviewers and the editor for their constructive comments and suggestions for this paper.

Conflicts of Interest

The authors declare no conflict of interest.

Appendix A

Sample enterprises, types, and codes.
Table A1. Sample enterprises, types, and codes.
Company NamePower Generation TypeCompany Code
GUANGDONG BAOLIHUA NEW ENERGY STOCK CO., LTD.Integrated power generationE1
SICHUAN CHUANTOU ENERGY CO., LTD.Clean energy generationE2
DALIAN THERMAL POWER CO., LTD.Thermal power generationE3
DATANGINTERNATIONALPOWERGENERATIONCO., LTD.Integrated power generationE4
FUJIAN FUNENG CO., LTD.Integrated power generationE5
GEPIC ENERGY DEVELOPMENT CO., LTD.Clean energy generationE6
JIANGXI GANNENG CO., LTD.Integrated power generationE7
SICHUAN GUANGAN AAAPUBLIC CO., LTD.Clean energy generationE8
GUANGZHOU DEVELOPMENT GROUP INCORPORATED.Integrated power generationE9
GUANGXI GUIDONG ELECTRIC POWER CO., LTD.Integrated power generationE10
GUANGXI GUIGUAN ELECTRIC POWER CO., LTD.Integrated power generationE11
GD POWER DEVELOPMENT CO., LTD.Integrated power generationE12
SDIC POWER HOLDINGS CO., LTD.Integrated power generationE13
HUBEI ENERGY GROUP CO., LTD.Integrated power generationE14
HUNAN DEVELOPMENT GROUP CO., LTD.Clean energy generationE15
HUADIAN POWER INTERNATIONAL CORPORATION LIMITED.Integrated power generationE16
HUADIAN ENERGY COMPANY LIMITED.Thermal power generationE17
HUANENG POWER INTERNATIONAL, INC.Integrated power generationE18
JILIN ELECTRIC POWER CO., LTD.Integrated power generationE19
NINGXIAJIAZE RENEWABLES CORPORATION LIMITED.Clean energy generationE20
JOINTO ENERGY INVESTMENT CO., LTD. HEBEI.Thermal power generationE21
CECEP WIND-POWER CORPORATION.Clean energy generationE22
SHENYANG JINSHAN ENERGY CO., LTDIntegrated power generationE23
BEIJING JINGNENG POWER CO., LTD.Thermal power generationE24
LUENMEIQUANTUMCO., LTD.Thermal power generationE25
GUANGDONG MEIYANJIXIANG HYDROPOWER CO., LTD.Clean energy generationE26
FUJIAN MINDONG ELECTRIC POWER LIMITED COM.Clean energy generationE27
SICHUAN MINGXING ELECTRIC POWER CO., LTD.Clean energy generationE28
INNER MONGOLIA MENGDIAN HUANENG THERMAL POWER. Integrated power generationE29
NINGBO ENERGY GROUP CO., LTD.Integrated power generationE30
GUIZHOU QIANYUAN POWER CO., LTD.Clean energy generationE31
CHONGQING THREE GORGES WATER CONSERVANCY AND ELECTRIC POWER CO., LTD.Clean energy generationE32
SHANGHAI ELECTRIC POWER CO., LTD.Integrated power generationE33
GUANGDONG SHAONENG GROUP CO., LTD.Integrated power generationE34
SHENZHEN NANSHAN POWER CO., LTD.Thermal power generationE35
SHENZHEN ENERGY GROUP CO., LTD.Integrated power generationE36
GUANGZHOU HENGYUN ENTERPRISES HOLDING LTD.Thermal power generationE37
CECEP SOLAR ENERGY CO., LTD.Clean energy generationE38
XINJIANG TIANFU ENERGY CO., LTD.Integrated power generationE39
TOP ENERGY COMPANY LTD. SHANXI.Thermal power generationE40
AN HUI WENERGY COMPANY LIMITED.Thermal power generationE41
SICHUAN XICHANG ELECTRIC POWER CO., LTD.Clean energy generationE42
NING XIA YIN XING ENERGY CO.LTD.Clean energy generationE43
HENAN YUNENG HOLDINGS CO., LTD.Integrated power generationE44
GUANGDONG ELECTRIC POWER DEVELOPMENT CO., LTD.Integrated power generationE45
CHINA YANGTZE POWER CO., LTD.Clean energy generationE46
CHN ENERGY CHANGYUAN ELECTRIC POWER CO., LTD.Integrated power generationE47
ZHEJIANG ZHENENG ELECTRIC POWER CO., LTD.Thermal power generationE48
CHINA NATIONAL NUCLEAR POWER CO., LTD.Clean energy generationE49
ZHONGMIN ENERGY CO., LTD.Clean energy generationE50

References

  1. Sun, L.; Cui, H.; Ge, Q. Will China Achieve Its 2060 Carbon Neutral Commitment from the Provincial Perspective? Adv. Clim. Chang. Res. 2022, 13, 169–178. [Google Scholar] [CrossRef]
  2. Qi, L.; Lin, X.; Shi, X.; Zhang, Y.; Pan, H.; Sharp, B. Feed-in Tariffs and the Carbon Emission Trading Scheme under China’s Peak Emission Target: A Dynamic CGE Analysis for the Development of Renewable Electricity. J. Environ. Manag. 2023, 335, 117535. [Google Scholar] [CrossRef]
  3. Qazi, U.; Jahanzaib, M. An Integrated Sectoral Framework for the Development of Sustainable Power Sector in Pakistan. Energy Rep. 2018, 4, 376–392. [Google Scholar] [CrossRef]
  4. Li, T.-T.; Wang, K.; Sueyoshi, T.; Wang, D.D. ESG: Research Progress and Future Prospects. Sustainability 2021, 13, 11663. [Google Scholar] [CrossRef]
  5. Tamimi, N.; Sebastianelli, R. Transparency among S&P 500 Companies: An Analysis of ESG Disclosure Scores. Manag. Decis. 2017, 55, 1660–1680. [Google Scholar]
  6. Plastun, A.; Bouri, E.; Gupta, R.; Ji, Q. Price Effects after One-Day Abnormal Returns in Developed and Emerging Markets: ESG versus Traditional Indices. North Am. J. Econ. Financ. 2022, 59, 101572. [Google Scholar]
  7. Gibson Brandon, R.; Krueger, P.; Schmidt, P.S. ESG Rating Disagreement and Stock Returns. Financ. Anal. J. 2021, 77, 104–127. [Google Scholar] [CrossRef]
  8. Escrig-Olmedo, E.; Fernández-Izquierdo, M.Á.; Ferrero-Ferrero, I.; Rivera-Lirio, J.M.; Muñoz-Torres, M.J. Rating the Raters: Evaluating How ESG Rating Agencies Integrate Sustainability Principles. Sustainability 2019, 11, 915. [Google Scholar] [CrossRef]
  9. Barnett, M.L.; Salomon, R.M. Beyond Dichotomy: The Curvilinear Relationship between Social Responsibility and Financial Performance. Strateg. Manag. J. 2006, 27, 1101–1122. [Google Scholar]
  10. Manchiraju, H.; Rajgopal, S. Does Corporate Social Responsibility (CSR) Create Shareholder Value? Evidence from the Indian Companies Act 2013. J. Account. Res. 2017, 55, 1257–1300. [Google Scholar]
  11. Roblek, V.; Pejić Bach, M.; Meško, M.; Kresal, F. Corporate Social Responsibility and Challenges for Corporate Sustainability in First Part of the 21st Century; Firenze University Press: Florence, Italy, 2019; pp. 31–46. [Google Scholar]
  12. Antolín-López, R.; Delgado-Ceballos, J.; Montiel, I. Deconstructing Corporate Sustainability: A Comparison of Different Stakeholder Metrics. J. Clean. Prod. 2016, 136, 5–17. [Google Scholar]
  13. Searcy, C. Updating Corporate Sustainability Performance Measurement Systems. Meas. Bus. Excell. 2011, 15, 44–56. [Google Scholar]
  14. Pranugrahaning, A.; Donovan, J.D.; Topple, C.; Masli, E.K. Corporate Sustainability Assessments: A Systematic Literature Review and Conceptual Framework. J. Clean. Prod. 2021, 295, 126385. [Google Scholar] [CrossRef]
  15. San Ong, T.; Teh, B.H.; Ang, Y.W. The Impact of Environmental Improvements on the Financial Performance of Leading Companies Listed in Bursa Malaysia. Int. J. Trade Econ. Financ. 2014, 5, 386. [Google Scholar]
  16. Olsthoorn, X.; Tyteca, D.; Wehrmeyer, W.; Wagner, M. Environmental Indicators for Business: A Review of the Literature and Standardisation Methods. J. Clean. Prod. 2001, 9, 453–463. [Google Scholar]
  17. Wartick, S.L.; Cochran, P.L. The Evolution of the Corporate Social Performance Model. Acad. Manag. Rev. 1985, 10, 758–769. [Google Scholar]
  18. Delmas, M.; Blass, V.D. Measuring Corporate Environmental Performance: The Trade-offs of Sustainability Ratings. Bus. Strategy Environ. 2010, 19, 245–260. [Google Scholar]
  19. Wood, D.J. Measuring Corporate Social Performance: A Review. Int. J. Manag. Rev. 2010, 12, 50–84. [Google Scholar]
  20. Schaltegger, S.; Lüdeke-Freund, F.; Hansen, E.G. Business Cases for Sustainability: The Role of Business Model Innovation for Corporate Sustainability. Int. J. Innov. Sustain. Dev. 2012, 6, 95–119. [Google Scholar]
  21. Delai, I.; Takahashi, S. Sustainability Measurement System: A Reference Model Proposal. Soc. Responsib. J. 2011, 7, 438–471. [Google Scholar]
  22. Rahdari, A.H.; Rostamy, A.A.A. Designing a General Set of Sustainability Indicators at the Corporate Level. J. Clean. Prod. 2015, 108, 757–771. [Google Scholar]
  23. Nikolaou, I.E.; Tsalis, T.A.; Evangelinos, K.I. A Framework to Measure Corporate Sustainability Performance: A Strong Sustainability-Based View of Firm. Sustain. Prod. Consum. 2019, 18, 1–18. [Google Scholar] [CrossRef]
  24. Mayorova, E. Corporate Social Responsibility Disclosure: Evidence from the European Retail Sector. Entrep. Sustain. Issues 2019, 7, 891–905. [Google Scholar] [CrossRef]
  25. Wang, Y.; Yang, J.; Zhou, M.; Zhang, D.; Song, F.; Dong, F.; Zhu, J.; Liu, L. Evaluating the Sustainability of China’s Power Generation Industry Based on a Matter-Element Extension Model. Util. Policy 2021, 69, 101166. [Google Scholar] [CrossRef]
  26. Deng, Y.; Zou, S.; You, D. Financial Performance Evaluation of Nuclear Power-Related Enterprises from the Perspective of Sustainability. Environ. Sci. Pollut. Res. 2020, 27, 11349–11363. [Google Scholar] [CrossRef]
  27. Sarangi, G.K.; Mishra, A.; Chang, Y.; Taghizadeh-Hesary, F. Indian electricity sector, energy security and sustainability: An empirical assessment. Energy Policy 2019, 135, 110964. [Google Scholar] [CrossRef]
  28. Sartori, S.; Witjes, S.; Campos, L.M.S. Sustainability Performance for Brazilian Electricity Power Industry: An Assessment Integrating Social, Economic and Environmental Issues. Energy Policy 2017, 111, 41–51. [Google Scholar] [CrossRef]
  29. Bachev, H. Governance of Agrarian Sustainability. Adv. Plants Agric. Res. 2018, 8, 1. [Google Scholar]
  30. Bosselmann, K.; Engel, R.; Taylor, P. Governance for Sustainability: Issues, Challenges, Successes; IUCN: Gland, Switzerland, 2008; ISBN 2-8317-1105-3. [Google Scholar]
  31. Simberova, I.; Kocmanova, A.; Nemecek, P. Corporate Governance Performance Measurement–Key Performance Indicators. Econ. Manag. 2012, 17, 1585–1593. [Google Scholar]
  32. Shanaev, S.; Ghimire, B. When ESG Meets AAA: The Effect of ESG Rating Changes on Stock Returns. Financ. Res. Lett. 2022, 46, 102302. [Google Scholar]
  33. Eliwa, Y.; Aboud, A.; Saleh, A. ESG Practices and the Cost of Debt: Evidence from EU Countries. Crit. Perspect. Account. 2021, 79, 102097. [Google Scholar]
  34. Zhang, Q.; Loh, L.; Wu, W. How Do Environmental, Social and Governance Initiatives Affect Innovative Performance for Corporate Sustainability? Sustainability 2020, 12, 3380. [Google Scholar]
  35. Miralles-Quirós, M.M.; Miralles-Quirós, J.L.; Valente Gonçalves, L.M. The Value Relevance of Environmental, Social, and Governance Performance: The Brazilian Case. Sustainability 2018, 10, 574. [Google Scholar]
  36. Yoon, B.; Lee, J.H.; Byun, R. Does ESG Performance Enhance Firm Value? Evidence from Korea. Sustainability 2018, 10, 3635. [Google Scholar]
  37. Gyönyörová, L.; Stachoň, M.; Stašek, D. ESG Ratings: Relevant Information or Misleading Clue? Evidence from the S&P Global 1200. J. Sustain. Financ. Investig. 2021, 1–35. [Google Scholar] [CrossRef]
  38. Abhayawansa, S.; Tyagi, S. Sustainable Investing: The Black Box of Environmental, Social, and Governance (ESG) Ratings. J. Wealth Manag. 2021, 24, 49–54. [Google Scholar]
  39. Berg, F.; Koelbel, J.F.; Rigobon, R. Aggregate Confusion: The Divergence of ESG Ratings. Rev. Financ. 2022, 26, 1315–1344. [Google Scholar]
  40. Escrig-Olmedo, E.; Munoz-Torres, M.J.; Fernandez-Izquierdo, M.A. Socially Responsible Investing: Sustainability Indices, ESG Rating and Information Provider Agencies. Int. J. Sustain. Econ. 2010, 2, 442–461. [Google Scholar]
  41. Windolph, S.E. Assessing Corporate Sustainability through Ratings: Challenges and Their Causes. J. Environ. Sustain. 2011, 1, 5. [Google Scholar]
  42. Escrig-Olmedo, E.; Muñoz-Torres, M.J.; Fernández-Izquierdo, M.Á.; Rivera-Lirio, J.M. Measuring Corporate Environmental Performance: A Methodology for Sustainable Development. Bus. Strategy Environ. 2017, 26, 142–162. [Google Scholar]
  43. Liu, M. Quantitative ESG Disclosure and Divergence of ESG Ratings. Front. Psychol. 2022, 13, 936798. [Google Scholar] [CrossRef]
  44. O’Riordan, T. The Challenge for Environmentalism. In New Models in Geography; Routledge: Abingdon, UK, 2002; Volume 1, pp. 100–127. ISBN 0-203-40053-4. [Google Scholar]
  45. Landrum, N.E. Stages of Corporate Sustainability: Integrating the Strong Sustainability Worldview. Organ. Environ. 2018, 31, 287–313. [Google Scholar] [CrossRef]
  46. Escrig-Olmedo, E.; Rivera-Lirio, J.M.; Muñoz-Torres, M.J.; Fernández-Izquierdo, M.Á. Integrating Multiple ESG Investors’ Preferences into Sustainable Investment: A Fuzzy Multicriteria Methodological Approach. J. Clean. Prod. 2017, 162, 1334–1345. [Google Scholar]
  47. Rajesh, R. Exploring the Sustainability Performances of Firms Using Environmental, Social, and Governance Scores. J. Clean. Prod. 2020, 247, 119600. [Google Scholar] [CrossRef]
  48. Jayachandran, S.; Kalaignanam, K.; Eilert, M. Product and Environmental Social Performance: Varying Effect on Firm Performance. Strateg. Manag. J. 2013, 34, 1255–1264. [Google Scholar]
  49. Chen, Y.-C.; Hung, M.; Wang, Y. The Effect of Mandatory CSR Disclosure on Firm Profitability and Social Externalities: Evidence from China. J. Account. Econ. 2018, 65, 169–190. [Google Scholar]
  50. Hull, C.E.; Rothenberg, S. Firm Performance: The Interactions of Corporate Social Performance with Innovation and Industry Differentiation. Strateg. Manag. J. 2008, 29, 781–789. [Google Scholar]
  51. Saraswat, S.K.; Digalwar, A.K. Empirical Investigation and Validation of Sustainability Indicators for the Assessment of Energy Sources in India. Renew. Sustain. Energy Rev. 2021, 145, 111156. [Google Scholar] [CrossRef]
  52. Desa, U.N. Transforming Our World: The 2030 Agenda for Sustainable Development. J. Public Health Policy 2016, 37, 13–31. [Google Scholar]
  53. Maia, R.G.T.; Olimpio Pereira Junior, A.; Moreira Pessanha, J.F.; Garcia, K.C. Methodology for Setting Corporate Sustainability Targets. J. Clean. Prod. 2022, 369, 133359. [Google Scholar] [CrossRef]
  54. Betti, G.; Consolandi, C.; Eccles, R.G. The Relationship between Investor Materiality and the Sustainable Development Goals: A Methodological Framework. Sustainability 2018, 10, 2248. [Google Scholar]
  55. Consolandi, C.; Phadke, H.; Hawley, J.; Eccles, R.G. Material ESG Outcomes and SDG Externalities: Evaluating the Health Care Sector’s Contribution to the SDGs. Organ. Environ. 2020, 33, 511–533. [Google Scholar]
  56. Khaled, R.; Ali, H.; Mohamed, E.K.A. The Sustainable Development Goals and Corporate Sustainability Performance: Mapping, Extent and Determinants. J. Clean. Prod. 2021, 311, 127599. [Google Scholar] [CrossRef]
  57. Phadke, H.; DeMates, L. Investing with the Sustainable Development Goals; White Paper TruValue Labs: San Francisco, CA, USA, 2017. [Google Scholar]
  58. Nikolaou, I.E.; Kazantzidis, L. Sustainable Consumption Index/Label to Reduce Information Asymmetry among Consumers and Producers. Sustain. Prod. Consum. 2016, 6, 51–61. [Google Scholar]
  59. Global Reporting Initiative. Linking the SDGs and the GRI Standards; Global Reporting Initiative: Amsterdam, The Netherlands, 2020. [Google Scholar]
  60. Medel-González, F.; García-Ávila, L.; Acosta-Beltrán, A.; Hernández, C. Measuring and Evaluating Business Sustainability: Development and Application of Corporate Index of Sustainability Performance. In Sustainability Appraisal: Quantitative Methods and Mathematical Techniques for Environmental Performance Evaluation; Springer: Berlin/Heidelberg, Germany, 2013; pp. 33–61. [Google Scholar]
  61. Ioannou, I.; Serafeim, G. The Consequences of Mandatory Corporate Sustainability Reporting; Harvard Business School Research Working Paper No. 11-100; Oxford University Press: Oxford, UK, 2017; pp. 11–100. [Google Scholar]
  62. Hediger, W. Reconciling “Weak” and “Strong” Sustainability. Int. J. Soc. Econ. 1999, 26, 1120–1144. [Google Scholar]
  63. Manrique, S.; Martí-Ballester, C.-P. Analyzing the Effect of Corporate Environmental Performance on Corporate Financial Performance in Developed and Developing Countries. Sustainability 2017, 9, 1957. [Google Scholar]
  64. Cheng, B.; Ioannou, I.; Serafeim, G. Corporate Social Responsibility and Access to Finance. Strateg. Manag. J. 2014, 35, 1–23. [Google Scholar]
  65. Alsayegh, M.F.; Abdul Rahman, R.; Homayoun, S. Corporate Economic, Environmental, and Social Sustainability Performance Transformation through ESG Disclosure. Sustainability 2020, 12, 3910. [Google Scholar] [CrossRef]
  66. Balakrishnan, R.; Sprinkle, G.B.; Williamson, M.G. Contracting Benefits of Corporate Giving: An Experimental Investigation. Account. Rev. 2011, 86, 1887–1907. [Google Scholar]
  67. Carnahan, S.; Kryscynski, D.; Olson, D. When Does Corporate Social Responsibility Reduce Employee Turnover? Evidence from Attorneys before and after 9/11. Acad. Manag. J. 2017, 60, 1932–1962. [Google Scholar]
  68. Farooq, O.; Rupp, D.E.; Farooq, M. The Multiple Pathways through Which Internal and External Corporate Social Responsibility Influence Organizational Identification and Multifoci Outcomes: The Moderating Role of Cultural and Social Orientations. Acad. Manag. J. 2017, 60, 954–985. [Google Scholar]
  69. Brammer, S.; Millington, A. Does It Pay to Be Different? An Analysis of the Relationship between Corporate Social and Financial Performance. Strateg. Manag. J. 2008, 29, 1325–1343. [Google Scholar]
  70. Hussainey, K.; Salama, A. The Importance of Corporate Environmental Reputation to Investors. J. Appl. Account. Res. 2010, 11, 229–241. [Google Scholar]
  71. Xie, J.; Nozawa, W.; Yagi, M.; Fujii, H.; Managi, S. Do Environmental, Social, and Governance Activities Improve Corporate Financial Performance? Bus. Strategy Environ. 2019, 28, 286–300. [Google Scholar]
  72. Ludwig, P.; Sassen, R. Which Internal Corporate Governance Mechanisms Drive Corporate Sustainability? J. Environ. Manag. 2022, 301, 113780. [Google Scholar] [CrossRef]
  73. Zhao, Z.; Yan, H.; Zuo, J.; Tian, Y.; Zillante, G. A Critical Review of Factors Affecting the Wind Power Generation Industry in China. Renew. Sustain. Energy Rev. 2013, 19, 499–508. [Google Scholar] [CrossRef]
  74. Eng, L.L.; Fikru, M.G. Are US Electric Utilities Improving Their Sustainability Disclosures and Performance? Electr. J. 2022, 35, 107221. [Google Scholar] [CrossRef]
  75. Lee, M.; Lee, S. Evaluating Internal Technological Capabilities in Energy Companies. Energies 2016, 9, 145. [Google Scholar] [CrossRef]
  76. Fan, J.-L.; Zhang, H.; Zhang, X. Unified Efficiency Measurement of Coal-Fired Power Plants in China Considering Group Heterogeneity and Technological Gaps. Energy Econ. 2020, 88, 104751. [Google Scholar] [CrossRef]
  77. Sheveleva, G.I. Corporate Governance in Generating Companies of the Russian Electric Power Industry in the Context of ESG Agenda. Glob. Energy Interconnect. 2022, 5, 512–523. [Google Scholar] [CrossRef]
  78. Cornet, Y.; Gudmundsson, H. Building a Metaframework for Sustainable Transport Indicators: Review of Selected Contributions. Transp. Res. Rec. 2015, 2531, 103–112. [Google Scholar]
  79. Sueyoshi, T.; Goto, M. Environmental assessment by DEA radial measurement: US coal-fired power plants in ISO (Independent System Operator) and RTO (Regional Transmission Organization). Energy Econ. 2012, 34, 663–676. [Google Scholar]
Figure 1. Establishment of the indicator framework and the ideas for establishing the sustainable development index.
Sustainability 15 08960 g001
Figure 2. Establishment of the indicator database and indicator selection process.
Sustainability 15 08960 g002
Figure 3. Disclosure of enterprise indicators according to dimension.
Sustainability 15 08960 g003
Figure 4. Companies’ scores at the topic level.
Sustainability 15 08960 g004
Figure 5. Criteria tier scores of companies according to generation type.
Sustainability 15 08960 g005
Figure 6. Criteria-level corporate sustainability scores and dashboards.
Sustainability 15 08960 g006
Figure 7. Difference between arithmetic and geometric rankings.
Sustainability 15 08960 g007
Figure 8. Monte Carlo simulation: Impact of random combinations of weights for each indicator on the total index score.
Sustainability 15 08960 g008
Table 1. Sustainable development indicator framework for power generation enterprises.
DimensionsTopicsCriteriaIndicators
EnvironmentEmission (A1)Emission intensity (A1.1)NOx emission intensity (A1.1.1). Soot emission intensity (A1.1.2). Sulfur dioxide emission intensity (A1.1.3).
Emissions Reduction Effectiveness (A1.2)NOx emission intensity reduction rate (A1.2.1). Reduction rate of soot emission intensity (A1.2.2). Sulfur dioxide emission intensity reduction rate (A1.2.3).
Resource (A2)Resource consumption (A1.3)Electricity consumption rate of power plants (A2.1.1). Standard coal consumption for electricity supply (A2.1.2).
Resource conservation (A2.1)Power plant electricity consumption rate reduction rate (A2.2.1). Reduction rate of standard coal consumption for electricity supply (A2.2.2). Comprehensive utilization rate of fly ash (A2.2.3). Comprehensive utilization rate of slag (A2.2.4).
Climate Change (A3)Green technology (A2.2)Operating rate of desulfurization facilities (A3.1.1). Operation rate of denitrification facilities (A3.1.2).
Greenhouse gas emissions and effectiveness (A3.1)CO2 reduction through non-fossil energy generation (A3.2.1). Greenhouse gas emissions reduction growth rate (A3.2.2). Carbon dioxide emission intensity (A3.2.3).
Green electricity (A3.2)Standard coal saved through non-fossil energy generation (A3.3.1). Sulfur dioxide reduction through non-fossil energy generation (A3.3.2). NOx reduction from over non-fossil energy generation (A3.3.3).
Environmental Risks (A4)Negative information (A4.1)Number of times punished by relevant regulatory authorities due to environmental problems (A4.1.1).
SocialEmployee (S1)Employment stability (S1.1)Labor-contract-signing rate (S1.1.1). Employee turnover rate (S1.1.2).
Occupational health and employee development (S1.2)Employee medical examination rate (S1.2.1). Social Insurance Coverage (S1.2.2). Number of employee workplace accidents (S1.2.3). Average number of training sessions for employees (S1.2.4).
Equality and diversity (S1.3)Percentage of ethnic minority employees (S1.3.1). Percentage of female managers (S1.3.2). Ratio of male to female employees (S1.3.3).
Social (S2)Social contribution (S2.1)Consumption of poverty alleviation funds as a proportion of operating income (S2.1.1).
Safe and efficient production (S2.2)Number of general equipment accidents (S2.2.1). On-grid power/generation capacity (S2.2.2). Unit cost of electricity generation (S2.2.3). Unit power generation cost reduction rate (S2.2.4). On-grid tariff (S2.2.5). Rate of increase in electricity on the grid (S2.26). Safety hazard correction rate (S2.2.7). Hours of utilization of power generation equipment (S2.2.8).
GovernanceDirectors and Board of Directors (G1)Board operation status (G1.1)Attendance of directors’ representatives in the Board of Directors (G1.1.1). Number of board meetings (G1.1.2). Director turnover rate (G1.1.3).
Board composition (G1.2)Percentage of independent directors (G1.2.1). Number of board of directors members (G1.2.2). Percentage of female directors (G1.2.3). Independent directors’ remuneration as a percentage of directors’ and supervisors’ salaries (G1.2.4).
Shareholding structure and other management operations (G2)Shareholding structure (G2.1)Shareholding ratio of the second to tenth largest shareholders to the first largest shareholder (G2.1.1). Shareholding percentage of the largest shareholder (G2.1.2).
Managerial operation status (G2.2)Frequency of managerial staff changes (G2.2.1).
Supervisory board structure and operation status (G2.3)Percentage of employee supervisors (G2.3.1). Number of supervisory board members (2.3.2). Supervisor turnover rate (G2.3.3).
Stakeholder Relations (G3)Information disclosure (G3.1)Company indicator completeness (G3.1.1). Frequency of updating information on company website (G3.1.2).
Stakeholder engagement (G3.2)Response rate to stakeholder inquiries (G3.2.1).
Innovative Development (G4)Innovation input and effectiveness (G4.1)R&D expenses/revenue (G4.1.1). Number of R&D staff as a percentage of total company headcount (G41.2). Number of patents granted per capita (G4.1.3).
EconomyProfitability (B1)Basic earnings per share (B1.1.1). Return on Net Assets (B1.1.2). Return on total assets (B1.1.3). Return on main business (B1.1.4). Return on power generation business (B1.1.5)
Operating capacity (B2)Total assets turnover ratio (B2.1.1). Current assets turnover ratio (B2.1.2). Accounts receivable turnover ratio (B2.1.3).
Solvency (B3)Balance sheet ratio (B3.1.1). Current ratio (B3.1.2). Cash flow ratio (B3.1.3). Equity ratio (B3.1.4).
Development capacity (B4)Operating income growth rate (B4.1.1). Capital accumulation ratio (B4.1.2). Total assets growth rate (B4.1.3). Fixed assets growth rate (B4.1.4). Net profit growth rate (B4.1.5).
Table 2. Compliance indicators used to screen the sample of companies.
DimensionalityIndicators
EnvironmentalNew construction projects for environmental impact assessment and preparation of environmental impact assessment reports
Establishment of specialized environmental management positions
Corporate environmental management policy/system
SocialUse criteria for screening suppliers
Contingency planning
Measures to avoid child labor and forced labor
GovernanceCompensation of directors, supervisors, and senior management; decision-making process and basis for determination
The listed company and its directors, supervisors, senior management, controlling shareholders for suspected illegal and non-compliant behavior
Table 3. Sustainability dimension scores for power generation companies.
MeanMax.Min.Std. Dev.
Environmental Dimension Score65.1085.5438.3010.74
Social Dimension Score64.6986.0451.828.23
Governance Dimension Score76.7994.0853.959.08
Economic Dimension Score41.3784.356.9715.02
Table 4. Scores for corporate sustainable development at the standard level.
CodeMeanMax.Min.Std. Dev.
A1.169.32 98.34 0.00 20.66
A1.254.16 83.73 0.00 21.43
A2.164.36 100.00 0.00 29.06
A2.247.34 100.00 0.00 24.69
A3.192.51 100.00 47.34 16.62
A3.265.06 100.00 10.21 29.56
A3.364.67 96.67 32.62 20.66
A4.185.15 100.00 0.00 30.83
S1.189.31 100.00 50.00 13.84
S1.282.34 100.00 51.03 11.29
S1.346.41 99.81 13.66 19.76
S2.111.72 100.00 0.00 22.37
S2.272.30 88.41 48.47 7.49
G1.159.35 87.25 11.46 16.74
G1.261.69 87.88 44.21 9.64
G2.136.32 100.00 0.00 25.98
G2.264.46 100.00 0.00 33.09
G2.396.38 100.00 63.16 6.44
G3.180.32 100.00 41.67 20.23
G3.296.37 100.00 96.00 1.34
G4.123.05 85.32 0.00 24.85
B145.97 92.58 6.30 21.72
B240.82 76.86 5.43 16.12
B340.58 84.20 5.43 13.64
B432.94 83.76 10.66 13.62
Table 5. Sustainability index of Chinese power generation enterprises.
CodeIndexCodeIndexCodeIndex
E162.68E1844.60E3540.49
E265.93E1965.45E3660.85
E344.44E2060.96E3753.63
E447.85E2151.99E3866.94
E557.10E2269.07E3957.59
E666.18E2347.65E4067.15
E754.83E2448.91E4160.86
E864.92E2561.63E4260.48
E961.73E2658.03E4363.72
E1064.33E2767.94E4445.92
E1163.68E2871.07E4554.48
E1254.11E2954.36E4675.28
E1363.75E3065.25E4759.20
E1457.82E3167.87E4858.04
E1567.82E3267.94E4957.50
E1657.68E3358.15E5065.35
E1744.72E3459.28
Table 6. Pairwise Pearson correlation coefficients between dimensions.
EconomyEnvironmentalSocialGovernance
Economy1
Environmental0.141
Social0.16−0.061
Governance0.080.06−0.031
Table 7. Pairwise Pearson correlation coefficients between topics.
A1A2A3A4S1S2G1G2G3G4B1B2B3B4
A11
A20.111
A3−0.22−0.431
A4−0.370.55−0.281
S1−0.120.140.340.581
S20.430.43−0.60.120.191
G1−0.490.310.130.520.52−0.361
G2−0.120.05−0.070.440.48−0.360.481
G3−0.600.07−0.430.01−0.160.26−0.330.181
G4−0.14−0.36−0.22−0.26−0.2−0.28−0.410.420.521
B1−0.330.180.310.600.42−0.360.720.27−0.33−0.571
B20.170.060.180.410.37−0.300.350.380.11−0.210.81
B30.03−0.160.390.2360.35−0.380.240.23−0.13−0.270.770.811
B4−0.10−0.090.490.280.57−0.440.200.38−0.31−0.140.650.730.881
Disclaimer/Publisher’s Note: The statements, opinions and data contained in all publications are solely those of the individual author(s) and contributor(s) and not of MDPI and/or the editor(s). MDPI and/or the editor(s) disclaim responsibility for any injury to people or property resulting from any ideas, methods, instructions or products referred to in the content.

