

Assessing Urban Sustainability and the Potential to Improve the Quality of Education and Gender Equality in Phnom Penh, Cambodia


Abstract
1. Introduction
2. Materials and Methods
2.1. Assessment Framework
2.2. Indicator Weighting
2.3. Comparative Standard
2.4. Districts and Data Sources
3. Results and Discussion
3.1. Urban Education Assessment Results
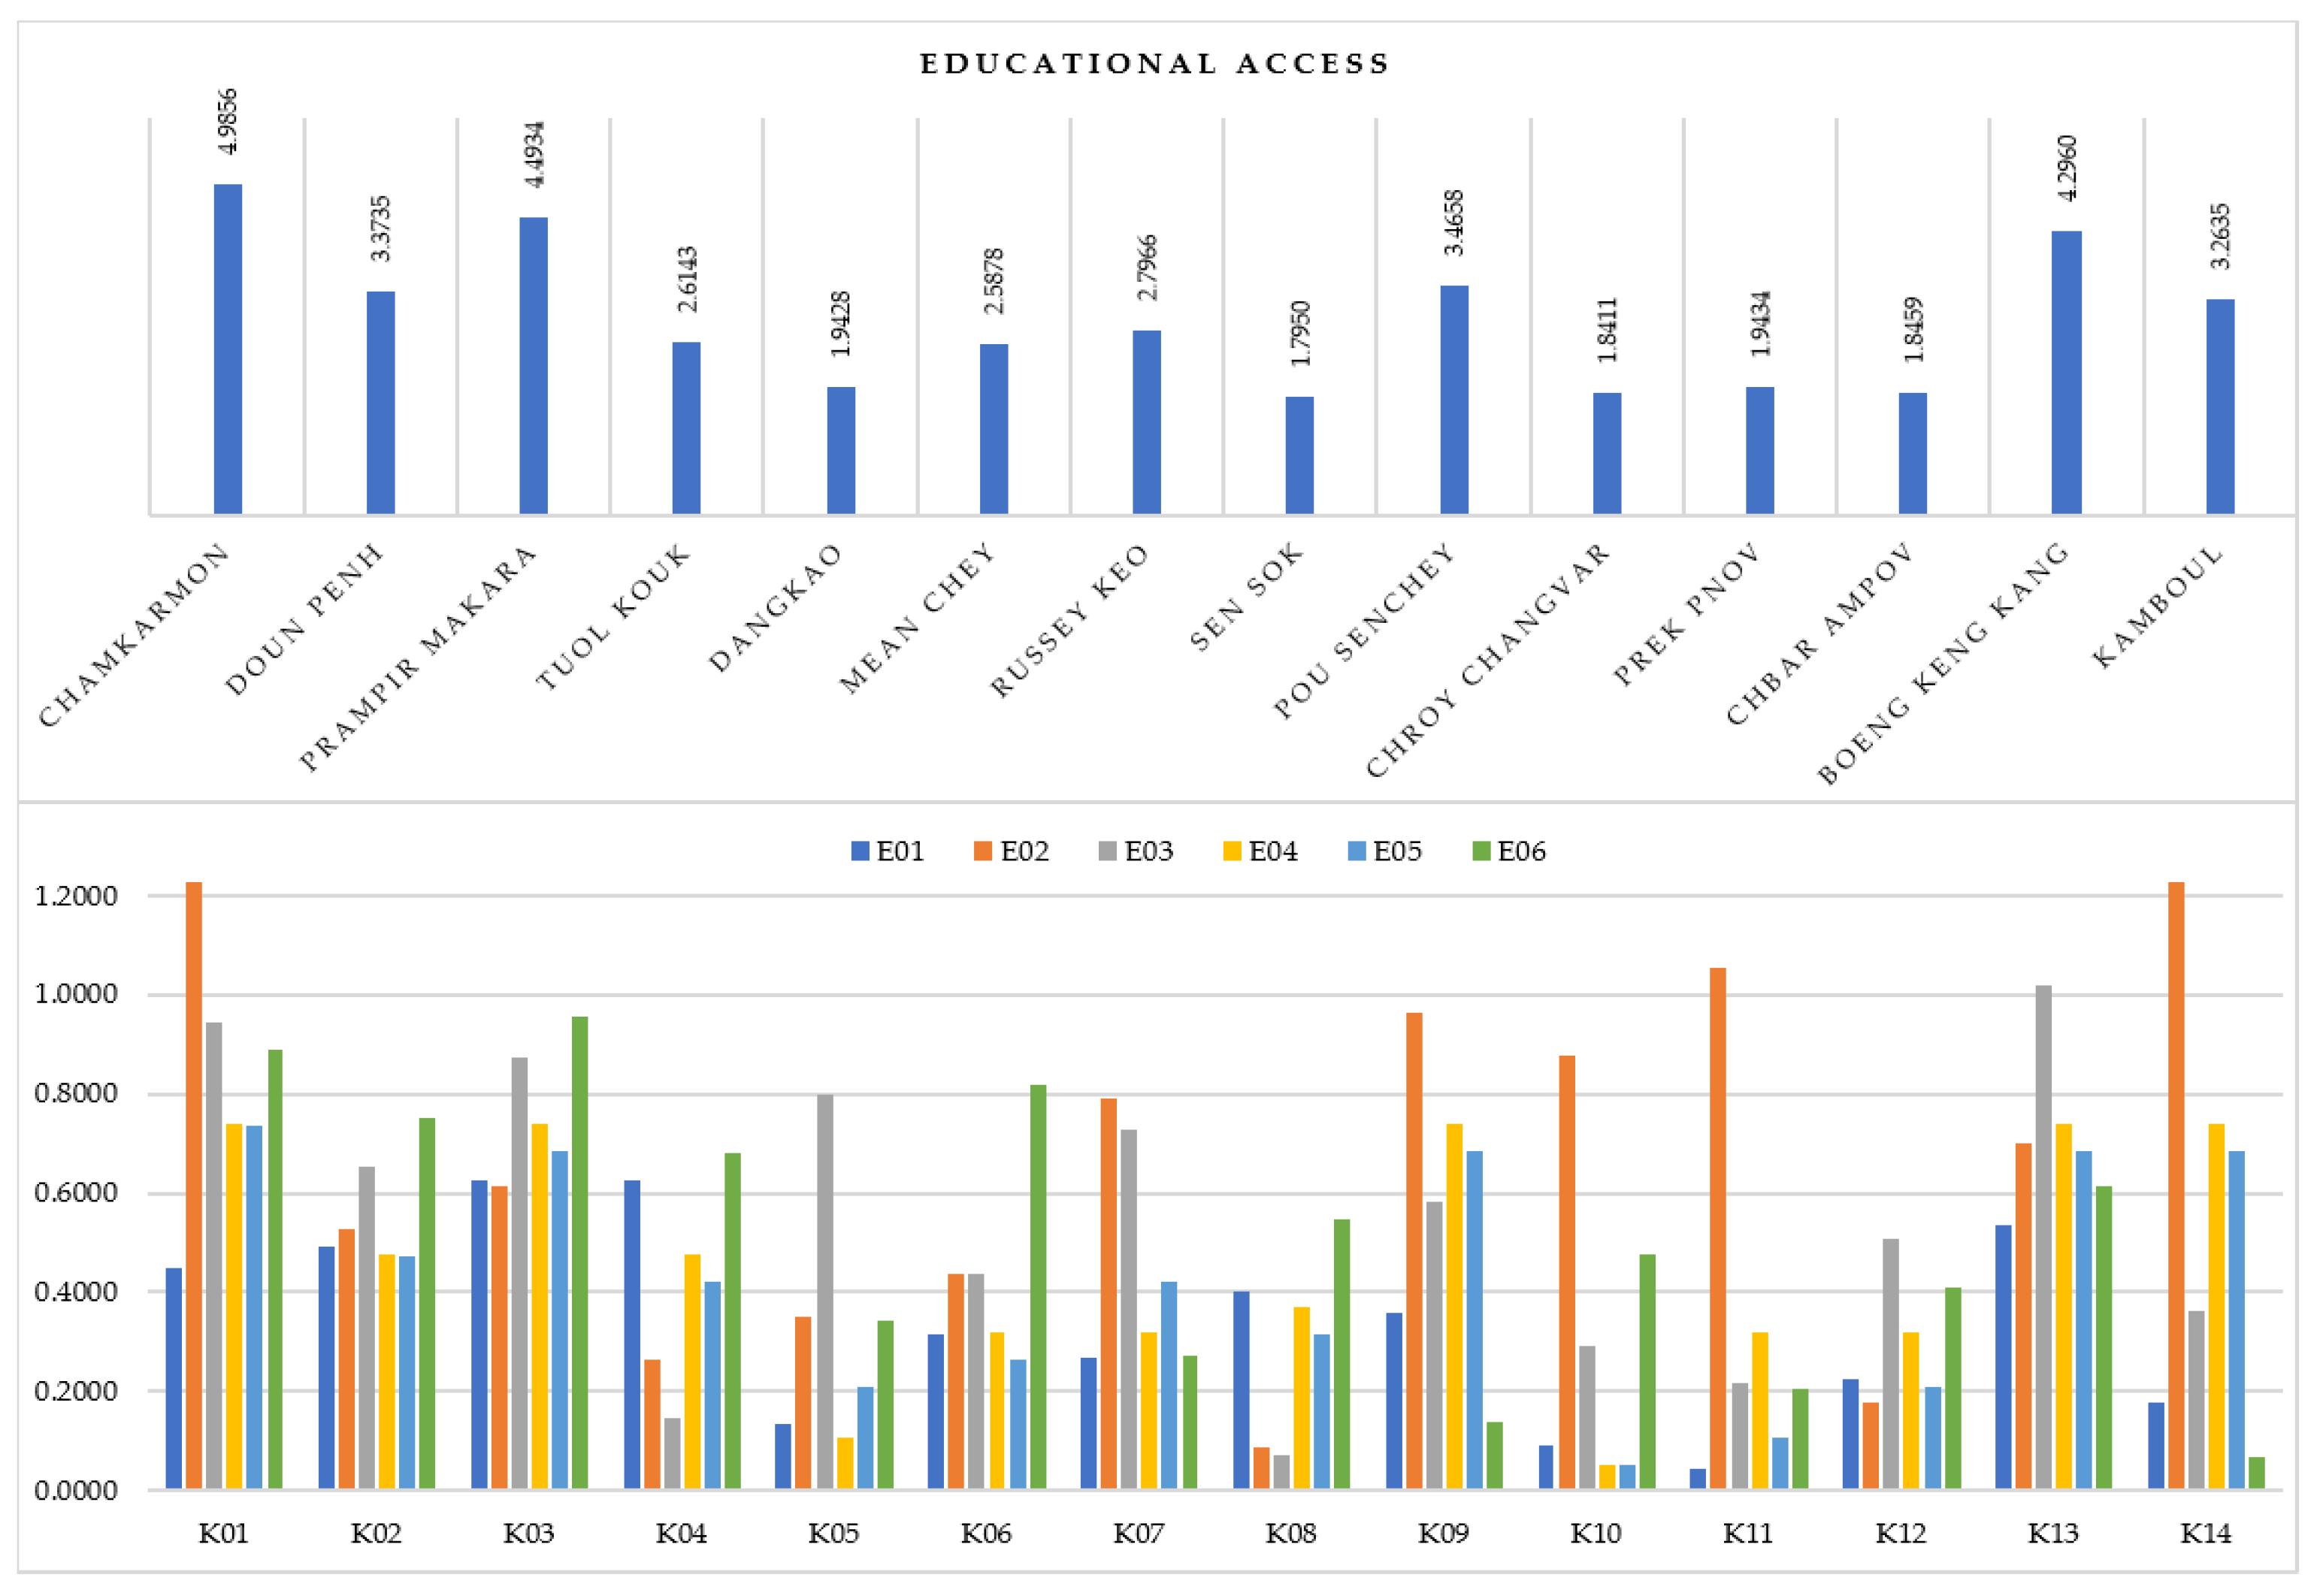
3.1.1. Access to Education, including Vocational Education and Training
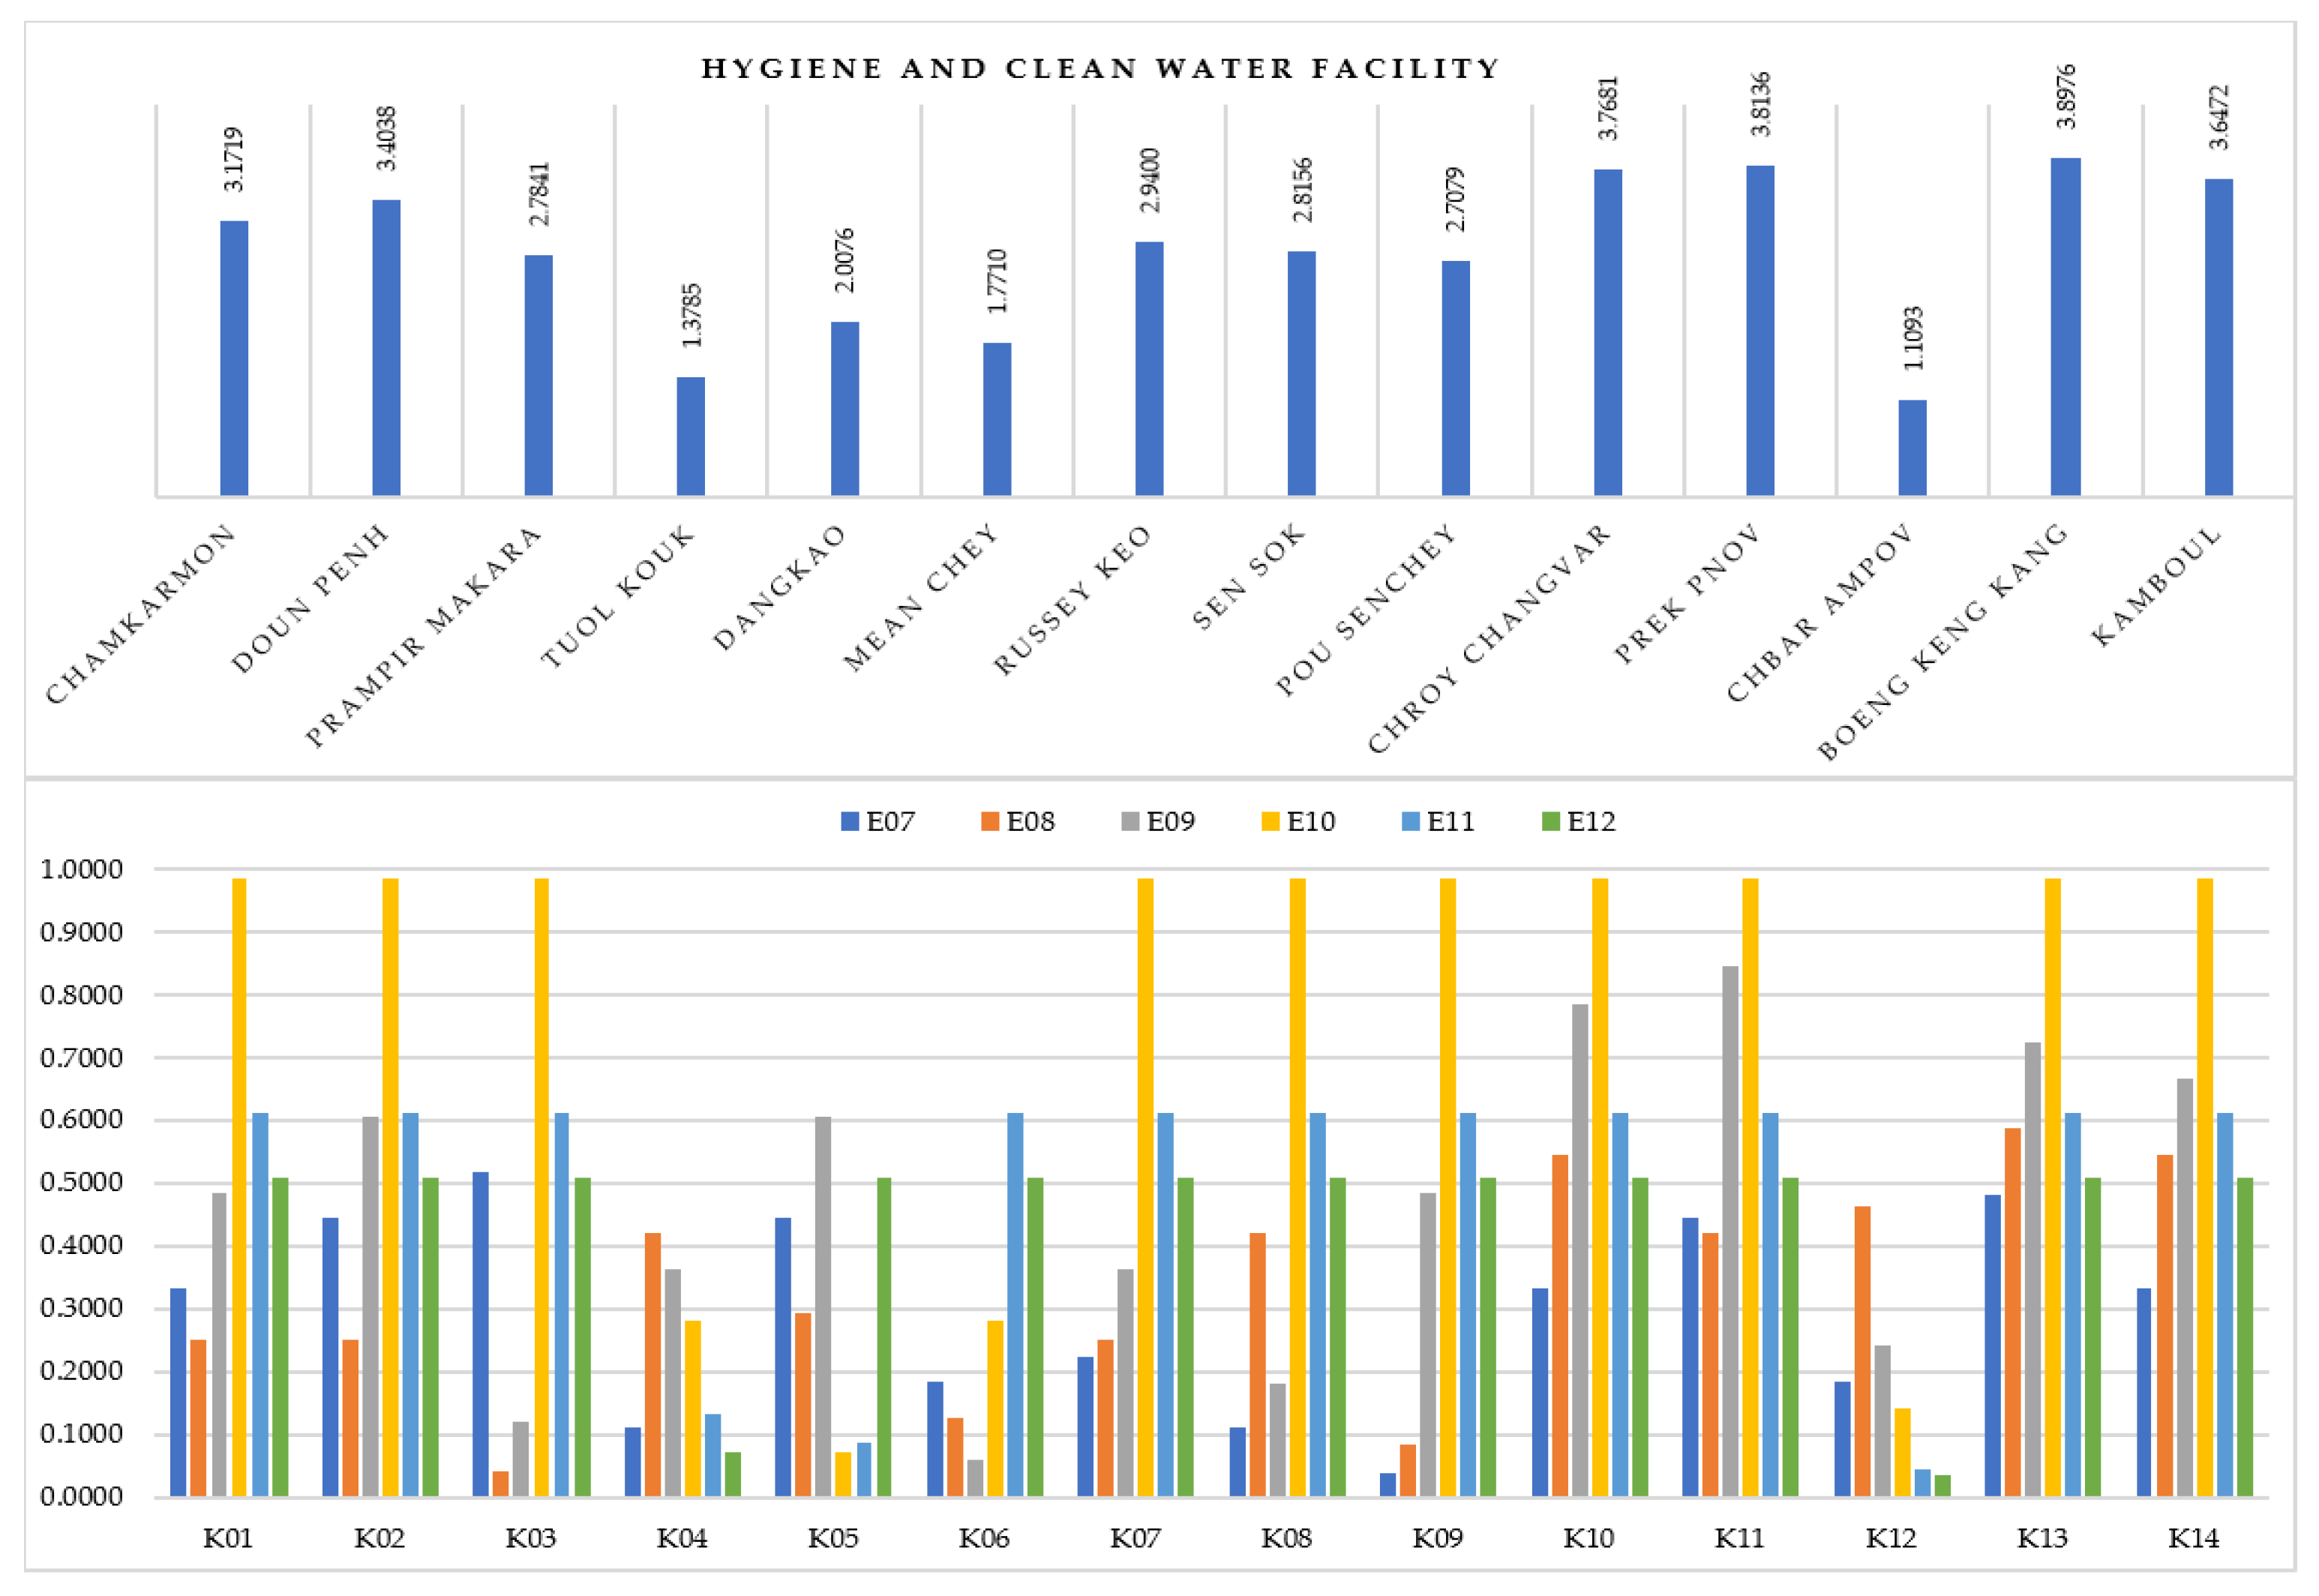
3.1.2. Hygiene and Clean Water Facilities in Schools
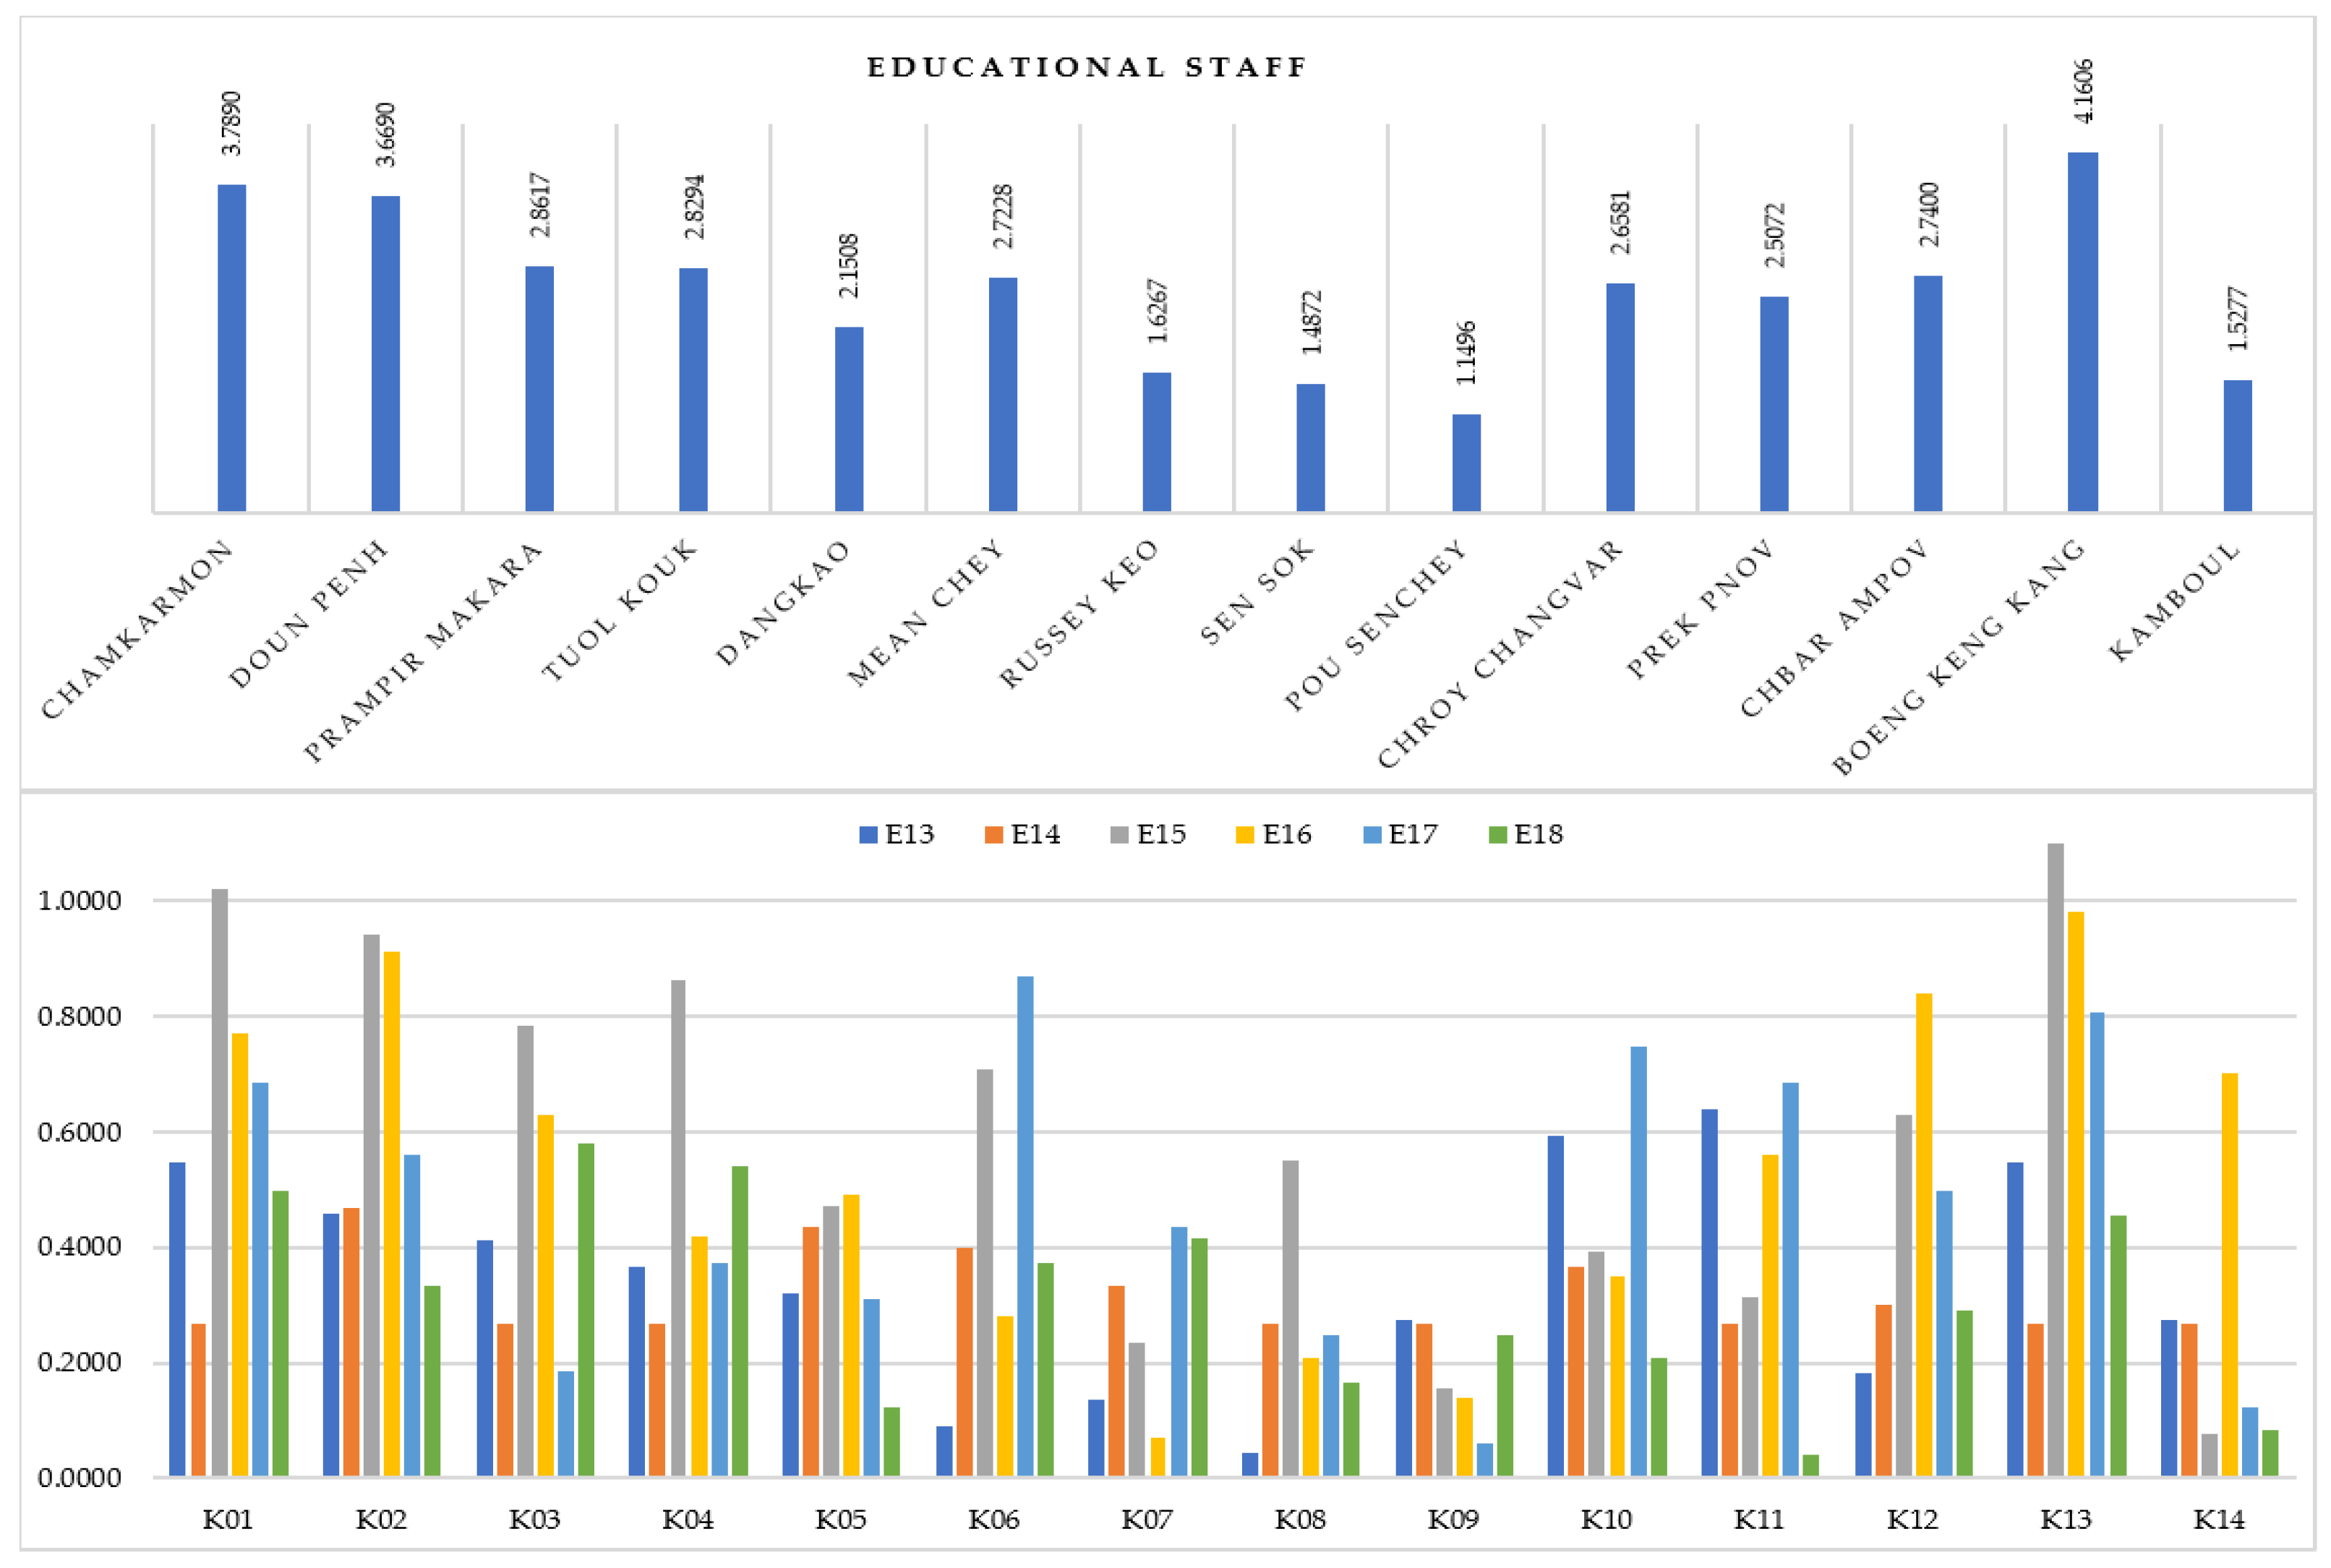
3.1.3. Educational Staff in Schools and Education Coordination/Administrative Offices
3.2. Urban Gender Equality Assessment Results
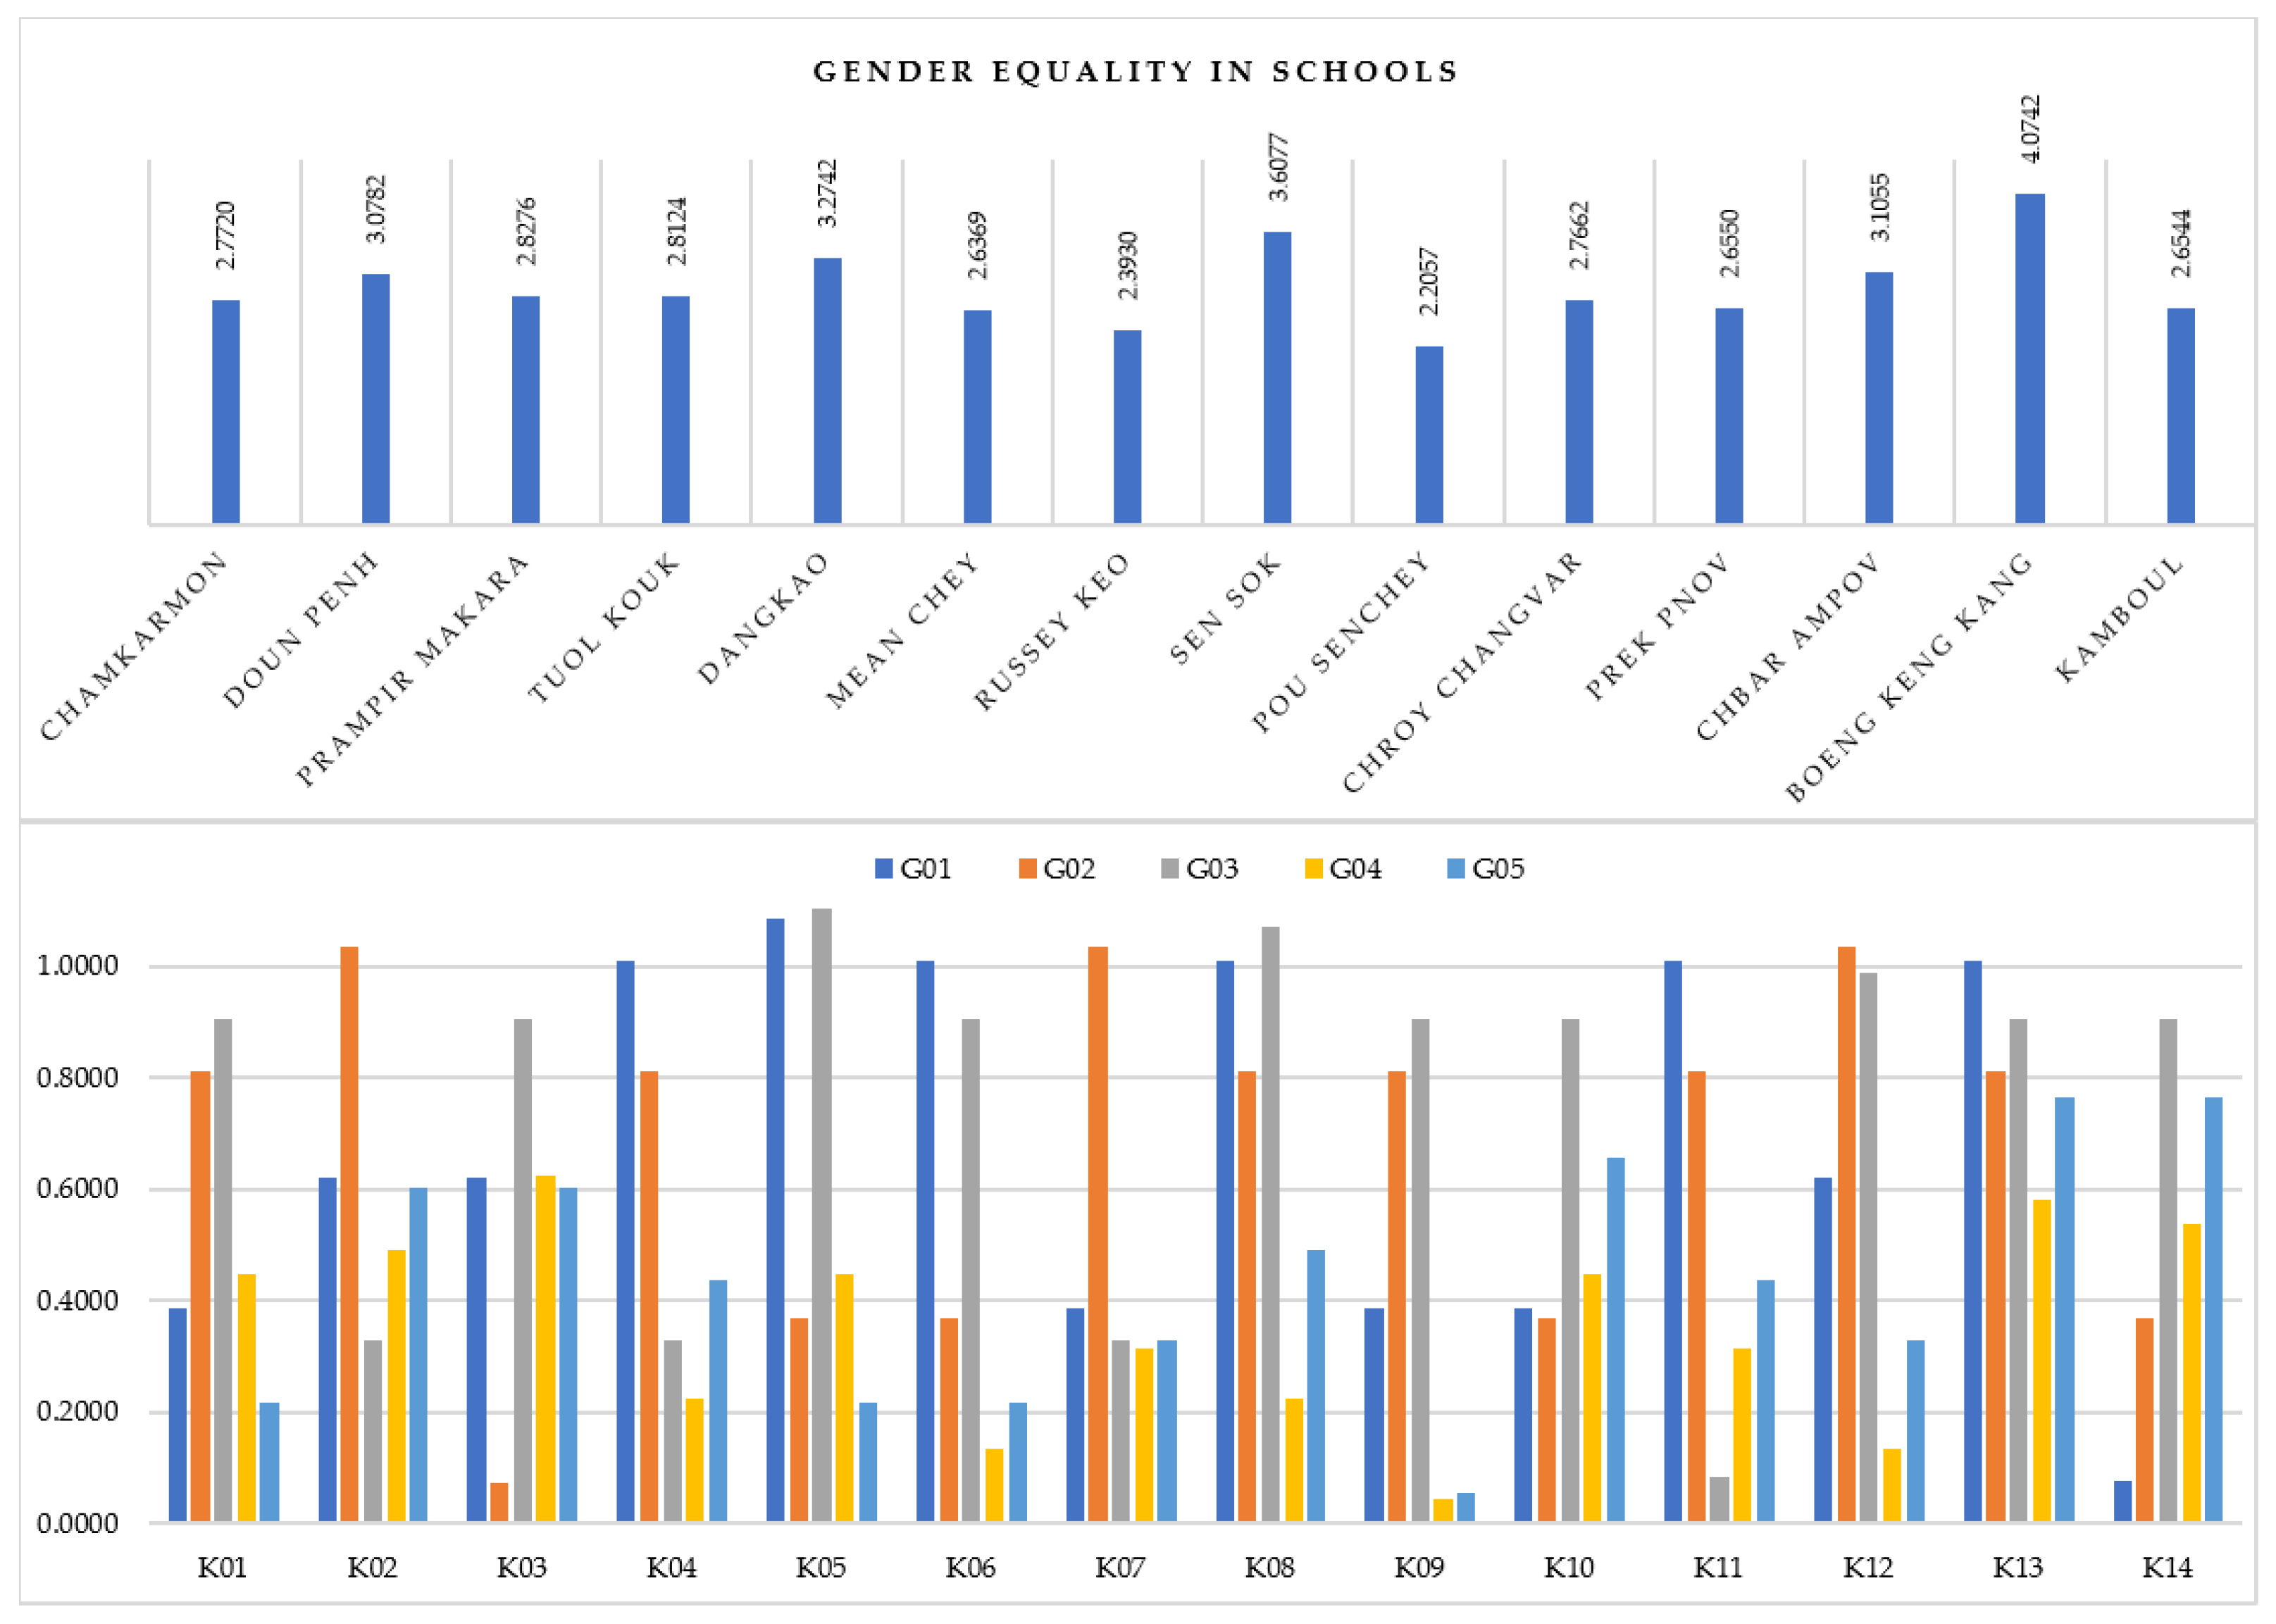
3.2.1. Gender Equality in Access to Education and Hygiene Facilities in Schools
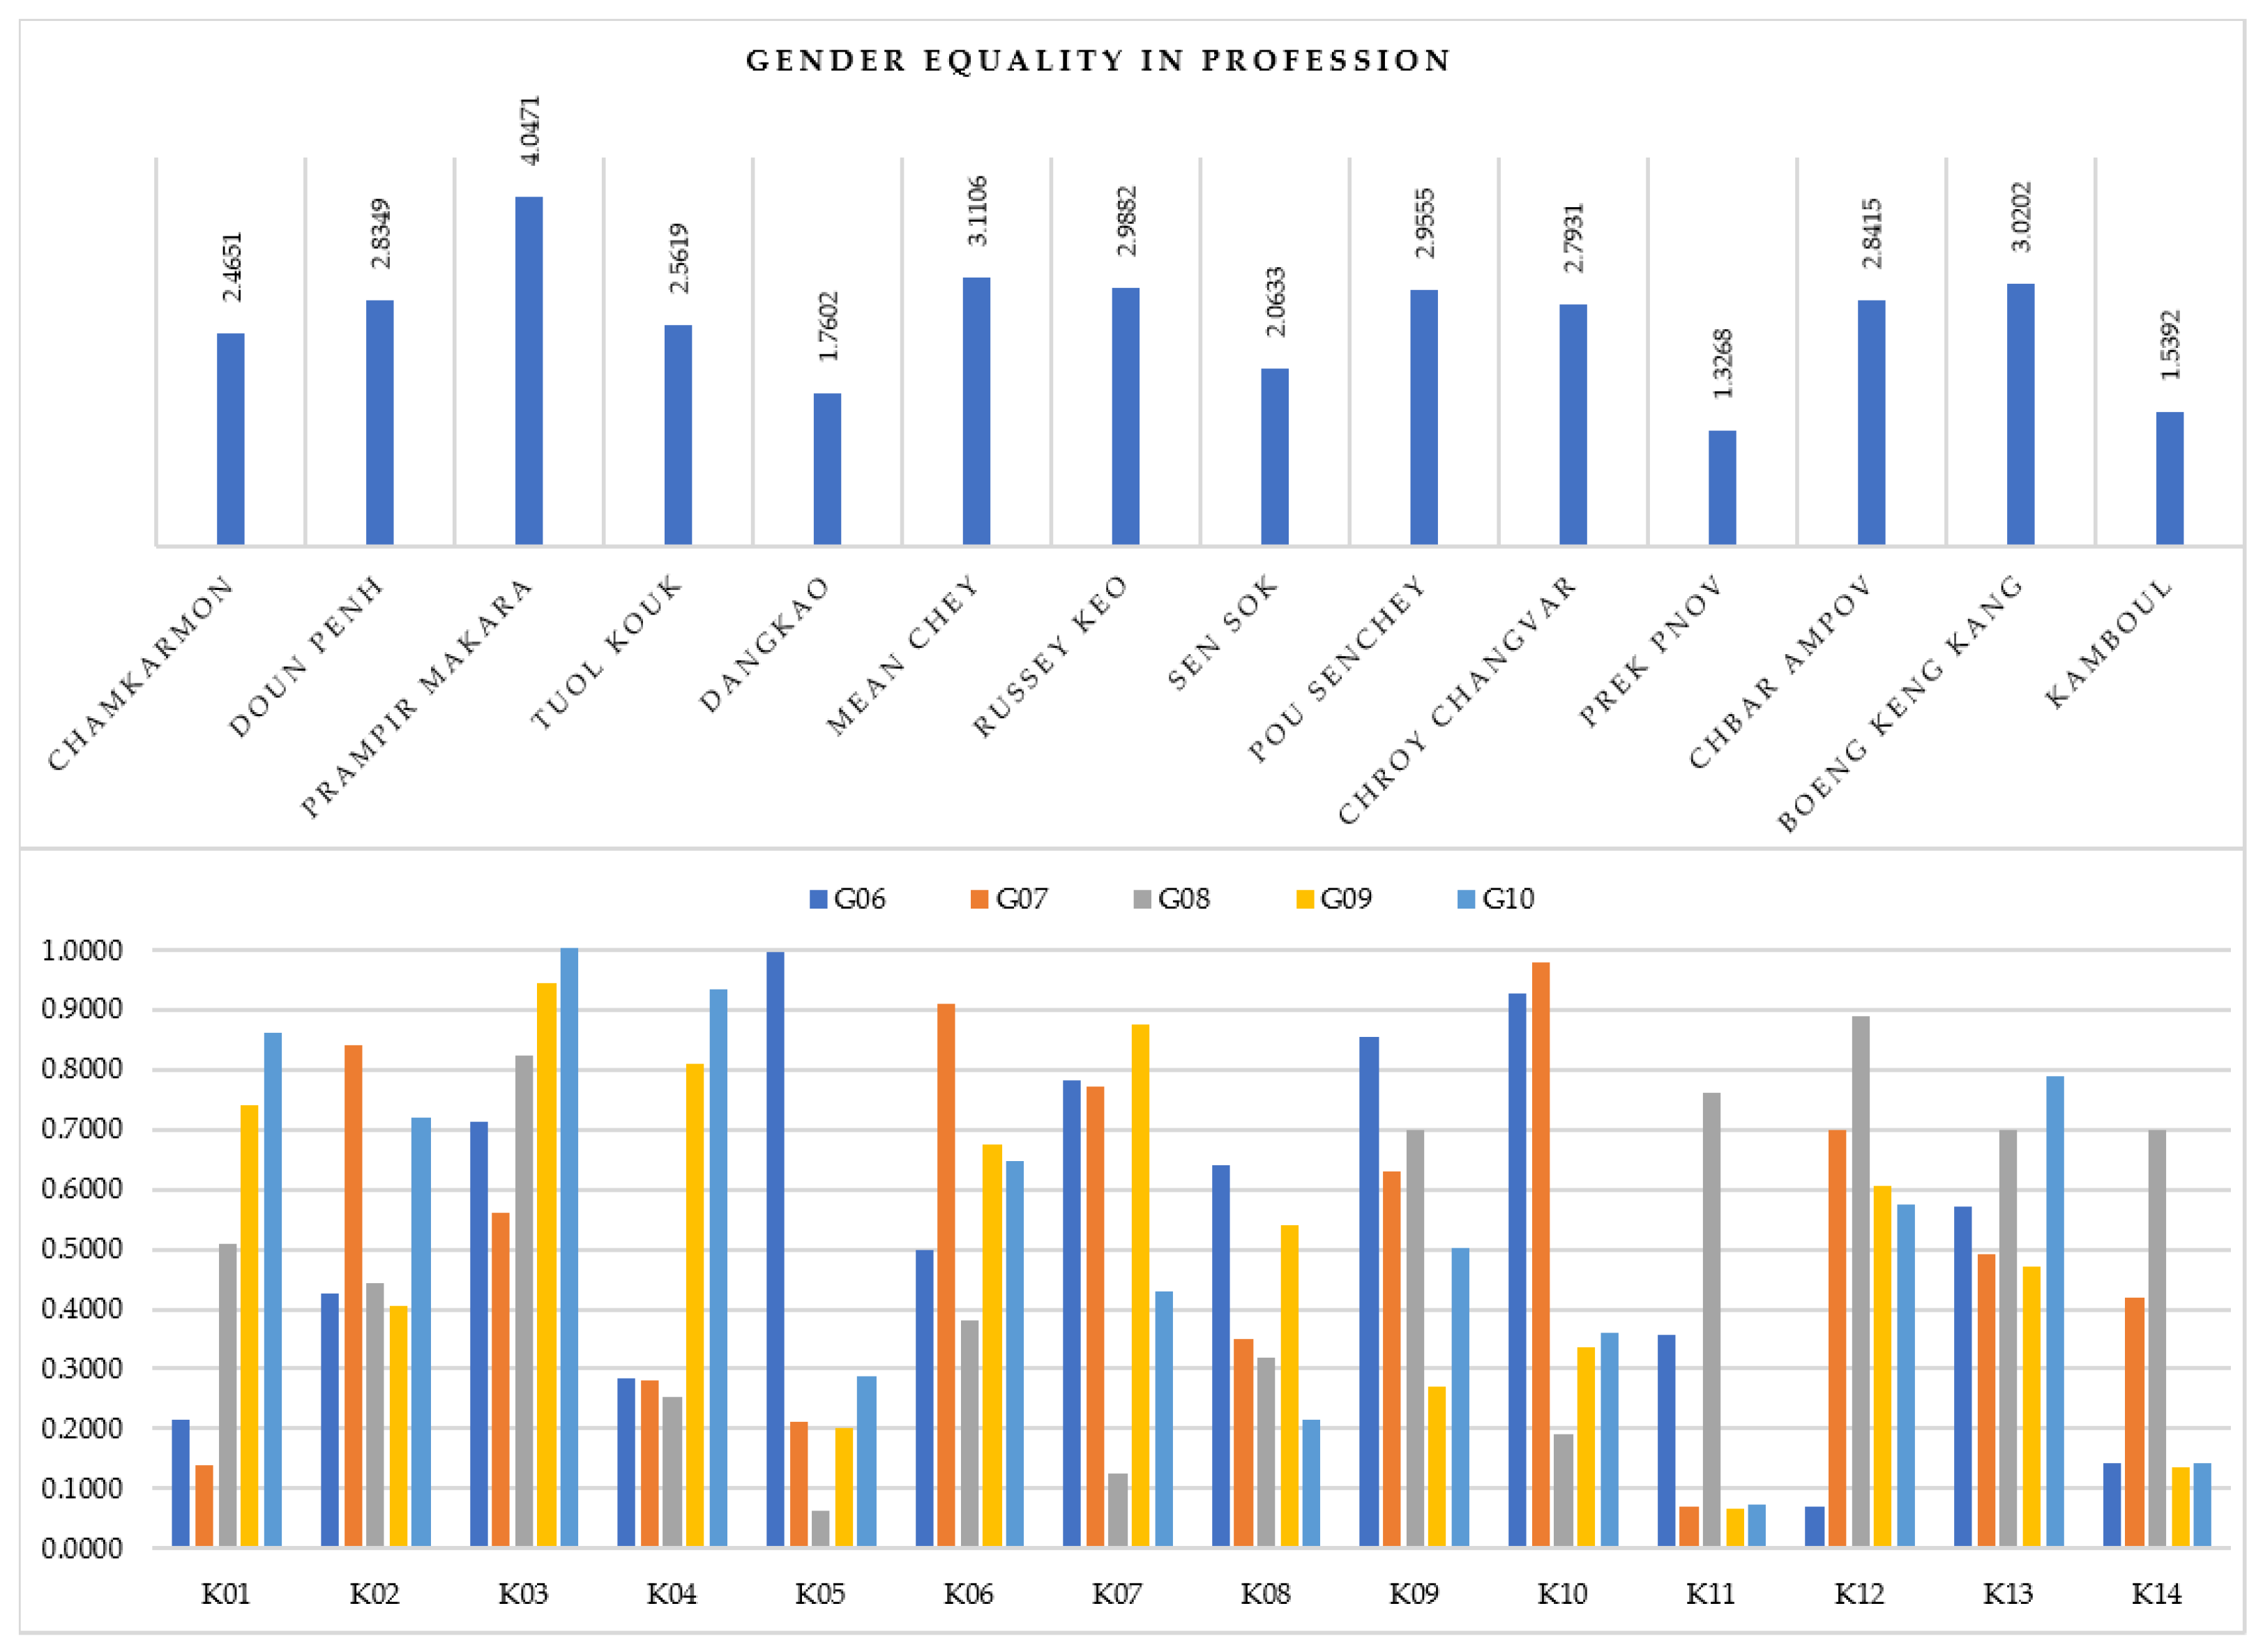
3.2.2. Urban Gender Equality in Professions
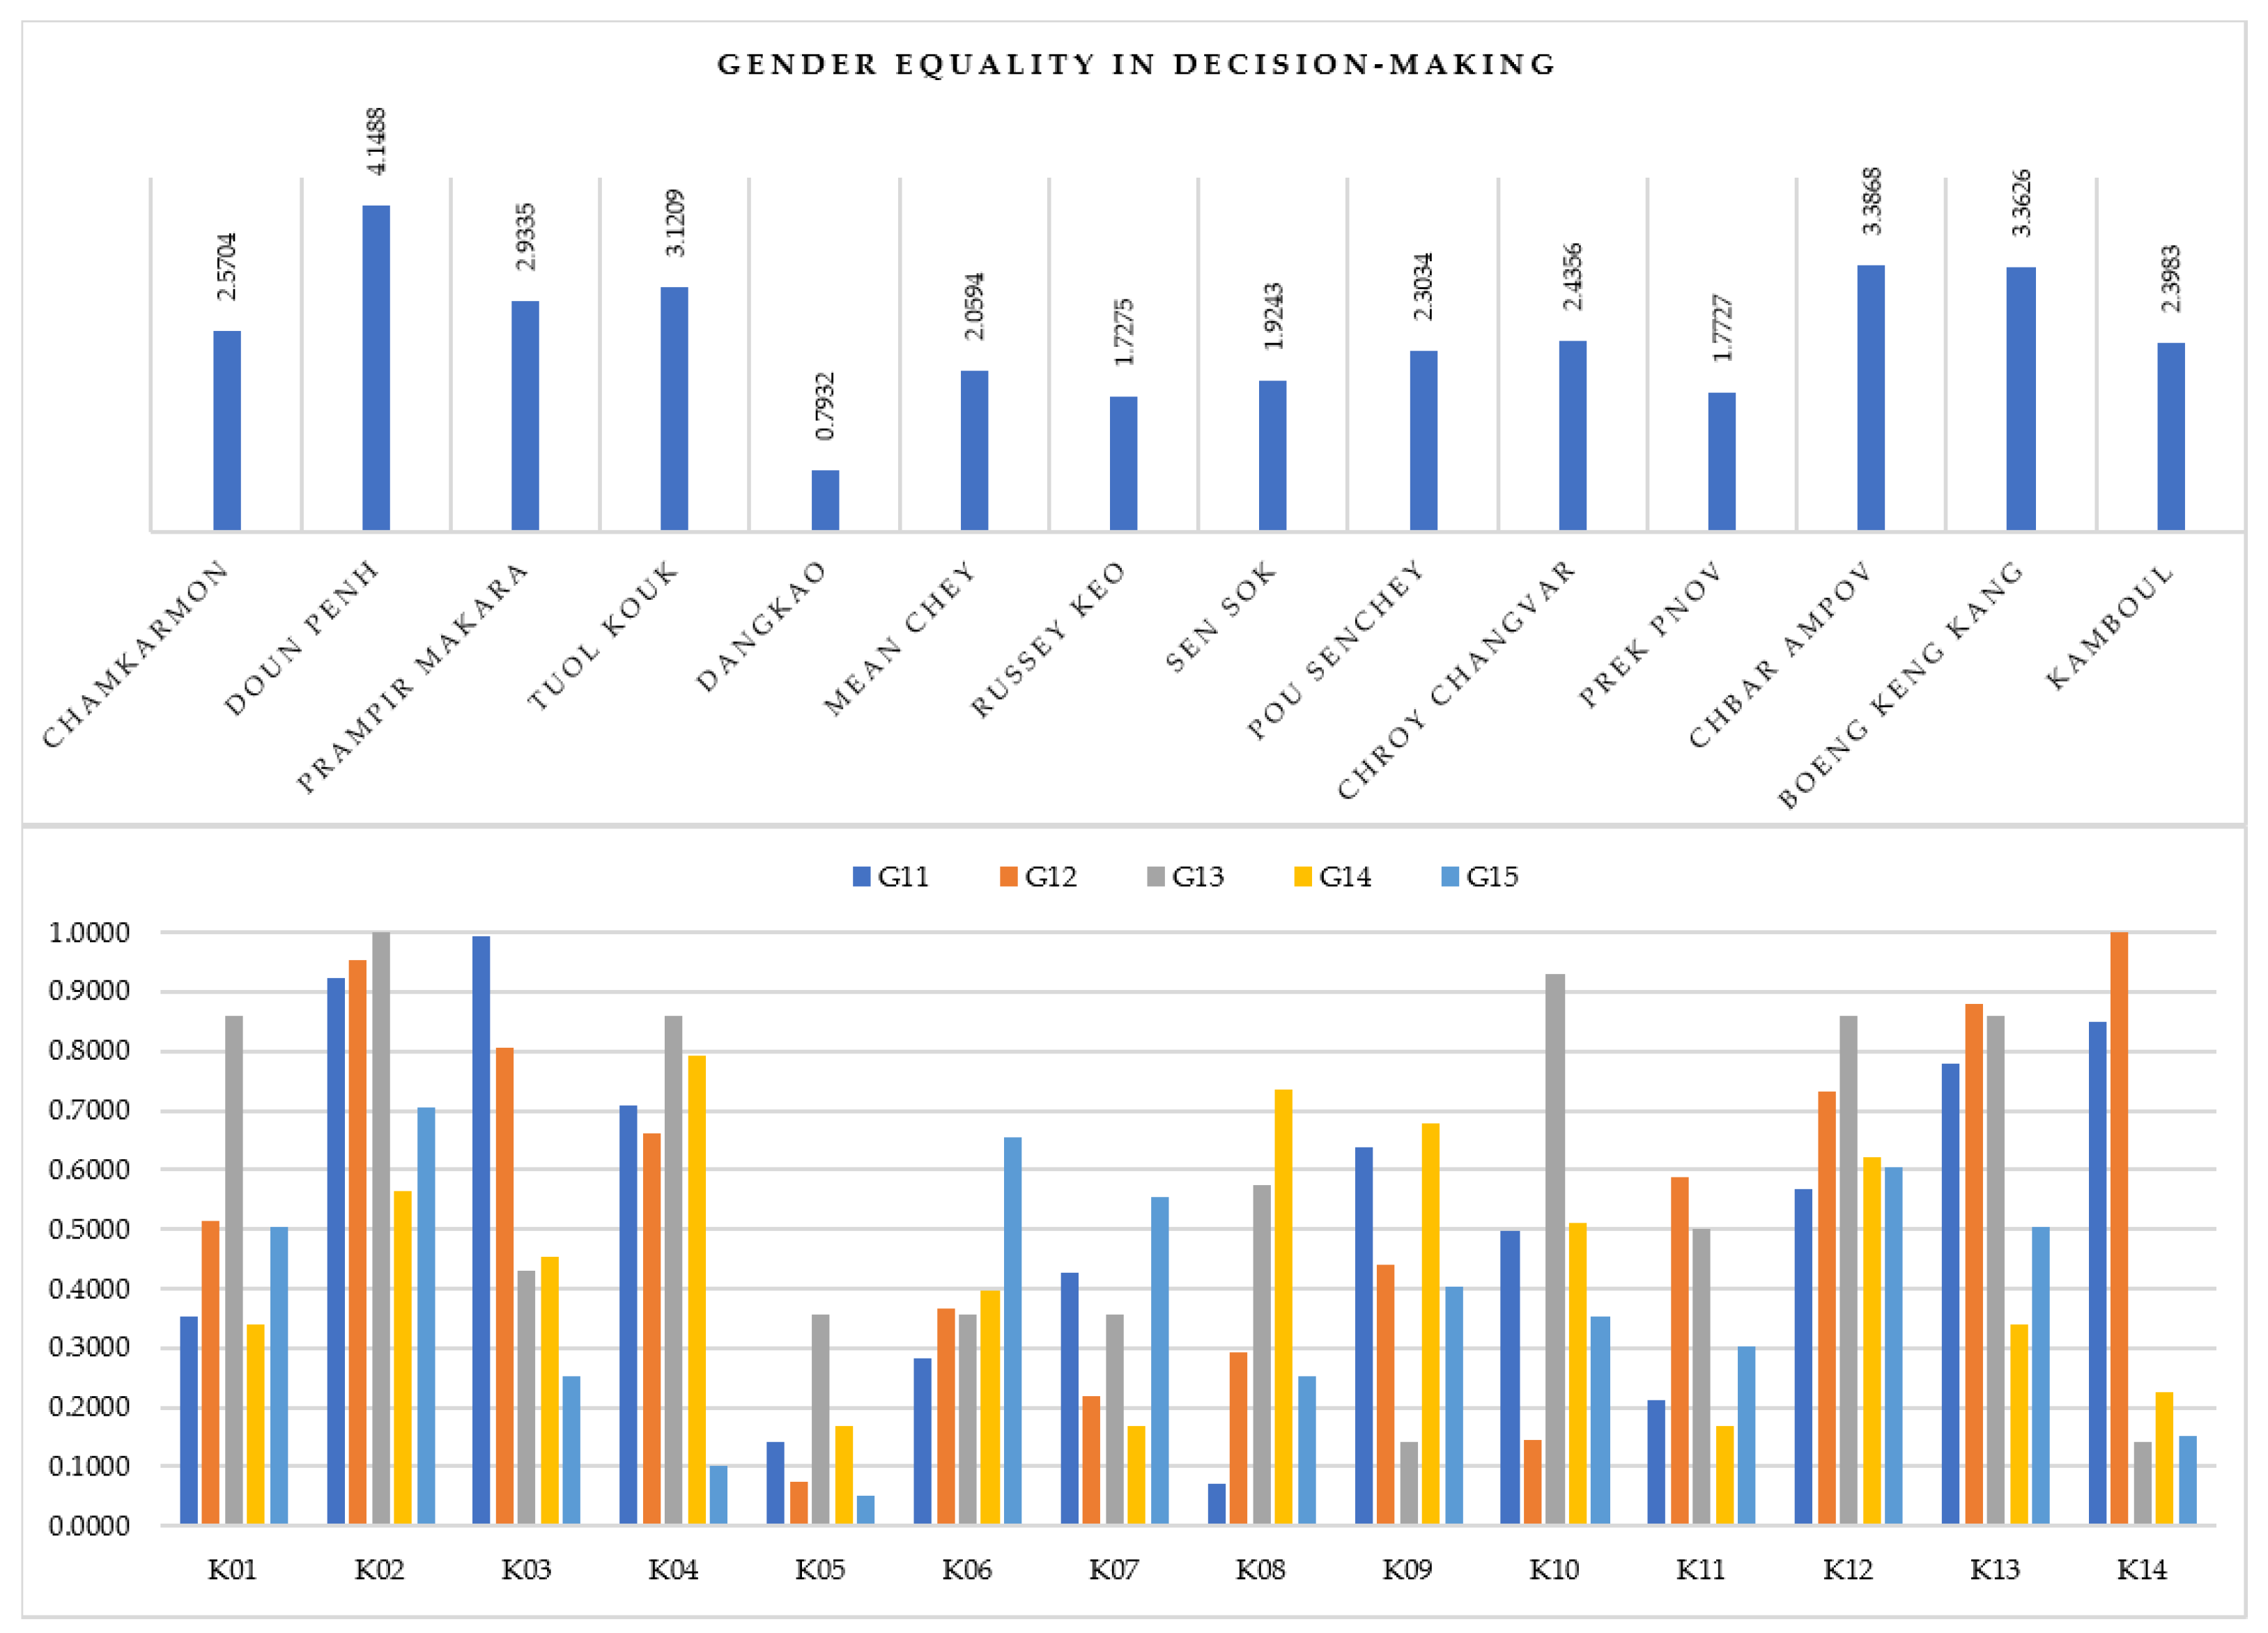
3.2.3. Urban Gender Equality in Decision-Making
3.3. Consolidated Assessment Results
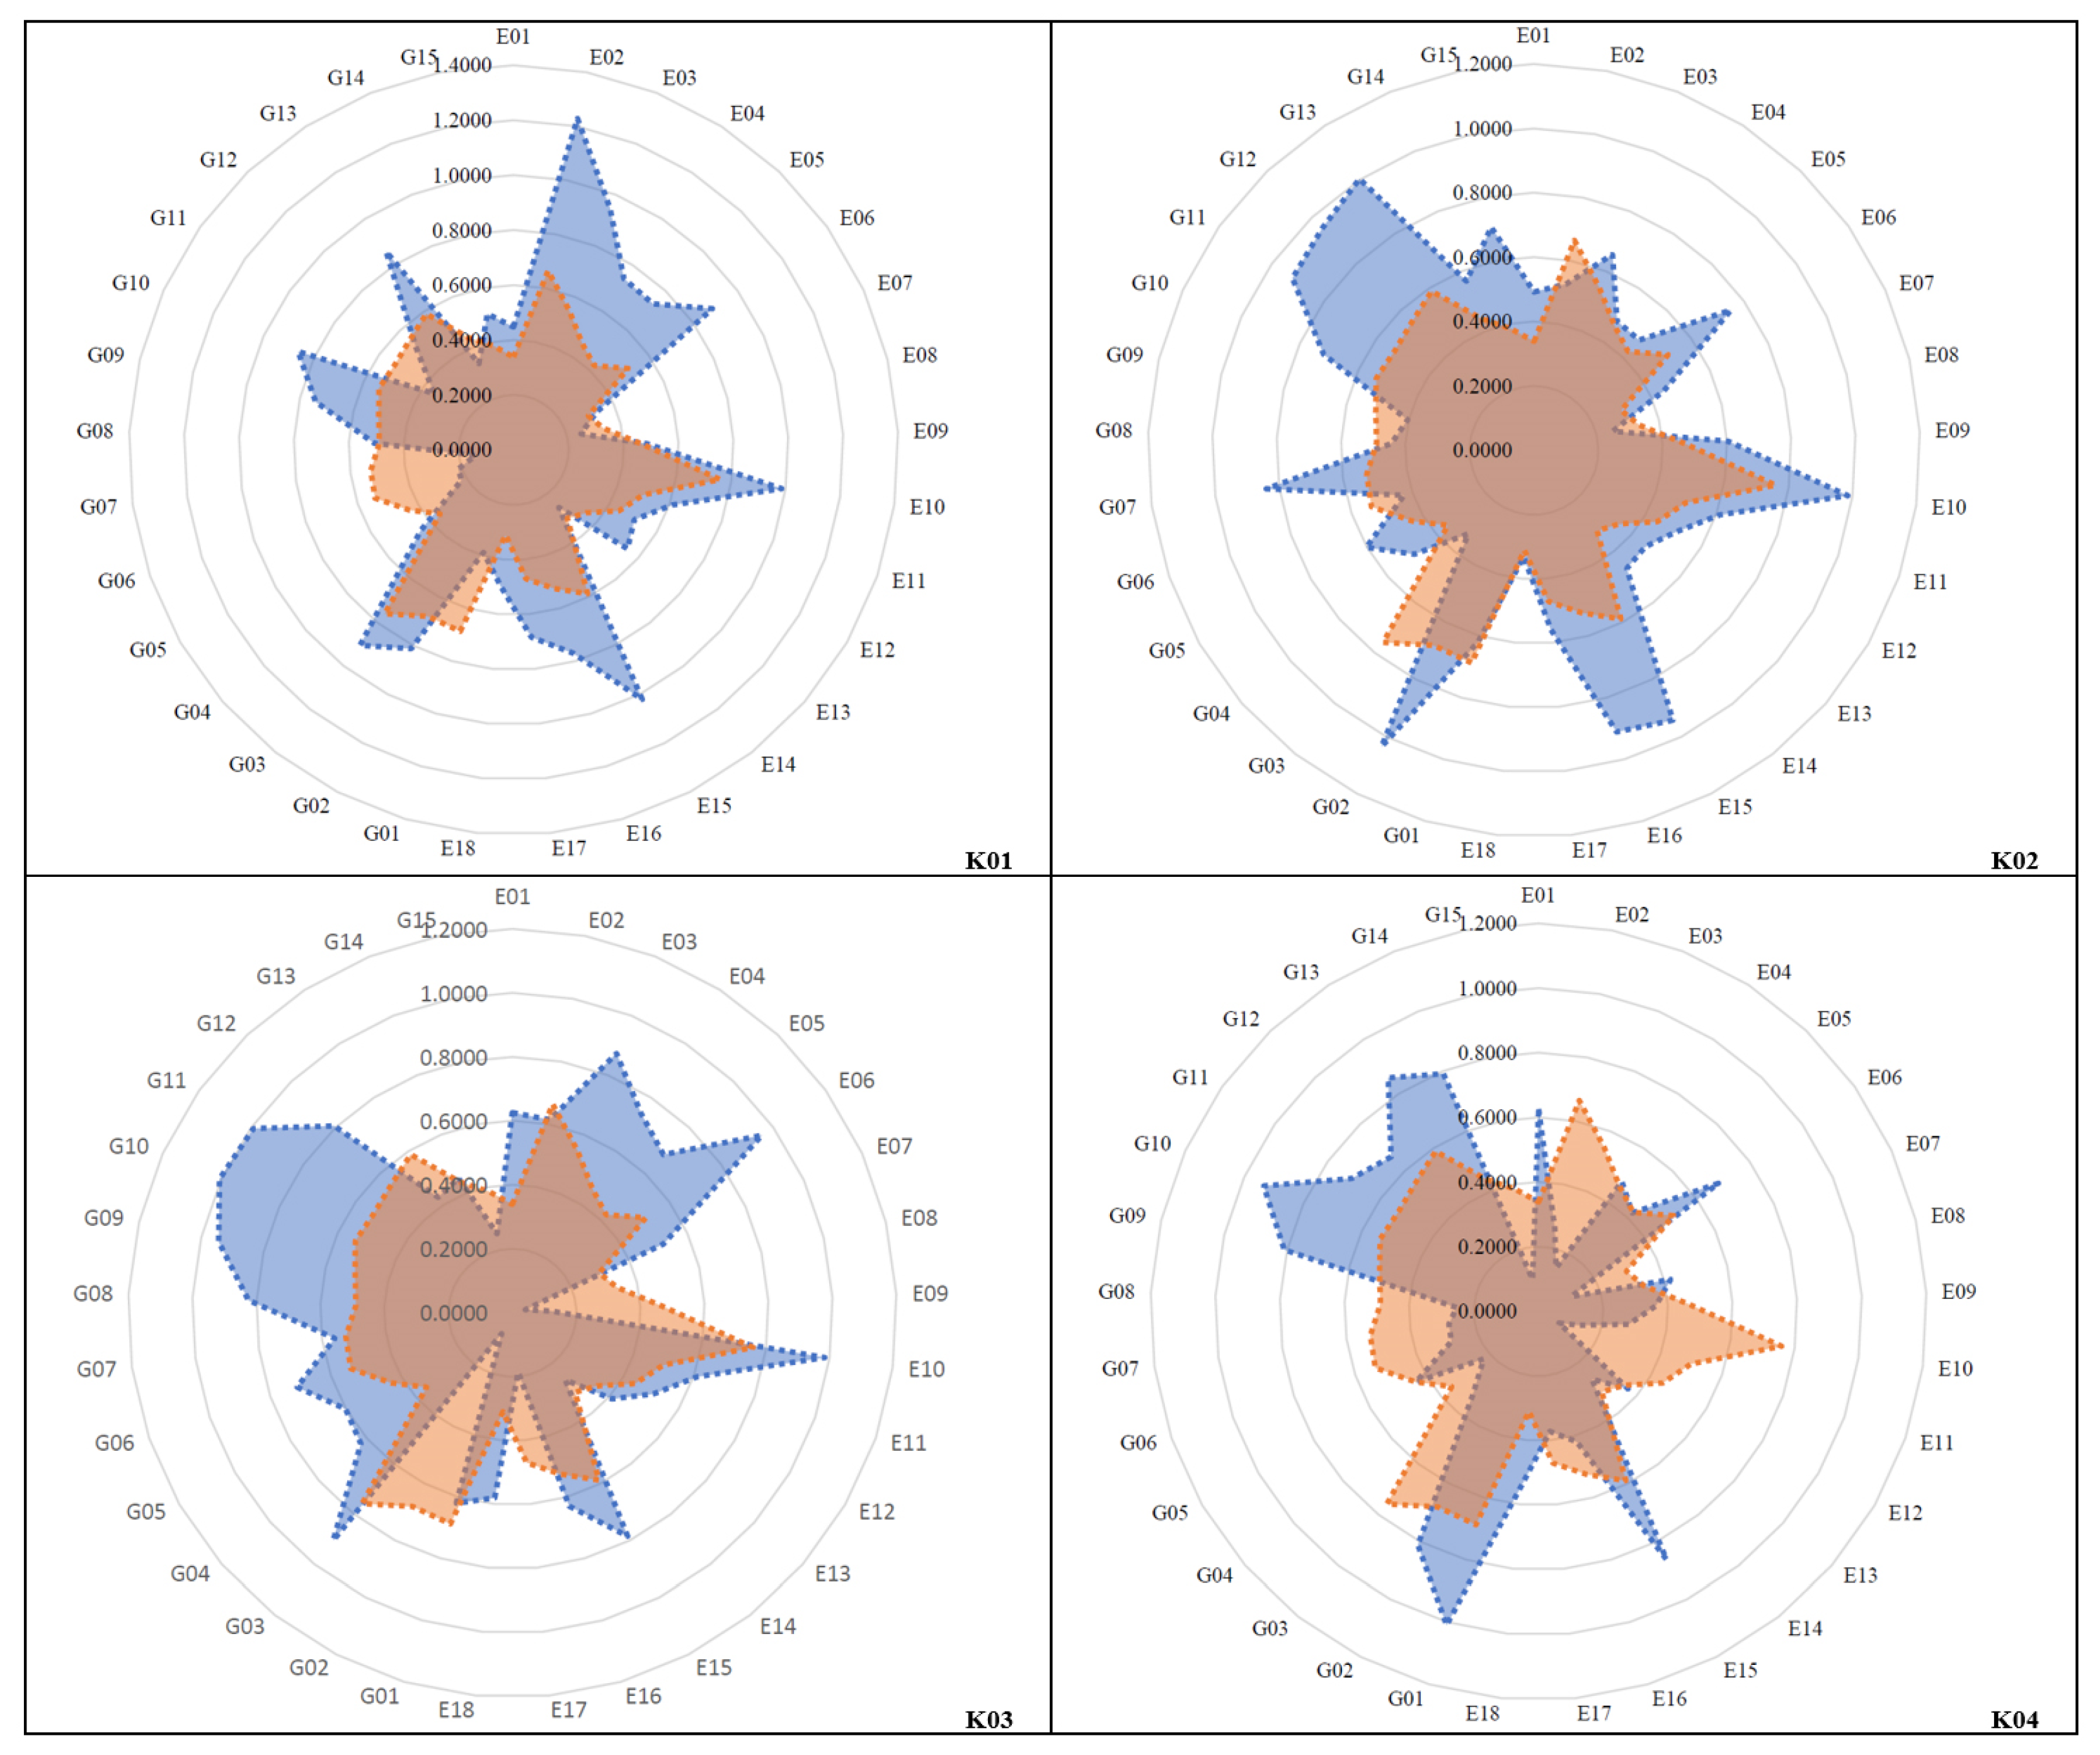
3.4. Strong and Weak Points of Each District
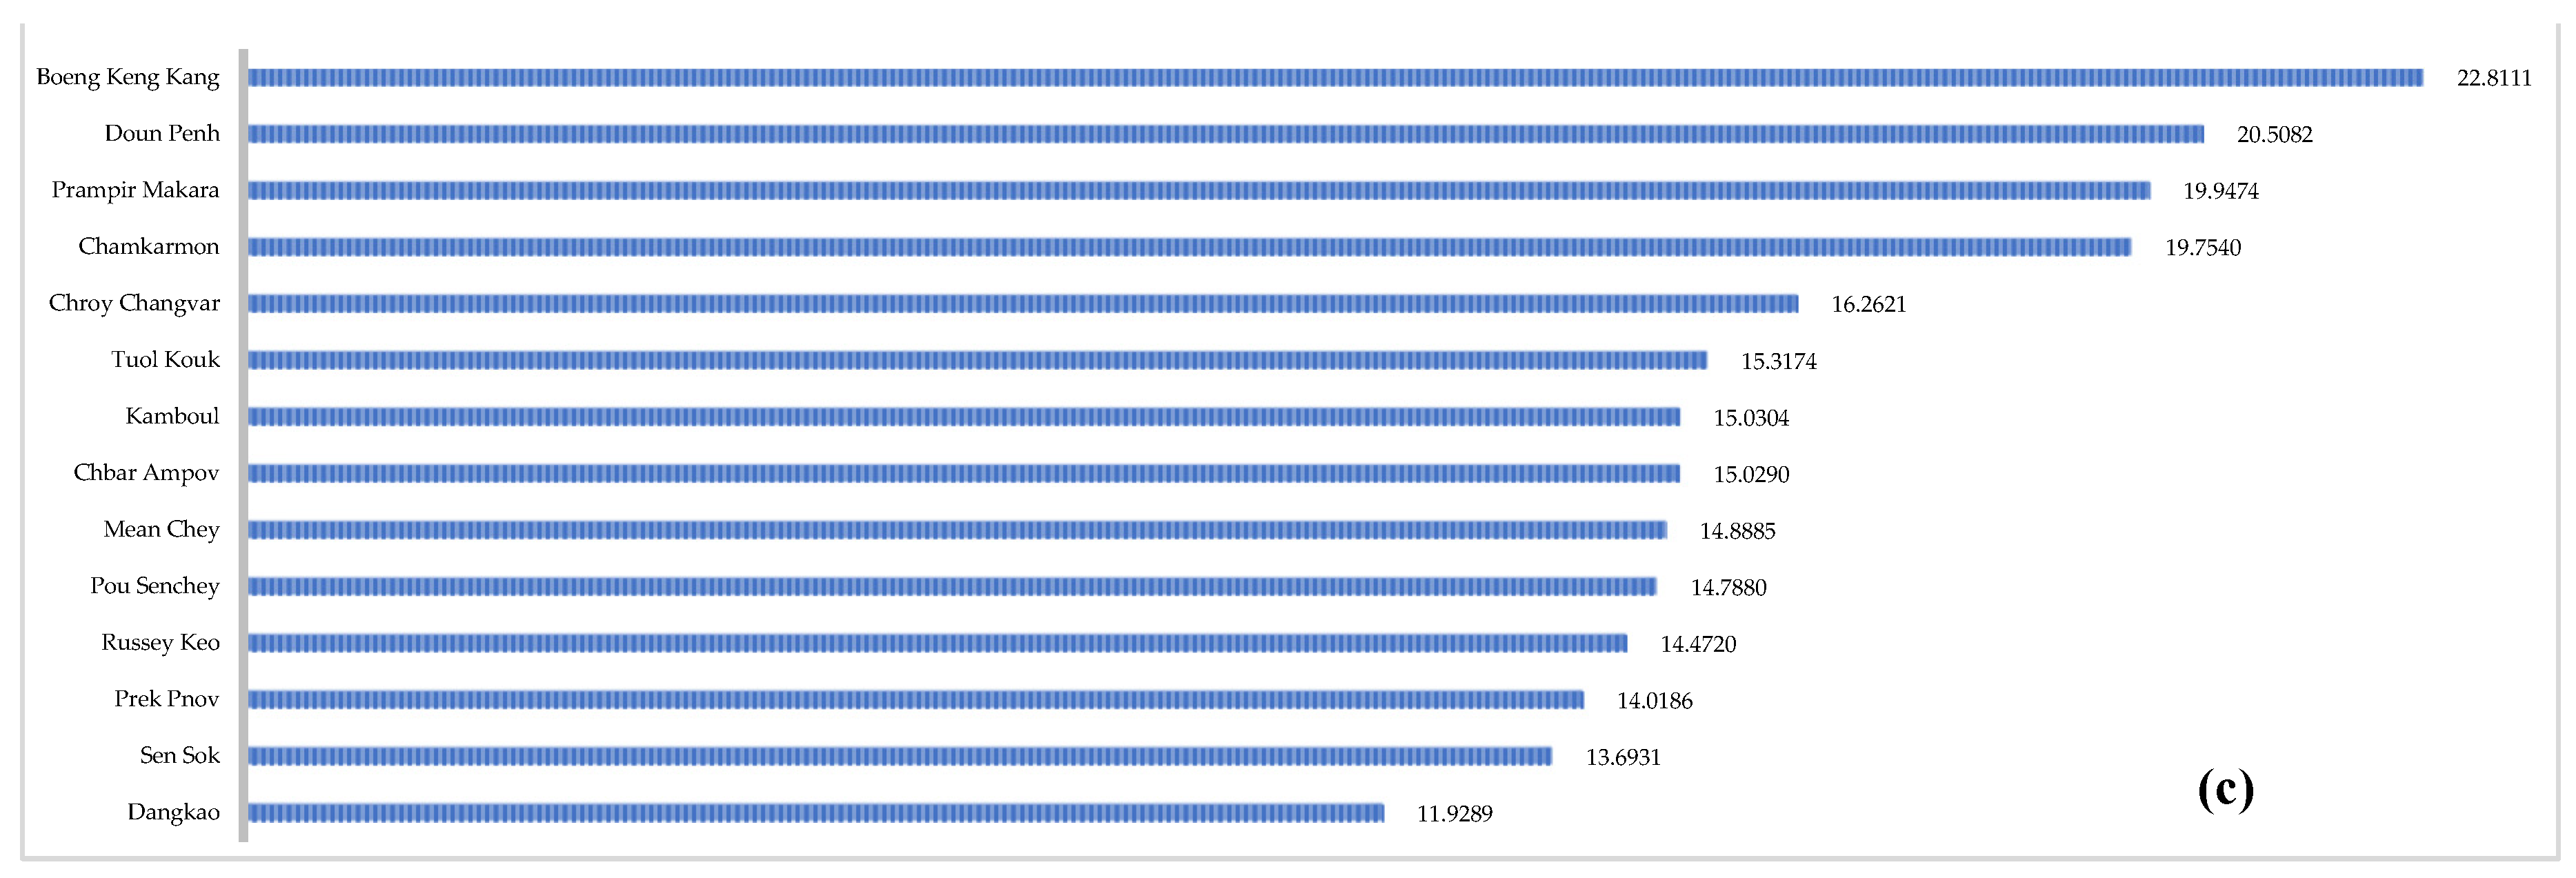
- Chamkarmon (K01): The consolidated assessment results showed that Chamkarmon was ranked fourth. This district was found to be strong in 24 indicators and weak in 9 indicators, as demonstrated in Figure 12. We observed that the strong points of this district were mainly in educational access (access to education, including vocational education and training) and in the sufficiency of educational staff in schools and education administrative and coordination offices, whereas the weak points of this district were mainly in gender equality in professions.
- Doun Penh (K02): The consolidated assessment results showed that Doun Penh was ranked second. This district was found to be strong in 26 indicators and weak in 7 indicators. We observed that the strong points of this district were mainly in hygiene and clean-water facility development in schools, and in the sufficiency of educational staff in schools and education administrative and coordination offices, as well as in gender equality in decision-making, whereas the weak points of this district were mainly in gender equality in professions.
- Prampir Makara (K03): The consolidated assessment results showed that Prampir Makara was ranked third. This district was found to be strong in 24 indicators and weak in 9 indicators. We observed that the strong points of this district were mainly in educational access (access to education, including vocational education and training) and gender equality in professions, whereas the weak points of this district were mainly in gender equality in access to education and hygiene facilities in schools.
- Tuol Kouk (K04): The consolidated assessment results showed that Tuol Kouk was ranked sixth. This district was found to be strong in 16 indicators and weak in 17 indicators. We observed that the strong points of this district were mainly in the sufficiency of educational staff in schools and education administrative and coordination offices and moderately in gender equality in decision-making, whereas the weak points of this district were mainly in gender equality in access to education and hygiene facilities in schools, and gender equality in professions.
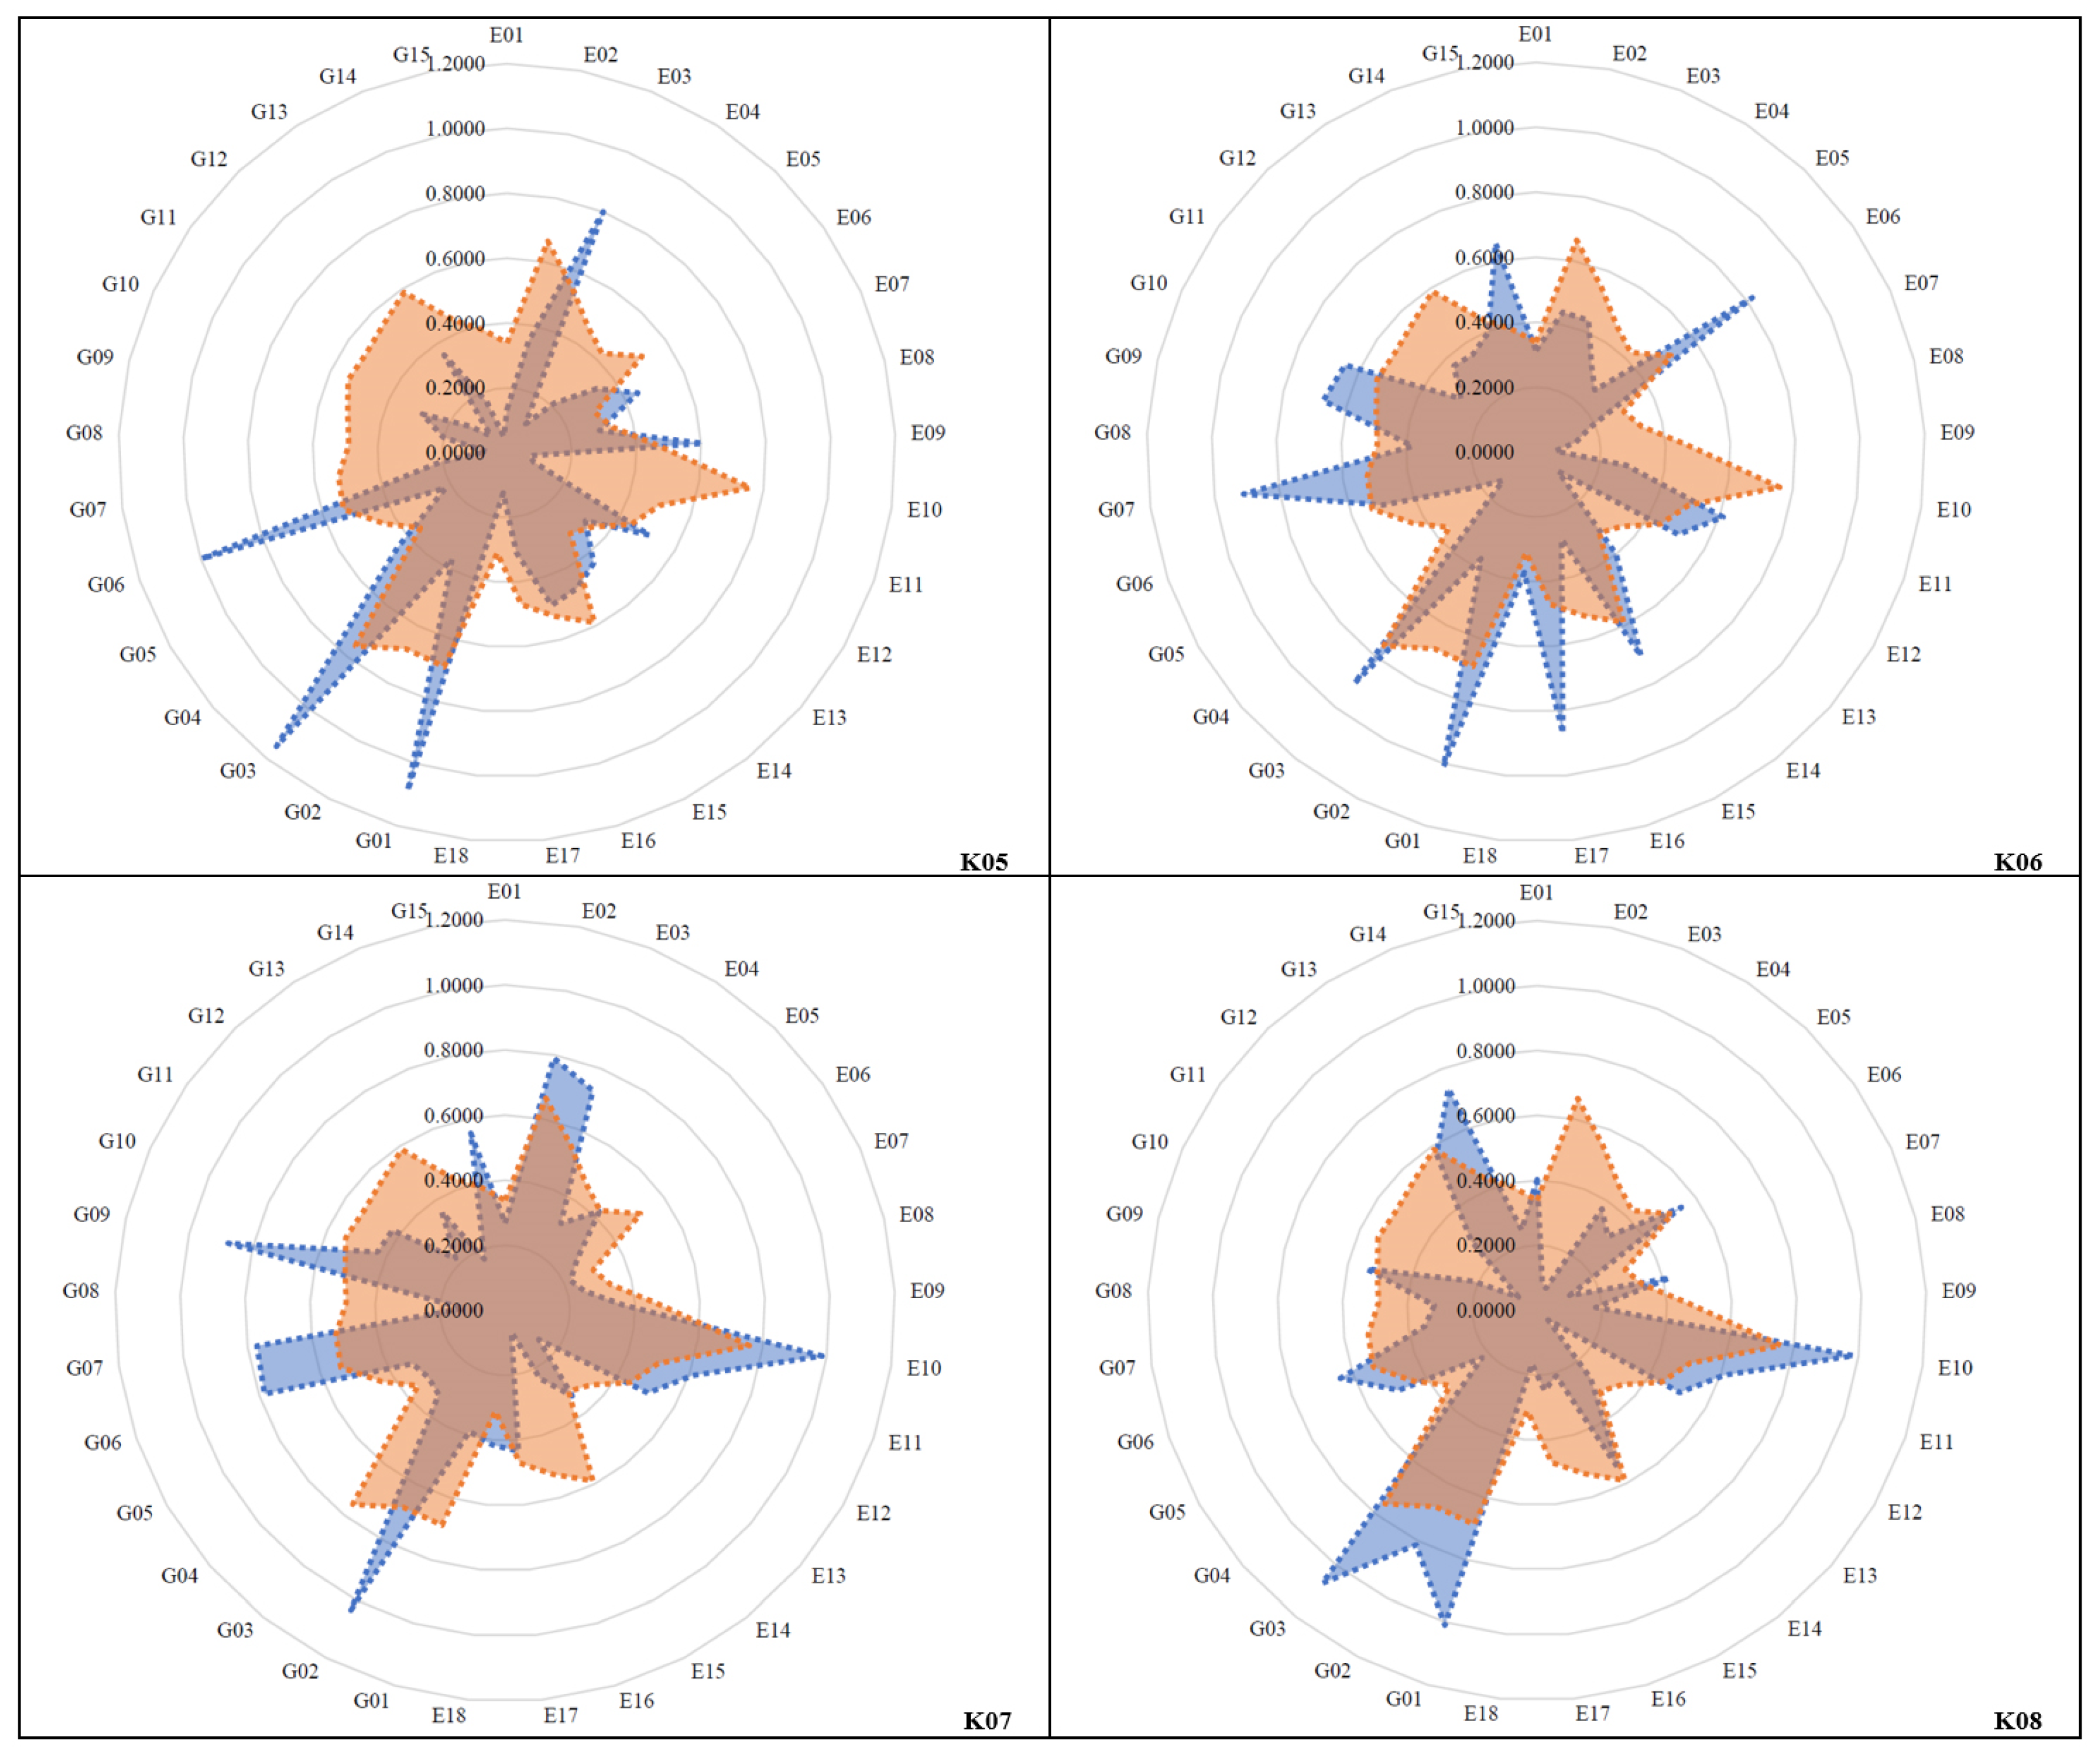
- Dangkao (K05): The consolidated assessment results showed that Dangkao was ranked fourteenth because this district was found to be strong in only 9 indicators but weak in 24 indicators, as demonstrated in Figure 13. We observed that the strong points of this district were mainly in gender equality in access to education and hygiene facilities in schools, whereas the weak points of this district were in almost all indicators of educational access (access to education, including vocational education and training), hygiene and clean-water facility development in schools, the sufficiency of educational staff in schools and education administrative and coordination offices, and gender equality in professions and decision-making.
- Mean Chey (K06): The consolidated assessment results showed that Mean Chey was ranked ninth. This district was found to be strong in 13 indicators and weak in 20 indicators. We observed that the strong points of this district were mainly in the sufficiency of educational staff in schools and education administrative and coordination offices and in gender equality in professions, whereas the weak points of this district were mainly in educational access (access to education, including vocational education and training), hygiene and clean-water facility development in schools, and gender equality in access to education and hygiene facilities in schools, as well as gender equality in decision-making.
- Russey Keo (K07): The consolidated assessment results showed that Russey Keo was ranked eleventh. This district was found to be strong in 12 indicators and weak in 21 indicators. We observed that the strong points of this district were mainly in gender equality in access to education and hygiene facilities in schools, whereas the weak points of this district were in the sufficiency of educational staff in schools and district education administrative and coordination offices, gender equality in access to education and hygiene facilities in schools, as well as gender equality in decision-making.
- Sen Sok (K08): The consolidated assessment results showed that Sen Sok was ranked thirteenth. This district was found to be strong in 13 indicators and weak in 20 indicators. We observed that the strong points of this district were only gender equality in access to education and hygiene facilities in schools, whereas the weak points of this district were almost all indicators of educational access (access to education, including vocational education and training), hygiene and clean-water facility development in schools, the sufficiency of educational staff in schools and education administrative and coordination offices, gender equality in professions, and gender equality in decision-making.
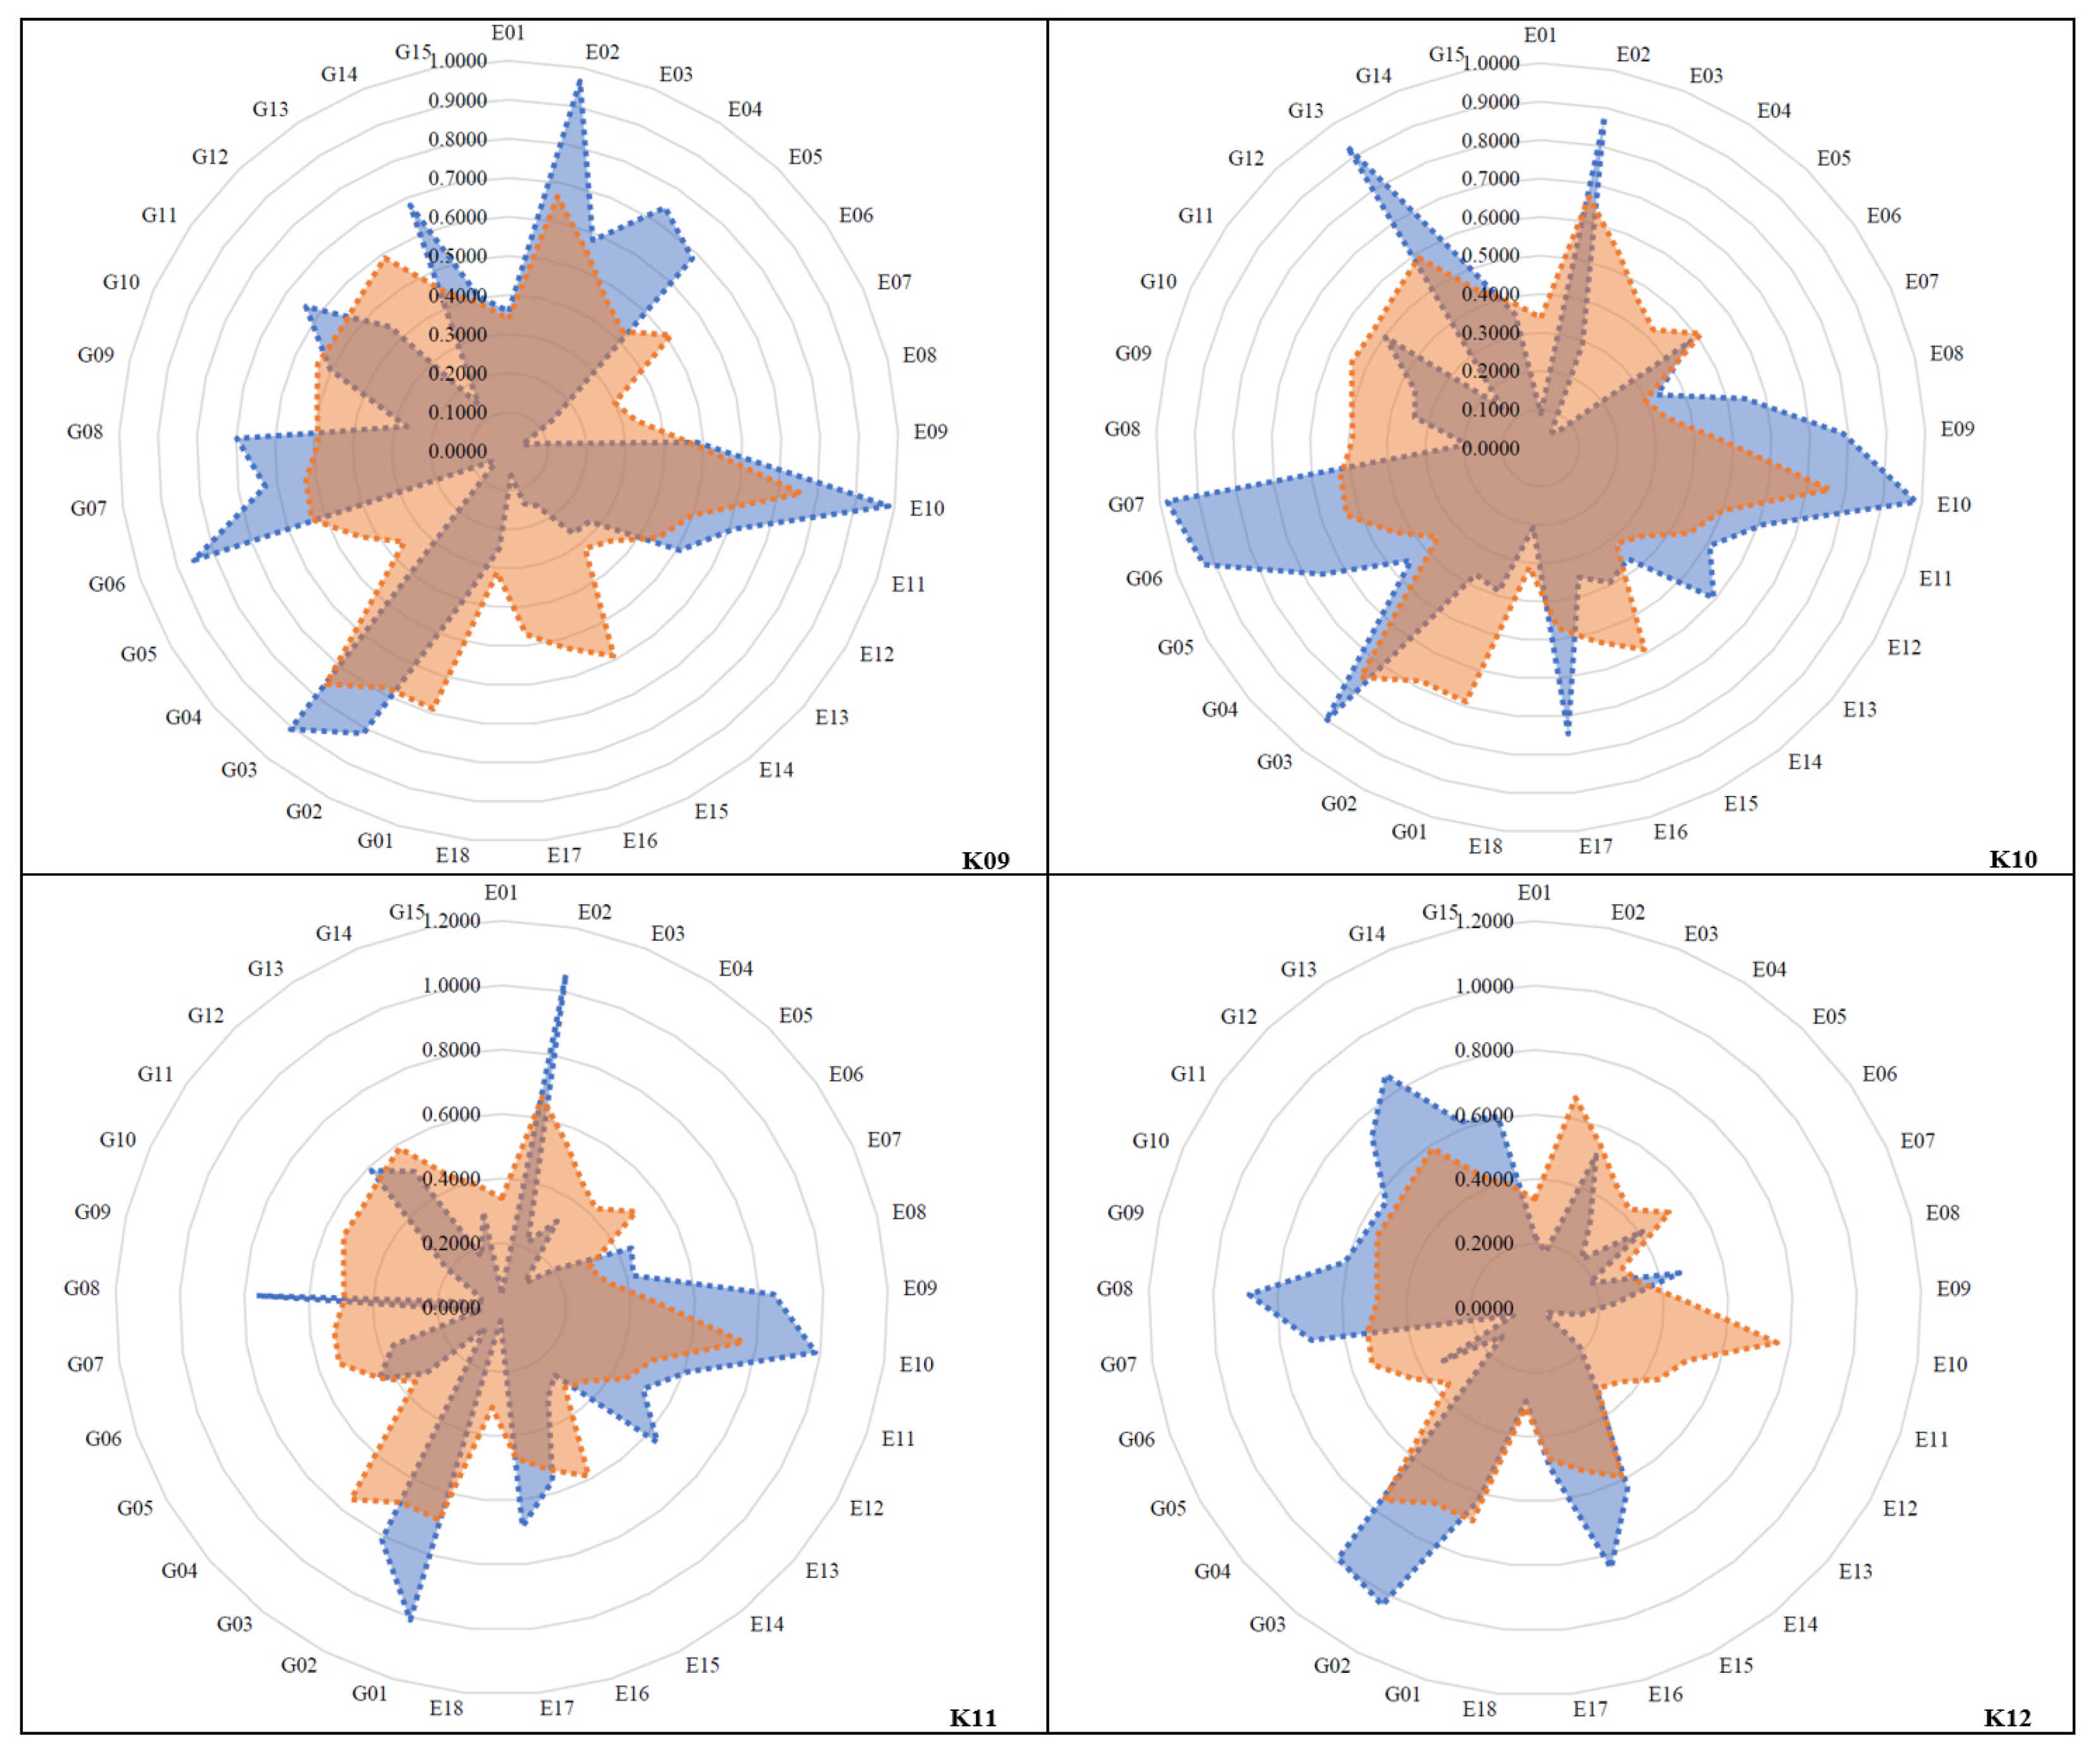
- Pou Senchey (K09): The consolidated assessment results showed that Pou Senchey was ranked tenth. This district was found to be strong in 17 indicators and weak in 16 indicators, as demonstrated in Figure 14. We observed that the strong points of this district were moderately in educational access (access to education, including vocational education and training) and gender equality in professions, whereas the weak points of this district were mainly in gender equality in decision-making. Its weak points were also moderately in hygiene and clean-water facility development in schools and gender equality in access to education and hygiene facilities in schools.
- Chroy Changvar (K10): The consolidated assessment results showed that Chroy Changvar was ranked fifth. This district was found to be strong in 17 indicators and weak in 16 indicators. We observed that the strong points of this district were mainly in hygiene and clean-water facility development in schools, and moderately in gender equality in access to education and hygiene facilities in schools and gender equality in professions, whereas the weak points of this district were mainly in educational access (access to education, including vocational education and training), and gender equality in professions and decision-making.
- Prek Pnov (K11): The consolidated assessment results showed that Prek Pnov was ranked twelfth. This district was found to be strong in 15 indicators and weak in 18 indicators. We observed that the strong points of this district were only in hygiene and clean-water facility development in schools, whereas the weak points of this district were mainly in educational access (access to education, including vocational education and training), and almost all indicators in gender equality in access to education and hygiene facilities in schools, gender equality in professions, and gender equality in decision-making.
- Chbar Ampov (K12): The consolidated assessment results showed that Chbar Ampov was ranked eighth. This district was found to be strong in 15 indicators and weak in 18 indicators. We observed that the strong points of this district were mainly in gender equality in professions and in decision-making, whereas the weak points of this district were mainly in educational access (access to education, including vocational education and training), and hygiene and clean-water facility development in schools.
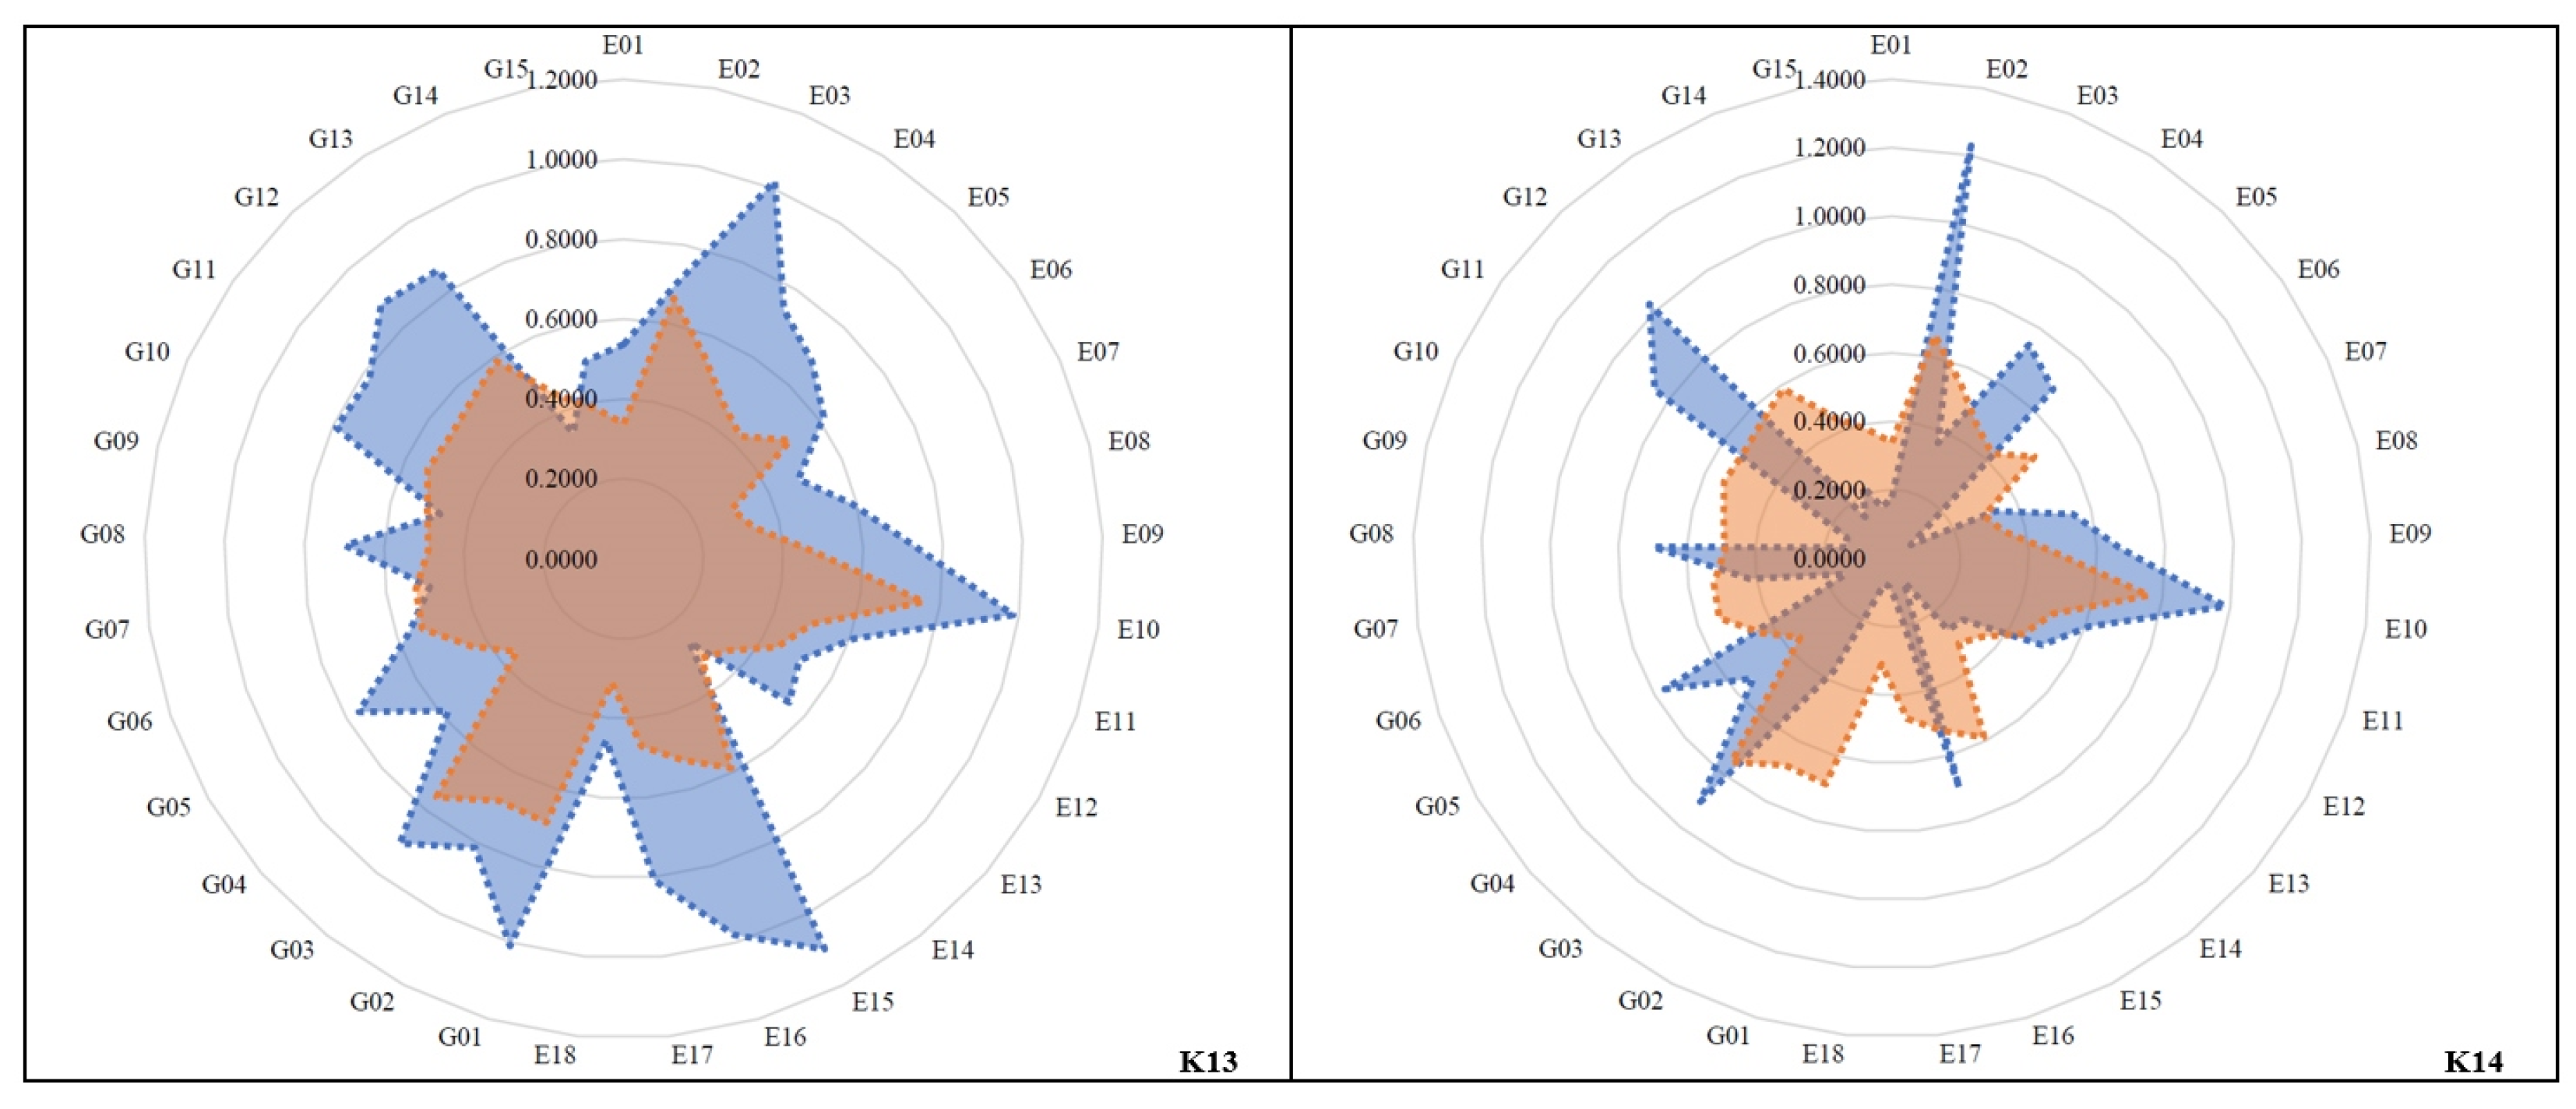
- Boeng Keng Kang (K13): The consolidated assessment results showed that Boeng Keng Kang was ranked first. This district was found to be strong in 29 indicators and weak in just 4 indicators, as demonstrated in Figure 15. We observed that the strong points of this district were in almost all indicators of educational access, facilities, and staff, as well as in gender equality in schools, profession, and decision-making, whereas the weak points of this district were only in gender equality in production and service profession, and in decision-making at the district sectoral office levels.
- Kamboul (K14): The consolidated assessment results showed that Kamboul was ranked seventh. This district was found to be strong in 16 indicators and weak in 17 indicators. We observed that the strong points of this district were mainly in hygiene and clean-water facility development in schools and moderately in educational access (access to education, including vocational education and training), whereas the weak points of this district were mainly in educational staff sufficiency, and gender equality in professions.
4. Conclusions
Author Contributions
Funding
Institutional Review Board Statement
Informed Consent Statement
Data Availability Statement
Acknowledgments
Conflicts of Interest
Appendix A. Indicators for Urban Education and Gender Equality Assessment

| No. | Indicator | Explanation |
|---|---|---|
| I | Access to education, including vocational education and training | |
| 1 | Percentage of children studying at preschool/ kindergartens (aged 3–5) | This indicator assesses early childcare and development through kindergartens; it addresses Target 4.2, and in comparative district assessments, the high percentage of children who have enrolled or studied in this program is much better. |
| 2 | Percentage of children studying at primary schools (aged 6–11) | This indicator assesses the complete and free primary education through the percentage of children that have enrolled or studied in this program, whereas it is currently free for public schools; this indicator addressed Target 4.1. |
| 3 | Percentage of children studying at secondary schools (aged 12–14) | This indicator assesses the complete and free secondary education through the percentage of children who have enrolled or studied in this program, which also addresses Target 4.1, as this program is currently free for public schools. |
| 4 | Percentage of illiterate youth (aged 15–24) | This indicator assesses the youths’ achievements in literacy through the percentage of illiterate youths aged 15 to 24 years old. Therefore, this indicator addresses Target 4.6. |
| 5 | Percentage of illiterate adults and middle-aged groups (aged 25–45) | This indicator assesses the achievement of adults and middle-aged people (aged 25–45) in literacy, which also addresses Target 4.6. In comparative district assessment, a low illiteracy rate is good. |
| 6 | Ratio of trained people to people aged 18–35 per 1,000 population | This indicator assesses vocational education and training through the ratio of trained people to people aged 18–35 per 1,000 population; this indicator addresses Target 4.3. |
| II | Hygiene and clean-water facilities in schools | |
| 7 | Ratio of proper toilets installed at primary schools per 100 students | This indicator assesses built hygiene facilities in primary schools through the ratio of primary schools having proper toilets installed per 100 students. This indicator addresses Target 4.a. |
| 8 | Ratio of proper toilets installed at secondary schools per 100 students | This indicator assesses built hygiene facilities in secondary schools through the ratio of secondary schools having proper toilets installed per 100 students. This indicator addresses Target 4.a. |
| 9 | Ratio of proper toilets installed at high schools per 100 students | This indicator assesses built hygiene facilities in high schools through the ratio of high schools having proper toilets installed per 100 students. This indicator addresses Target 4.a. |
| 10 | Percentage of primary schools having clean water to use/drink | This indicator assesses clean-water facilities in primary schools through the percentage of primary schools having clean water to use/drink. This indicator addresses Target 4.a. |
| 11 | Percentage of secondary schools having clean water to use/drink | This indicator assesses clean-water facilities in secondary schools through the percentage of secondary schools having clean water to use/drink. This indicator addresses Target 4.a. |
| 12 | Percentage of high schools having clean water to use/drink | This indicator assesses clean-water facilities in high schools through the percentage of high schools having clean water to use/drink. This indicator addresses Target 4.a. |
| III | Education staff in education coordination/administrative offices and schools | |
| 13 | Ratio of district education administrative office staff per 100,000 population | This indicator assesses the sufficiency of district education office staff to ensure equal access to all levels of education through the ratio of district education administrative office staff per 100,000 population. This indicator addresses Target 4.5. |
| 14 | Ratio of district education coordination NGO staff per 100,000 population | This indicator assesses the sufficiency of district education coordination NGO staff to help and support the inclusion of persons with disabilities, indigenous peoples, and children in vulnerable situations. This indicator addresses Target 4.5. |
| 15 | Ratio of number of primary school students per teacher | This indicator assesses the sufficiency of primary school teachers to support complete primary education through the ratio of the number of students per teacher. This indicator addresses Target 4.1. |
| 16 | Ratio of number of secondary school students per teacher | This indicator assesses the sufficiency of secondary school teachers to support complete and free secondary education through the ratio of the number of students per teacher; consequently, this indicator also addresses Target 4.1. |
| 17 | Ratio of number of high school students per teacher | This indicator assesses the sufficiency of high school teachers to support technical and tertiary education through the ratio of the number of high school students per teacher; therefore, this indicator addresses Target 4.3. |
| 18 | Percentage of primary and secondary school female teachers | This indicator assesses gender equality in education and the adaptation of sound policies for promoting gender equality through the rate of female teachers from primary to secondary schools, which addresses Targets 4.5 and 5.c. |
| IV | Gender equality in access to education and hygiene facilities in schools | |
| 19 | Ratio of female students to male students studying at university | This indicator assesses gender equality in higher education access and women’s equal opportunities through the ratio of female to male students who have studied in university, which addresses both Targets 4.5 and 5.5. |
| 20 | Ratio of female students to male students studying at high schools | This indicator assesses gender equality in education and the adaptation of sound policies for promoting gender equality through the ratio of female to male students who have studied in high school, which addresses Targets 4.5 and 5.c. |
| 21 | Ratio of female literates to male literates aged (15 to 17) years old | This indicator assesses literacy achievement by gender (ending traditional forms of discrimination in education against females) through the ratio of female to male literates. Therefore, this indicator addresses both Targets 4.6 and 5.1. |
| 22 | Ratio of primary schools having separate toilets for females per 100 students | This indicator assesses the adaptation of sound gender policies in built hygiene facilities in primary schools through the ratio of schools having separate toilets for females per 100 students. This indicator addresses Targets 4.a. and 5.c. |
| 23 | Ratio of secondary schools having separate toilets for females per 100 students | This indicator assesses the adaptation of sound gender policies in built hygiene facilities in secondary schools through the ratio of schools having separate toilets for females per 100 students. This indicator also addresses Targets 4.a. and 5.c. |
| V | Gender equality in profession | |
| 24 | Ratio of the number of vocation-trained women to 100 men aged (18 to 35) years old | This indicator assesses technical work capacity by gender or women’s equal opportunities for vocational education and training through the ratio of the number of vocation-trained women to 100 men aged 18–35. Therefore, this indicator addresses both Targets 4.3 and 5.5. |
| 25 | Ratio of female employees to total employees in production and service sectors | This indicator assesses the employment rate by gender in production and service sectors or women’s equal job opportunities in production and services through the ratio of female employees to total employees in production and services. This indicator addresses Target 5.5. |
| 26 | Percentage of women working at district technical offices | This indicator assesses women’s full and effective participation and equal opportunities for leadership at the level of decision-making in technical office works through the percentage of women working at district technical offices. This indicator addresses Target 5.5. |
| 27 | Percentage of female teachers in primary schools | This indicator assesses gender equalities in teaching careers, including the adaptation of sound policies for promoting gender equalities through the rate of female teachers in primary schools, which addresses Targets 4.5 and 5.c. |
| 28 | Percentage of female teachers in secondary schools | This indicator assesses gender equalities in teaching careers, including the adaptation of sound policies for promoting gender equalities through the rate of female teachers in secondary schools, which addresses Targets 4.5 and 5.c. |
| VI | Gender equality in decision-making | |
| 29 | Percentage of village chiefs as women | This indicator assesses women’s full and effective participation and equal opportunities for leadership at the level of decision-making in village-level planning and development through the percentage of village chiefs as women. Thus, this indicator addresses Target 5.5. |
| 30 | Percentage of Sankat council members as women | This indicator assesses women’s full and effective participation and equal opportunities for leadership at the level of decision-making in commune-level planning and development through the percentage of Sankat (commune) council members as women. Consequently, this indicator also addresses Target 5.5. |
| 31 | Percentage of district council members as women | This indicator assesses women’s full and effective participation and equal opportunities for leadership at the level of decision-making in district-level planning and development through the percentage of district council members as women. This indicator addresses Target 5.5. |
| 32 | Percentage of district sectoral office vice-chiefs as women | This indicator assesses women’s full and effective participation and equal opportunities for leadership at the level of decision-making in supporting district sectoral office-level planning and development through the percentage of district sectoral office vice-chiefs as women. Therefore, this indicator addresses Target 5.5. |
| 33 | Percentage of district sectoral office chiefs as women | This indicator assesses women’s full and effective participation and equal opportunities for leadership at the level of decision-making in managing district sectoral office-level planning and development through the percentage of district sectoral office chiefs as women. Consequently, this indicator addresses Target 5.5. |
Appendix B. Standard Value-Based Urban Education Assessment Results
| Ind. | District | Z-Value | p-Value | Rank | Ind. | District | Z-Value | p-Value | Rank | Ind. | District | Z-Value | p-Value | Rank |
|---|---|---|---|---|---|---|---|---|---|---|---|---|---|---|
| E01 | K01 | 0.6927 | 0.7558 | 5 | E03 | K01 | 1.3892 | 0.9176 | 2 | E05 | K01 | −0.9748 | 0.1648 | 14 |
| K02 | 0.7687 | 0.7790 | 4 | K02 | 0.1668 | 0.5663 | 6 | K02 | −0.5921 | 0.2769 | 9 | |||
| K03 | 1.1317 | 0.8711 | 1 | K03 | 0.4936 | 0.6892 | 3 | K03 | −0.8472 | 0.1984 | 10 | |||
| K04 | 1.1317 | 0.8711 | 1 | K04 | −1.0919 | 0.1374 | 13 | K04 | −0.2095 | 0.4170 | 7 | |||
| K05 | −1.0882 | 0.1382 | 12 | K05 | 0.4089 | 0.6587 | 4 | K05 | 0.4282 | 0.6657 | 3 | |||
| K06 | 0.2791 | 0.6099 | 8 | K06 | −0.0268 | 0.4893 | 9 | K06 | 0.3006 | 0.6181 | 5 | |||
| K07 | −0.2779 | 0.3905 | 9 | K07 | 0.2516 | 0.5993 | 5 | K07 | −0.2095 | 0.4170 | 7 | |||
| K08 | 0.6759 | 0.7504 | 6 | K08 | −2.1085 | 0.0175 | 14 | K08 | 0.1731 | 0.5687 | 6 | |||
| K09 | 0.6590 | 0.7450 | 7 | K09 | 0.0821 | 0.5327 | 7 | K09 | −0.8472 | 0.1984 | 10 | |||
| K10 | −1.5356 | 0.0623 | 13 | K10 | −0.6077 | 0.2717 | 11 | K10 | 2.2137 | 0.9866 | 1 | |||
| K11 | −1.6031 | 0.0545 | 14 | K11 | −0.8377 | 0.2011 | 12 | K11 | 1.8311 | 0.9665 | 2 | |||
| K12 | −0.7253 | 0.2341 | 10 | K12 | 0.0458 | 0.5183 | 8 | K12 | 0.4282 | 0.6657 | 3 | |||
| K13 | 0.8616 | 0.8055 | 3 | K13 | 1.9581 | 0.9749 | 1 | K13 | −0.8472 | 0.1984 | 10 | |||
| K14 | −0.9701 | 0.1660 | 11 | K14 | −0.1236 | 0.4508 | 10 | K14 | −0.8472 | 0.1984 | 10 | |||
| E02 | K01 | 1.0452 | 0.8520 | 1 | E04 | K01 | −0.7932 | 0.2138 | 10 | E06 | K01 | 1.3027 | 0.9037 | 2 |
| K02 | 0.1720 | 0.5683 | 9 | K02 | −0.5084 | 0.3056 | 8 | K02 | 0.7939 | 0.7864 | 4 | |||
| K03 | 0.2664 | 0.6050 | 8 | K03 | −0.7932 | 0.2138 | 10 | K03 | 1.4348 | 0.9243 | 1 | |||
| K04 | −1.1734 | 0.1203 | 12 | K04 | −0.5084 | 0.3056 | 8 | K04 | 0.6385 | 0.7384 | 5 | |||
| K05 | −0.9373 | 0.1743 | 11 | K05 | 0.6305 | 0.7358 | 2 | K05 | −0.6487 | 0.2583 | 10 | |||
| K06 | −0.4417 | 0.3294 | 10 | K06 | 0.3457 | 0.6352 | 3 | K06 | 1.0242 | 0.8471 | 3 | |||
| K07 | 0.4788 | 0.6840 | 6 | K07 | 0.3457 | 0.6352 | 3 | K07 | −0.6845 | 0.2468 | 11 | |||
| K08 | −1.9050 | 0.0284 | 14 | K08 | 0.0610 | 0.5243 | 7 | K08 | 0.4047 | 0.6571 | 7 | |||
| K09 | 0.8800 | 0.8106 | 4 | K09 | −0.7932 | 0.2138 | 10 | K09 | −1.3522 | 0.0882 | 13 | |||
| K10 | 0.7384 | 0.7699 | 5 | K10 | 2.9083 | 0.9982 | 1 | K10 | −0.1220 | 0.4514 | 8 | |||
| K11 | 0.9036 | 0.8169 | 3 | K11 | 0.3457 | 0.6352 | 3 | K11 | −1.1647 | 0.1221 | 12 | |||
| K12 | −1.4566 | 0.0726 | 13 | K12 | 0.3457 | 0.6352 | 3 | K12 | −0.4399 | 0.3300 | 9 | |||
| K13 | 0.3844 | 0.6497 | 7 | K13 | −0.7932 | 0.2138 | 10 | K13 | 0.4082 | 0.6584 | 6 | |||
| K14 | 1.0452 | 0.8520 | 1 | K14 | −0.7932 | 0.2138 | 10 | K14 | −1.5950 | 0.0554 | 14 |
| Ind. | District | Z-Value | p-Value | Rank | Ind. | District | Z-Value | p-Value | Rank | Ind. | District | Z-Value | p-Value | Rank |
|---|---|---|---|---|---|---|---|---|---|---|---|---|---|---|
| E07 | K01 | −0.2015 | 0.4202 | 6 | E09 | K01 | −0.2011 | 0.4203 | 7 | E11 | K01 | 0.4819 | 0.6851 | 1 |
| K02 | −0.0840 | 0.4665 | 3 | K02 | 0.0335 | 0.5134 | 5 | K02 | 0.4819 | 0.6851 | 1 | |||
| K03 | 3.3249 | 0.9996 | 1 | K03 | −0.9049 | 0.1828 | 13 | K03 | 0.4819 | 0.6851 | 1 | |||
| K04 | −0.5541 | 0.2897 | 12 | K04 | −0.3184 | 0.3751 | 9 | K04 | −0.9515 | 0.1707 | 12 | |||
| K05 | −0.0840 | 0.4665 | 3 | K05 | 0.0335 | 0.5134 | 5 | K05 | −1.9730 | 0.0242 | 13 | |||
| K06 | −0.4366 | 0.3312 | 10 | K06 | −1.3741 | 0.0847 | 14 | K06 | 0.4819 | 0.6851 | 1 | |||
| K07 | −0.3191 | 0.3748 | 9 | K07 | −0.3184 | 0.3751 | 9 | K07 | 0.4819 | 0.6851 | 1 | |||
| K08 | −0.5541 | 0.2897 | 12 | K08 | −0.5530 | 0.2901 | 12 | K08 | 0.4819 | 0.6851 | 1 | |||
| K09 | −0.6717 | 0.2509 | 14 | K09 | −0.2011 | 0.4203 | 7 | K09 | 0.4819 | 0.6851 | 1 | |||
| K10 | −0.2015 | 0.4202 | 6 | K10 | 0.7373 | 0.7695 | 2 | K10 | 0.4819 | 0.6851 | 1 | |||
| K11 | −0.0840 | 0.4665 | 3 | K11 | 2.9660 | 0.9985 | 1 | K11 | 0.4819 | 0.6851 | 1 | |||
| K12 | −0.4366 | 0.3312 | 10 | K12 | −0.4357 | 0.3315 | 11 | K12 | −2.3764 | 0.0087 | 14 | |||
| K13 | 0.5038 | 0.6928 | 2 | K13 | 0.3854 | 0.6500 | 3 | K13 | 0.4819 | 0.6851 | 1 | |||
| K14 | −0.2015 | 0.4202 | 6 | K14 | 0.1508 | 0.5599 | 4 | K14 | 0.4819 | 0.6851 | 1 | |||
| E08 | K01 | −0.6397 | 0.2612 | 9 | E10 | K01 | 0.5493 | 0.7086 | 1 | E12 | K01 | 0.3888 | 0.6513 | 1 |
| K02 | −0.6397 | 0.2612 | 9 | K02 | 0.5493 | 0.7086 | 1 | K02 | 0.3888 | 0.6513 | 1 | |||
| K03 | −1.1995 | 0.1152 | 14 | K03 | 0.5493 | 0.7086 | 1 | K03 | 0.3888 | 0.6513 | 1 | |||
| K04 | −0.0800 | 0.4681 | 5 | K04 | −0.5964 | 0.2754 | 11 | K04 | −1.9455 | 0.0259 | 13 | |||
| K05 | −0.2665 | 0.3949 | 8 | K05 | −2.2685 | 0.0116 | 14 | K05 | 0.3888 | 0.6513 | 1 | |||
| K06 | −0.8263 | 0.2043 | 12 | K06 | −0.5964 | 0.2754 | 11 | K06 | 0.3888 | 0.6513 | 1 | |||
| K07 | −0.6397 | 0.2612 | 9 | K07 | 0.5493 | 0.7086 | 1 | K07 | 0.3888 | 0.6513 | 1 | |||
| K08 | −0.0800 | 0.4681 | 5 | K08 | 0.5493 | 0.7086 | 1 | K08 | 0.3888 | 0.6513 | 1 | |||
| K09 | −1.0129 | 0.1556 | 13 | K09 | 0.5493 | 0.7086 | 1 | K09 | 0.3888 | 0.6513 | 1 | |||
| K10 | 1.5993 | 0.9451 | 2 | K10 | 0.5493 | 0.7086 | 1 | K10 | 0.3888 | 0.6513 | 1 | |||
| K11 | −0.0800 | 0.4681 | 5 | K11 | 0.5493 | 0.7086 | 1 | K11 | 0.3888 | 0.6513 | 1 | |||
| K12 | 0.4798 | 0.6843 | 4 | K12 | −2.0311 | 0.0211 | 13 | K12 | −2.7205 | 0.0033 | 14 | |||
| K13 | 1.7858 | 0.9629 | 1 | K13 | 0.5493 | 0.7086 | 1 | K13 | 0.3888 | 0.6513 | 1 | |||
| K14 | 1.5993 | 0.9451 | 2 | K14 | 0.5493 | 0.7086 | 1 | K14 | 0.3888 | 0.6513 | 1 |
| Ind. | District | Z-Value | p-Value | Rank | Ind. | District | Z-Value | p-Value | Rank | Ind. | District | Z-Value | p-Value | Rank |
|---|---|---|---|---|---|---|---|---|---|---|---|---|---|---|
| E13 | K01 | 0.9053 | 0.8173 | 3 | E15 | K01 | −1.2547 | 0.1048 | 13 | E17 | K01 | −0.3073 | 0.3793 | 10 |
| K02 | 0.8849 | 0.8119 | 5 | K02 | −0.9261 | 0.1772 | 12 | K02 | −0.1882 | 0.4254 | 9 | |||
| K03 | 0.2329 | 0.5921 | 6 | K03 | −0.5399 | 0.2946 | 10 | K03 | 0.8091 | 0.7908 | 3 | |||
| K04 | −0.0524 | 0.4791 | 7 | K04 | −0.6796 | 0.2484 | 11 | K04 | 0.1393 | 0.5554 | 6 | |||
| K05 | −0.2765 | 0.3911 | 8 | K05 | 0.2899 | 0.6141 | 6 | K05 | 0.1839 | 0.5730 | 5 | |||
| K06 | −1.4176 | 0.0781 | 13 | K06 | −0.4249 | 0.3355 | 9 | K06 | −2.1231 | 0.0169 | 14 | |||
| K07 | −1.0712 | 0.1420 | 12 | K07 | 0.7829 | 0.7831 | 3 | K07 | 0.0500 | 0.5199 | 7 | |||
| K08 | −1.5603 | 0.0593 | 14 | K08 | 0.2488 | 0.5983 | 7 | K08 | 0.2286 | 0.5904 | 4 | |||
| K09 | −0.4192 | 0.3375 | 9 | K09 | 1.0540 | 0.8541 | 2 | K09 | 1.7617 | 0.9609 | 1 | |||
| K10 | 1.0276 | 0.8479 | 2 | K10 | 0.5446 | 0.7070 | 5 | K10 | −0.6942 | 0.2438 | 12 | |||
| K11 | 1.7815 | 0.9626 | 1 | K11 | 0.5610 | 0.7126 | 4 | K11 | −0.3073 | 0.3793 | 10 | |||
| K12 | −0.5211 | 0.3012 | 11 | K12 | 0.0681 | 0.5271 | 8 | K12 | −0.0542 | 0.4784 | 8 | |||
| K13 | 0.9053 | 0.8173 | 3 | K13 | −1.7476 | 0.0403 | 14 | K13 | −1.1259 | 0.1301 | 13 | |||
| K14 | −0.4192 | 0.3375 | 9 | K14 | 2.0235 | 0.9785 | 1 | K14 | 1.6277 | 0.9482 | 2 | |||
| E14 | K01 | −0.3454 | 0.3649 | 7 | E16 | K01 | −0.5960 | 0.2756 | 11 | E18 | K01 | 1.0128 | 0.8444 | 3 |
| K02 | 3.4423 | 0.9997 | 1 | K02 | −1.2518 | 0.1053 | 13 | K02 | 0.2028 | 0.5804 | 7 | |||
| K03 | −0.3454 | 0.3649 | 7 | K03 | −0.3173 | 0.3755 | 9 | K03 | 1.6958 | 0.9550 | 1 | |||
| K04 | −0.3454 | 0.3649 | 7 | K04 | 0.1909 | 0.5757 | 6 | K04 | 1.1982 | 0.8846 | 2 | |||
| K05 | 0.1103 | 0.5439 | 2 | K05 | −0.2026 | 0.4197 | 7 | K05 | −0.7681 | 0.2212 | 12 | |||
| K06 | −0.0872 | 0.4652 | 3 | K06 | 0.5188 | 0.6980 | 4 | K06 | 0.2614 | 0.6031 | 6 | |||
| K07 | −0.2370 | 0.4063 | 5 | K07 | 2.0270 | 0.9787 | 1 | K07 | 0.5249 | 0.7002 | 5 | |||
| K08 | −0.3454 | 0.3649 | 7 | K08 | 0.9942 | 0.8399 | 3 | K08 | −0.5729 | 0.2833 | 11 | |||
| K09 | −0.3454 | 0.3649 | 7 | K09 | 1.4204 | 0.9223 | 2 | K09 | −0.4266 | 0.3348 | 9 | |||
| K10 | −0.1557 | 0.4382 | 4 | K10 | 0.4040 | 0.6569 | 5 | K10 | −0.4363 | 0.3313 | 10 | |||
| K11 | −0.3454 | 0.3649 | 7 | K11 | −0.2354 | 0.4070 | 8 | K11 | −2.0025 | 0.0226 | 14 | |||
| K12 | −0.3093 | 0.3786 | 6 | K12 | −0.9731 | 0.1653 | 12 | K12 | 0.0613 | 0.5245 | 8 | |||
| K13 | −0.3454 | 0.3649 | 7 | K13 | −1.4321 | 0.0761 | 14 | K13 | 0.5444 | 0.7069 | 4 | |||
| K14 | −0.3454 | 0.3649 | 7 | K14 | −0.5469 | 0.2922 | 10 | K14 | −1.2951 | 0.0977 | 13 |
Appendix C. Standard Value-Based Urban Gender Equality Assessment Results
| Ind. | District | Z-Value | p-Value | Rank | Ind. | District | Z-Value | p-Value | Rank | Ind. | District | Z-Value | p-Value | Rank |
|---|---|---|---|---|---|---|---|---|---|---|---|---|---|---|
| G01 | K01 | −0.9389 | 0.1739 | 10 | G03 | K01 | 0.0000 | 0.5000 | 4 | G05 | K01 | −0.7917 | 0.2143 | 11 |
| K02 | −0.0626 | 0.4750 | 7 | K02 | −0.5701 | 0.2843 | 11 | K02 | 0.0776 | 0.5309 | 4 | |||
| K03 | −0.0626 | 0.4750 | 7 | K03 | 0.0000 | 0.5000 | 4 | K03 | 0.0776 | 0.5309 | 4 | |||
| K04 | 0.8137 | 0.7921 | 2 | K04 | −0.5701 | 0.2843 | 11 | K04 | −0.3571 | 0.3605 | 7 | |||
| K05 | 1.6900 | 0.9545 | 1 | K05 | 2.2804 | 0.9887 | 1 | K05 | −0.7917 | 0.2143 | 11 | |||
| K06 | 0.8137 | 0.7921 | 2 | K06 | 0.0000 | 0.5000 | 4 | K06 | −0.7917 | 0.2143 | 11 | |||
| K07 | −0.9389 | 0.1739 | 10 | K07 | −0.5701 | 0.2843 | 11 | K07 | −0.5744 | 0.2829 | 9 | |||
| K08 | 0.8137 | 0.7921 | 2 | K08 | 1.1402 | 0.8729 | 2 | K08 | −0.1397 | 0.4444 | 6 | |||
| K09 | −0.9389 | 0.1739 | 10 | K09 | 0.0000 | 0.5000 | 4 | K09 | −1.0091 | 0.1565 | 14 | |||
| K10 | −0.9389 | 0.1739 | 10 | K10 | 0.0000 | 0.5000 | 4 | K10 | 1.5990 | 0.9451 | 3 | |||
| K11 | 0.8137 | 0.7921 | 2 | K11 | −2.2804 | 0.0113 | 14 | K11 | −0.3571 | 0.3605 | 7 | |||
| K12 | −0.0626 | 0.4750 | 7 | K12 | 0.5701 | 0.7157 | 3 | K12 | −0.5744 | 0.2829 | 9 | |||
| K13 | 0.8137 | 0.7921 | 2 | K13 | 0.0000 | 0.5000 | 4 | K13 | 1.8163 | 0.9653 | 1 | |||
| K14 | −1.8152 | 0.0347 | 14 | K14 | 0.0000 | 0.5000 | 4 | K14 | 1.8163 | 0.9653 | 1 | |||
| G02 | K01 | 0.2401 | 0.5949 | 4 | G04 | K01 | −0.1794 | 0.4288 | 5 | |||||
| K02 | 1.3604 | 0.9132 | 1 | K02 | −0.1076 | 0.4571 | 4 | |||||||
| K03 | −2.0006 | 0.0227 | 14 | K03 | 3.4079 | 0.9997 | 1 | |||||||
| K04 | 0.2401 | 0.5949 | 4 | K04 | −0.3946 | 0.3466 | 10 | |||||||
| K05 | −0.8803 | 0.1894 | 10 | K05 | −0.1794 | 0.4288 | 5 | |||||||
| K06 | −0.8803 | 0.1894 | 10 | K06 | −0.4663 | 0.3205 | 12 | |||||||
| K07 | 1.3604 | 0.9132 | 1 | K07 | −0.3229 | 0.3734 | 8 | |||||||
| K08 | 0.2401 | 0.5949 | 4 | K08 | −0.3946 | 0.3466 | 10 | |||||||
| K09 | 0.2401 | 0.5949 | 4 | K09 | −0.5381 | 0.2953 | 14 | |||||||
| K10 | −0.8803 | 0.1894 | 10 | K10 | −0.1794 | 0.4288 | 5 | |||||||
| K11 | 0.2401 | 0.5949 | 4 | K11 | −0.3229 | 0.3734 | 8 | |||||||
| K12 | 1.3604 | 0.9132 | 1 | K12 | −0.4663 | 0.3205 | 12 | |||||||
| K13 | 0.2401 | 0.5949 | 4 | K13 | 0.1794 | 0.5712 | 2 | |||||||
| K14 | −0.8803 | 0.1894 | 10 | K14 | −0.0359 | 0.4857 | 3 | |||||||
| Ind. | District | Z-Value | p-Value | Rank | Ind. | District | Z-Value | p-Value | Rank | Ind. | District | Z-Value | p-Value | Rank |
|---|---|---|---|---|---|---|---|---|---|---|---|---|---|---|
| G06 | K01 | −0.2585 | 0.3980 | 12 | G08 | K01 | 0.0977 | 0.5389 | 7 | G10 | K01 | 1.0121 | 0.8443 | 3 |
| K02 | −0.1360 | 0.4459 | 9 | K02 | 0.0559 | 0.5223 | 8 | K02 | 0.5675 | 0.7148 | 5 | |||
| K03 | 0.2877 | 0.6132 | 5 | K03 | 1.0161 | 0.8452 | 2 | K03 | 1.4484 | 0.9262 | 1 | |||
| K04 | −0.2381 | 0.4059 | 11 | K04 | −0.1006 | 0.4599 | 11 | K04 | 1.0876 | 0.8616 | 2 | |||
| K05 | 2.1254 | 0.9832 | 1 | K05 | −2.7099 | 0.0034 | 14 | K05 | −0.5651 | 0.2860 | 11 | |||
| K06 | −0.1105 | 0.4560 | 8 | K06 | −0.0067 | 0.4973 | 9 | K06 | 0.2655 | 0.6047 | 6 | |||
| K07 | 0.3592 | 0.6403 | 4 | K07 | −1.1861 | 0.1178 | 13 | K07 | −0.0785 | 0.4687 | 9 | |||
| K08 | −0.0135 | 0.4946 | 6 | K08 | −0.0589 | 0.4765 | 10 | K08 | −0.9846 | 0.1624 | 12 | |||
| K09 | 0.7880 | 0.7846 | 3 | K09 | 0.4734 | 0.6820 | 4 | K09 | −0.0449 | 0.4821 | 8 | |||
| K10 | 1.0228 | 0.8468 | 2 | K10 | −0.4973 | 0.3095 | 12 | K10 | −0.2882 | 0.3866 | 10 | |||
| K11 | −0.1768 | 0.4298 | 10 | K11 | 0.5778 | 0.7183 | 3 | K11 | −2.0333 | 0.0210 | 14 | |||
| K12 | −1.9737 | 0.0242 | 14 | K12 | 1.3919 | 0.9180 | 1 | K12 | 0.0306 | 0.5122 | 7 | |||
| K13 | −0.0901 | 0.4641 | 7 | K13 | 0.4734 | 0.6820 | 4 | K13 | 0.9534 | 0.8298 | 4 | |||
| K14 | −1.5858 | 0.0564 | 13 | K14 | 0.4734 | 0.6820 | 4 | K14 | −1.3705 | 0.0853 | 13 | |||
| G07 | K01 | −0.9794 | 0.1637 | 13 | G09 | K01 | 0.8935 | 0.8142 | 4 | |||||
| K02 | 0.8533 | 0.8033 | 3 | K02 | −0.2680 | 0.3944 | 9 | |||||||
| K03 | −0.1309 | 0.4479 | 7 | K03 | 1.7979 | 0.9639 | 1 | |||||||
| K04 | −0.8436 | 0.1994 | 11 | K04 | 1.1915 | 0.8833 | 3 | |||||||
| K05 | −0.9455 | 0.1722 | 12 | K05 | −0.9258 | 0.1773 | 12 | |||||||
| K06 | 0.9891 | 0.8387 | 2 | K06 | 0.2254 | 0.5892 | 5 | |||||||
| K07 | 0.5479 | 0.7081 | 4 | K07 | 1.2018 | 0.8853 | 2 | |||||||
| K08 | −0.4364 | 0.3313 | 10 | K08 | −0.0007 | 0.4997 | 7 | |||||||
| K09 | 0.2085 | 0.5826 | 6 | K09 | −0.8435 | 0.1995 | 11 | |||||||
| K10 | 2.3806 | 0.9914 | 1 | K10 | −0.5660 | 0.2857 | 10 | |||||||
| K11 | −1.4885 | 0.0683 | 14 | K11 | −1.7274 | 0.0420 | 14 | |||||||
| K12 | 0.3782 | 0.6474 | 5 | K12 | 0.0918 | 0.5366 | 6 | |||||||
| K13 | −0.1988 | 0.4212 | 8 | K13 | −0.0213 | 0.4915 | 8 | |||||||
| K14 | −0.3345 | 0.3690 | 9 | K14 | −1.0491 | 0.1471 | 13 | |||||||
| Ind. | District | Z-Value | p-Value | Rank | Ind. | District | Z-Value | p-Value | Rank | Ind. | District | Z-Value | p-Value | Rank |
|---|---|---|---|---|---|---|---|---|---|---|---|---|---|---|
| G11 | K01 | −0.5414 | 0.2941 | 10 | G13 | K01 | 0.6753 | 0.7502 | 3 | G15 | K01 | 0.2218 | 0.5878 | 5 |
| K02 | 1.7300 | 0.9582 | 2 | K02 | 1.7773 | 0.9622 | 1 | K02 | 2.0735 | 0.9809 | 1 | |||
| K03 | 2.2074 | 0.9864 | 1 | K03 | −0.4666 | 0.3204 | 9 | K03 | −0.8316 | 0.2028 | 10 | |||
| K04 | −0.0805 | 0.4679 | 5 | K04 | 0.6753 | 0.7502 | 3 | K04 | −1.0090 | 0.1565 | 13 | |||
| K05 | −1.0023 | 0.1581 | 13 | K05 | −0.7322 | 0.2320 | 10 | K05 | −1.1199 | 0.1314 | 14 | |||
| K06 | −0.7307 | 0.2325 | 11 | K06 | −0.7322 | 0.2320 | 10 | K06 | 1.7021 | 0.9556 | 2 | |||
| K07 | −0.3110 | 0.3779 | 9 | K07 | −0.7322 | 0.2320 | 10 | K07 | 0.4546 | 0.6753 | 4 | |||
| K08 | −1.0517 | 0.1465 | 14 | K08 | −0.0285 | 0.4887 | 7 | K08 | −0.8316 | 0.2028 | 10 | |||
| K09 | −0.1958 | 0.4224 | 6 | K09 | −1.4226 | 0.0774 | 13 | K09 | 0.0388 | 0.5155 | 7 | |||
| K10 | −0.2863 | 0.3873 | 8 | K10 | 1.4188 | 0.9220 | 2 | K10 | −0.3936 | 0.3469 | 8 | |||
| K11 | −0.8459 | 0.1988 | 12 | K11 | −0.3604 | 0.3593 | 8 | K11 | −0.5156 | 0.3031 | 9 | |||
| K12 | −0.2287 | 0.4096 | 7 | K12 | 0.6753 | 0.7502 | 3 | K12 | 0.8372 | 0.7988 | 3 | |||
| K13 | 0.2733 | 0.6077 | 4 | K13 | 0.6753 | 0.7502 | 3 | K13 | 0.2218 | 0.5878 | 5 | |||
| K14 | 1.0634 | 0.8562 | 3 | K14 | −1.4226 | 0.0774 | 13 | K14 | −0.8483 | 0.1981 | 12 | |||
| G12 | K01 | −0.4069 | 0.3420 | 8 | G14 | K01 | −0.4758 | 0.3171 | 9 | |||||
| K02 | 0.2821 | 0.6111 | 2 | K02 | −0.0228 | 0.4909 | 5 | |||||||
| K03 | 0.2062 | 0.5817 | 4 | K03 | −0.3400 | 0.3669 | 7 | |||||||
| K04 | −0.0488 | 0.4805 | 6 | K04 | 3.1493 | 0.9992 | 1 | |||||||
| K05 | −0.6944 | 0.2437 | 14 | K05 | −0.6573 | 0.2555 | 12 | |||||||
| K06 | −0.4612 | 0.3223 | 10 | K06 | −0.4454 | 0.3280 | 8 | |||||||
| K07 | −0.6456 | 0.2593 | 12 | K07 | −0.6573 | 0.2555 | 12 | |||||||
| K08 | −0.5154 | 0.3031 | 11 | K08 | 0.6116 | 0.7296 | 2 | |||||||
| K09 | −0.4394 | 0.3302 | 9 | K09 | 0.5063 | 0.6937 | 3 | |||||||
| K10 | −0.6727 | 0.2506 | 13 | K10 | −0.1497 | 0.4405 | 6 | |||||||
| K11 | −0.2658 | 0.3952 | 7 | K11 | −0.6573 | 0.2555 | 12 | |||||||
| K12 | 0.1682 | 0.5668 | 5 | K12 | 0.1891 | 0.5750 | 4 | |||||||
| K13 | 0.2496 | 0.5985 | 3 | K13 | −0.4758 | 0.3171 | 9 | |||||||
| K14 | 3.2443 | 0.9994 | 1 | K14 | −0.5748 | 0.2827 | 11 | |||||||
References
- Angel, S.; Parent, J.; Civco, D.L.; Blei, A.M. The Atlas of Urban Expansion; Lincoln Institute of Land Policy: Cambridge, MA, USA, 2012. [Google Scholar]
- United Nations. 68% of the World Population Projected to Live in Urban Areas by 2050, Says UN. 2018. Available online: https://www.un.org/development/desa/en/news/population/2018-revision-of-world-urbanization-prospects.html (accessed on 2 July 2022).
- Chan, P. Child-Friendly Urban Development: Smile Village Community Development Initiative in Phnom Penh. World 2021, 2, 505–520. [Google Scholar] [CrossRef]
- Richard, F. Does Urbanization Drive Southeast Asia’s Development? Available online: https://www.citylab.com/life/2017/01/southeast-asia-martin-prosperity-institute/511952/ (accessed on 2 July 2022).
- UN-Habitat. SDG Goal 11 Monitoring Framework. 2016. Available online: http://unhabitat.org/sdg-goal-11-monitoring-framework/ (accessed on 10 August 2022).
- Janoušková, S.; Hák, T.; Moldan, B. Global SDGs Assessments: Helping or Confusing Indicators? Sustainability 2018, 10, 1540. [Google Scholar] [CrossRef]
- United Nations. Transforming Our World: The 2030 Agenda for Sustainable Development; Resolution adopted by the General Assembly; United Nations: New York, NY, USA, 2015. [Google Scholar]
- de Miguel González, R.; Sebastián-López, M. Education on Sustainable Development Goals: Geographical Perspectives for Gender Equality in Sustainable Cities and Communities. Sustainability 2022, 14, 4042. [Google Scholar] [CrossRef]
- Vladimirova, K.; Le Blanc, D. Exploring Links Between Education and Sustainable Development Goals through the Lens of UN Flagship Reports. Sustain. Dev. 2016, 24, 254–271. [Google Scholar] [CrossRef]
- Essomba, M.; Lleonart, P.; Alfonso, L.; Bin, H. Education for Sustainable Development in Educating Cities: Towards a Transformative Approach from Informal and Non-Formal Education. Sustainability 2022, 14, 4005. [Google Scholar] [CrossRef]
- Kushnir, I.; Nunes, A. Education and the UN Development Goals Projects (MDGs and SDGs): Definitions, Links, Operationalisations. J. Res. Int. Educ. 2022, 21, 3–21. [Google Scholar] [CrossRef]
- Nhamo, G.; Muchuru, S.; Nhamo, S. Women’s needs in new global sustainable development policy agendas. Sustain. Dev. 2018, 26, 544–552. [Google Scholar] [CrossRef]
- Hayden, M. Challenges to Higher Education in Laos and Cambodia. Int. High. Educ. 2019, 97, 20–21. [Google Scholar] [CrossRef]
- No, F.; Sok, S. Primary Education in Cambodia: In Search of Quality. In Education in Cambodia. Education in the Asia-Pacific Region: Issues, Concerns and Prospects; McNamara, V., Hayden, M., Eds.; Springer: Singapore, 2022; Volume 64. [Google Scholar] [CrossRef]
- Bredenberg, K. Progress with Reforming Secondary Education in Cambodia. In Education in Cambodia. Education in the Asia-Pacific Region: Issues, Concerns and Prospects; McNamara, V., Hayden, M., Eds.; Springer: Singapore, 2022; Volume 64. [Google Scholar] [CrossRef]
- Sol, K. Rethinking Higher Education in Cambodia: Contemporary Challenges and Priorities in the Post-COVID-19 Era. J. Int. Educ. 2021, 27, 46–60. [Google Scholar] [CrossRef]
- UN-Habitat. The New Urban Agenda Illustrated. Available online: https://unhabitat.org/the-new-urban-agenda-illustrated (accessed on 22 July 2022).
- United Nations. New Urban Agenda. United Nations Conference on Housing and Sustainable Urban Development (Habitat III) in Quito, Ecuador, on 20 October 2016. Available online: https://habitat3.org/wp-content/uploads/NUA-English.pdf (accessed on 10 August 2022).
- United Nations Department of Economic and Social Affairs. Sustainable Development Goal 4 (SDG 4). Available online: https://sdgs.un.org/goals/goal4 (accessed on 10 August 2022).
- United Nations Department of Economic and Social Affairs. Sustainable Development Goal 5 (SDG 5). Available online: https://sdgs.un.org/goals/goal5 (accessed on 10 August 2022).
- Kalantari, K.; Fami, H.S.; Asadi, A.; Mohammadi, H.M. Investigating Factors Affecting Environmental Behavior of Urban Residents: A Case Study in Tehran City- Iran. Am. J. Environ. Sci. 2007, 3, 67–74. [Google Scholar] [CrossRef]
- Kim, J.W.; Jeon, E.C.; Chung, S.O. Promoting Public Participation and Environmental Education in the Republic of Korea. J. Environ. Stud. 1991, 29, 82–97. [Google Scholar]
- Liu, P.; Teng, M.; Han, C. How does environmental knowledge translate into pro-environmental behaviors?: The mediating role of environmental attitudes and behavioral intentions. Sci. Total. Environ. 2020, 728, 138126. [Google Scholar] [CrossRef]
- Gallagher, L.; Kopainsky, B.; Bassi, A.M.; Betancourt, A.; Buth, C.; Chan, P.; Costanzo, S.; Freeman, S.S.G.; Horm, C.; Khim, S.; et al. Supporting stakeholders to anticipate and respond to risks in a Mekong River water-energy-food nexus. Ecol. Soc. 2020, 25, 29. [Google Scholar] [CrossRef]
- Ardoin, N.M.; Bowers, A.W. Early childhood environmental education: A systematic review of the research literature. Educ. Res. Rev. 2020, 31, 100353. [Google Scholar] [CrossRef]
- Bowers, A.W.; Creamer, E.G. A grounded theory systematic review of environmental education for secondary students in the United States. Int. Res. Geogr. Environ. Educ. 2020, 30, 184–201. [Google Scholar] [CrossRef]
- OECD Gender and the Environment: Building Evidence and Policies to Achieve the SDGs. Available online: https://www.oecd-ilibrary.org/sites/db5d855d-en/index.html?itemId=/content/component/db5d855d-en (accessed on 22 July 2022).
- Kaewkumkong, A. Major International Development Partners and their Roles in Educational Aid to Cambodia: Situational Analysis in the 2010s. J. Mekong Soc. 2020, 16, 52–71. [Google Scholar]
- Em, S.; Khan, S.; Nun, N. Education System in Cambodia: A Brief Review from the Prehistoric Period to the Present, and an Education Strategic Plan for the Future. FIRE: Forum Int. Res. Educ. 2023, 7, 141–164. [Google Scholar] [CrossRef]
- Charadine, P. Cambodia–China Economic Cooperation in the Context of BRI: Connectivity for Mutual Prosperity and Sustainable Growth. In Cambodia-China Comprehensive Strategic Partnership towards a Community with a Shared Future; Touch, S., Wang, L., Phea, K., Zhao, J., Gu, J., Eds.; Springer: Singapore, 2023. [Google Scholar] [CrossRef]
- Royal Government of Cambodia. National Strategic Development Plan (NSDP) 2019–2023; Ministry of Planning: Phnom Penh, Cambodia, 2019. [Google Scholar]
- Asian Development Bank. Here Comes Cambodia: Asia’s New Tiger Economy; Asian Development Bank (ADB) Headquarters: Manila, Philippines, 2016. [Google Scholar]
- Un, L.; Sok, S. (Higher) Education Policy and Project Intervention in Cambodia: Its Development Discourse. In Education in Cambodia. Education in the Asia-Pacific Region: Issues, Concerns and Prospects; McNamara, V., Hayden, M., Eds.; Springer: Singapore, 2022; Volume 64. [Google Scholar] [CrossRef]
- Royal Government of Cambodia. Rectangular Strategy Phase IV for Growth, Employment, Equity and Efficiency: Building the Foundation toward Realizing the Cambodia Vision 2050; Royal Government of Cambodia: Phnom Penh, Cambodia, 2018.
- United Nations Capital Development Fund. CSDG Financing in Cambodia-Synthesis Report; United Nations Capital Development Fund (UNCDF): New York, NY, USA, 2021. [Google Scholar]
- United Nations Capital Development Fund; Frankfurt School of Finance & Management and Ministry of Economy and Finance. Cambodia SDGs Financing Strategy; Frankfurt School of Finance & Management: Frankfurt, Germany, 2022. [Google Scholar]
- Baker, J.L.; Kikutake, N.; Lin, S.X.; Johnson, E.C.; Yin, S.; Ou, N. Urban Development in Phnom Penh; The World Bank Group: Washington, DC, USA, 2017. [Google Scholar]
- Chan, P. Validation of Sustainable Building Planning and Design Criteria for Cambodia: A Delphi Study. Preprints 2022, 3, 0190. [Google Scholar] [CrossRef]
- United Nations Department of Economic and Social Affairs. Sustainable Development Goal 11 (SDG 11). Available online: https://sdgs.un.org/goals/goal11 (accessed on 10 August 2022).
- Petrucci, A.L.; Trasi, N. Involving SDG4 in Achieving SDG11 through Problem-Solving and Learning-by-Doing Practices towards the 2030 Agenda. 2021. Available online: https://www.g20-insights.org/policy_briefs/involving-higher-education-sdg4-in-achieving-sustainable-cities-and-communities-sdsg11/ (accessed on 22 July 2022).
- Borade, A.B.; Kannan, G.; Bansod, S.V. Analytical hierarchy process-based framework for VMI adoption. Int. J. Prod. Res. 2013, 51, 963–978. [Google Scholar] [CrossRef]
- Saaty, T. A scaling method for priorities in hierarchical structures. J. Math. Psychology. 1977, 15, 234–281. [Google Scholar] [CrossRef]
- Saaty, T.L. The Analytical Hierarchy Process—What it is and how it is used. Math. Modell. 1987, 9, 161–176. [Google Scholar] [CrossRef]
- Soldatou, N.; Chatzianastasiadou, P.; Vagiona, D.G. Assessment of Carbon-Related Scenarios for Tourism Development in the Island of Lefkada in Greece. Tour. Hosp. 2022, 3, 345–361. [Google Scholar] [CrossRef]
- Chan, P. An Empirical Study on Data Validation Methods of Delphi and General Consensus. Data 2022, 7, 18. [Google Scholar] [CrossRef]
- Chan, P. Assessing Sustainability of the Capital and Emerging Secondary Cities of Cambodia Based on the 2018 Commune Database. Data 2020, 5, 79. [Google Scholar] [CrossRef]
- Chan, P.; Lee, M.-H. Developing Sustainable City Indicators for Cambodia through Delphi Processes of Panel Surveys. Sustainability 2019, 11, 3166. [Google Scholar] [CrossRef]
- Chan, P.; Lee, M.-H. Prioritizing Sustainable City Indicators for Cambodia. Urban Sci. 2019, 3, 104. [Google Scholar] [CrossRef]
- Lee, D.; Lee, D.; Lee, M.; Kim, M.; Kim, T. Analytic Hierarchy Process-Based Construction Material Selection for Performance Improvement of Building Construction: The Case of a Concrete System Form. Materials 2020, 13, 1738. [Google Scholar] [CrossRef]
- Park, K.J. A Study on the Development of Evaluation Indicators for Urban High-tech Industrial Complexes from the Perspective of Regeneration of Old Industrial Complexes. Ph.D. Thesis, Hanyang University, Seoul, Republic of Korea, August 2021. [Google Scholar]
- Nam, K.J. A Study on the Influence Factors of Integrated Resort Development on Local Supports. Ph.D. Thesis, Hanyang University, Seoul, Republic of Korea, August 2021. [Google Scholar]
- Han, S.M.; Lee, M.H. Analysis of Evaluation Indicators for the Development and Management of Sustainable and Resilient Cities: Focusing on the Goal 11 of UN Sustainable Developments Goals (SDGs). J. Korean Regional Dev. Assoc. 2017, 29, 1–24. [Google Scholar]
- Ward, A.W.; Murray-Ward, M. Assessment in the Classroom; Wadsworth: Belmont, CA, USA, 1999. [Google Scholar]
- Claude, L.; Svitlana, P.; Joshua, E. Using the Normal Distribution, 2016, A Revision Version on Introduction to Statistics by Claude. 2017. Available online: https://openstax.org/ (accessed on 29 May 2023).
- Kreyszig, E. Advanced Engineering Mathematics, 4th ed.; John Wiley & Sons, Inc.: Hoboken, NJ, USA, 1979. [Google Scholar]
- National Institute of Statistics (NIS). The General Population Census of the Kingdom of Cambodia, 2019; National Institute of Statistics, Ministry of Planning: Phnom Penh, Cambodia, 2019. [Google Scholar]
- Phnom Penh Capital Department of Planning. Phnom Penh Capital Socio-Economic Data 2019; Phnom Penh Capital Department of Planning, Ministry of Planning: Phnom Penh, Cambodia, 2019.
- The First Clean City Contest. Available online: http://www.cambodiacleancity.gov.kh/kh/award/5484w2u244x243f403 (accessed on 25 October 2021).
- The Second Clean City Contest. Available online: http://www.cambodiacleancity.gov.kh/kh/award/4464w2t224x253f423 (accessed on 25 October 2021).
- Chan, P. The Development and Prioritization of Consensus Sustainable City Indicators for Cambodia. Ph.D. Thesis, Hanyang University, Seoul, Republic of Korea, August 2020. [Google Scholar]
- Han, S.M. A Study on the Development and Application of Evaluation Indicators for Sustainable Urban Development and Management. Ph.D. Thesis, Hanyang University, Seoul, Republic of Korea, August 2019. [Google Scholar]
- Lee, D.J. Evaluation of Urban Growth Management in Metropolis of Korea. Ph.D. Thesis, Hanyang University, Seoul, Republic of Korea, February 2015. [Google Scholar]


| Subject | Indicator | Category | |
|---|---|---|---|
| Urban Education | E01 | Percentage of children studying at kindergarten (aged 3–5) | Access |
| E02 | Percentage of children studying at primary school (aged 6–11) | ||
| E03 | Percentage of children studying at secondary school (aged 12–14) | ||
| E04 | Percentage of illiterate youth (aged 15–24) | ||
| E05 | Percentage of illiterate adults and middle-aged groups (25–45) | ||
| E06 | Ratio of trained people to people aged 18–35 per 1000 population | ||
| E07 | Ratio of proper toilets installed at primary schools per 100 students | Facility | |
| E08 | Ratio of proper toilets installed in secondary schools per 100 students | ||
| E09 | Ratio of proper toilets installed at high schools per 100 students | ||
| E10 | Percentage of primary schools having clean water to use/drink | ||
| E11 | Percentage of secondary schools having clean water to use/drink | ||
| E12 | Percentage of high schools having clean water to use/drink | ||
| E13 | Ratio of district education administrative office staff per 100,000 population | Staff | |
| E14 | Ratio of district education coordination NGO staff per 100,000 population | ||
| E15 | Ratio of number of primary school students per teacher | ||
| E16 | Ratio of number of secondary school students per teacher | ||
| E17 | Ratio of number of high school students per teacher | ||
| E18 | Percentage of primary and secondary school female teachers | ||
| Urban Gender Equality | G01 | Ratio of female students to male students who have studied at university | In school |
| G02 | Ratio of female students to male students who have studied at high school | ||
| G03 | Ratio of female literates to male literates aged 15–17 years old | ||
| G04 | Ratio of primary schools that have separate toilets for females per 100 students | ||
| G05 | Ratio of secondary schools that have separate toilets for females per 100 students | ||
| G06 | Ratio of the number of vocation-trained women to 100 men aged 18–35 | In professions | |
| G07 | Ratio of female employees to total employees in production-service sectors | ||
| G08 | Percentage of women working at district sectoral technical offices | ||
| G09 | Percentage of female teachers in primary schools | ||
| G10 | Percentage of female teachers in secondary schools | ||
| G11 | Percentage of village chiefs as women | In decision-making | |
| G12 | Percentage of Sankat council members as women | ||
| G13 | Percentage of district council members as women | ||
| G14 | Percentage of district office deputy chiefs as women | ||
| G15 | Percentage of district office chiefs as women | ||
| Subject | Category | Weight 1 | Indicator | Weight 2 | Total Weight | Rank |
|---|---|---|---|---|---|---|
| Urban Education | Access | 0.3790 | E01 | 0.1180 | 0.0447 | 12 |
| E02 | 0.2315 | 0.0877 | 1 | |||
| E03 | 0.1920 | 0.0728 | 3 | |||
| E04 | 0.1398 | 0.0530 | 9 | |||
| E05 | 0.1386 | 0.0525 | 10 | |||
| E06 | 0.1801 | 0.0683 | 6 | |||
| Facility | 0.2897 | E07 | 0.1277 | 0.0370 | 16 | |
| E08 | 0.1450 | 0.0420 | 14 | |||
| E09 | 0.2087 | 0.0605 | 8 | |||
| E10 | 0.2429 | 0.0704 | 4 | |||
| E11 | 0.1505 | 0.0436 | 13 | |||
| E12 | 0.1251 | 0.0362 | 17 | |||
| Staff | 0.3313 | E13 | 0.1380 | 0.0457 | 11 | |
| E14 | 0.1007 | 0.0334 | 18 | |||
| E15 | 0.2370 | 0.0785 | 2 | |||
| E16 | 0.2114 | 0.0701 | 5 | |||
| E17 | 0.1877 | 0.0622 | 7 | |||
| E18 | 0.1252 | 0.0415 | 15 | |||
| Total | - | 1.0000 | - | 3.0000 | 1.0000 | - |
| Urban Gender Equality | In school | 0.3332 | G01 | 0.2330 | 0.0776 | 2 |
| G02 | 0.2218 | 0.0739 | 3 | |||
| G03 | 0.2469 | 0.0823 | 1 | |||
| G04 | 0.1341 | 0.0447 | 15 | |||
| G05 | 0.1642 | 0.0547 | 13 | |||
| In professions | 0.3440 | G06 | 0.2070 | 0.0712 | 7 | |
| G07 | 0.2036 | 0.0700 | 9 | |||
| G08 | 0.1845 | 0.0635 | 11 | |||
| G09 | 0.1960 | 0.0674 | 10 | |||
| G10 | 0.2089 | 0.0718 | 5 | |||
| In decision-making | 0.3228 | G11 | 0.2197 | 0.0709 | 8 | |
| G12 | 0.2272 | 0.0733 | 4 | |||
| G13 | 0.2218 | 0.0716 | 6 | |||
| G14 | 0.1752 | 0.0566 | 12 | |||
| G15 | 0.1561 | 0.0504 | 14 | |||
| Total | - | 1.0000 | - | 3.0000 | 1.0000 | - |
Disclaimer/Publisher’s Note: The statements, opinions and data contained in all publications are solely those of the individual author(s) and contributor(s) and not of MDPI and/or the editor(s). MDPI and/or the editor(s) disclaim responsibility for any injury to people or property resulting from any ideas, methods, instructions or products referred to in the content. |
© 2023 by the authors. Licensee MDPI, Basel, Switzerland. This article is an open access article distributed under the terms and conditions of the Creative Commons Attribution (CC BY) license (https://creativecommons.org/licenses/by/4.0/).
Share and Cite
Chan, P.; Gulbaram, K.; Schuetze, T. Assessing Urban Sustainability and the Potential to Improve the Quality of Education and Gender Equality in Phnom Penh, Cambodia. Sustainability 2023, 15, 8828. https://doi.org/10.3390/su15118828
Chan P, Gulbaram K, Schuetze T. Assessing Urban Sustainability and the Potential to Improve the Quality of Education and Gender Equality in Phnom Penh, Cambodia. Sustainability. 2023; 15(11):8828. https://doi.org/10.3390/su15118828
Chicago/Turabian StyleChan, Puthearath, Kulakhmetova Gulbaram, and Thorsten Schuetze. 2023. "Assessing Urban Sustainability and the Potential to Improve the Quality of Education and Gender Equality in Phnom Penh, Cambodia" Sustainability 15, no. 11: 8828. https://doi.org/10.3390/su15118828
APA StyleChan, P., Gulbaram, K., & Schuetze, T. (2023). Assessing Urban Sustainability and the Potential to Improve the Quality of Education and Gender Equality in Phnom Penh, Cambodia. Sustainability, 15(11), 8828. https://doi.org/10.3390/su15118828