Article

Carbon Footprint Accounting and Influencing Factors Analysis for Forestry Enterprises in the Key State-Owned Forest Region of the Greater Khingan Range, Northeast China

1
College of Mechanical and Electrical Engineering, Northeast Forestry University, Harbin 150040, China
2
College of Civil Engineering and Transportation, Northeast Forestry University, Harbin 150040, China
3
Forest Resources Monitoring Center of Key State-Owned Forest Region, National Forestry and Grassland Administration, Da Hinggan Ling 165000, China
*
Author to whom correspondence should be addressed.
Sustainability 2023, 15(11), 8898; https://doi.org/10.3390/su15118898
Submission received: 9 May 2023 / Revised: 28 May 2023 / Accepted: 29 May 2023 / Published: 31 May 2023
(This article belongs to the Section Sustainable Forestry)

Abstract

:
This paper constructed a carbon footprint calculation model and analyzed the carbon footprint characteristics and impact mechanism of forestry enterprises in the Greater Khinggan Range, northeast China, based on the survey and statistical data during 2017–2021. The process-based life cycle assessment (LCA) was used to calculate the total carbon footprint and carbon footprint intensity; then, a panel data model combined with ridge regression was used to explore the impacts of different factors on the carbon footprint of the forestry enterprises. Results showed that the forestry enterprises’ total carbon footprint and carbon footprint intensity showed a general trend of increasing first and then decreasing from 2017 to 2021. The average annual carbon footprint of the forestry enterprises ranged from 2354 t CO2-eq to 24,354 t CO2-eq, and the average annual carbon footprint intensity ranged from 3.48 kg CO2-eq hm−2 to 31.76 kg CO2-eq hm−2. Fire area, the number of hired labor, and vehicle usage intensity are significant driving factors of the carbon footprint in forestry enterprises. The study results can provide references for policy formulation in relation to carbon footprint control in forest regions.

1. Introduction

Excessive emissions of greenhouse gases are considered to be one of the main causes of global warming [1,2]. In order to deal with climate change, countries around the world have made their own efforts [3,4]. In 2020, the Chinese government proposed a dual-carbon target to reach peak carbon by 2030 and strive to achieve carbon neutrality by 2060. As a “Negative carbon” approach toward carbon neutrality, forestry carbon sink is characterized by large carbon sequestration, low cost, and high ecological added value [5,6]. Currently, China has included forestry carbon sink as a qualified “China Certified Emission Reduction” (CCER) in the carbon emission reduction trading system in order to help achieve carbon neutrality [7]. As the management unit of the Forestry Carbon Sequestration Project (FCSP), forestry enterprises play a vital role in the process of project preparation, development, and implementation [8]. According to the international carbon trading framework, enterprises can only trade carbon credits after offsetting their own carbon emissions on the basis of carbon sequestration [9]. Therefore, it is of great significance to accurately account the carbon emissions in the process of forestry production and management in order to ensure the accuracy and additionality of carbon sequestration for forestry enterprises.
When calculating the carbon footprint at the corporate level, some international standards are commonly used, including the ISO 14064-1 Specification and Guidelines for Quantification and Reporting of Greenhouse Gas Emissions and Removals at the Organizational Level issued by the International Organization for Standardization (ISO) and the Guidelines for Corporate Accounting and Reporting contained in the Greenhouse Gas Protocol issued by the World Resources Institute (WRI) [10,11,12]. The standards for enterprise carbon footprint accounting can provide technical support for various mandatory and voluntary greenhouse gas action plans and improve the consistency of greenhouse gas emission accounting and reporting [13]. The characteristics of carbon emission sources in different industries are closely related to industry technology, processes, and products. Referring to the definitions of corporate carbon footprint in these standards, the carbon footprint of forestry enterprises can be defined as the total carbon dioxide emission caused directly or indirectly in the process of forestry production and management. Direct carbon emissions are usually attributable to various forest management activities (e.g., silviculture, tending, and harvesting), forest disturbance (e.g., forest fires, plant disease, insect infestation), and land use-cover change (LUCC) [14]. Indirect carbon emissions are usually associated with the consumption of electricity or heat in the forestry facilities and the implicit carbon emissions occurred in the suppliers or customers [15]. By controlling both direct carbon emissions and indirect carbon emissions, forestry enterprises can effectively mitigate their overall carbon footprint. The carbon reduction measures available to enterprises include improving energy efficiency, technological advances, sustainable sourcing, etc. Government policy interventions can also help reduce the carbon emissions in corporate supply chains [16,17].
The Greater Khingan Range in northeast China covers an approximate area of 8.02 million hm2, which is one of the key state-owned forest regions in China and plays an important role in maintaining national ecological security and coping with climate change. It is administered by the Greater Khingan Forestry Group. By the end of 2020, the forest coverage rate of the group was 86.20%, the forest area was 6.29 million hm2, the standing stock was 614 million m3, and the total annual output value was CNY 5.34 billion [18,19,20]. Because of its location in the high latitudes of the northern hemisphere, forest carbon stocks in this region were more sensitive to climate change, natural disturbances, and human activities. The characteristics of carbon footprints of the forestry enterprises in this region were rarely reported, which increased the uncertainty of the estimation on net carbon sequestration. The objectives of the paper are to (1) calculate the carbon footprints of forestry enterprises in the Greater Khingan Range of Northeast China, (2) analyze the average annual carbon footprint intensity by year and by forestry enterprises, and (3) identify the key factors affecting the carbon footprints of forestry enterprises in the Greater Khingan Range of northeast China.
To date, several studies have been conducted to analyze the carbon footprints of different types of forestry enterprises by using the process-based life cycle assessment (LCA) method. As for forestry enterprises with a single production function, Kubová et al. [21] used standard corporate carbon footprint accounting method to calculate the carbon emissions in Scope 1 (direct emissions), Scope 2 (indirect emissions), and Scope 3 (implicit carbon emissions) from a forest land managed by a school forest enterprise (SFE) at the Czech University of Life Sciences, Prague. The carbon balance analysis results showed that the total carbon footprint of the forestland managed by the SFE in 2017 was 686 t CO2-eq or 3.5 t per employee, or 99 kg CO2-eq hm−2. Lin et al. [9] analyzed the carbon footprints of five Chinese forestry enterprises in the course of operation according to the calculation method determined by the Greenhouse Gas Protocol issued by the World Business Council for Sustainable Development (WBCSF) and the World Resources Institute (WRI) and the IPCC National Greenhouse Gas Inventory Plan. They found that forest fires and chemical use were the main sources of carbon emissions, which accounted for 89.8% of the total carbon emissions. As for forestry enterprises with comprehensive production functions, Parigiani et al. [22] studied a forestry enterprise with integrated function of plantation, carbon offset, production of forest products, and renewable energy supply in Eastern Africa, and compared the carbon footprints of the enterprise in 2008 and 2009. The results showed that the carbon footprint in both years was dominated by carbon sequestration from afforestation, with carbon sequestration being as much as 17 times greater than carbon emissions. The biggest difference between the two years was due to the loss of forest carbon caused by forest fire. Zhao et al. [15] studied a forestry pulp and paper enterprise with 1600 hm2 plantation and annual production capacity of 900,000 tons of bleached eucalyptus chemical pulp. Direct carbon emissions from the combustion of fossil fuels and biomass fuels, forest tending, harvesting, and transport, indirect carbon emissions from electricity consumption in production processes, and implicit carbon emissions from material production were accounted and the results showed that carbon emissions mainly occurred in fuel combustion in combined heating and power (CHP) and diesel combustion in material transportation. In summary, the carbon emissions of integrated forestry enterprises are much larger than those of forestry enterprises with a single production function. The carbon offset intensity of greenhouse gas emissions within the boundary of different forestry carbon sequestration projects varied greatly in different projects, and the accounting of carbon emissions also needs to be further improved.
In summary, previous studies on carbon footprint accounting in forestry enterprises mainly focused on carbon emissions estimation and mitigation strategies. However, there are still many challenges and limitations in accounting the carbon footprint of forestry enterprises such as data acquisition, uncertainty analysis, and system boundary definition due to a lack of standardized methodologies for carbon footprint accounting in forestry enterprises [9]. In this study, we presented a comprehensive system for carbon emission accounting in forestry enterprises, adhering to international standards and facilitating future carbon trading. Our integrated approach combined process-based life cycle assessment (LCA) and panel data analysis to accurately quantify the carbon footprints of diverse enterprises and identify key drivers influencing forestry enterprises’ carbon footprint. Our methodology, data acquisition, and findings can enhance reliability and support informed decision-making associated with development of carbon sequestration projects.
The main framework of this study is as follows: The Section 1 is the introduction, which consists of the background, the significance and scientific contribution of the study. The Section 2 elaborates the relevant methods used in this study in detail. The Section 3 and Section 4 are results and discussion, respectively, which mainly present the research results and make an in-depth discussion from different perspectives. The Section 5 is the conclusion of this study.

2. Materials and Methods
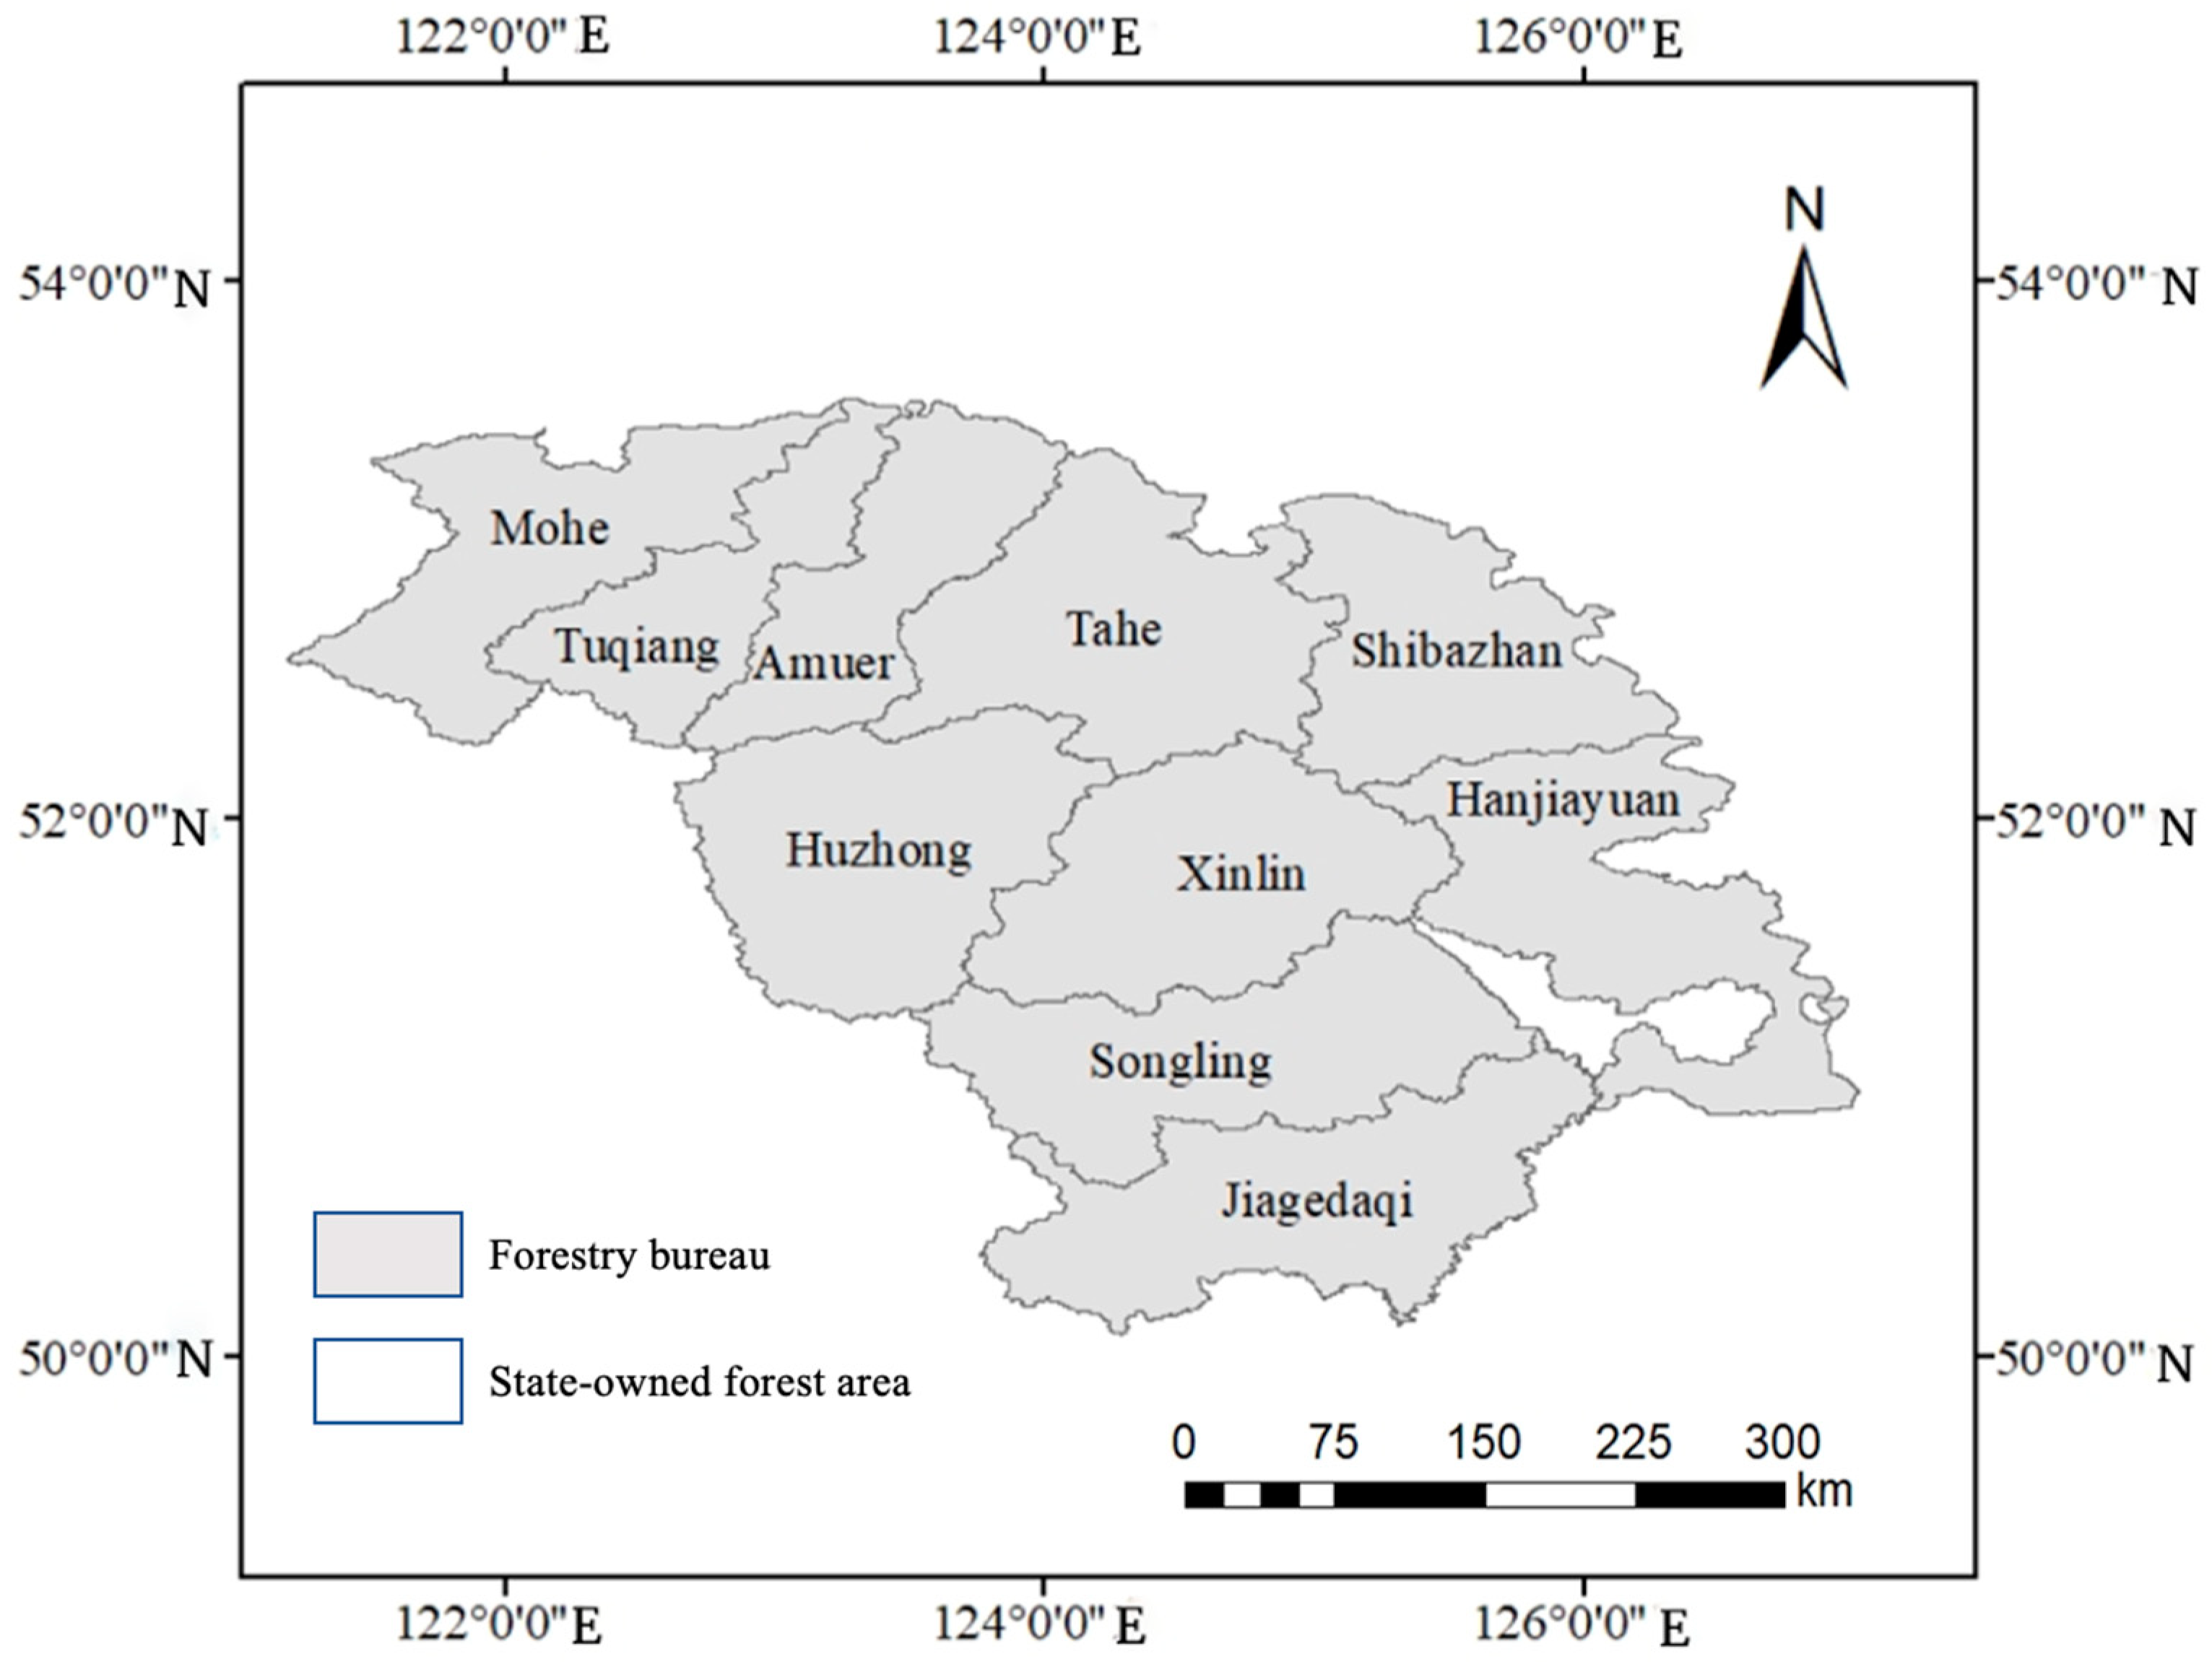
2.1. Study Area

The study area of the Greater Khingan Range, Northeast China, is located northwest of Heilongjiang Province and the northeast of Inner Mongolia Autonomous Region with geographical coordinates of 121°10′53″–127°01′21″ E and 50°07′02″–53°33′42″ N. The general topography is from northeast to southwest, which belongs to the shallow mountain and hilly zone. The region has a marked frigid-temperate zone continental monsoon climate. The annual precipitation in this area is 514 to 646 mm. The mean annual temperature is 2.6 °C, with a maximum temperature of 37.9 °C and a minimum temperature of −46.9 °C. The typical forest soils include brown coniferous forest soil, dark brown soil, gray-black soil, and so on.
The forest resources in this region exhibit distinctive characteristics, including the widespread distribution of natural secondary forests and a significant proportion of young and middle-aged forests. The tree species composition in this region consists of both coniferous and broad-leaved species, contributing to the rich biodiversity and ecological dynamics. Coniferous species, well-adapted to the area’s cold climate, play a prominent role in the forest cover. Common coniferous species found in this region include Picea obovata, Larix gmelinii, and Pinus sylvestris. These conifers not only contribute to the overall forest landscape but also provide important ecosystem services. In addition, this region is home to a diverse range of broad-leaved species. Betula spp., Populus tremula, Quercus spp., and Ulmus spp. are among the prevalent broad-leaved species found in the region. These broad-leaved species contribute significantly to the overall biodiversity and ecological functioning of the forest ecosystem, enhancing habitat diversity and providing resources for various organisms [23,24,25,26].
The key state-owned forest region of the Greater Khingan Range, Northeast China is characterized by a complex regional social system, involving various stakeholders such as the central government, local government, forestry and grassland authorities, State-owned Assets Supervision and Administration Commission of the State Council (SASAC), forestry enterprises, forestry workers, and local residents. According to the executive plan of China’s Natural Forest Resources Protection Project (NFRPP), logging had been prohibited in the natural forests of this region since 2014. Currently, this region serves as a significant practice site for implementing carbon-neutral actions and promoting sustainable forest management practices. These practices include afforestation, forest regeneration, natural succession, fire management, and forest health management. A total of 10 forestry bureaus co., ltd (i.e., Amuer, Hanjiayuan, Huzhong, Jiagedaqi, Mohe, Shibazhan, Songling, Tahe, Tuqiang, and Xinlin) and 8 national nature reserves (i.e., Arctic Village, Lingfeng, Panzhong, Shuanghe, Chuona River, Nanweng River, Dobkur, and Huzhong) were established in the region. Since these national nature reserves were managed by the neighboring forestry bureaus, they were combined into the forestry bureaus in this study. The scope of the 10 forestry bureaus is shown in Figure 1.

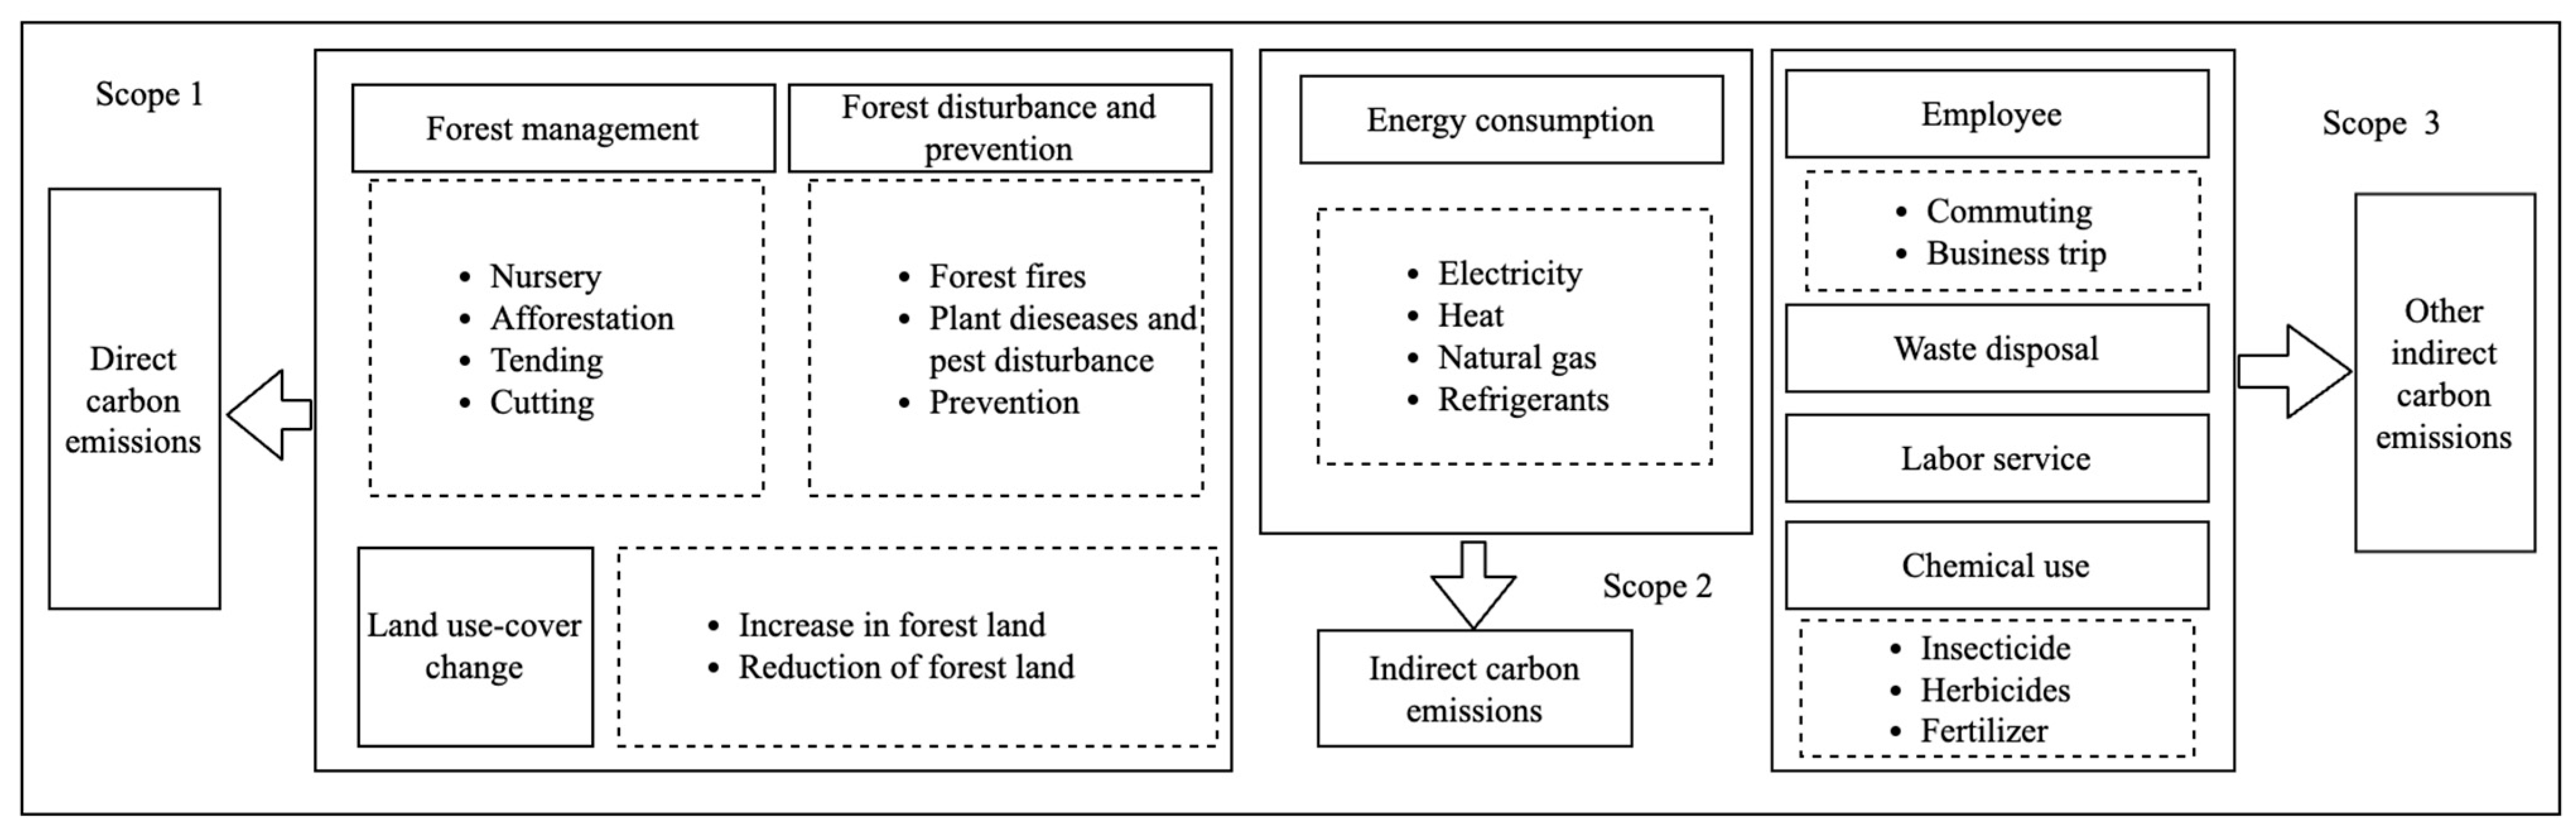
2.2. Constructing Carbon Footprint Accounting System for Forestry Enterprises

Currently, there are many international standards for corporate carbon footprint accounting, mainly including the ISO 14064-1, GHG protocol, and IPCC 2006 [27]. However, there is no specific standard method for calculating the carbon footprint of forestry enterprises. In China, the National Development and Reform Commission of China has issued guidelines for accounting and reporting of greenhouse gas emissions by enterprises in 24 industries (Trial implementation) [28]. There are no guidelines for accounting forestry enterprise carbon footprints, either. In fact, forestry enterprises involve many carbon emission sources, including all kinds of forest management activities, forest fires, plant diseases and pest disturbance, land use-cover change, employee commuting and business trips, waste disposal, chemical use, and so on [9].
In this study, the carbon emission sources in forestry enterprises were divided into three scopes according to the requirements of the carbon trading market and international practice, the greenhouse gas protocol-accounting and reporting guidelines for enterprises, and the characteristics of forest management activities of forestry enterprises in China. Scope 1 includes the direct emissions into the air from various forest management activities, forest disturbance and prevention, and land use change. Scope 2 contains the indirect emissions from purchased electricity, heat, and steam. Scope 3 contains other indirect emissions that are not classified within Scope 2 [21,29]. According to the above scopes, the carbon footprint accounting system of forestry enterprises was constructed, and the system boundary is shown in Figure 2.

2.3. Methods for Accounting the Carbon Footprint of Forestry Enterprises

Carbon footprint is a measure of greenhouse gas emissions directly and indirectly caused by a product or activity in its life cycle [30]. Carbon footprint accounting methods include input–output (I-O) analysis, life cycle assessment (LCA), fossil fuel emission method, Kaya carbon emissions identity method, etc. [31]. Among these methods, the life cycle assessment is a bottom-up approach, which can be used to scientifically and systematically calculate the direct or implied greenhouse gas emissions from production activities; thus, it is suitable for the micro-level carbon footprint accounting. In this study, the carbon footprints of various activities within the scope of forestry enterprises are calculated by using the process-based LCA method and the calculation formula is expressed as follows:
C E i = j A i j E i
where CEi represents the carbon footprints of all activities in scope i (i = 1, 2, 3), Aij refers to the consumption of some substances or energy (j) in Scope i, and Ei represents the greenhouse gas emission factor (CO2-eq per unit).
The calculation formulas for the carbon footprint of a forestry enterprise and carbon footprint intensity are shown in Equations (2) and (3), where CF is the carbon footprint of the forestry enterprise, CS is the carbon footprint intensity of the forestry enterprise, Y is the forest land area of the forestry enterprise.
C F = i = 1 3 C E i
C S = C F Y

2.3.1. Accounting for the Carbon Footprint of Forestry Enterprises in Scope 1

The carbon footprints in Scope 1 are mainly from forest management activities, forest disturbance, and land use-cover change. Forest management involves many productive activities such as silviculture, tending and harvesting. Seedling cultivation, bush cutting and weeding tending and thinning, and logging will consume a certain amount of energy, thus resulting in different levels of carbon emissions [32,33]. If forest ecosystems were disturbed by fires or pests, the woody biomass will be turned into carbon sources and release carbon through combustion or decomposition. In such circumstances, the carbon emissions caused by forest disturbance may exceed the CO2 absorbed by forest growth during the same period [34,35]. In addition, the transformation of land use from woodland to other purposes will also result in the increase of carbon emissions [36,37].
The total carbon footprint in Scope 1 was obtained by summing up the carbon emissions from forest management (CM), forest disturbance (CP), and land use-cover change (CL) (Equation (4)).
C E 1 = C M + C P + C L
Specifically, forest management activities include seedlings cultivation, afforestation, tending in young and middle-aged forests, restoration of degraded forests, etc. The energy consumption for the machines or vehicles used in these activities, and the biomass removed due to forest tending were converted into carbon emissions. The carbon footprint of forest management is calculated as Equation (5).
C M = g d f Y g E g d f R f + g v f D g v M v R f + α B F
where g is the type of activity in forest management (seedling cultivation, afforestation, tending, restoration), d is the type of mechanical equipment used in different activities (rotary tillers, brush cutters, chain saws, etc.), Yg is the area (hm2) or volume (m3) of different activities g, Egdf is the quantity of fuel f consumed by mechanical equipment d in activity g (L·hm−2 or L·m−3), Rf is the carbon emission factor of fuel type f (gasoline, diesel) (kg CO2-eq L−1), v is the type of vehicles used in different activities (four-wheel vehicles, agricultural vehicles, tractors, etc.), Dgv is the total transportation distance for the type of vehicles v in activity g (km), Mv is the fuel consumption rate of vehicles v (L·km−1), α represents the average carbon content of the biomass (kg C·kg−1), B is the quantity of woody biomass removed from by young and middle-aged forests in tending activities (kg), and F represents the carbon dioxide conversion coefficient (44/12).
The carbon emissions of forest disturbance are mainly from forest fires, pests and disease disturbance, and patrol for disturbance prevention. The factors such as fire area, stand density, carbon conversion factor, and burning efficiency were considering when calculating the carbon emissions from forest fires. The carbon emissions caused by pests and diseases were calculated by multiplying the area of disturbance, stock volume, and dry wood density. In addition, some necessary patrol was also considered in order to reduce the risk of disturbance. So, the total carbon emissions of forest disturbance can be computed as Equation (6).
C P = ACN + F p S P V P D P + q b f Y q E q b f R f + q a f D q a M a R f
where A is the fire area (hm2), C is the forest carbon storage (kg·hm−2); N is the burning efficiency (kg CO2-eq kg−1), F is the carbon dioxide conversion coefficient (44/12), S p is the area of forest type p lost due to pests, diseases and rodents (hm2), V p is the volume stock per unit area for forest type p (m3·hm−2), D p is the average dry wood density for forest type p (kg·m−3). The last two items are the carbon emissions due to the use of machinery and vehicles during the prevention of forest fires and other disturbances, q is the type of activity in prevention of forest fires and other disturbances (patrol, fire prevention, pest and rodent control), b is the type of mechanical equipment used in different activities(high-speed sprayer, high-pressure fire extinguisher, etc.), Yq is the area (hm2) of different activities g, Eqbf is the quantity of fuel f consumed by mechanical equipment b in activity q (L·hm−2 or L·m−3), a is the type of vehicles used in different activities (spray truck, fire truck, etc.), Dqa is the total transportation distance for the type of vehicles a in activitie q (km), Ma is the fuel consumption rate of vehicles a (L·km−1).
The carbon emissions from land use-cover change were obtained by multiplying the variation of forest land area by the difference of carbon absorption coefficients of different land use types (Equation (7)).
C L = S ω S γ s γ 0
where ω s is the area change from forest land to other land use types (arable land, garden land, grass land, water and water facility sites, other land types), γ s is the carbon emission (absorption) coefficient of land use type s (t·hm−2), and γ 0 is the carbon absorption coefficient of forest land (t·hm−2).

2.3.2. Accounting for the Carbon Footprint of Forestry Enterprises in Scope 2

Scope 2 carbon emissions usually include indirect emissions from the generation of purchased electricity, steam, heating, and cooling. For the forestry enterprises in the key state-owned forest region in the Greater Khingan Range of Northeast China, most of the carbon emissions in Scope 2 were caused by the consumption of electricity and thermal energy in the forestry facilities, and a small amount of carbon emissions were from the usage of natural gas and cooling. The calculation formula for the carbon footprint of Scope 2 is shown as follows:
C E 2 = t = 1 4 E t R t
where CE2 is the carbon footprint of Scope 2, E t is the usage of different types of energy t (t = 1, 2, 3, 4; 1—electricity, 2—thermal energy, 3—natural gas, 4—refrigerant) and R t is the carbon emission factor of energy t.

2.3.3. Accounting for the Carbon Footprint of Forestry Enterprises in Scope 3

Scope 3 carbon emissions include all other indirect emissions beyond Scope 2. In the case of forestry enterprises, the carbon emissions due to employee commuting, business travel, waste treatment, use of chemicals (e.g., fertilizer, herbicide) during forest disturbance prevention, and use of contractors’ vehicles or machinery. In addition, the carbon emissions from labor use were calculated based on the per capita daily electricity consumption in the local area and the quantity of work [38,39]. The calculation formula for the carbon footprint of Scope 3 (CE3) is shown as follows:
C E 3 = k n D k n R k + m D m R m + Z δ f r 1 + g r 2 + w T w D w R w + c A c R c + H u Y u P u R e
where CE3 is the carbon footprint of Scope 3, k represents different types of commuting (buses, private cars, motorcycles, electric cars); Rk is the carbon emission factor of commuting type k (kg CO2 eq km−1); D k n is the annual commuting distance of employee n using commuting type k (km); m is the mode of transportation used in business travel (plane, train, car); Dm is the total travel distance by transportation m (km year−1); Rm is the carbon emission factor of transportation mode m (kg CO2 eq km−1); Z is the number of employees in the forestry enterprise; δ denotes the rate of solid waste generation; f and g represent the proportion of landfill and incineration, respectively; r1 and r2 represent the carbon emission factors of landfill and incineration, respectively; Tw is the fuel consumption coefficient for waste transportation (L·km−1); Dw is the waste transport distance (km); Rw is the carbon emission factor of the fuel (kg CO2 eq L−1); A c is the quality of chemicals c (fertilizer, herbicide, pesticides) used per year; R c is the carbon emission factor for different types of chemicals; H represents the electricity consumption per capita; u is the type of activity in labor service (patrol, afforestation, tending); Yu is the area (hm2) of different activities u; Pu is the daily workload completed per person in activity u (hm2); Re represents the carbon emission factor of electricity in Northeast China.

2.4. Influencing Factors Analysis on the Carbon Footprint of Forestry Enterprises

It is known that carbon footprint is the result of various influencing factors in the different activities of Scope 1, Scope 2, and Scope 3, such as energy factors, technological factors, economic development factors, population factors, and so on [40,41,42,43]. In this study, a panel data model and a ridge regression model were used to explore the impacts of different factors on the carbon footprint of forestry enterprises.

2.4.1. Panel Data Model

Panel data (also known as longitudinal or cross-sectional time-series data) is a dataset that contains regularly repeated observations on the same objects. It allows us to control for variables that we cannot observe or measure such as cultural factors or differences in business practices across companies, or variables that change over time but not across entities [44]. A panel data model is an econometric model based on panel data to analyze the relationship between variables, which is widely used to assess the effects of socioeconomic drivers and the characteristics of energy consumption on CO2 emissions [45,46,47].
In this study, a panel data model was constructed, where the carbon footprint of forestry enterprises was the dependent variable (yit), and the total forest area, net change in forest area, area of afforestation, tending area of young forest stands, tending area of middle-aged forest stands, fire area, pest and rodent disturbance area, investment in fire prevention, fuel consumption of mechanical equipment, quantities of chemicals used, vehicle usage intensity, and number of hired labor were selected as the observed explanatory variables (xit). The model is expressed as Equation (10), where α and β are coefficients to be estimated; i corresponds to a forestry enterprise; t corresponds to a time period; μi captures unobserved characteristics, which do not change for a given enterprise; and εit is the disturbance terms that are assumed to satisfy the usual regression model conditions.
y it = α + x i t β + μ i + ε i t       i = 1 , 2 , N ,       t = 1 , 2 , T
Several types of panel data analysis model, including the FE (fixed effect panel data), the POOL (mixed estimation panel data), and the RE (random effect panel data) can be used to estimate the coefficients α and β. The differences between the three types of models lie in how they handle unobserved heterogeneity in panel data analysis. The POOL model assumes no individual-specific heterogeneity, while the FE model accounts for time-invariant heterogeneity using individual-specific intercepts. The RE model allows for time-varying heterogeneity and can estimate both random effects and residual variance. The choice of model depends on the nature of the heterogeneity and assumptions about the error structure. The F test is often used to determine whether to choose the POOL or FE model in the panel data model selection method, the BP (Breusch–Pagan) test is used to determine whether to select the RE model or the POOL model, and the Hausman test is used to determine whether to select the RE model or the FE model. By combining the significance of estimated parameters (α and β) in various panel models, an optimal panel model can be determined [48,49].

2.4.2. Ridge Regression

The Ridge Regression method is a biased estimation regression method proposed by Hoerl and Kennard for the analysis of multicollinear data [50]. Ridge regression adds a penalty term to the regression model to shrink the estimated coefficients towards zero, which helps to reduce the variance of the estimates and improve the overall accuracy of the model [51]. The amount of shrinkage is controlled by a tuning parameter called the regularization parameter, which can be chosen using cross-validation techniques [52].
In this study, the Ridge regression was used to solve the overfitting problem in panel data linear regression. This method enhances the reliability of analyzing the relationship and interactions between multiple factors influencing the carbon footprint of forestry enterprises [53,54,55]. The combination of the panel model and the ridge regression method is expressed as Equation (11).
θ it = X i t T X i t + K I 1 X i t T Y i t
where θ is the estimator of Ridge regression coefficients, Xit = (x11, …, xit) represents the matrix of explanatory variables, Yit = (y11, …, yit) represents the vector of the dependent variable, I is the identity matrix, and K is the ridge regression parameter, ranging from 0 to 1. When K = 0, Equation (11) is a least squares regression model; when K ≠ 0, the larger the variance of prediction, the smaller the impact of collinearity on the stability of regression coefficients. By combining the algorithm designed by Hoerl et al. [56] and ridge trace plot analyses, a stable and small K value can be selected to produce more reasonable regression coefficients, which can make the interactions and relationships between multiple factors and the carbon footprint of forestry enterprises more reliable.

2.5. Data Investigation

A questionnaire survey was conducted on the carbon emissions of forestry enterprises in the key state-owned forest region of the Greater Khingan Range, northeast China, in 2022, according to the designed carbon footprint accounting system of forestry enterprises. A total of 48 questions related to direct (Scope 1) and indirect (Scope 2 and Scope 3) carbon emissions of forestry enterprises in the three aspects of enterprise management, forest resource management, and forest interference and prevention were designed. The questionnaire was sent to the 10 forestry enterprises (i.e., forestry bureaus) in the Greater Khingan Forestry Group in the study region and the data in 2017–2021 was collected. All the feedback was checked for completeness and put into an MS Excel sheet for later analysis. The carbon emission factors and other accounting data used in this study were mainly from the Ecoinvent database, the greenhouse gas emission factor database of China’s product life cycle (http://lca.cityghg.com/, accessed on 10 June 2022), and related references [57,58,59,60,61,62,63,64,65,66,67,68], which are presented in Table 1.

3. Results

3.1. Characteristics of Carbon Footprint of the Greater Khingan Forestry Group

3.1.1. Results of Annual Carbon Footprints and Carbon Footprint Intensity

The results of carbon footprint, carbon footprint intensity, and carbon footprint by scopes in the Greater Khingan Forestry Group during the period of 2017–2021 are presented in Table 2. It is shown that the Scope 1 carbon footprint of the Greater Khingan Forestry Group increased first and then decreased in the study period, and the maximum value of Scope 1 carbon footprint appeared in 2018 and the minimum in 2021 with an average of 41,383 t CO2 eq. The annual carbon footprint of Scope 2 was relatively stable and fluctuated around 20,280 t CO2 eq. A fluctuating upward trend was observed in the carbon footprint of Scope 3 and the maximum carbon footprint was in 2018 which was almost 1.1 times that of 2017. On the whole, the total annual carbon footprint showed a trend of increasing first and then decreasing, with an annual average of 81,694 t CO2 eq. The maximum carbon footprint was 154,077 t CO2 eq in 2018 and the minimum was 54,639 t CO2 eq in 2021. Since the forest land area in the Greater Khingan Forestry Group varied slightly during the five years, the overall trend of carbon footprint intensity was similar to that of the total carbon footprint, and the average carbon footprint density was 11.84 kg CO2 eq hm−2.

3.1.2. Results of Carbon Footprint of Different Processes in Different Scopes

The results of the annual carbon footprint and contribution ratios of different processes in different scopes in the Greater Khingan Forestry Group are shown in Table 3. The carbon footprint of the Greater Khingan Forestry Group was dominated by Scope 1, accounting for 50.66% of the total annual carbon footprint, followed by Scope 2 (24.83%), and Scope 3 (24.51%). In Scope 1, fire disturbance was the main contributor to carbon footprint, followed by disturbance prevention and forest tending. Afforestation, pest disturbance, seedlings cultivation, and land use-cover change (LUCC) were the least contributors to carbon footprint. This is due to the fact that forest fire has changed greatly the forest structure and forest biomass. In addition, a large number of machinery and vehicles were input in the process of interference control and forest tending operations in order to promote the growth of forest stands and avoid the occurrence of a larger carbon footprint. In Scope 2, electricity use had a greater contribution to the total annual carbon footprint than thermal energy consumption. In Scope 3, most of the carbon footprint came from labor service, accounting for 17.58% of the total carbon footprint, followed by employees’ business travel (3.72%) and employees’ commuting (2.13%). The treatment of solid waste and the use of chemicals had the least contribution to the carbon footprint compared to the others.

3.2. Characteristics of Carbon Footprint of Individual Forestry Enterprises

3.2.1. Results of the Annual Carbon Footprint of Different Forestry Enterprises

The distributions of the carbon footprint of the 10 forestry enterprises between 2017 and 2021 and the annual average are shown in Figure 3. The Jenks Natural breaks classification method in the Map analysis of GeoDa (Center for Spatial Data Science, CSDS, Chicago, IL, USA) was used to classify the annual carbon footprint of forestry enterprises into four categories including high (>24,354 t CO2-eq), higher (8172–24,354 t CO2-eq), lower (5013–8171 t CO2-eq), and low (<5012 t CO2-eq). The results showed that the average annual carbon footprint of the 10 forestry enterprises in the Greater Khinggan Range of Northeast China ranged from 2354 t CO2-eq to 24,354 t CO2-eq. The forestry enterprise of Huzhong had the highest carbon footprint, followed by Tuqiang, Xinlin, and Hanjiayuan. The forestry enterprises of Jiagedaqi, Tahe, Amuer, and Shibazhan had lower carbon footprint, and Songling and Mohe had the least carbon footprint.
From the perspective of spatial distribution, the carbon footprint of the 10 forestry enterprises showed the characteristics of low east and high in the west. The forestry enterprise Huzhong which was located in the west of the study area showed high carbon footprint on most occasions, reaching 85,691 t CO2-eq in 2018 and 24,355 t CO2-eq on average. The forestry enterprise Tuqiang which was located in the northwest always showed higher carbon footprint. The number of forestry enterprises with lower carbon footprint accounted for 30–60% of all forestry enterprises. The forestry enterprises Songling and Mohe, which were located in the northwest and south of the study area, were always low carbon footprint forestry enterprises, and the highest annual carbon footprint was 2675 t CO2-eq and 3447 t CO2-eq, respectively.

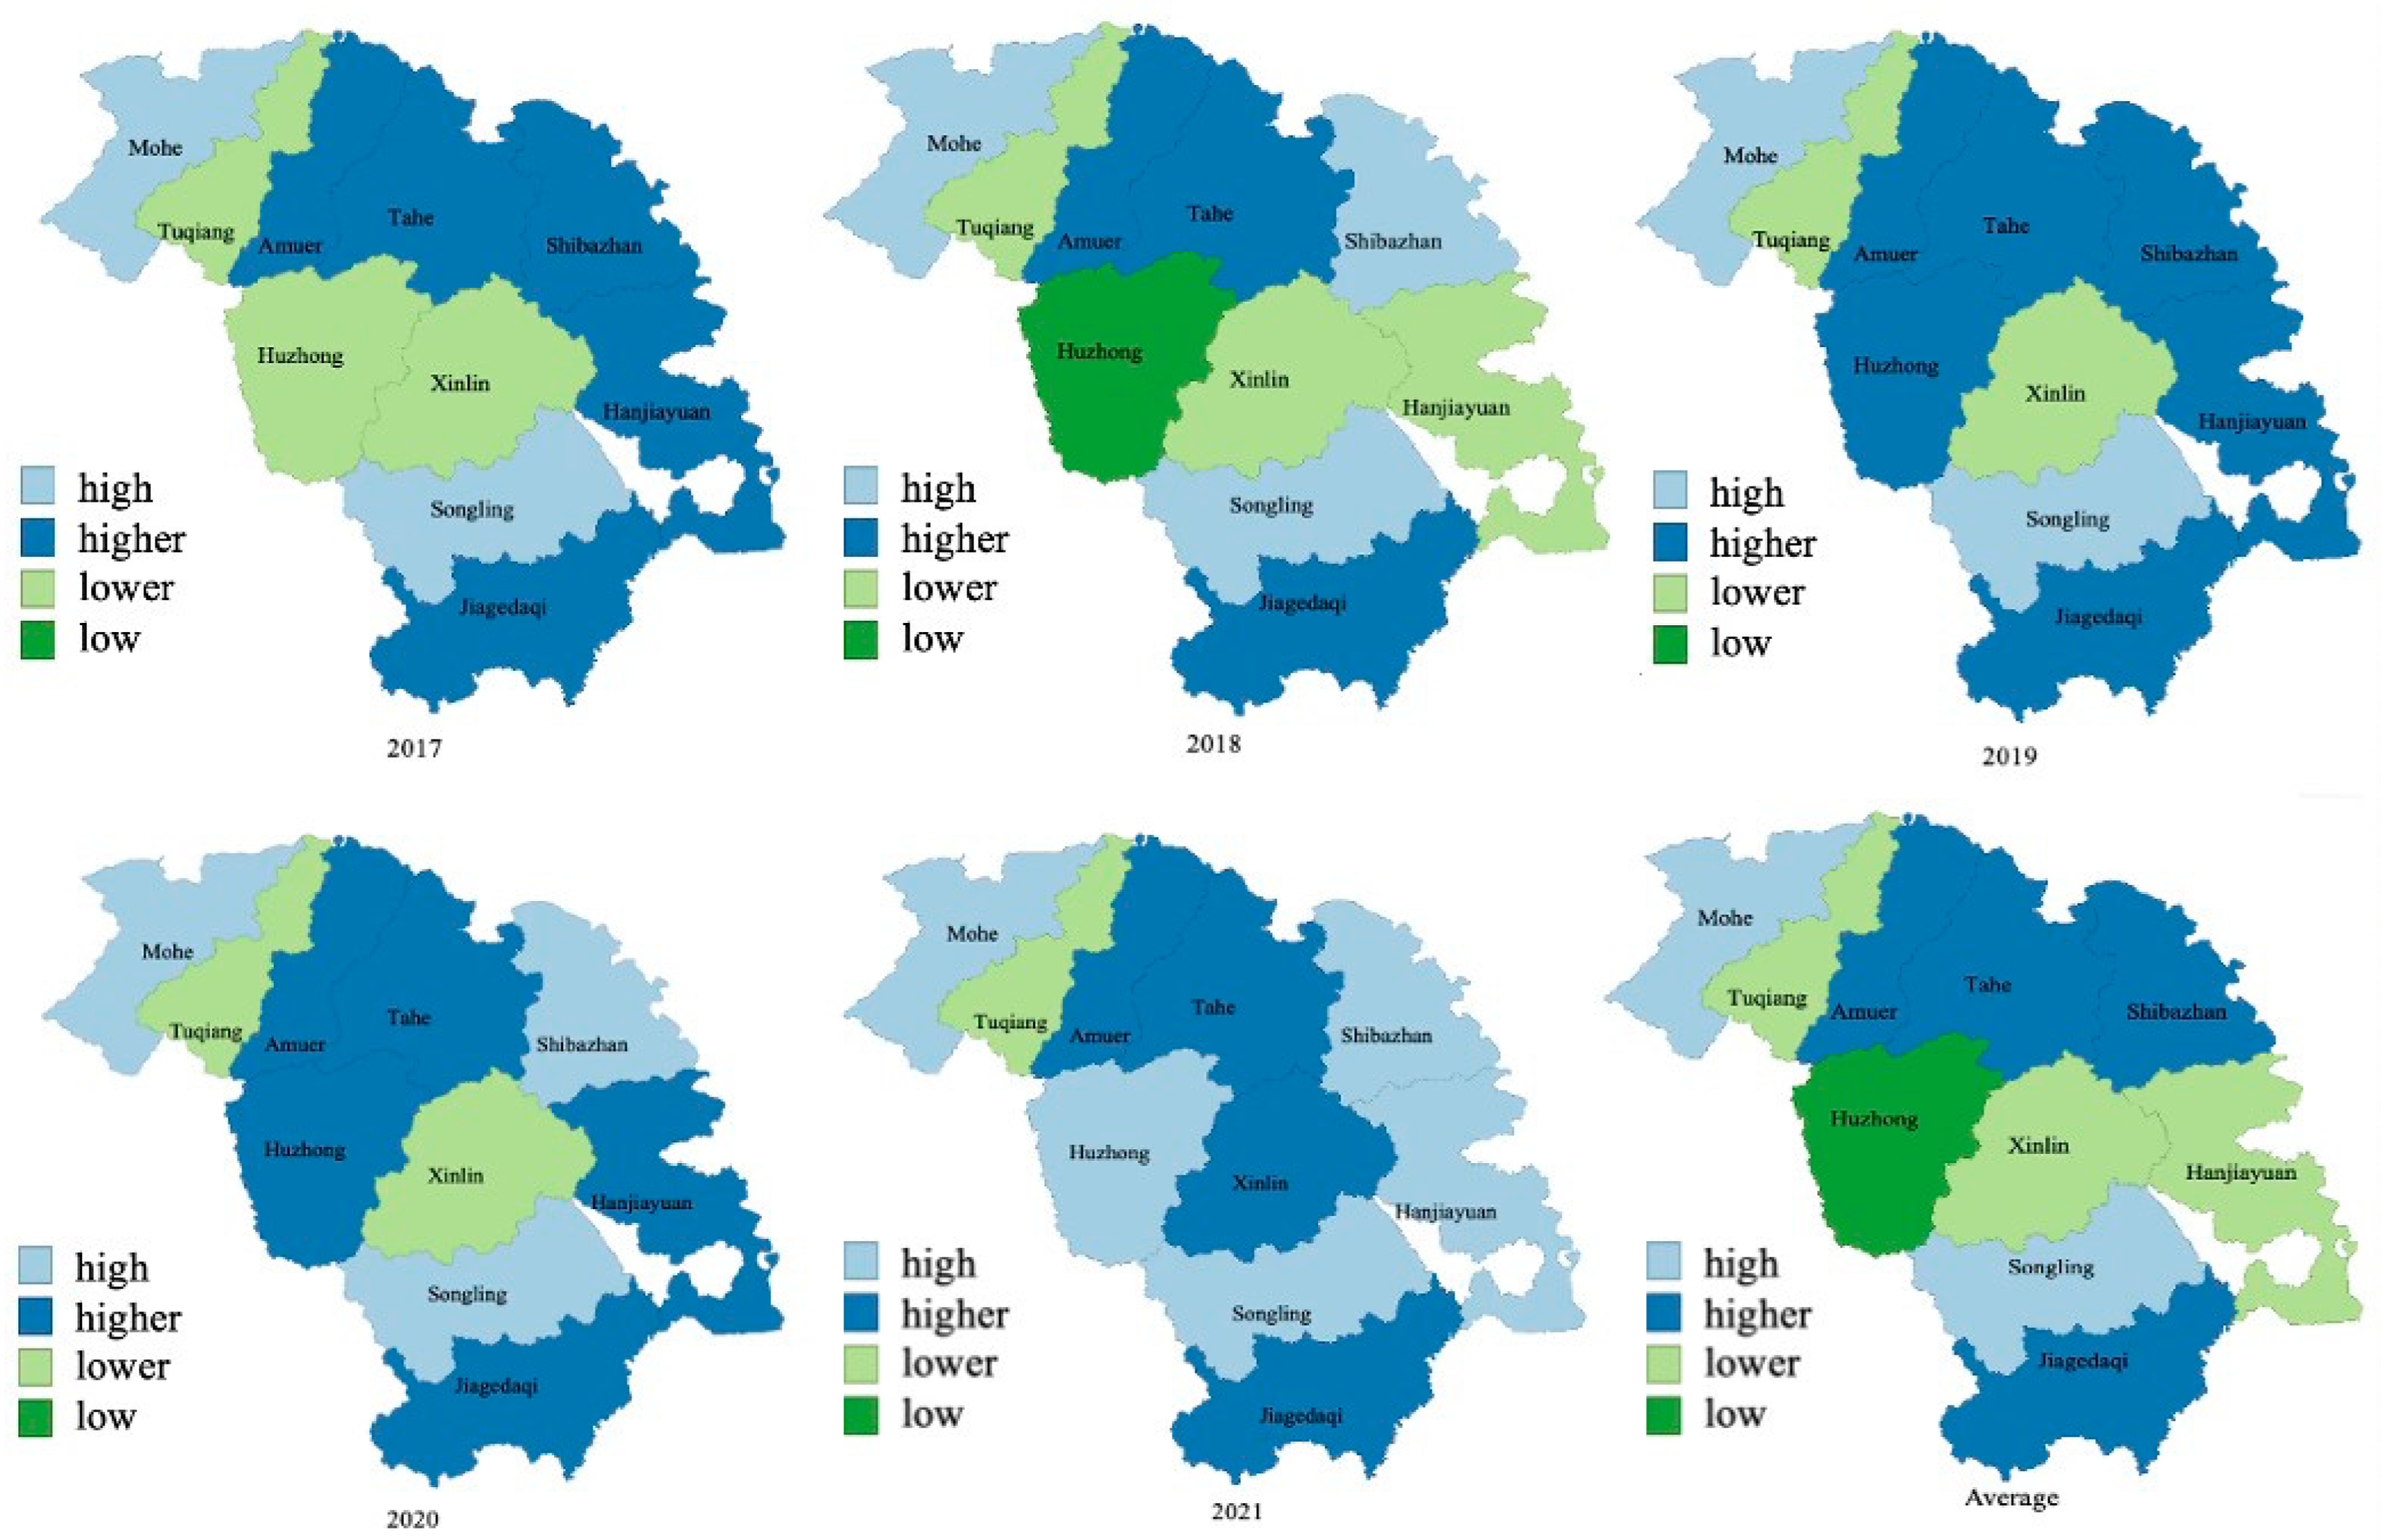
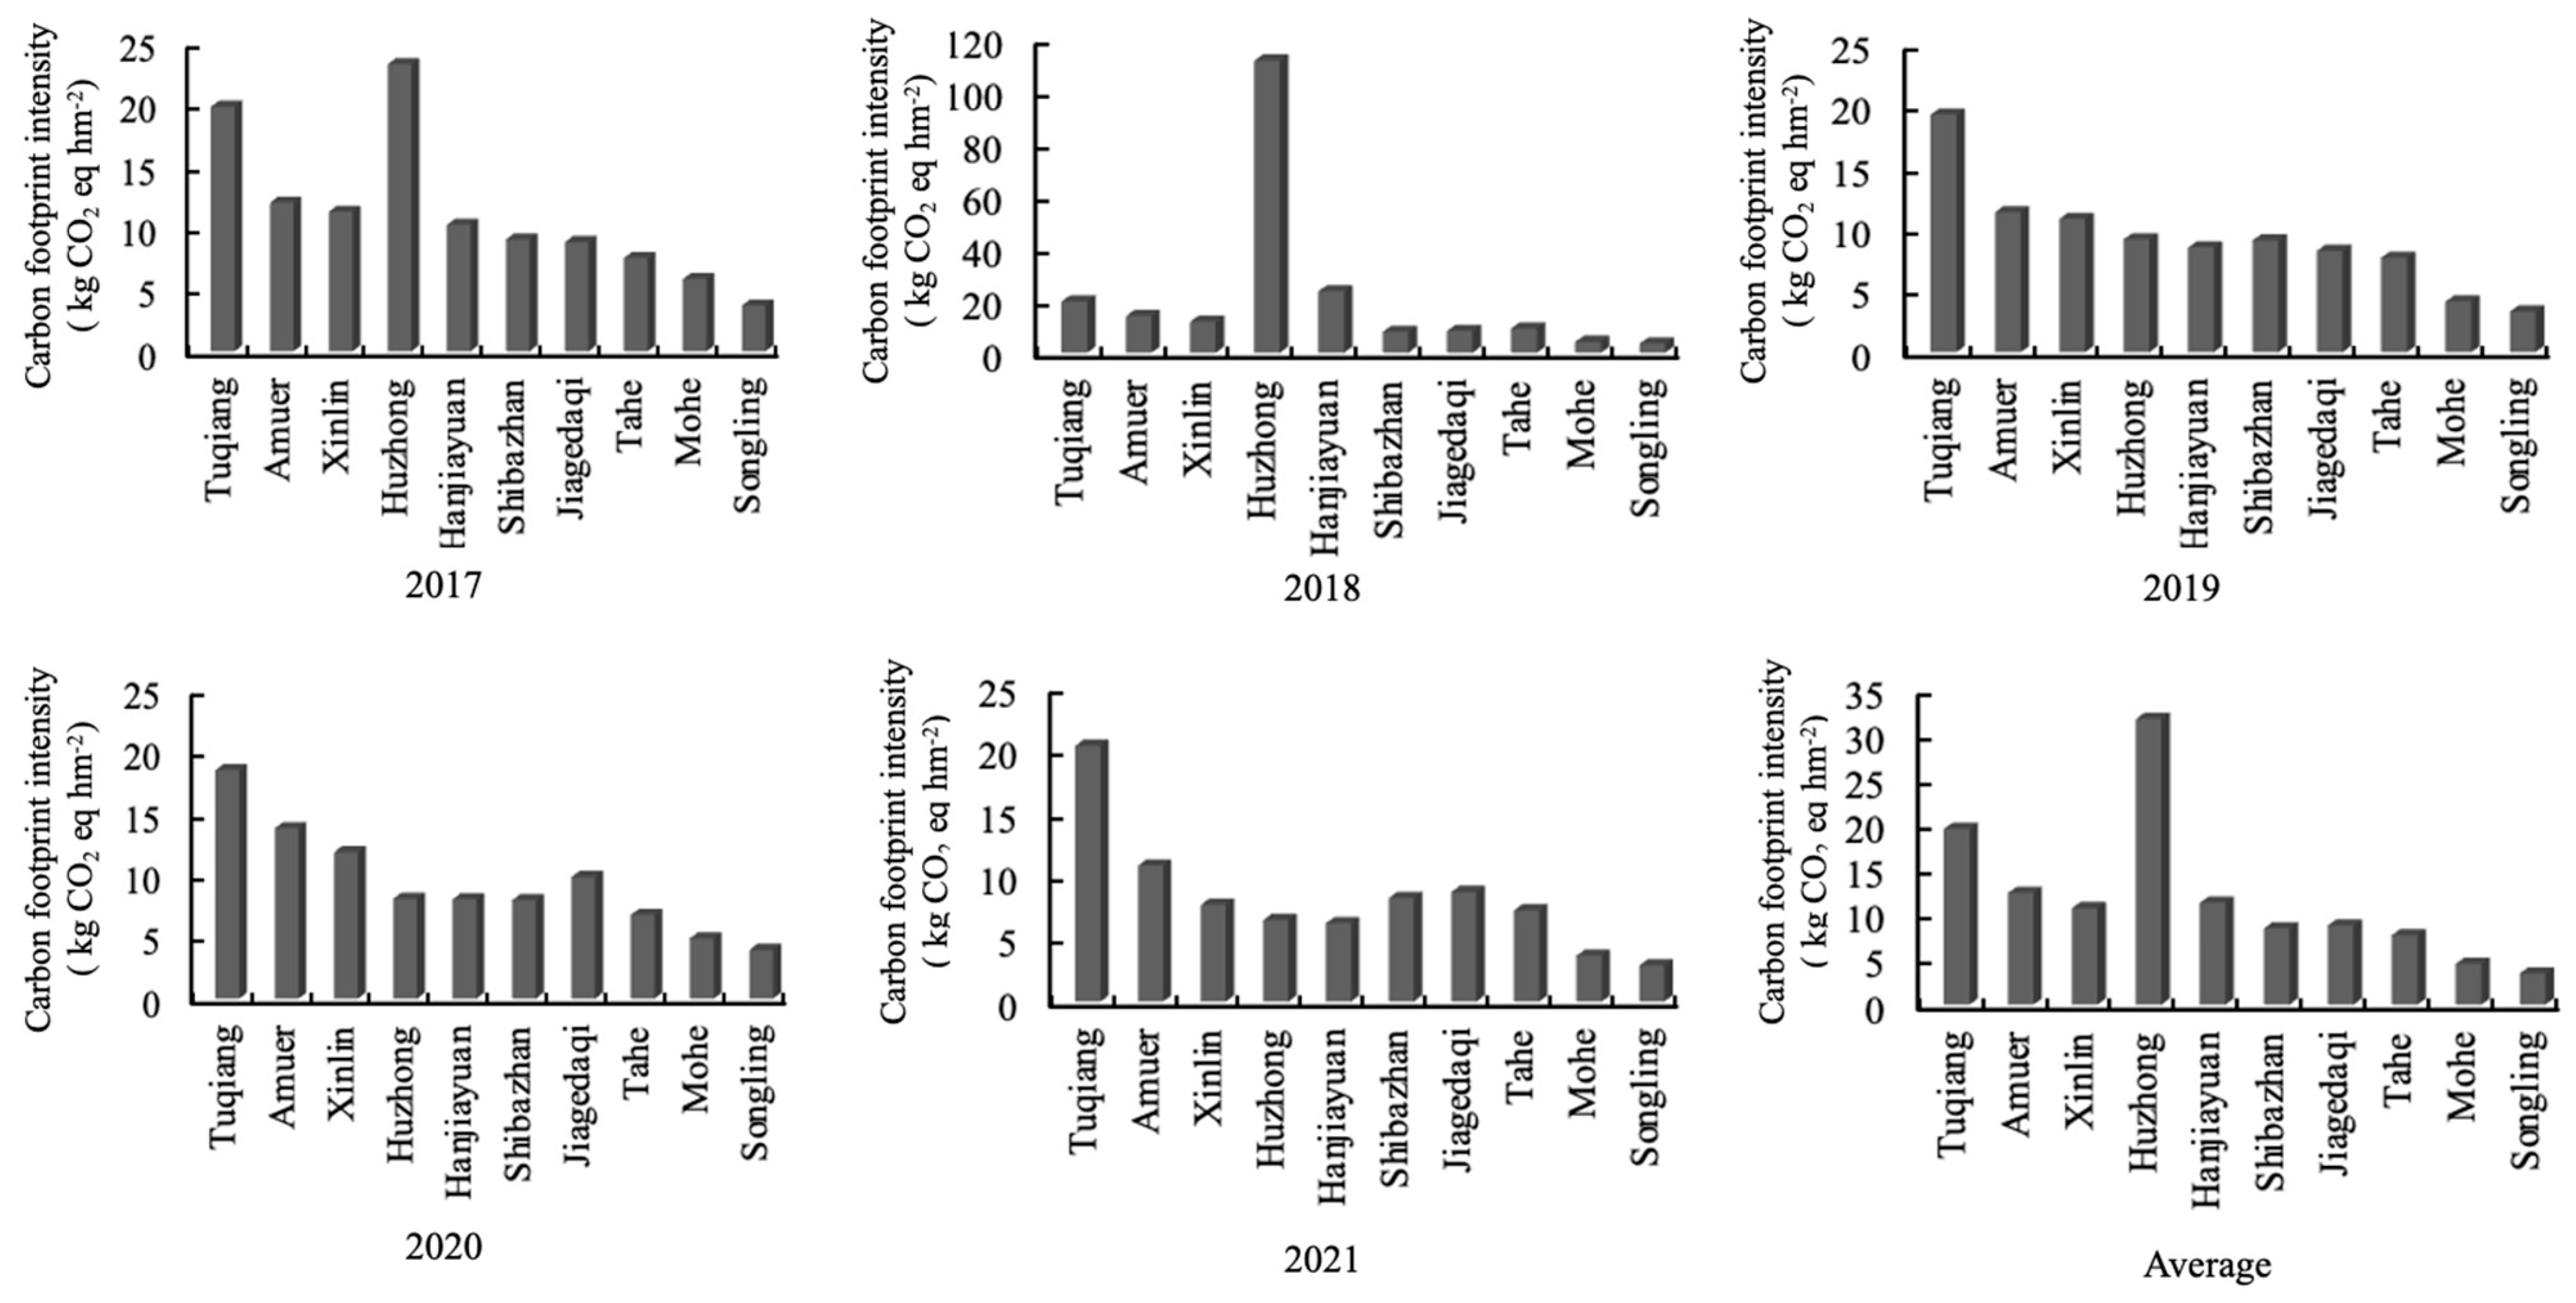
3.2.2. Results of the Annual Carbon Footprint Intensity of Different Forestry Enterprises

The annual carbon footprint intensity of different forestry enterprises during the period of 2017–2021 is shown in Figure 4. The average annual carbon footprint intensity of forestry enterprises ranged from 3.48 kg CO2-eq hm−2 to 31.76 kg CO2-eq hm−2. The order of the average annual carbon footprint intensity of forestry enterprises from high to low was Huzhong, Tuqiang, Amuer, Hanjiayuan, Xinlin, Jiagedaqi, Shibazhan, Tahe, Mohe, and Songling. In the same year, the difference in carbon footprint intensity of different forestry enterprises was due to the difference in carbon footprint and forest management area. For example, in 2018, the carbon footprint of Xinlin was 1.05 times that of Tuqiang, but the forest management area of Xinlin was 1.73 times that of Tuqiang, so the carbon footprint intensity of Xinlin was smaller, which was 0.60 times that of Tuqiang. In the same forestry enterprise, the carbon footprint intensity in different years varied due to the changes in the number of hired labor, commuting mode, the frequency of business trips, the change of forest land area, and the uncertain occurrence of natural interference, etc. The carbon footprint intensity of different forestry enterprises showed some fluctuations every year, but the difference was small. Except for Huzhong Forestry Bureau and Hanjiayuan Forestry Bureau, the annual differences in the carbon footprint intensity of the other forestry enterprises were less than 5 kg CO2-eq hm−2. The carbon footprint intensity of Huzhong Forestry Bureau and Hanjiayuan Forestry Bureau showed an increasing trend in 2018, increasing by 88.45 kg CO2-eq hm−2 and 13.31 kg CO2-eq hm−2 compared to that of 2017. The main reason was that 2143.64 hm2 and 316.49 hm2 of forest land in Huzhong Forestry Bureau and Hanjiayuan Forestry Bureau suffered fires in 2018. After that, its carbon footprint intensity in Huzhong Forestry Bureau and Hanjiayuan Forestry Bureau decreased and maintained at the level of 6.26 kg CO2-eq hm−2 to 9.19 kg CO2-eq hm−2 during 2019–2021.

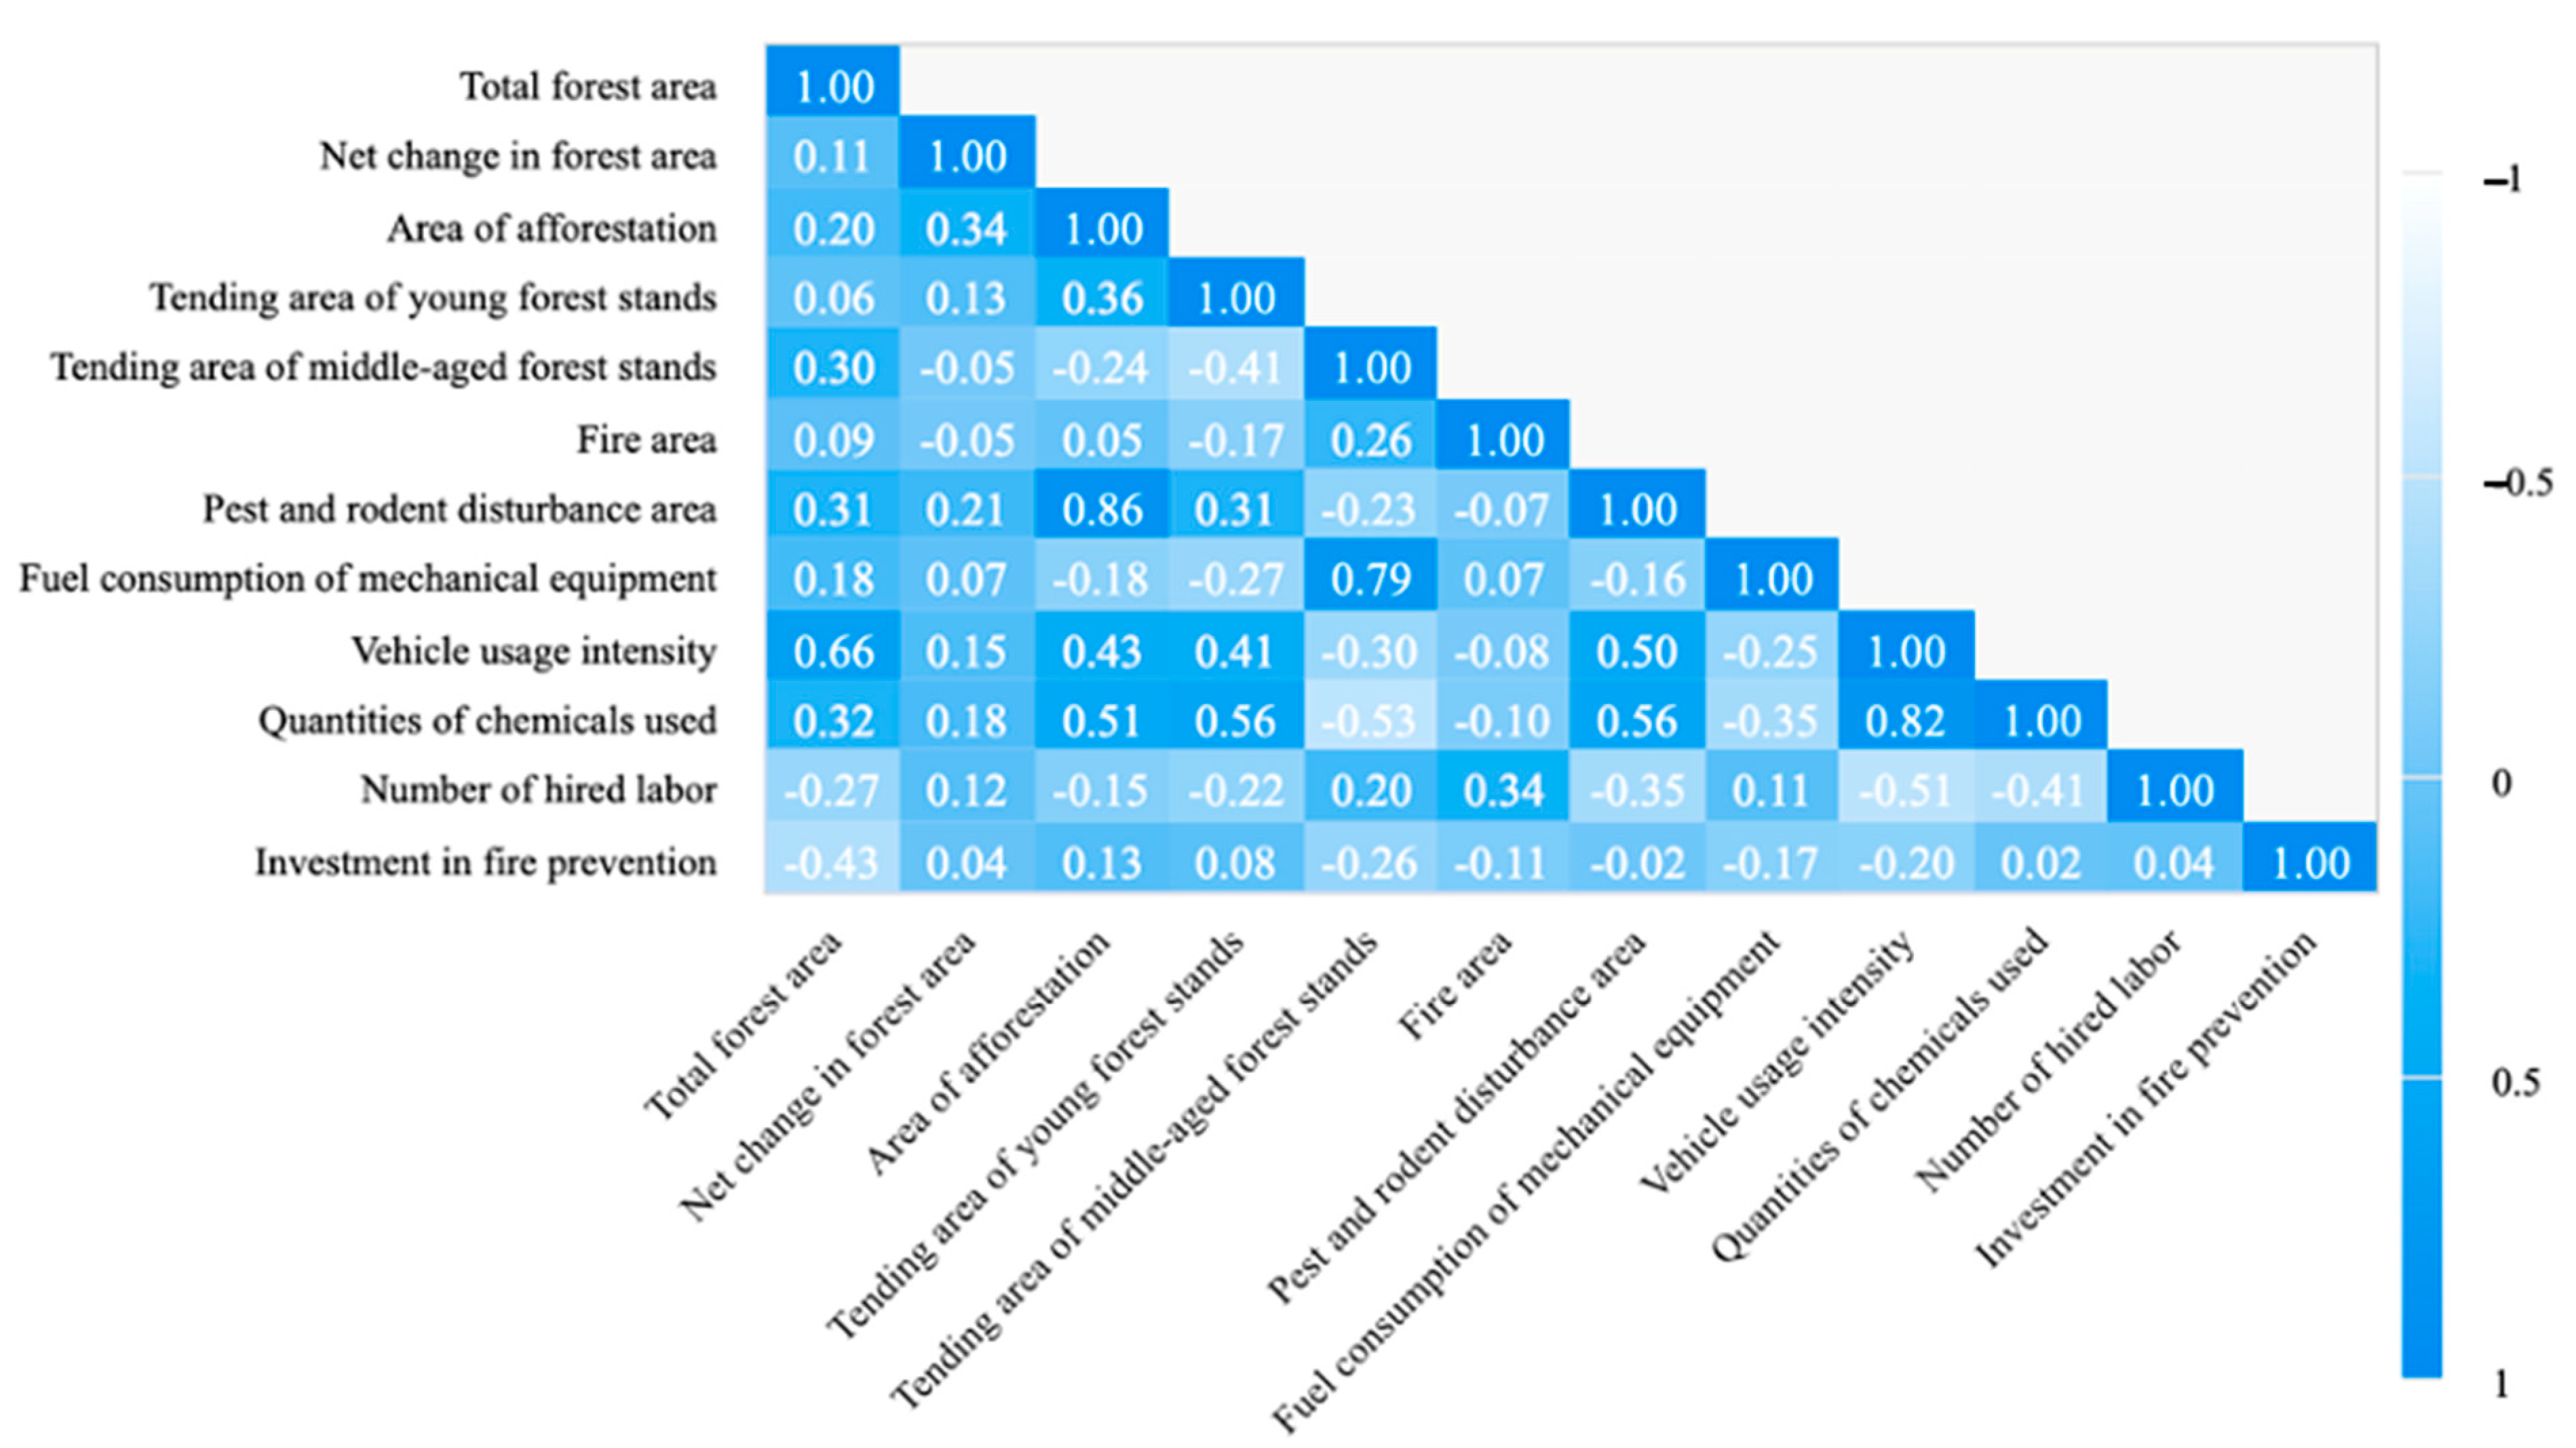
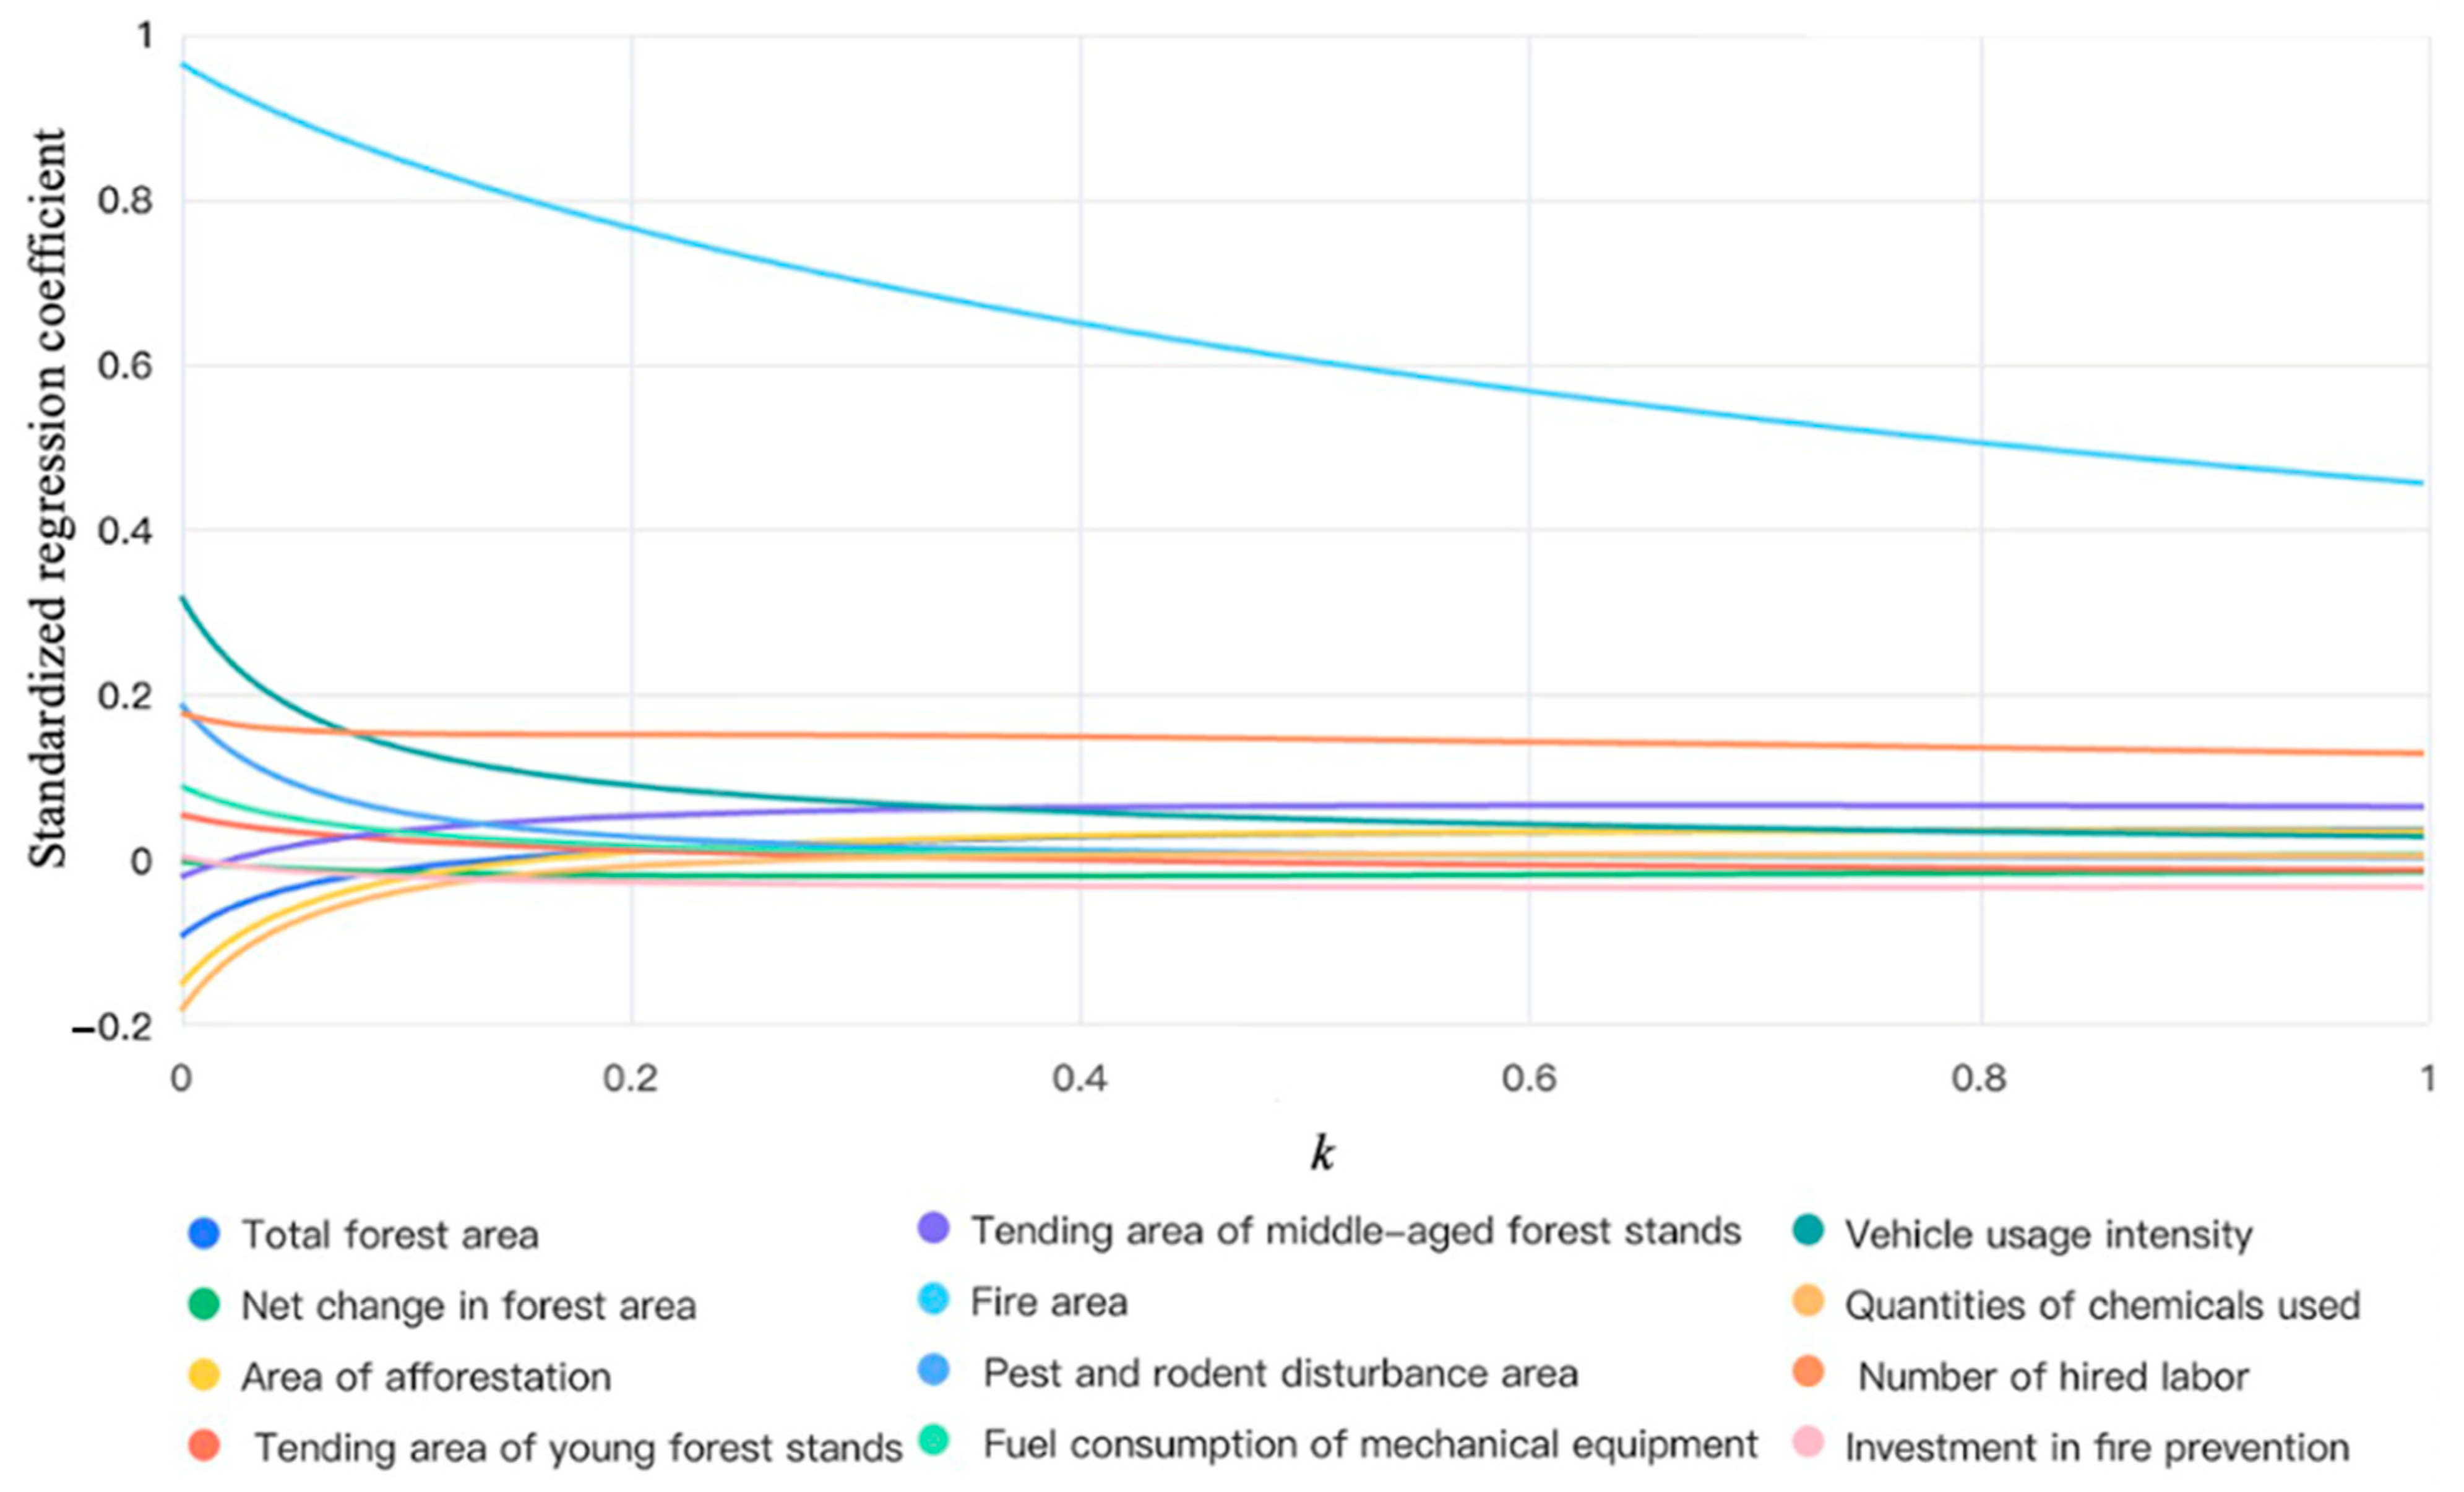
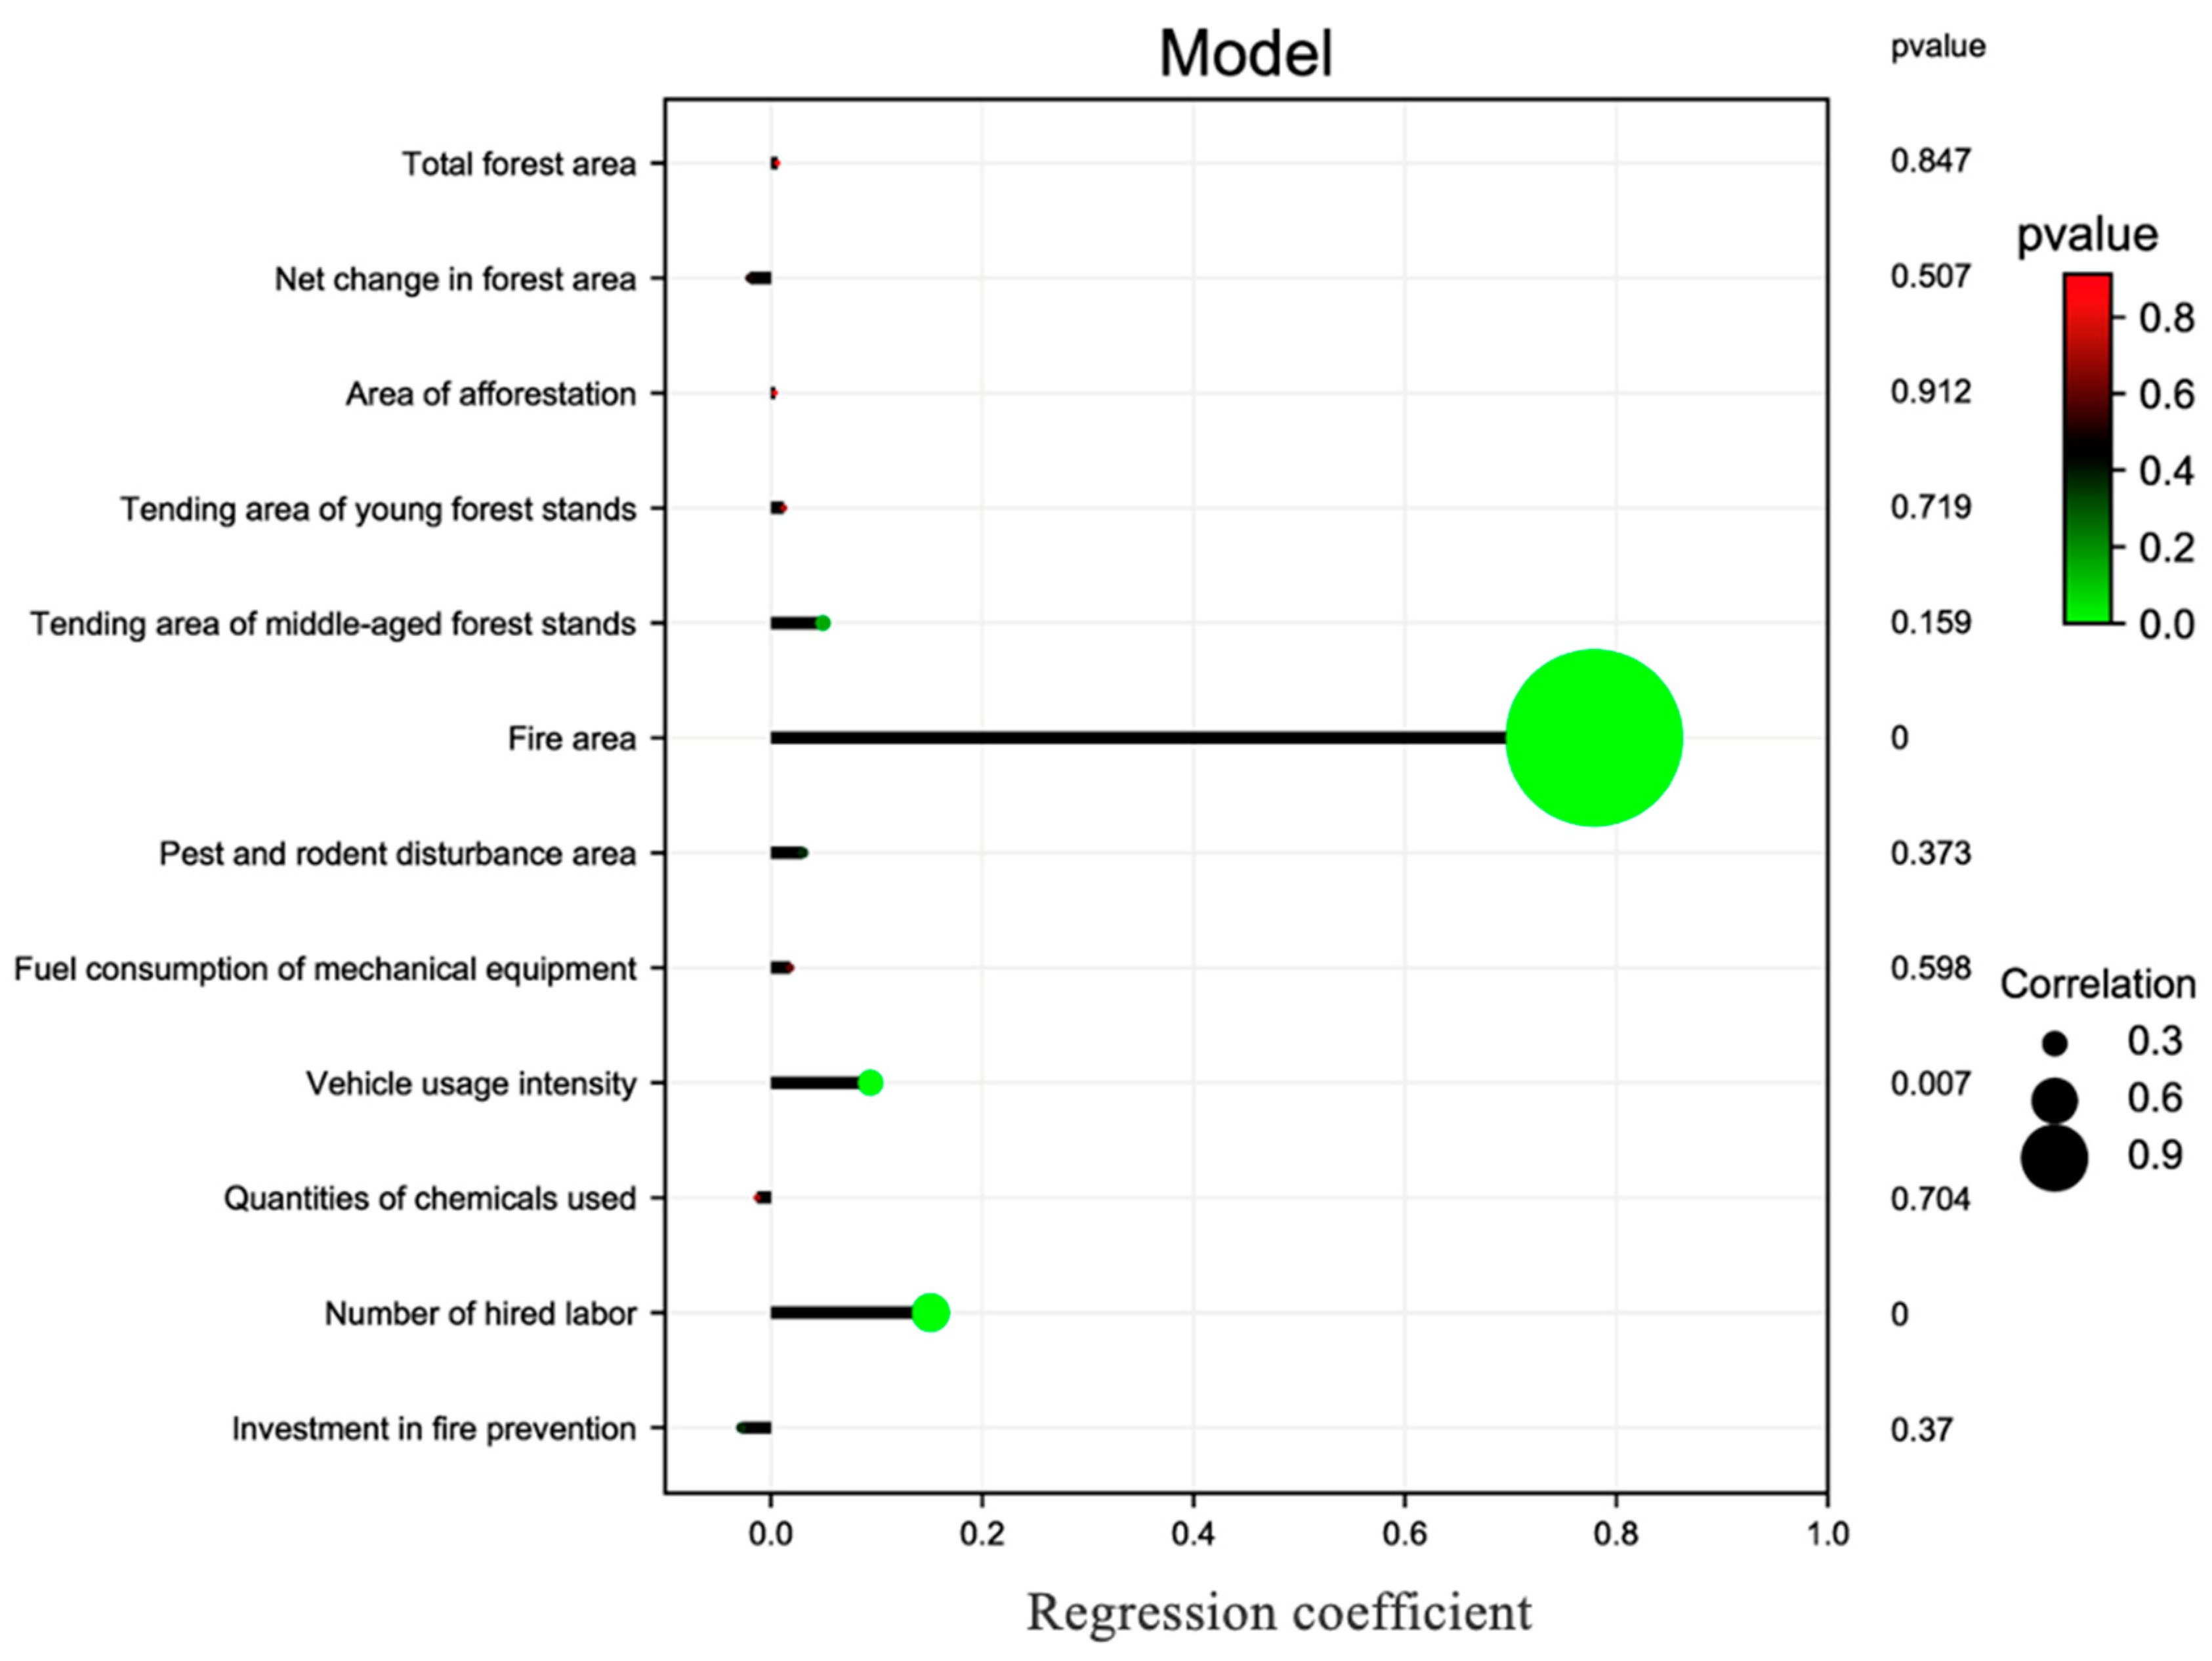
3.3. Analysis on the Influencing Factors of the Carbon Footprint of Forestry Enterprises

Pearson correlation coefficient was used to test the correlations among the 12 influencing variables of carbon footprint of forestry enterprises. The test results are shown in Figure 5. It is noted that there was some linear correlation between the variables. The correlation coefficient between the pest and rodent disturbance area and the area of afforestation was 0.86, and the correlation coefficient between quantities of chemicals used and the vehicle usage intensity was 0.82. However, there was no obvious causal relationship between the independent variables, so all the variables were retained. Furthermore, three-panel models, namely the POOL model, the FE model, and the RE model were constructed, and the F test, BP test, and Hausman test were carried out on the models, respectively. The test results are summarized in Table 4.
It is shown in Table 4 that the FE model is better than the POOL model and the RE model is better than the POOL model at the significance level of 0.05. The Hausman test does not show significance at the significance level of 0.05 (p = 1.000 > 0.05) and the R2 of the RE model is 0.987, greater than that of the FE model (R2 = 0.930), so the fitting effect of the RE model is better than the FE model. Therefore, the RE model is used as the panel model for the influencing factors of the carbon footprint of forestry enterprises. The collinearity diagnosis of independent variables is further carried out and the results are shown in Table 5. The test value of the variance expansion factor (VIF) in the model is greater than 5.0, which indicates that there is collinearity among the independent variables. In order to avoid the distortion of model evaluation and eliminate the multicollinearity problem, the ridge regression estimation method is used to fit the data. According to the variance expansion factor method, the minimum K when the standardized regression coefficient of each independent variable tends to be stable is determined to be 0.181 by the ridge trace plot (Figure 6).
When the minimum K in the ridge regress model is 0.181, the overall F-test is statistically significant at the level of 0.05, so there is a good regression relationship between the influencing variables and carbon footprint of forestry enterprises. Simultaneously, the goodness of fit of the ridge regression model (R2) is 0.941, which indicates that the 12 influencing variables can explain 94.1% of the variances in the carbon footprint of forestry enterprises. Since there are great differences in the nature, dimensions, order of magnitude, availability, and other characteristics among the 12 influencing variables, it is necessary to standardize the original index data and make the influencing variables have the same scale in order to prevent the roles of some indicators with higher numerical values from being amplified in the comprehensive analysis and thus relatively weaken the roles of indicators with lower numerical levels. The standardized regression coefficients in the ridge regression model are shown in Figure 7.
It is shown in Figure 7 that the carbon footprint of forestry enterprises is positively correlated with the total forest area, area of afforestation, tending area of young forest stands, tending area of middle-aged forest stands, fire area, pest and rodent disturbance area, fuel consumption of mechanical equipment, vehicle usage intensity, and number of hired labor. Among these variables, the fire area and the number of hired labor had the most significant positive impact on the carbon footprint of forestry enterprises (p = 0.000 < 0.01). When the number of hired labor and fire area was decreased, respectively, the carbon footprint reduction of forestry enterprises due to fire prevention and control was more significant than the reduction of the carbon footprint of forestry enterprises due to the reduction in hired labor. The vehicle usage intensity was also significantly correlated with the total carbon footprint of forestry enterprises at the significance level of 0.05 (p = 0.007 < 0.05). The larger the vehicle usage intensity, the more the carbon footprint of forestry enterprises. The standardized regression coefficient of pest and rodent disturbance area is 0.03, which has a weak impact on the carbon footprint of forestry enterprises. Of the 10 forestry enterprises, only Hanjiayuan, Jiagedaqi, Mohe, and Shibazhan suffered from pests and rat disturbance during the period of 2017 to 2021. The fuel consumption of mechanical equipment, the total forest area, area of afforestation, tending area of young forest stands, and tending area of middle-aged forest stands can drive the increase of carbon footprint in forestry enterprises, but the relationships were not significant. The net change in forest area, quantities of chemicals used, and investment in fire prevention have negative correlation with the carbon footprint of forestry enterprises.

4. Discussions

4.1. Comparisons of Total Carbon Footprint and Carbon Footprint Intensity for the Forestry Enterprises in the Greater Khinggan Range

Forestry enterprises play a vital role in the preparation, development, and implementation of forestry carbon sequestration projects. It is of great significance for accounting the carbon footprint of forestry enterprises in order to obtain the net carbon sequestration for trading. The average annual carbon footprint of the forestry enterprises in the Greater Khingan Range of northeast China during the period of 2017–2021 ranged from 2354 t CO2-eq to 24,354 t CO2-eq. Huzhong Forestry Bureau located in the west of the study area showed the highest carbon footprint and Songling Forestry Bureau located in the south of the study area had the least carbon footprint. The average carbon emission intensity of the 10 forestry enterprises in the Greater Khinggan Range was between 3.48 kg CO2-eq hm−2 (Songling) and 31.76 kg CO2-eq hm−2 (Huzhong), which was lower than the study results of carbon footprint intensity (99 kg CO2-eq hm−2) of the school forest enterprise in the Czech University of Life Sciences in Prague conducted by Kubová et al. [21]. The difference was mainly due to the fact that the forestry enterprises in our study focused on forest management and forest conservation, and wood production (timber extraction) and processing (i.e., handling of wood, cutting wood, drying of wood) were not considered in the carbon footprint accounting system of forestry enterprises. Another study conducted by Lin et al. [9] analyzed the carbon footprint of five forestry enterprises in Hainan, Guangdong, Guangxi, Yunnan, and Henan provinces of China. The activity data of the five forestry enterprises in 2008 was collected and summarized to calculate the enterprise-level carbon footprint. They found that the carbon footprint intensity of forestry enterprises in South China was 1.263 kg CO2-eq hm−2, lower than the study results presented in this study. The main reason was that the fuel consumption from mechanical equipment used in different forest management activities (seedlings cultivation, tending, disturbance prevention, etc.) and human impacts were not fully considered in their study. In addition, the long heating period (6 months) in the forest area of northeast China also contributed to the carbon footprint of the forestry enterprises in the Greater Khingan Range of northeast China. It should be also noted that the study results of reference [9] also had some limitations due to the small sample size and the absence of comparison on time series data.

4.2. Comparisons of the Key Aspects of the Carbon Footprint of Forestry Enterprises in the Greater Khinggan Range

It is very important to identify the key sources of carbon emissions in forestry enterprises in order to develop scientific and reasonable prevention and control measures. In the Greater Khingan Range of northeast China, there has been no commercial forest harvesting since 2014. In addition, the 10 forestry bureaus in the study area had experienced forest fires in varying degrees in different years due to the disturbance of natural factors. In combination with the carbon footprint of forestry enterprises in scope 1, 2 and 3, it was found that the direct consumption of energy from forest fires, disturbance prevention, and forest tending and the indirect consumption of energy from the labor service were the key links of carbon emissions in the forestry enterprises in the study area. Similarly, other scholars found that forest operations and natural fires were considered to be the major sources of carbon emissions [69]. For example, Zhou et al. [38] estimated the carbon emissions in different stages of logging using process analysis method based on B2B (business to business) model of life cycle assessment. Their results showed that the carbon emission of logging was about 7.53–11.66 kg m−3, accounting for 2.2–5.7% of its carbon sequestration capacity. Parigiani et al. [22] pointed out that the biggest difference in the carbon footprints of forestry companies in 2008 and 2009 was the loss of forest carbon due to fires. Lin et al. [9] also pointed out that forest fires and chemicals were the main sources of carbon emissions in the operation of forestry enterprises.

4.3. Comparison of the Factors Influencing the Carbon Footprint of Forestry Enterprises in the Greater Hinggan Mountains

The average annual carbon footprint and carbon footprint intensity of forestry enterprises in the Greater Khingan Range of northeast China during the period of 2017–2021 initially increased and then decreased. This trend is the result of a combination of complex influencing factors. The study on the influencing factors of the carbon footprint of forestry enterprises can facilitate the formulation of corresponding measures against the driving factors and help reduce the contribution of carbon emissions from these factors, which is beneficial to the low-carbon development of forestry carbon sequestration projects. Our study results showed that fire area, the number of hired labor, and vehicle usage intensity were significant driving factors of the carbon footprint in forestry enterprises. As we known, when fires occurred in forests, the carbon stored in trees and understory vegetation can be rapidly released into the atmosphere as carbon dioxide (CO2), leading to increased emissions. In addition, the loss of trees can reduce the forests’ capacity of sequestering carbon, diminishing its carbon sequestration potential. The severity and frequency of forest fires can vary based on multiple factors, including climate conditions and forest management practices. The forest operations such as afforestation, tending, and forest patrols are labor-intensive. The intensive usage of manpower had negative impacts on the environment by consuming more energy, which can significantly increase the carbon footprint of forestry enterprises. The fuels consumed by vehicles in various forest operations such as seedlings transport and forest patrols contribute to the carbon footprint through the emission of carbon dioxide and other pollutants during combustion. Other studies have similar findings. For example, Lin et al. [9] pointed out that forest fire had the most significant impact on the carbon emissions of forestry enterprises. They proposed that forestry enterprises should actively take measures to reduce the occurrence of forest fires. Guo and Xu [70] established carbon dioxide emission model for forest industry based on the framework of IPAT and used ridge regression to analyze the influencing factors. They found that population factor and carbon intensity had positive impacts on the carbon dioxide emissions of forestry industry. The hired labor force was widely used in afforestation and tending operations. Chang et al. [71] compared carbon emissions from afforestation and tending operations and new planting and afforestation operations for plantation were found to result in higher energy consumption and carbon emissions compared with tending operations. In summary, to reduce the carbon footprint and promote carbon trading in the forestry enterprises, it is important to implement effective fire prevention and control measures, enhance the efficiency of relative forest management activities, and optimize energy usage by choosing clean energy sources.

4.4. Limitations and Future Research

It should be noted that there are also some limitations in this study. Due to the constraints of survey data availability, this study only estimated the carbon footprint of the forestry enterprises in the Greater Khingan Range of northeast China during the past five years. However, it is known that forests are long-lived plantations that can exist for several hundred years, and the necessary forest operations may occur at different time. Future research can be conducted by incorporating the physiological characteristics of forests over an extended period and exploring the variations in carbon footprint and the underlying driving factors across different ownership types, forest types, and products. In addition, this research can be extended into the Lesser Khingan Range of northeast China. In this way, more sample size can be obtained, and the statistical results will be more reliable. It is also suggested to formulate regional carbon footprint prevention and control policies in order to promote the development of forest carbon trading projects.

5. Conclusions

In this study, the carbon footprint and carbon footprint intensity of 10 forestry enterprises under the Greater Khingan Forestry Group Corporation of China were calculated, the characteristics of carbon footprint and carbon footprint intensity by year and by individual forestry enterprises were identified, and the analysis on the influencing factors were conducted. The following conclusions are drawn from the study:
(1) During the period of 2017 to 2021, the average annual carbon footprint and carbon footprint intensity of the Greater Khingan Forestry Group initially increased and then decreased. The annual carbon footprint was 81,694 t CO2-eq, and the annual carbon footprint intensity was 11.84 kg CO2-eq hm−2. The carbon footprint of the Greater Khingan Forestry Group mainly came from direct carbon emissions in forest fires, disturbance prevention and forest tending activities, accounting for 50.66% of the total annual carbon footprint. Indirect carbon emissions were dominated by the consumption of electricity (18.20%) and labor services (17.58%).
(2) During the period of 2017 to 2021, the average annual carbon footprint of forestry enterprises ranged from 2354 t CO2-eq to 24,354 t CO2-eq. The forestry enterprise Huzhong which was located in the west of the study area showed high carbon footprint on most occasions. The forestry enterprises Songling and Mohe which were located in the northwest and south of the study area were always low carbon footprint forestry enterprises. The average annual carbon footprint intensity of forestry enterprises ranged from 3.48 kg CO2-eq hm−2 to 31.76 kg CO2-eq hm−2, and the annual differences in the carbon footprint intensity of the other forestry enterprises (except for the Huzhong Forestry enterprise and Hanjiayuan Forestry enterprise) were less than 5.0 kg CO2-eq hm−2.
(3) Fire area, the number of hired labor, and vehicle usage intensity were significant driving factors of the carbon footprint in the forestry enterprises in the study area. To reduce the carbon footprint and promote carbon trading in forestry enterprises, it is suggested to implement effective fire prevention and control measures, enhance the efficiency of relative forest management activities, and optimize energy usage by choosing clean energy sources.

Author Contributions

Conceptualization, J.W. and W.L.; methodology, H.W. and J.W.; software, H.W.; validation, H.W., J.W., W.L. and Z.L.; formal analysis, H.W. and J.W.; investigation, H.W. and Z.L.; writing—original draft preparation, H.W., W.L. and J.W.; writing—review and editing, J.W.; supervision, J.W. and W.L.; project administration, J.W.; funding acquisition, J.W. All authors have read and agreed to the published version of the manuscript.

Funding

This research was funded by the Joint Project of the Natural Science Foundation of Heilongjiang Province, grant number LH2021G001.

Institutional Review Board Statement

Not applicable.

Informed Consent Statement

Not applicable.

Data Availability Statement

The data used to support the findings of this study are available from the corresponding author upon request.

Acknowledgments

The authors would like to acknowledge the Natural Science Foundation of Heilongjiang Province for providing support to this study.

Conflicts of Interest

The authors declare no conflict of interest. The funder had no role in the design, execution, interpretation, or writing of the study.

References

  1. Yoro, K.O.; Daramola, M.O. CO2 emission sources, greenhouse gases, and the global warming effect. In Advances in Carbon Capture; Elsevier: Amsterdam, The Netherlands, 2020; pp. 3–28. [Google Scholar]
  2. Hui, D.F.; Deng, Q.; Tian, H.Q.; Luo, Y.Q. Global climate change and greenhouse gases emissions in terrestrial ecosystems. In Handbook of Climate Change Mitigation and Adaptation; Springer: Berlin/Heidelberg, Germany, 2022; pp. 23–76. [Google Scholar]
  3. Ye, H.Y.; Zhang, Q.; Pan, X.Z.; Lv, L. Carbon leakage for voluntary emission reduction projects: Concept, classification, and measures. Chin. J. Environ. Manag. 2020, 12, 98–106. [Google Scholar]
  4. Nabuurs, G.J.; Thürig, E.; Heidema, N.; Armolaitis, K.; Biber, P.; Cienciala, E.; Kaufmann, E.; Mäkipää, R.; Nilsen, P.; Petritsch, R.; et al. Hotspots of the European forests carbon cycle. For. Ecol. Manag. 2008, 256, 194–200. [Google Scholar] [CrossRef]
  5. Huang, R.; Zhang, S.F.; Wang, P. Key areas and pathways for carbon emissions reduction in Beijing for the “Dual Carbon” targets. Energy Policy 2022, 164, 112873. [Google Scholar] [CrossRef]
  6. Richards, K.R.; Stokes, C. A review of forest carbon sequestration cost studies: A dozen years of research. Clim. Chang. 2004, 63, 1–48. [Google Scholar] [CrossRef]
  7. Liu, L.W.; Chen, C.X.; Zhao, Y.F.; Zhao, E.D. China’s carbon-emissions trading: Overview, challenges and future. Renew. Sustain. Energy Rev. 2015, 49, 254–266. [Google Scholar] [CrossRef]
  8. Ba, F.; Liu, J.L.; Zhu, T.; Liu, Y.G.; Zhao, J.C. CDM forest carbon sequestration projects in western China: An analysis using actor-centered power theory. For. Policy Econ. 2020, 115, 102139. [Google Scholar] [CrossRef]
  9. Lin, B.T.; Li, X.L.; Luo, D. Study on forestry enterprise carbon footprint. South China For. Sci. 2013, 3, 33–36+41. [Google Scholar]
  10. Pandey, D.; Agrawal, M.; Pandey, J.S. Carbon footprint: Current methods of estimation. Environ. Monit. Assess. 2011, 178, 135–160. [Google Scholar] [CrossRef]
  11. Dooley, E.E. EHPnet: World resources institute: Climate, energy, and transport program. Environ. Health Perspect. 2007, 115, A537. [Google Scholar] [CrossRef]
  12. Weng, C.K.; Boehmer, K. Launching of ISO 14064 for greenhouse gas accounting and verification. ISO Manag. Syst. 2006, 15, 14–16. [Google Scholar]
  13. Chen, L.; Chen, J.H.; Bao, W.; Guo, H.T.; Sun, L. Development progress review and policy suggestion on greenhouse gas emission quantification standards for enterprise. China Popul. Resour. Environ. 2016, 26, 20–22. [Google Scholar]
  14. Hammar, T.; Hansson, P.A.; Seleborg, M.; Stendahl, J. Climate Effects of a Forestry Company—Including Biogenic Carbon Fluxes and Substitution Effects; Swedish University of Agricultural Sciences: Uppsala, Sweden, 2020. [Google Scholar]
  15. Zhao, Q.J.; Ding, S.; Wen, Z.M.; Toppinen, A. Energy flows and carbon footprint in the forestry-pulp and paper industry. Forests 2019, 10, 725. [Google Scholar] [CrossRef]
  16. Zhou, J.; Yin, Z.C.; Yue, P.P. The impact of access to credit on energy efficiency. Financ. Res. Lett. 2023, 51, 103472. [Google Scholar] [CrossRef]
  17. Ye, X.; Yue, P.P. Financial literacy and household energy efficiency: An analysis of credit market and supply chain. Financ. Res. Lett. 2023, 52, 103563. [Google Scholar] [CrossRef]
  18. Chen, K.Y.; He, Y.J.; Xie, H.S.; Li, Y.J.; Zhao, Y.X. Evaluation and prediction of coupling coordinated development of compound system of key state-owned forest region in Daxing ‘anling, Heilongjiang province. J. Ecol. Rural. Environ. 2022, 38, 578–586. [Google Scholar]
  19. Zhang, L.Y.; Dong, L.B.; Liu, Q.; Liu, Z.G. Spatial patterns and interspecific associations during natural regeneration in three types of secondary forest in the central part of the Greater Khingan Mountains, Heilongjiang Province, China. Forests 2020, 11, 152. [Google Scholar] [CrossRef]
  20. Forestry and Grassland Administration. China’s Forest and Grassland Resources and Ecological Status State in 2021; China Forestry Publishing House: Beijing, China, 2021. [Google Scholar]
  21. Kubová, P.; Hájek, M.; Třebický, V. Carbon footprint measurement and management: Case study of the school forest enterprise. Bioresources 2018, 13, 4521–4535. [Google Scholar] [CrossRef]
  22. Parigiani, J.; Desai, A.; Mariki, R.; Miner, R. The carbon footprint of an east African forestry enterprise. J. Sustain. Dev. 2011, 4, 152–162. [Google Scholar] [CrossRef]
  23. Fan, Q.; Wang, C.Z.; Zhang, D.Y.; Zang, S.Y. Environmental influences on forest fire regime in the Greater Hinggan Mountains, northeast China. Forests 2017, 8, 372. [Google Scholar] [CrossRef]
  24. Wu, Z.W.; He, H.S.; Yang, J.; Liu, Z.H.; Liang, Y. Relative effects of climatic and local factors on fire occurrence in boreal forest landscapes of northeastern China. Sci. Total Environ. 2014, 493, 472–480. [Google Scholar] [CrossRef]
  25. Chen, K.Y.; Wang, J.J.; He, Y.J.; Zhang, L.W. Estimations of forest carbon storage and carbon sequestration potential of key state-owned forest region in Daxing’ anling, Heilongjiang province. Ecol. Environ. Sci. 2022, 31, 1725–1734. [Google Scholar]
  26. Zhang, L.C.; Zhang, Y.F.; Dong, L.B. Spatial pattern and correlation of forest landscape in Daxing’ an Mountains based on Landsat TM data. For. Eng. 2021, 37, 1–9. [Google Scholar]
  27. Choudhary, P.; Srivastava, R.K.; De, S. Integrating Greenhouse gases (GHG) assessment for low carbon economy path: Live case study of Indian national oil company. J. Clean. Prod. 2018, 198, 351–363. [Google Scholar] [CrossRef]
  28. Liu, X.B. Mitigating China’s Greenhouse Gas Emissions in the Last Decade: Clear Target or Blurred Path? J. WTO China 2022, 12, 73. [Google Scholar]
  29. Radonjic, G.; Tompa, S. Carbon footprint calculation in telecommunications companies—The importance and relevance of scope 3 greenhouse gases emissions. Renew. Sustain. Energy Rev. 2018, 98, 361–375. [Google Scholar] [CrossRef]
  30. Ji, J.P.; Ma, X.M. Review of carbon footprint: Definitions and accounting methods. Ecol. Econ. 2011, 4, 76–80. [Google Scholar]
  31. Nian, V.; Chou, S.; Su, B.; Bauly, J. Life cycle analysis on carbon emissions from power generation–The nuclear energy example. Appl. Energy 2014, 118, 68–82. [Google Scholar] [CrossRef]
  32. Sonne, E. Greenhouse gas emissions from forestry operations: A life cycle assessment. J. Environ. Qual. 2006, 35, 1439–1450. [Google Scholar] [CrossRef]
  33. Timmermann, V.; Dibdiakova, J. Greenhouse gas emissions from forestry in East Norway. Int. J. Life Cycle Assess. 2014, 19, 1593–1606. [Google Scholar] [CrossRef]
  34. Isaev, A.; Korovin, G.; Bartalev, S.; Ershov, D.; Janetos, A.; Kasischke, E.; Shugart, H.; French, N.; Orlick, B.; Murphy, T. Using remote sensing to assess Russian forest fire carbon emissions. Clim. Chang. 2002, 55, 235–249. [Google Scholar] [CrossRef]
  35. Cyr, H.; Pace, M.L. Magnitude and patterns of herbivory in aquatic and terrestrial ecosystems. Nature 1993, 361, 148–150. [Google Scholar] [CrossRef]
  36. Iqbal, J.; Hu, R.G.; Lin, S.; Ahamadou, B.; Feng, M.L. Carbon dioxide emissions from Ultisol under different land uses in mid–subtropical China. Geoderma 2009, 152, 63–73. [Google Scholar] [CrossRef]
  37. Lin, Q.W.; Zhang, L.; Qiu, B.K.; Zhao, Y.; Wei, C. Spatiotemporal analysis of land use patterns on carbon emissions in China. Land 2021, 10, 141. [Google Scholar] [CrossRef]
  38. Zhou, Y.; Zheng, L.F.; Zhou, X.N.; Wu, Z.L.; Zhou, C.J.; Luo, W.; Lin, Y.F. Eco-benefit evaluation of biomass solid fuel based on forest cutting residues. For. Eng. 2018, 34, 24–29. [Google Scholar]
  39. Zhou, Y.; Li, D.; Wu, Z.L.; Zhou, C.J.; Zheng, L.F. Carbon emission in forest logging operation process. For. Eng. 2014, 30, 1–5. [Google Scholar]
  40. Pan, B.B.; Zhang, Y.L. Impact of affluence, nuclear and alternative energy on US carbon emissions from 1960 to 2014. Energy Strategy Rev. 2020, 32, 100581. [Google Scholar] [CrossRef]
  41. Zhang, T.; Chen, L.Q.; Wang, R.; Wang, B.Y.; Liu, Y.Q.; Liu, W.Q.; Wang, J.; Wen, M.X. The influencing factors of industrial carbon emissions in the context of undertaking industrial transfer in Anhui Province, China. Appl. Ecol. Environ. Res. 2019, 17, 4205–4227. [Google Scholar] [CrossRef]
  42. Fu, W.; Luo, M.C.; Cheng, C.J. Research progress and prospects of carbon footprint and Its influencing factors. For. Econ. 2021, 43, 39–49. [Google Scholar]
  43. Wang, F.; Ni, J. Study on the influencing factors of enterprises’ carbon emission—An empirical analysis of Zhejiang enterprises. J. Bus. Econ. 2016, 1, 71–80. [Google Scholar]
  44. Chinnakum, W.; Sriboonchitta, S.; Pastpipatkul, P. Factors affecting economic output in developed countries: A copula approach to sample selection with panel data. Int. J. Approx. Reason. 2013, 54, 809–824. [Google Scholar] [CrossRef]
  45. Al-Mulali, U. Investigating the impact of nuclear energy consumption on GDP growth and CO2 emission: A panel data analysis. Prog. Nucl. Energy 2014, 73, 172–178. [Google Scholar] [CrossRef]
  46. Wang, S.J.; Fang, C.L.; Wang, Y. Spatiotemporal variations of energy-related CO2 emissions in China and its influencing factors: An empirical analysis based on provincial panel data. Renew. Sustain. Energy Rev. 2016, 55, 505–515. [Google Scholar] [CrossRef]
  47. Al-mulali, U. Factors affecting CO2 emission in the Middle East: A panel data analysis. Energy 2012, 44, 564–569. [Google Scholar] [CrossRef]
  48. Holtz-eakin, D.; Newey, W.; Rosen, H. Estimating vector autoregressions with panel data. Econom. J. Econom. Soc. 1988, 56, 1371–1395. [Google Scholar] [CrossRef]
  49. Wang, Z.G. Panel Data Model and Its Application in the Economic Analysis; Economic Science Press: Beijing, China, 2008. [Google Scholar]
  50. Hoerl, A.E.; Kennard, R.W. Ridge regression: Biased estimation for nonorthogonal problems. Technometrics 1970, 12, 55–67. [Google Scholar] [CrossRef]
  51. Wang, P.; Cheng, W.S. Research on intensive utilization and driving factors of cultivated land in Jiuquan city based on ridge regression model. Territ. Nat. Resour. Study 2022, 4, 1–5. [Google Scholar]
  52. Zhao, S.W.; Liao, J.; Yu, D.L. Model averaging estimator in ridge regression and its large sample properties. Stat. Pap. 2020, 61, 1719–1739. [Google Scholar] [CrossRef]
  53. Wei, Y.; Liang, C.; Li, Y.; Zhang, X.H.; Wei, G.W. Can CBOE gold and silver implied volatility help to forecast gold futures volatility in China? Evidence based on HAR and Ridge regression models. Financ. Res. Lett. 2020, 35, 101287. [Google Scholar] [CrossRef]
  54. Park, S.-J.; Kim, D.C. Analysis on Determinant Factors of Local Government Expenditure with Panel Data Ridge Regression (in Korean). Econ. Anal. 2018, 24, 67–98. [Google Scholar]
  55. Zhao, S.N.; Liu, R.Q.; Shang, Z.F. Statistical inference on panel data models: A kernel ridge regression method. J. Bus. Econ. Stat. 2021, 39, 325–337. [Google Scholar] [CrossRef]
  56. Hoerl, A.E.; Kannard, R.W.; Baldwin, K.F. Ridge regression: Some simulations. Commun. Stat. Theory Methods 1975, 4, 105–123. [Google Scholar] [CrossRef]
  57. National Bureau of Statistics. China Statistical Yearbook-2021; China Statistical Publishing House: Beijing, China, 2021.
  58. Xiao, X.D. Study on Life Cycle Carbon Emission and Life Cycle Cost of Green Buildings. Master’s Thesis, Beijing Jiaotong University, Beijing, China, 2021. [Google Scholar]
  59. Ke, S.F.; Li, B.; Yang, Y.H.; Ma, C.G.; Jia, Y.S. The evaluation of carbon footprint from the operation of forest farm and carbon storage by forest resources-based on the Wangyedian forest farm in Chifeng of inner Mongolia. For. Econ. 2013, 35, 93–101. [Google Scholar]
  60. Wu, Y.; Wang, X.K.; Lu, F. The carbon footprint of food consumption in Beijing. Acta Ecol. Sin. 2012, 32, 1570–1577. [Google Scholar]
  61. Song, X.Y.; Dong, X.B. Effects of tending and thinning on undergrowth vegetation biomass and carbon density in natural coniferous and broad-leaved mixed forest. J. Northeast. For. Univ. 2020, 48, 32–35+41. [Google Scholar]
  62. Wu, J.H. Research on Emission Reduction Management of Forestry Enterprises Based on the Dual Perspective of Carbon Sink and Carbon Source; Beijing University of Chemical Technology: Beijing, China, 2020. [Google Scholar]
  63. Zhang, R.N.; Yang, J. Study on carbon emission and carbon footprint of land use in Shaanxi Province. Agric. Technol. 2020, 40, 126–130. [Google Scholar]
  64. Wang, Y.F.; Mao, B.N.; Liang, T.N.; Guo, L.S.; Du, S.P.; Liao, D.Q.; Chen, C.C.; Zhang, J.; Fan, Z.L.; Liu, G.Y. Analysis of household carbon emission change characteristics and influencing factors in post-epidemic period. Nat. Resour. Inf. 2022, 4, 51–59. [Google Scholar]
  65. Li, Z.; Li, G.P.; Hu, Z. Xi’an household carbon emission characteristics. Resour. Sci. 2017, 39, 1394–1405. [Google Scholar]
  66. Dai, L.D.; Zhou, R.; Zhang, F.E.; Wang, X.J. A study on the impact of urban land use on carbon emissions from residential commuting. Resour. Environ. Yangtze Basin 2016, 25, 68–77. [Google Scholar]
  67. Chen, W.X. A study on the influencing factors and measurement of college students’ personal carbon footprint. Mod. Bus. Trade Ind. 2011, 23, 220–221. [Google Scholar]
  68. Bai, Y.F.; Zhang, W.R.; Liu, J.P.; Yu, Y. Study on forecasting method of per capita carbon emissions in urban demonstration area based on environmental Kuznets curve. Ecol. Econ. 2022, 38, 35–42+84. [Google Scholar]
  69. Smith, T.M.; Cramer, W.P.; Dixon, R.K.; Leemans, R.; Neilson, R.P.; Solomon, A.M. The global terrestrial carbon cycle. Water Air Soil Pollut. 1993, 70, 19–37. [Google Scholar] [CrossRef]
  70. Guo, C.L.; Xu, W.L. Research on influencing factors of carbon dioxide emission in forest industry. For. Econ. 2020, 42, 3–14. [Google Scholar]
  71. Chang, F.C.; Ko, C.H.; Tsai, M.J. Afforestation and tending operations affecting the carbon footprint and renewable resources at an artificial forest in Taiwan. BioResources 2020, 15, 641–653. [Google Scholar] [CrossRef]
Figure 1. Location of the study area. Beiji Village, Lingfeng, Panzhong, Shuanghe, Chuona River, Nanweng River, Duobukur, and Huzhong National Nature Reserves were merged into Mohe, Amuer, Tahe, Shibazhan, Hanjiayuan, Songling, Jiagedaqi, and Huzhong Forestry Bureau, respectively.
Sustainability 15 08898 g001
Figure 2. System boundary and Scope division of forestry enterprises.
Sustainability 15 08898 g002
Figure 3. Quartile map of the carbon footprint of different forestry enterprises in 2017–2021 (unit: t CO2-eq).
Sustainability 15 08898 g003
Figure 4. Results of the carbon footprint intensity of different forestry enterprises in 2017–2021.
Sustainability 15 08898 g004
Figure 5. Thermodynamic diagram of Pearson correlation coefficients.
Sustainability 15 08898 g005
Figure 6. Ridge trace plot.
Sustainability 15 08898 g006
Figure 7. Standardized regression coefficients for the ridge regression model.
Sustainability 15 08898 g007
Table 1. The greenhouse gas emission factor data.
SymbolInterpretationValueUnit
RfThe carbon emission factor of gasoline2.26kg CO2-eq L−1
The carbon emission factor of diesel2.73kg CO2-eq L−1
α The average carbon content of woody biomass0.5kg C·kg−1
HThe electricity consumption per capita1.3kWh d−1
ReThe carbon emission factor of electricity in Northeast China0.6613kg CO2-eq kWh−1
NBurning efficiency of wood0.25kg CO2-eq kg−1
γ 0 The carbon absorption coefficient of forest land0.644t·hm−2
γ s The carbon emission coefficient of arable land0.422t·hm−2
The carbon emission coefficient of garden land0.210t·hm−2
The carbon absorption coefficient of grassland0.021t·hm−2
The carbon absorption coefficients of water facilities land0.218t·hm−2
The carbon absorption coefficient of other lands0.005t·hm−2
R t The carbon emission factor of natural gas43.21kg CO2 eq tank−1
The carbon emission factor of thermal energy12.1kg CO2 eq m−2
RkThe carbon emission factor for buses0.035kg CO2 eq km−1
The carbon emission factor for private cars0.135kg CO2 eq km−1
The carbon emission factor for motorcycles0.048kg CO2 eq km−1
The carbon emission factor for electric cars0.008kg CO2 eq km−1
RmThe carbon emission factor for planes0.135kg CO2 eq km−1
The carbon emission factor for trains0.0236kg CO2 eq km−1
δThe rate of solid waste generation per capita270kg year−1
r1The carbon emission factor of landfill2.1t CO2 eq t−1
r2The carbon emission factor of incineration0.56t CO2 eq t−1
Table 2. The results of carbon footprint, carbon footprint intensity, and carbon footprint by scopes in the Greater Khingan Forestry Group from 2017–2021.
YearCarbon Footprint in Scope 1
(kg CO2-eq)
Carbon Footprint in Scope 2
(kg CO2-eq)
Carbon Footprint in Scope 3 (kg CO2-eq)Total Carbon Footprint
(kg CO2-eq)
Forest Land Area
(hm2)
Carbon Footprint Intensity
(kg CO2-eq hm−2)
201736,288,25620,225,48619,308,93975,822,6816,884,90811.01
2018112,500,90920,189,84921,386,425154,077,1836,867,02722.44
201920,756,11220,286,16120,097,03861,139,3116,869,8288.90
202022,192,20120,386,63520,212,96062,791,7966,925,6119.07
202115,179,10620,330,63219,129,31954,639,0566,962,1537.85
Average41,383,31720,283,75320,026,93681,694,0066,901,90511.84
Table 3. Carbon footprint and contribution ratio of different processes in different scopes.
ScopeProcessCarbon Footprint
(kg CO2-eq)
Proportion
(%)
Scope 1Forest resource managementSeedlings cultivation78,4350.02
Afforestation24,352,7775.96
Forest tending47,623,00011.66
Forest disturbance and preventionForest fires116,540,08128.53
Pest disturbance14,688,5173.60
Disturbance prevention73,358,22517.96
Land use-cover change (LUCC)1,754,8260.43
Scope 2Electricity consumption74,323,20818.20
Thermal energy consumption27,095,5556.63
Scope 3Commuting8,710,0432.13
Business travel15,181,4173.72
Waste treatment (landfill and incineration)1,967,9110.48
Use of chemicals (fertilizer, herbicide, pesticides)2,474,8050.61
Labor service (patrol, afforestation, tending)71,800,50517.58
Total 408,470,028100.00
Table 4. Summary of test results.
Test TypeTest PurposeTest ValueTest Result
F testComparing FE Model and POOL ModelF (9,30) = 189.866, p = 0.000FE model
BP testComparing RE model and POOL modelχ2(1) = 24.513, p = 0.000RE model
Hausman testComparing FE model and RE modelχ2(9) = −29.466, p = 1.000RE model
Table 5. Regression results of the RE model.
ItemsCoefStd. ErrpVIF
Intercept6,605,605.5961,944,524.9290.002 ** (3.397)-
Total forest area−7.8093.1340.017 * (−2.491)4.030
Net change in forest area−233.0301413.5960.870 (−0.165)1.292
Area of afforestation−3326.909999.3880.002 ** (−3.329)5.934
Tending area of young forest stands180.47681.4830.033 * (2.215)1.588
Tending area of middle-aged forest stands−36.73169.8300.602 (−0.526)5.314
Fire area36,686.683851.8380.000 ** (43.068)1.396
Pest and rodent disturbance area584.362144.1880.000 ** (4.053)5.953
Fuel consumption of mechanical equipment6.1852.4000.014 * (2.577)3.229
Vehicle usage intensity15.0902.6310.000 ** (5.736)8.574
Quantities of chemicals used−216.15654.3490.000 ** (−3.977)6.038
Number of hired labor4388.223645.5660.000 ** (6.797)1.872
Investment in fire prevention0.2842.9370.924 (0.097)1.415
** and * represent the significance level of 5% and 10%, respectively, and the t value is in the brackets.
Disclaimer/Publisher’s Note: The statements, opinions and data contained in all publications are solely those of the individual author(s) and contributor(s) and not of MDPI and/or the editor(s). MDPI and/or the editor(s) disclaim responsibility for any injury to people or property resulting from any ideas, methods, instructions or products referred to in the content.

