Article

Construction of Nature Reserves’ Ecological Security Pattern Based on Landscape Ecological Risk Assessment: A Case Study of Garze Tibetan Autonomous Prefecture, China

1
College of Earth Sciences, Chengdu University of Technology, Chengdu 610059, China
2
College of Tourism and Urban-Rural Planning, Chengdu University of Technology, Chengdu 610059, China
3
Research Center for Human Geography of Tibetan Plateau and Its Eastern Slope, Chengdu 610059, China
*
Author to whom correspondence should be addressed.
Sustainability 2023, 15(11), 8707; https://doi.org/10.3390/su15118707
Submission received: 18 April 2023 / Revised: 25 May 2023 / Accepted: 25 May 2023 / Published: 28 May 2023
(This article belongs to the Special Issue Urban Landscape Ecology and Sustainability)

Abstract

:
Human activities are constantly affecting ecological space, and the construction of ecological security patterns to ensure ecological security has become an issue that must be considered for sustainable development. At present, little attention has been paid to the ecological security of cities with a high number of nature reserves. In this study, we took Garze Tibetan Autonomous Prefecture in China, which has many nature reserves, as the research object to construct an ecological security pattern with nature reserves as ecological sources. Firstly, Fragstats 4.2 and ArcGIS 10.4 were used to obtain the ecological risk evaluation results of the study area landscape. Secondly, a “nature–society–landscape” resistance factor system and an ecological resistance surface were constructed using a minimum resistance model. Finally, the ecological safety zone of the nature reserve was divided, and the ecological safety pattern of the nature reserve was established. (1) The ecological risk of the study area shows a spatial distribution pattern of “low in the northwest and high in the southeast”, with low and moderate-low ecological risk dominating; (2) The study area has formed an ecological security pattern consisting of 9 ecological sources, 35 ecological nodes, 8 ecological corridors with a total length of 702.96 km and 4 ecological safety zones; (3) The ecological security pattern of nature reserves in the study area was divided into four categories: low, medium, high and moderate-high ecological safety zones, accounting for 20.62%, 27.34%, 24.48% and 27.55%, respectively. This study provides a new framework for the construction of urban ecological safety patterns and offers scientific guidance for the conservation and management of nature reserves and urban ecology.

1. Introduction

In recent years, rapid urbanization has become one of the main characteristics of human social development, directly impacting regional landscape patterns and ecological sustainability [1,2,3,4]. With the continuous expansion of human society and the enormous pressure of natural ecosystem protection, the coordination between ecological protection and urbanization has become more urgent [5,6]. As socio-economic and ecological concerns continue to rise, the focus of research in regional landscape ecology has gradually shifted towards ecological security [7,8]. Currently, the management of individual ecosystems no longer meets the needs of regional spatial governance, and integrated multi-regional ecosystem management has become the mainstream of research [9]. The construction of ecological safety models (ESPs) can provide scientific guidance for regional territorial spatial governance, thereby reducing the fragmentation of ecologically important land and habitats caused by sprawl in urbanized areas [10]. The construction of ESPs can maintain ecosystem structures and processes for effective environmental control and sustainable protection of mountains, rivers, forests, farmlands, lakes and grasslands [11].
Research on ESPs originated from landscape ecological planning methods, and these studies mainly focused on the construction of a theoretical framework, a selection of ecological safety composition methods and the improvement of the evaluation index system [12]. At present, the traditional method for constructing ESPs can be divided into three steps: determining ecological sources, constructing an ecological resistance surface, and determining ecological corridors [13]. Ecological sources are the source points for species dispersal, with high ecosystem services, habitat quality and continuity of mapping. Most early studies used natural landscapes, nature reserves and large-scale habitat patches to represent ecological sources [14,15]. Some other studies constructed evaluation systems from the perspectives of ecosystem services [16], ecological adaptability [17], and ecological red lines [18], and used other relevant evaluation methods to identify ecological sources [19]. The ecological resistance surface reflects the resistance to ecological processes such as material exchange, energy transfer and species migration between ecological sources, and it is central to the construction of ecological corridors [20]. Most of the existing studies on resistance surface construction are based on resistance coefficients that are related to ecological factors such as land use type, slope and elevation and are then assigned according to expert experience [21]. However, this method is highly subjective and does not consider the influence of human activities on ecological resistance coefficients; therefore, the revision of the basic ecological resistance surface has become an important trend in ecological resistance surface construction over recent years [22]. Another related concept is the ecological corridor, which serves as a bridge for communication between various ecological sources and is a necessary channel for species migration and the energy exchange in ecological resources. It is one of the basic models for the construction of ESPs [23]. The minimum cumulative resistance model [24] and circuit theory [25] are the main methods for identifying ecological corridors. Among these methods, the minimum cumulative resistance (MCR) model integrates the horizontal connection between landscape units [26] to reflect the internal organic connection of ESPs and the internal connection of ecological processes, which is practical and scalable [27].
Ecological risk is the potential for an entity or action to have a negative ecological effect on an ecosystem or its components [28]. Landscape ecological risk assessment can reflect the negative impacts of the interaction of landscape patterns and ecological processes under the influence of natural or anthropogenic factors. It is a tool that can effectively support ecological network construction and ecologically sustainable management and occupies an important position in the field of ecological risk assessment [29,30]. Landscape ecological risk assessment can assess the ecological condition of a region from a landscape pattern and ecological perspective, providing a reliable scientific basis for ecological conservation decisions and the further development of the region [31,32]. Among them, the landscape index is a simple quantitative index that responds to the composition, structure, and spatial configuration of the landscape, enabling multi-scale and multi-spatial comparisons [33,34]. In this paper, the landscape index method was combined with indicators characterizing ecological conditions to calculate the ecological risk of the landscape within Garze Tibetan Autonomous Prefecture (GTAP) to better describe the risk situation under multi-source pressure.
GTAP has numerous nature reserves with spectacular natural landscapes, including snow-capped mountains, glaciers, gorges, grasslands, and forests [35]. It is also one of China’s most important habitat areas, with a large number of lakes, rivers and wetland ecosystems. In addition, this region is one of the largest Tibetan settlements in southwest China and is one of the birthplaces of Chinese culture [36]. However, with the impact of climate change and extreme weather, as well as regional changes such as land use changes caused by human activities, it is inevitable that these will impact the ecosystems of nature reserves, increasing their ecological risks. Therefore, studying the ecological risk of the landscape and constructing an ecological safety pattern in the region requires an assessment of the relationship between nature reserves in the region and the construction of a regional ecological safety pattern, which is an important basis for conducting regional ecological conservation studies.
Nature reserves are important types of protected areas that protect the integrity of ecosystems, biodiversity, and landscape diversity in a certain area and are an inevitable choice for modernizing the governance system and capacity in the field of natural ecological protection [37]. There are many nature reserves in GTAP [38]. Therefore, to study the ecological risk of this landscape and construct an ecological security pattern in the region, it was necessary to assess the relationship between the nature reserves in the region and the construction of a regional ecological security pattern, which is an important basis when conducting regional ecological conservation research [39,40]. Nature reserves, with their rich species resources and complex and diverse biological structures, are often used as ecological sources to build regional ESPs and achieve remarkable results [41,42,43]. Therefore, this study selected the nature reserve as the ecological source and constructed a regional ecological security pattern that was in line with the actual situation of the study area, scientific and reasonable.
The objectives of our research were: (i) to evaluate and analyze the landscape ecological risk level of GTAP in China; (ii) to construct an ecological security pattern for nature reserves and (iii) to summarize the impact of constructing an ecological security pattern for nature reserves on regional sustainable development.

2. Materials and Methods

2.1. Study Area

The GTAP (27°58″–34°20″ N, 97°22″–102°29″ E) is located in the western part of Sichuan Province, with a total area of 153,000 square kilometers, accounting for 31.76% of the total area of the province (Figure 1) [44]. The topography of Garze Prefecture slopes from northwest to southeast, and the landforms are mainly divided into a mounded plateau area, an alpine plateau area and an alpine valley area. The climate is subtropical, but due to the strong uplift of the terrain, the climate gradually changes to a continental plateau mountain-type monsoon climate in most areas, with complex and diverse climatic conditions and significant regional differences. Winters are long while summers are short; the frost-free period is short; the average annual temperature is below 10 °C in most areas; the precipitation is 347~922 mm, and sunshine hours are 1700~2600 h [45]. According to the statistics for 2020, the total GDP was 41.061 billion yuan, accounting for 0.84% of the province’s total GDP, while its population was 1.1074 million, accounting for approximately 1.3% of the province’s total population [46]. The special geographical location and climatic conditions of this area make the state rich in biological resources and profound grassland cultural heritage and also situate Garze as a key link in the balance of waters and ecological protection of the Yangtze River basin, an important ecological security barrier and key ecological function area [47].

2.2. Materials

Based on relevant literature [35,36] and field research, this paper builds a bridge between nature, society, and landscape. Therefore, the data used in this paper included the 2020 land use data, normalized difference vegetation index (NDVI), elevation, slope, roads, settlements, nature reserves and 2020 socio-economic data. Among them, the 2020 land use data and normalized difference vegetation index (NDVI) were obtained from the Resource and Environment Science and Data Center of the Chinese Academy of Sciences (https://www.resdc.cn/, accessed on 5 December 2022); the elevation and slope data were based on the Geospatial Data Cloud of the Chinese Academy of Sciences (https://www.gscloud.cn/, accessed on 5 December 2022) and processed using ArcGIS with a resolution of 30 m. The data on roads and settlements were obtained from the National Catalogue Service for Geographic Information (https://www.webmap.cn/, accessed on 5 December 2022); the data on nature reserves were obtained from the China Nature Reserve Biological Specimen Resource Sharing Platform (https://www.bhq.papc.cn/, accessed on 5 December 2022); socio-economic data for 2020 were obtained from the GTAP Statistical Yearbook 2020 (http://www.gzz.gov.cn/, accessed on 5 December 2022). All data were converted to a unified projection coordinate system (WGS_1984_UTM_Zone_47N).
In this paper, nine nature reserves of different types and levels were selected as ecological source sites according to the current situation [35] and relevant literature [48,49] of the study area (Table 1), with a total area of 22,832.88 km2, accounting for 14.89% of the study area.

2.3. Methods

2.3.1. Integrated Framework

This paper establishes an ecological resistance surface based on the results of the landscape ecological risk assessment, identifies ecological corridors and ecological nodes and constructs an ecological safety pattern. Therefore, the framework of this study was divided into three parts (Figure 2). Firstly, land use data were imported into Fragstats 4.2 to obtain the number and area of each landscape patch as well as the landscape index. Through ArcGIS 10.4 software, the results of the landscape index were calculated to obtain the spatial distribution of ecological risk in the study area of the landscape. Secondly, selected ecological sources and resistance factor systems were subjected to ArcGIS software, and the MCR model was used to obtain the spatial distribution of minimum resistance values. The ecological corridors were constructed with the help of path cost and hydrological tools. Finally, according to these results, the ESPs of the study area were established, and the spatial distribution of ecological safety zones was obtained.

2.3.2. Landscape Ecological Risk Assessment

The landscape pattern is spatially and regionally heterogeneous [21]. Therefore, this paper divided the study area into grid cells of the same scale using ArcGIS 10.4’s crate fishing net tool. After several trials and comparisons (Figure 3), and with reference to the relevant literature, a 5 km × 5 km ecological risk map grid was used to integrate the land type data, for a total of 4270 grids. The ecological risk index was calculated for each type of landscape in each site, which generated the ecological risk value for the central point of the sample site [50].
In this study, the landscape disturbance index, landscape vulnerability index and landscape loss index were selected to establish a landscape ecological risk evaluation model, and the landscape index of the study area was calculated based on Fragstats 4.2 software to analyze the spatial distribution of the landscape’s ecological risk in the study area [51].
The landscape disturbance index (Ei) reflected the degree of external disturbance in the ecosystems represented by different landscapes in the study area [52]. This is calculated from the landscape fragmentation index (Ci), landscape splitting index (Ni) and landscape dominance index (Di). The calculation formula was as follows:
E i = a C i + b N i + c D i
where Ci is the landscape fragmentation index, Ni denotes the landscape splitting index, and Di denotes the landscape dominance index. Landscape fragmentation had a significant impact on the ecosystem and limited the function of the ecosystem. Ci is the degree of landscape fragmentation and can reflect the influence of external factors on the landscape; the higher its value, the more disturbed the landscape is [53]. Ni reflects the degree of separation of different patches in the landscape and is an important indicator when describing the structure of the landscape; the higher its value, the more dispersed and complex the distribution of the landscape [54]. Di measures the importance of patches in the landscape; the higher their value, the greater influence the patches have on landscape pattern formation and change [55]. a, b and c are weights, and a + b + c = 1. Their weight values were determined by referring to the existing literature [56,57,58], and a, b and c were assigned values of 0.5, 0.3 and 0.2, respectively. Ci, Ni and Di were calculated according to Equations (2)–(7).
C i = n i A i
where Ai is the total area of landscape type i, and ni is the number of patches for the landscape type i.
N i = 1 2 × n i A × A A i
where A is the total area of all the landscapes.
D i = ( Q i + M i ) 4 + L i 2
Q i = G i G  
where Gi is the number of grids in the patch where i occurs, and G is the total number of grids.
M i = P i P
where Pi is the number of patches i, and P is the total number of patches.
L i = S i S
where Si is the area of patch i, and S is the total area of the grids.
The landscape fragility index (Fi) was obtained by an expert scoring method. The vulnerability number reflects the sensitivity of different landscape ecosystems to external disturbances; the higher the Fi value, the more unstable the ecosystem and the more vulnerable it is to damage. Combining the characteristics of the study area, six types of landscapes were assigned values: unused land had a value of 6, water bodies were a value of 5, arable land was a value of 4, grassland was a value of 3, woodland was a value of 2 and built-up land was value 1 [59,60].
The landscape loss index (Ri) reflected the degree of loss in natural attributes when different landscape types were disturbed by the outside world, and the larger the value, the greater the degree of loss [61,62]. The calculation formula is outlined as follows:
R i = E i × F i
The ecological risk index was based on the index of each landscape and the area of each landscape; the index and area were used to reflect the degree of risk for the ecosystems represented by different landscapes [63]. The calculation formula is as follows:
E R I k = i = 1 n A k i A k × R i
where ERIk is the landscape ecological risk index of the k risk plot, Aki is the area of the i types of the landscape in the k risk plot, Ak is the total area of the k risk plot, and Ri is the ecological loss index of the i type of the landscape.

2.3.3. Construction of Ecological Security Pattern

This study constructed the resistance factor system of a “nature–society–landscape” [64]. The different resistance factors were divided into five levels; levels 1–5 represented low, moderate-low, medium, moderate-high and high resistance, respectively (Table 2). The quantitative spatial expressions of each indicator were processed in ArcGIS 10.4 by the reclassification tool.
Indicators of social factors include distance to settlements and distance to roads. As a place for human settlement, settlement is often accompanied by human daily life and construction [65]. Roads are the main means of transport for humans and their daily access [66]. Settlements and roads inevitably have an impact on the natural environment. Distance, therefore, reflects the extent to which human activities disturb the ecosystem, with a closer distance to settlements and roads corresponding with higher levels of ecological risk and resistance values.
The landscape factor indicators include the landscape ecological risk index and the NDVI. The landscape ecological risk index indicates the ecological risk value of the area; the higher the index, the higher the ecological risk and resistance level [67]. The NDVI indicates the vegetation cover of the area; a higher value indicates a more stable landscape ecosystem, while the lower the ecological risk, the lower the resistance level [68].
Natural factors include elevation and slope. They reflect the potential impact of topographic factors on hazards such as erosion and disaster risk, with higher values implying a greater ecological risk to the landscape. The weight value reflects the degree of influence on the resistance factor of the evaluation object. There are many methods to determine the weights, including those commonly used, including the expert scoring method, principal component analysis, analytic hierarchy process (AHP), fuzzy cluster analysis and so on [69]. In determining index weights, the AHP method was more reasonable and hierarchical than other methods. This method requires fewer data and calculations and is easy to understand, so AHP was chosen to determine the index weights in this paper. In this study, an expert questionnaire was used to ask six experts to compare the scores of the indicators in the evaluation system using a scale of 1 to 9. Through the consistency test, the consistency ratio was 0.017, less than 0.10, which indicates that the judgment matrix had reasonable consistency [70]. The weights of different resistance factors are shown in Table 2.

2.3.4. Construction of Ecological Corridors

As a bridge between various ecological sources, ecological corridors are necessary channels for species migration and the energy exchange in ecological resources and are one of the basic models for the construction of ESPs [71]. The resistance surface reflects the resistance to ecological processes taking place between ecological sources [72,73]. The minimum cumulative resistance model (MCR) can be used to simulate and calculate the minimum resistance that species need to overcome to move between source points in order to construct ecological corridors for biological flows [74]. The calculation formula for this is as follows:
M C R = f m i n j = n i = m D i j × R i
where MCR denotes the minimum cumulative resistance value, and fmin indicates a positive correlation with MCR in ecological processes; Dij is the distance from source j to target source i; Ri indicates the resistance value of target source i to species migration.

3. Results

3.1. Landscape Ecological Risk Assessment

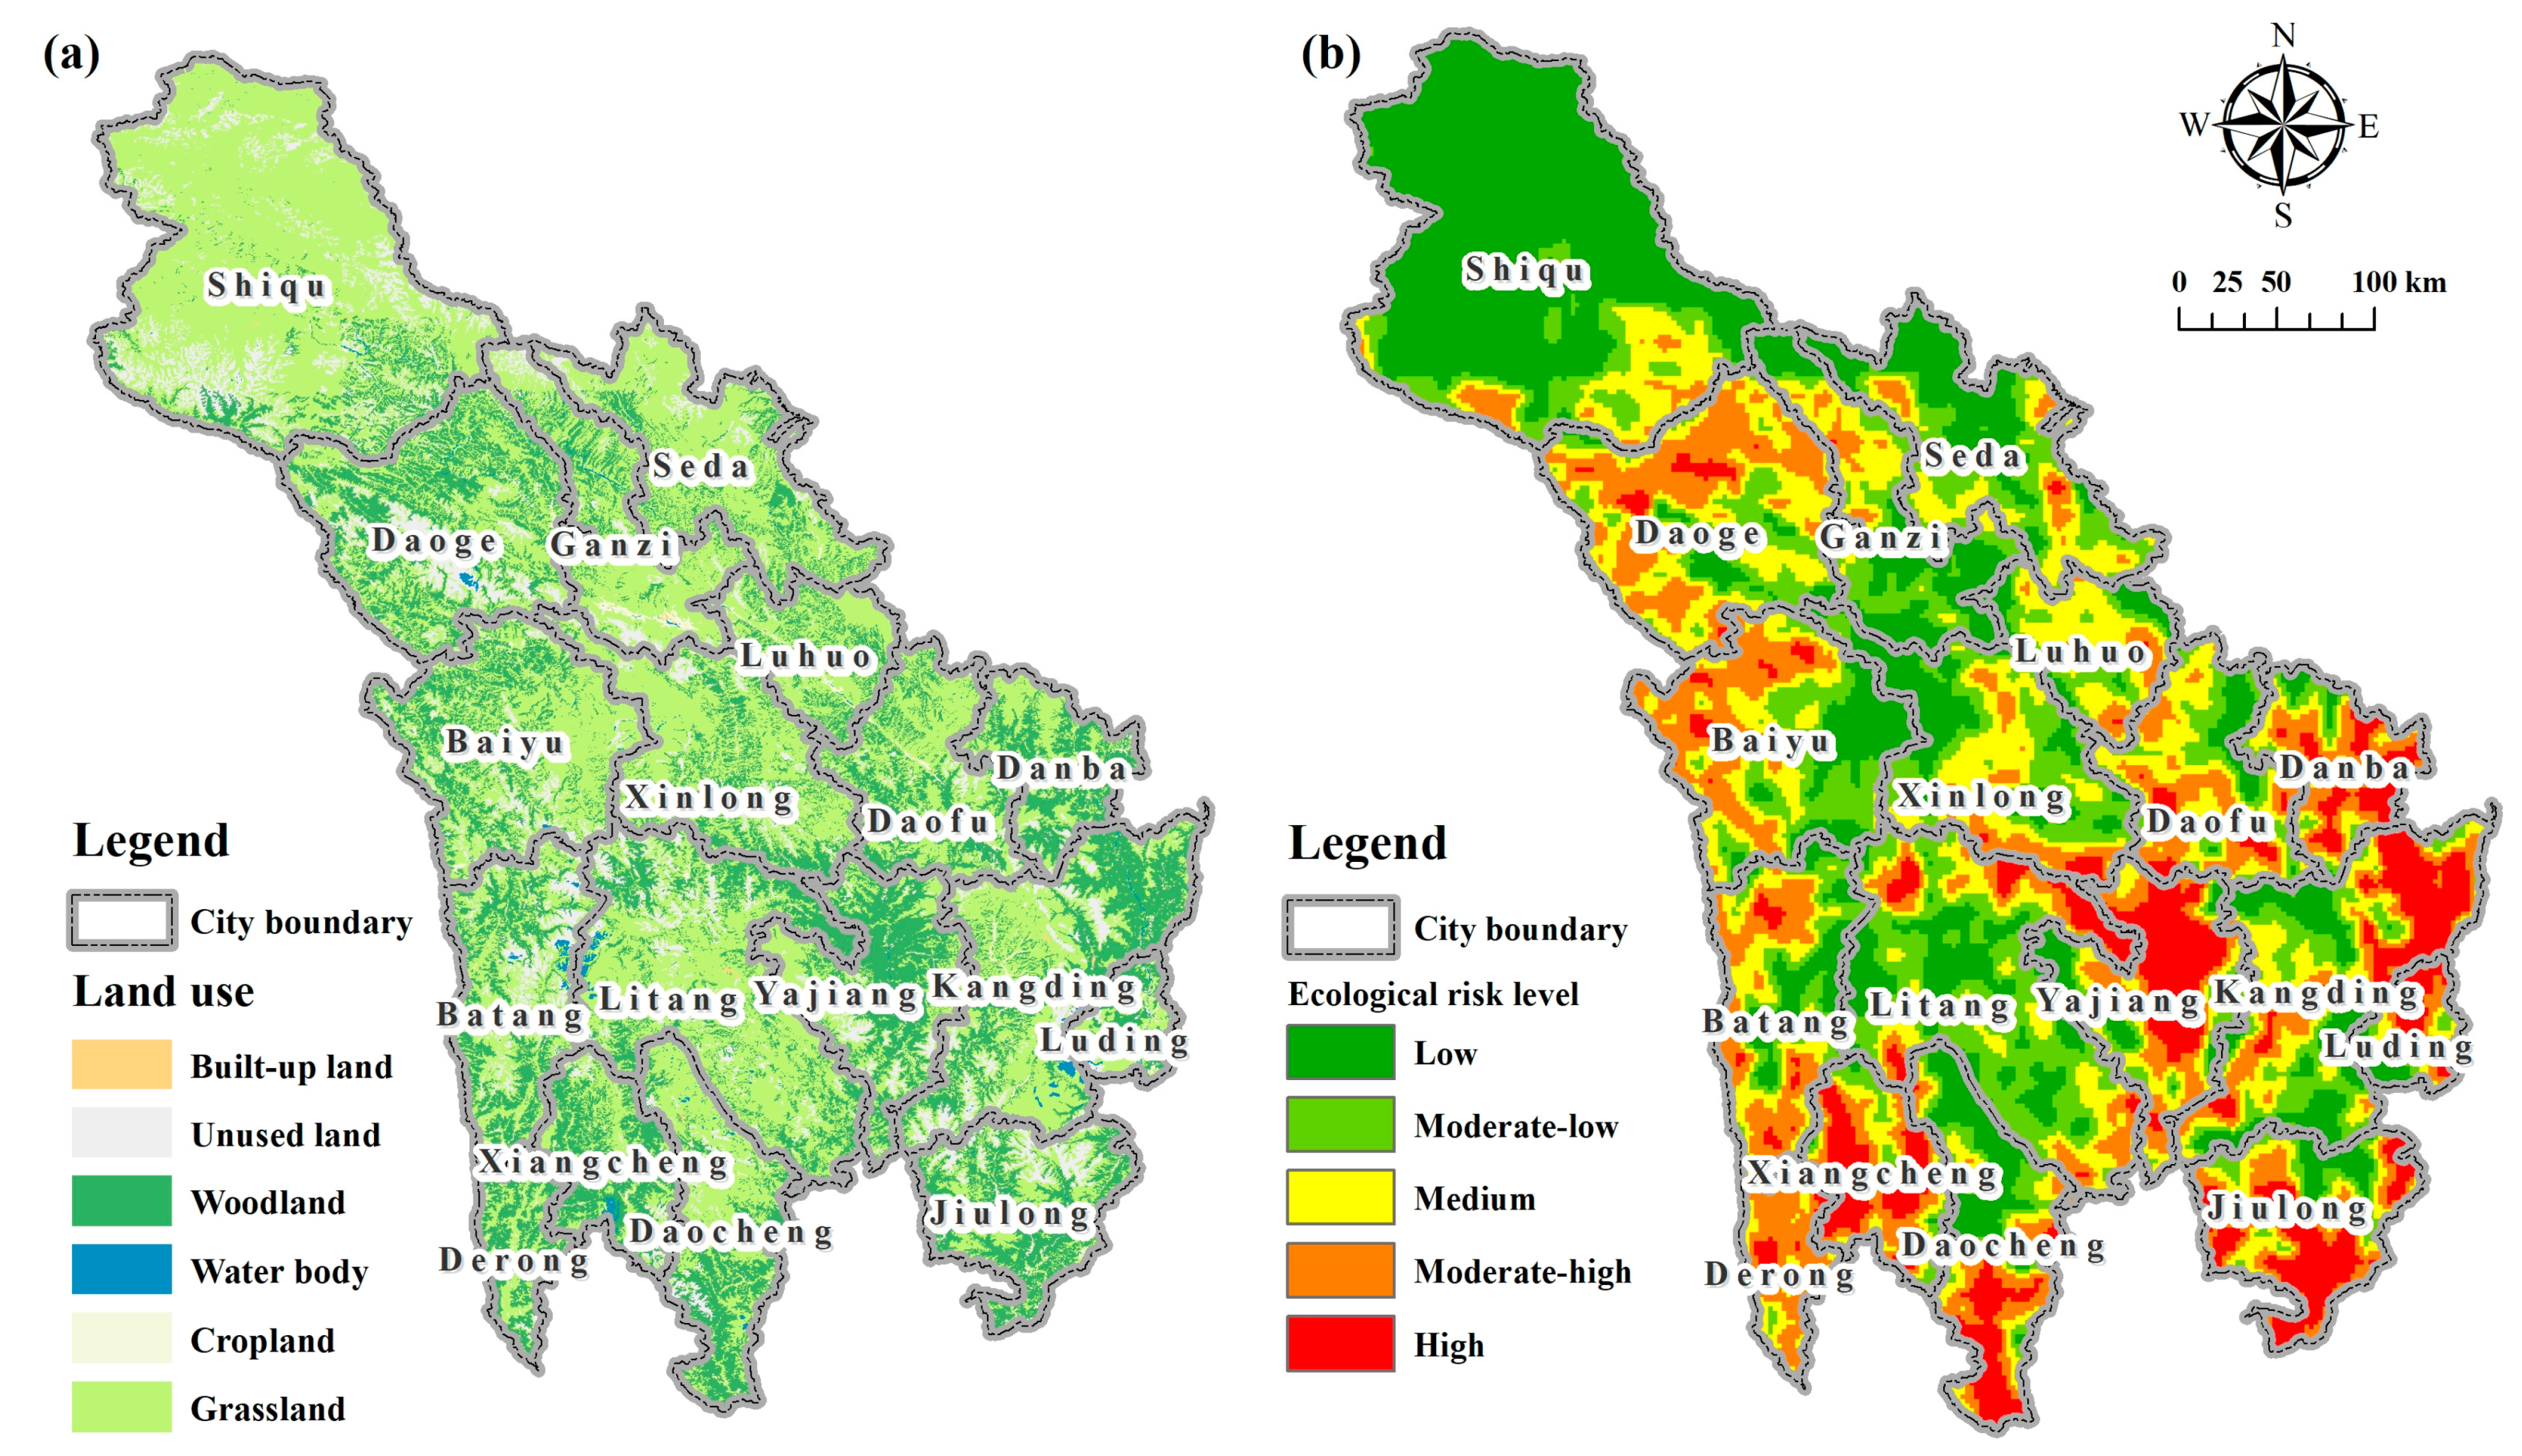
Based on the land use data of the study area, the landscape pattern indices of each landscape type in the study area were obtained with the help of Fragstats 4.2 software (Table 3). The results of the landscape ecological risk study in the study area were obtained using ArcGIS and are shown in Figure 3.
From Figure 4, the ecological risk in Garze Prefecture shows a spatial distribution pattern of “low in the northwest and high in the southeast”, with obvious spatial differences. Among them (Table 4), the low ecological risk area covered 42,108.95 km2, accounting for 27.45% of the total area, mainly in the northwestern part of Garze Prefecture, which has a large area of grassland and high vegetation coverage. The moderate-low ecological risk area covered 34,391.56 km2, accounting for 22.42%, mainly in the central part of Garze Prefecture, which has a large number of nature reserves and shows a distribution trend of spreading around with each nature reserve as the center. The medium ecological risk area covered 33,863.99 km2, accounting for 22.08%, which was mainly distributed in Daoge County and Luhuo County of Garze Prefecture. The moderate-high ecological risk area covered 28,179.74 km2, accounting for 18.37%, mainly distributed in the area where the western part of Garze Prefecture meets Tibet. Additionally, the high ecological risk area covered 14,847.16 km2, accounting for 9.68%. This was mainly distributed in Luding County, Yajiang County, Jiulong County and Daocheng County in the southeastern part of GTAP.

3.2. The Construction of Ecological Security Pattern for Garze Prefecture

3.2.1. Establishment of Ecological Resistance Surfaces

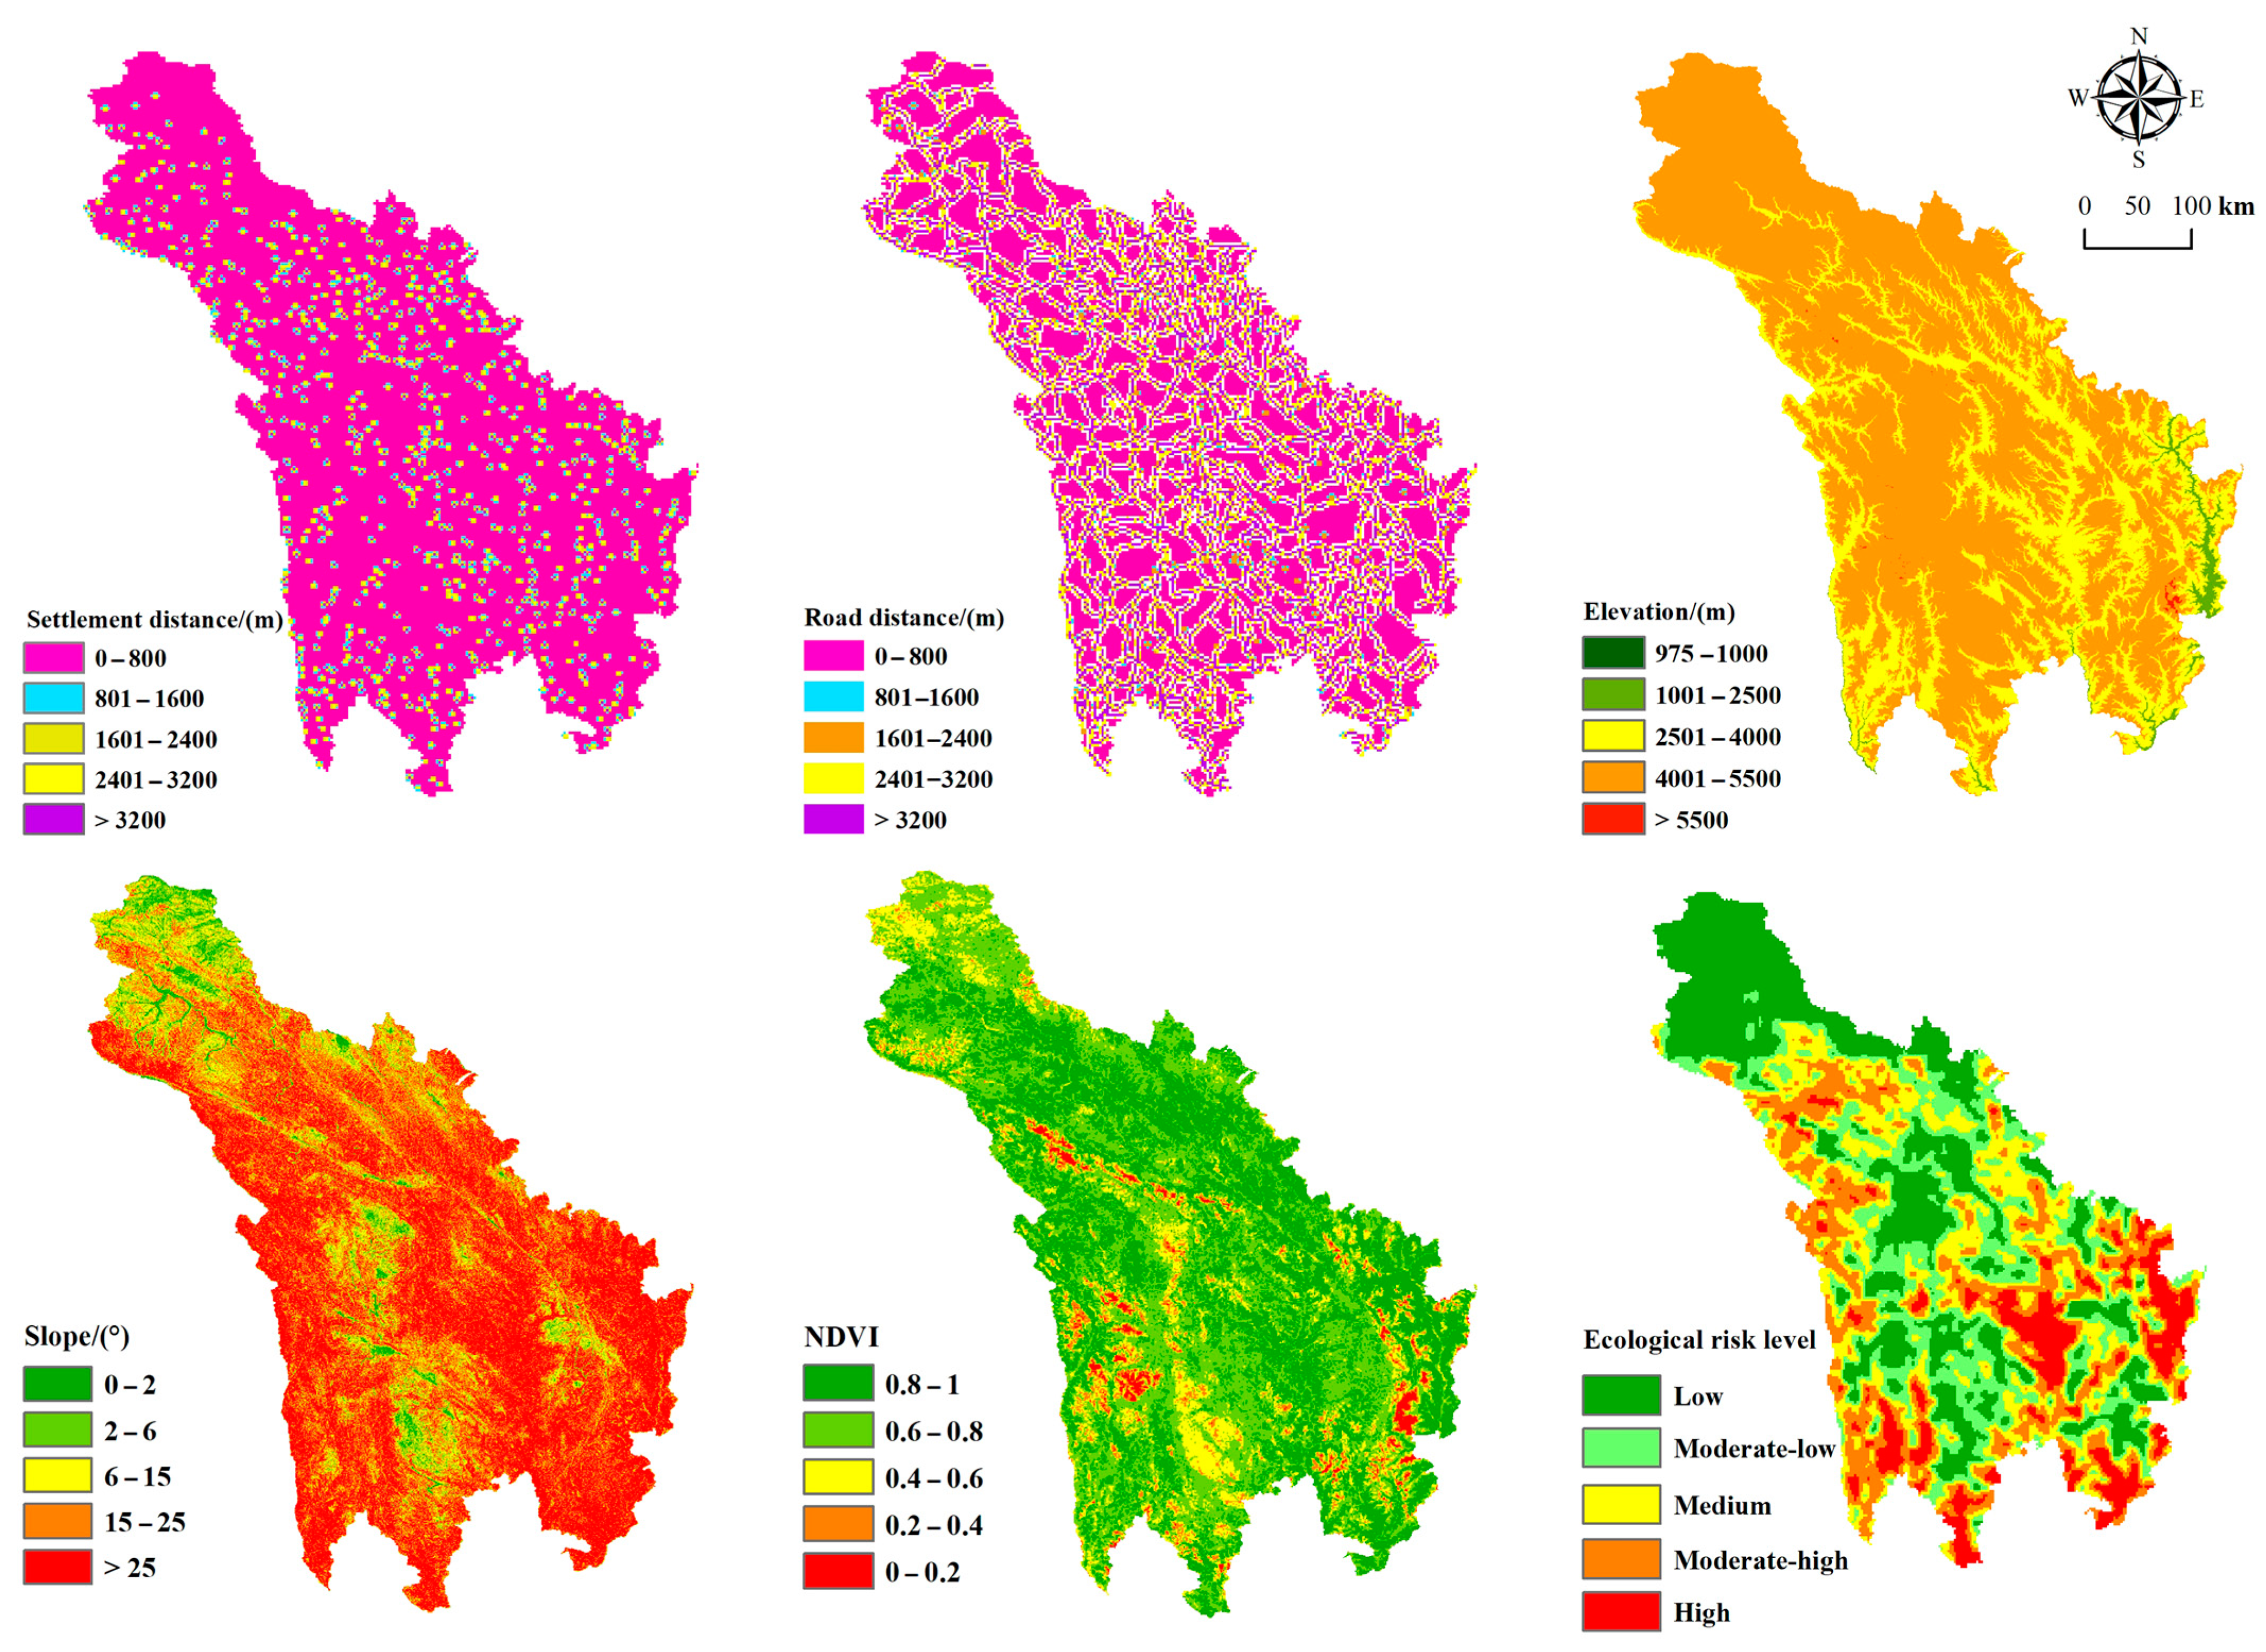
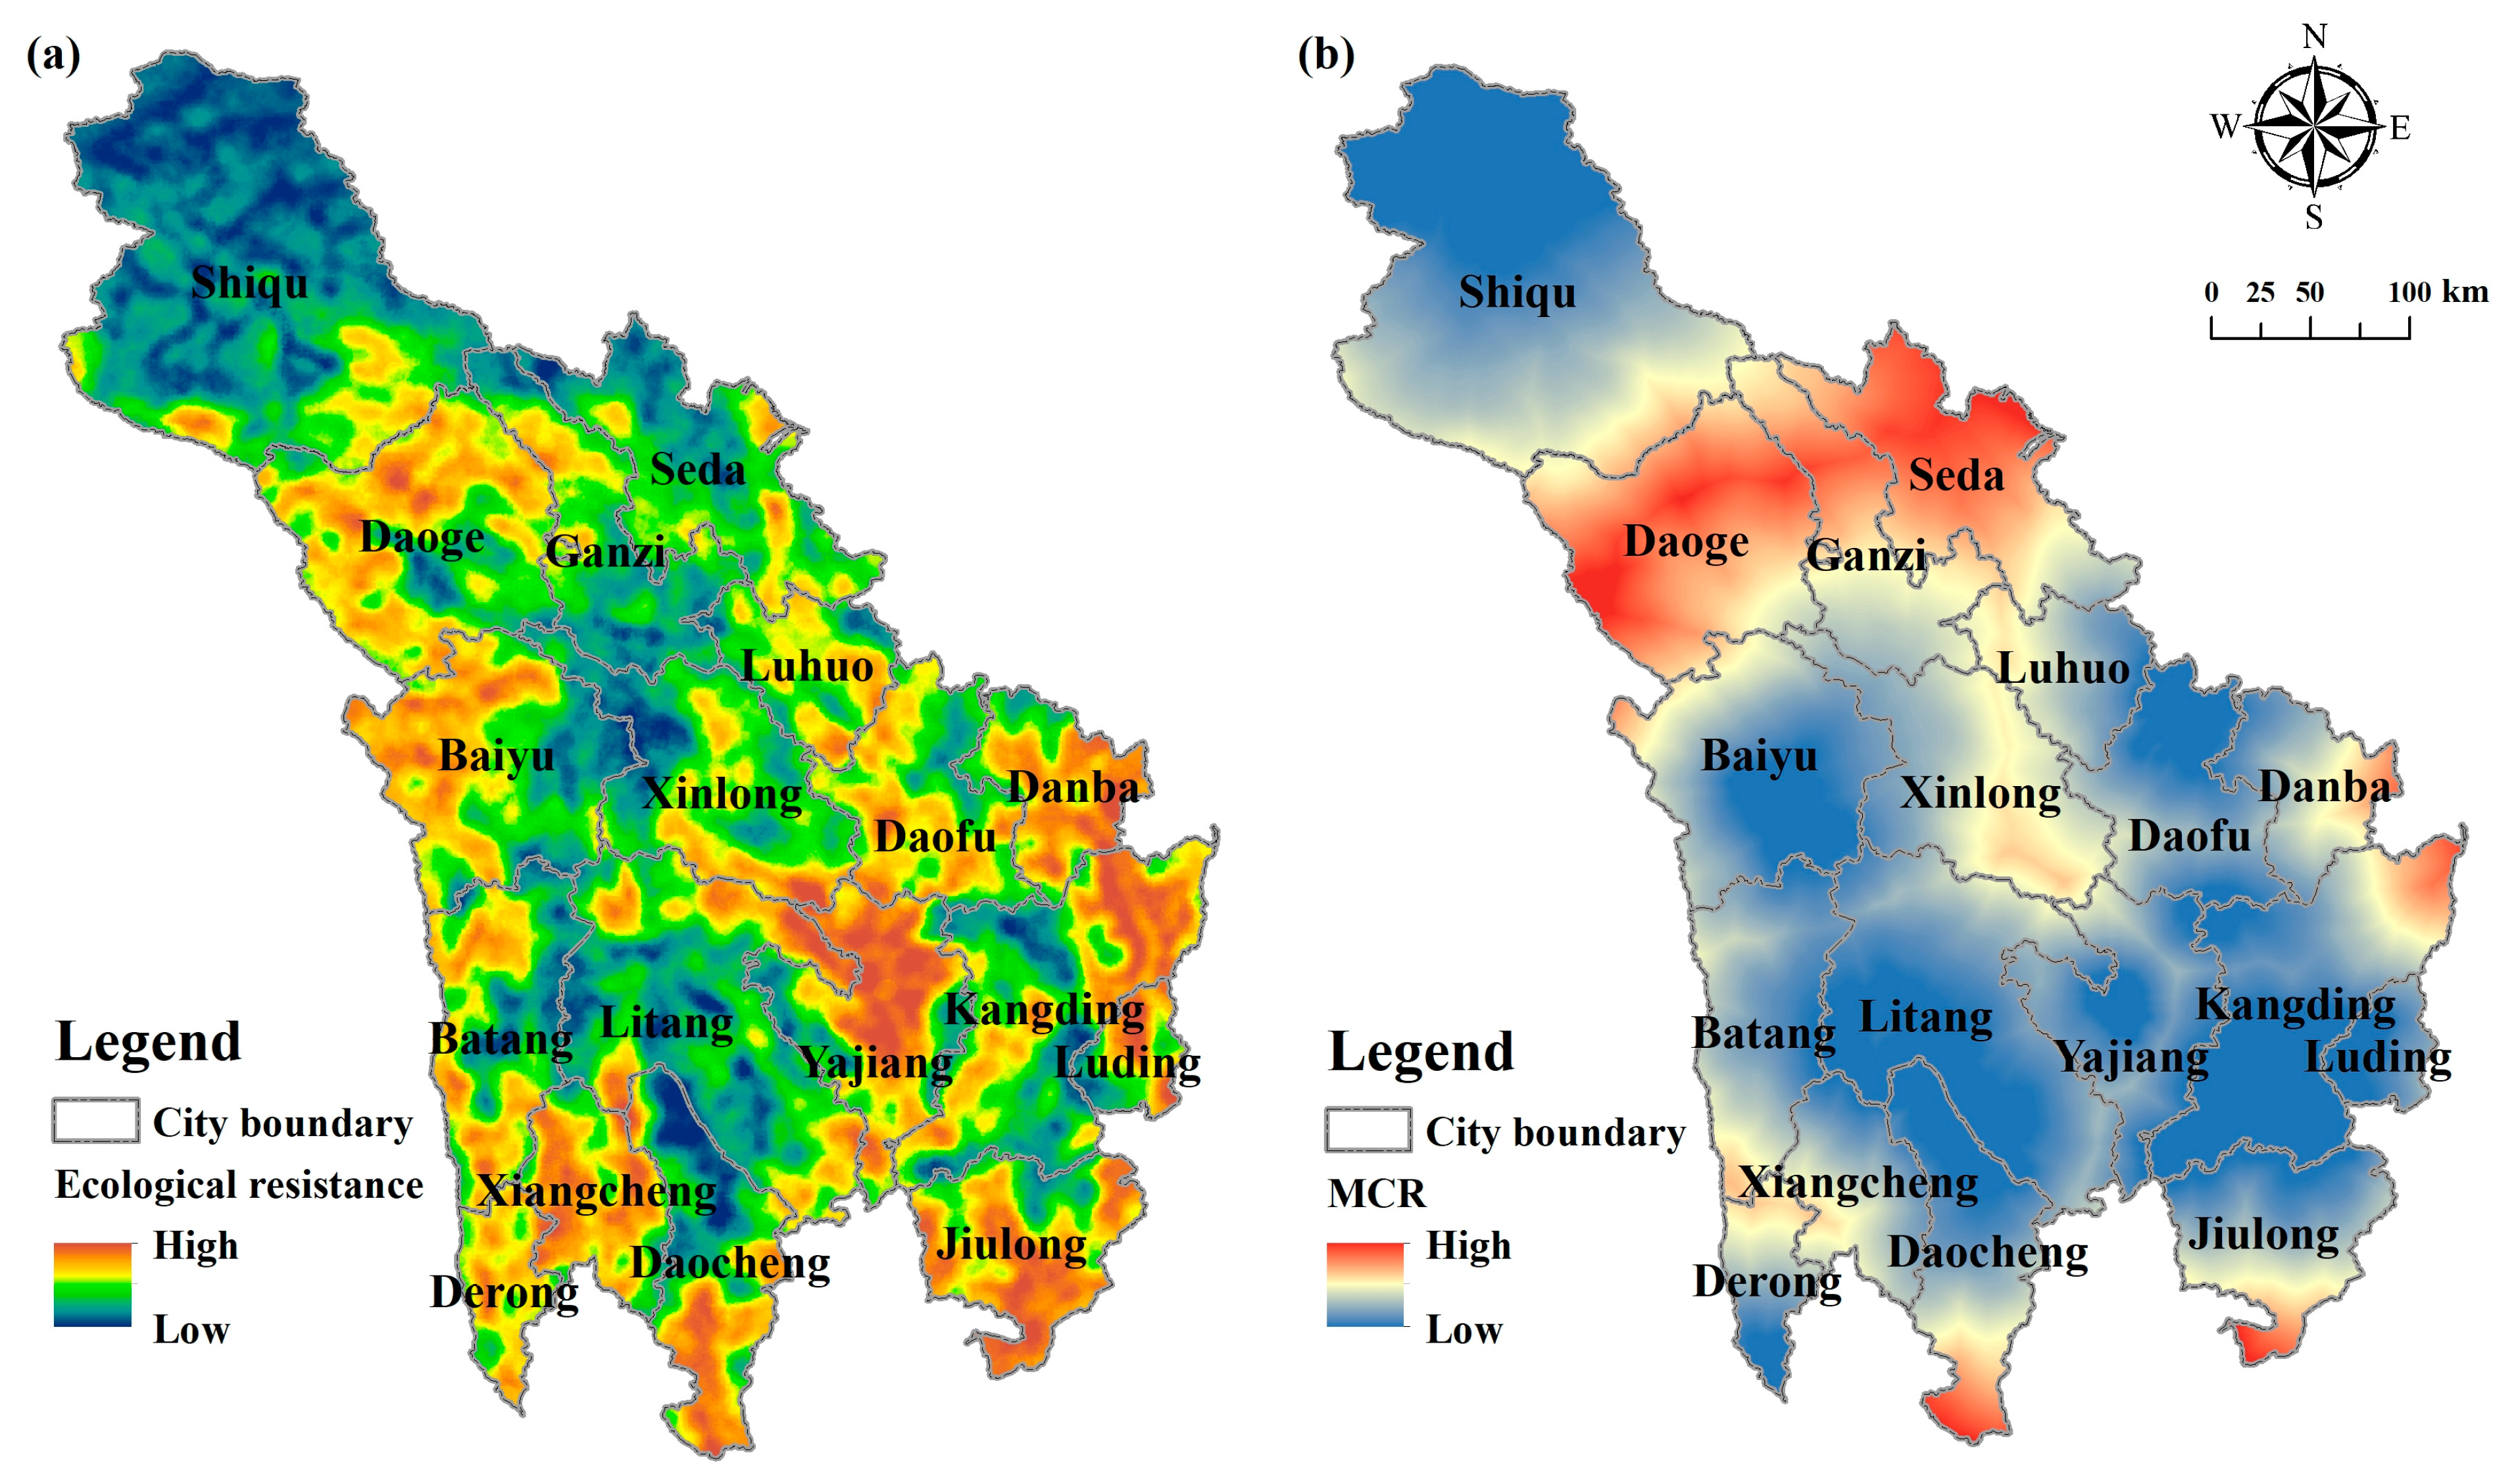
In this study, the ecological resistance surface was constructed based on the results of landscape ecological risk evaluation and the results of the resistance factor grading (Figure 5), which were obtained by overlay analysis using the raster calculator in the ArcGIS 10.4 spatial analysis tool (Figure 6a).
From Figure 6b, it is clear that the northern and central areas of the study area had low resistance values, and the diffusion of ecological flow was relatively smooth. As these areas are mainly located within the scope of the nature reserve, the topography is complex and variable, and human interference factors are lower. The areas with high resistance values were distributed in a block pattern in the south and southeast of the study area, where human construction activities were more frequent and urban construction sites were more concentrated, which affected the diffusion of ecological flows.

3.2.2. Ecological Corridors Construction

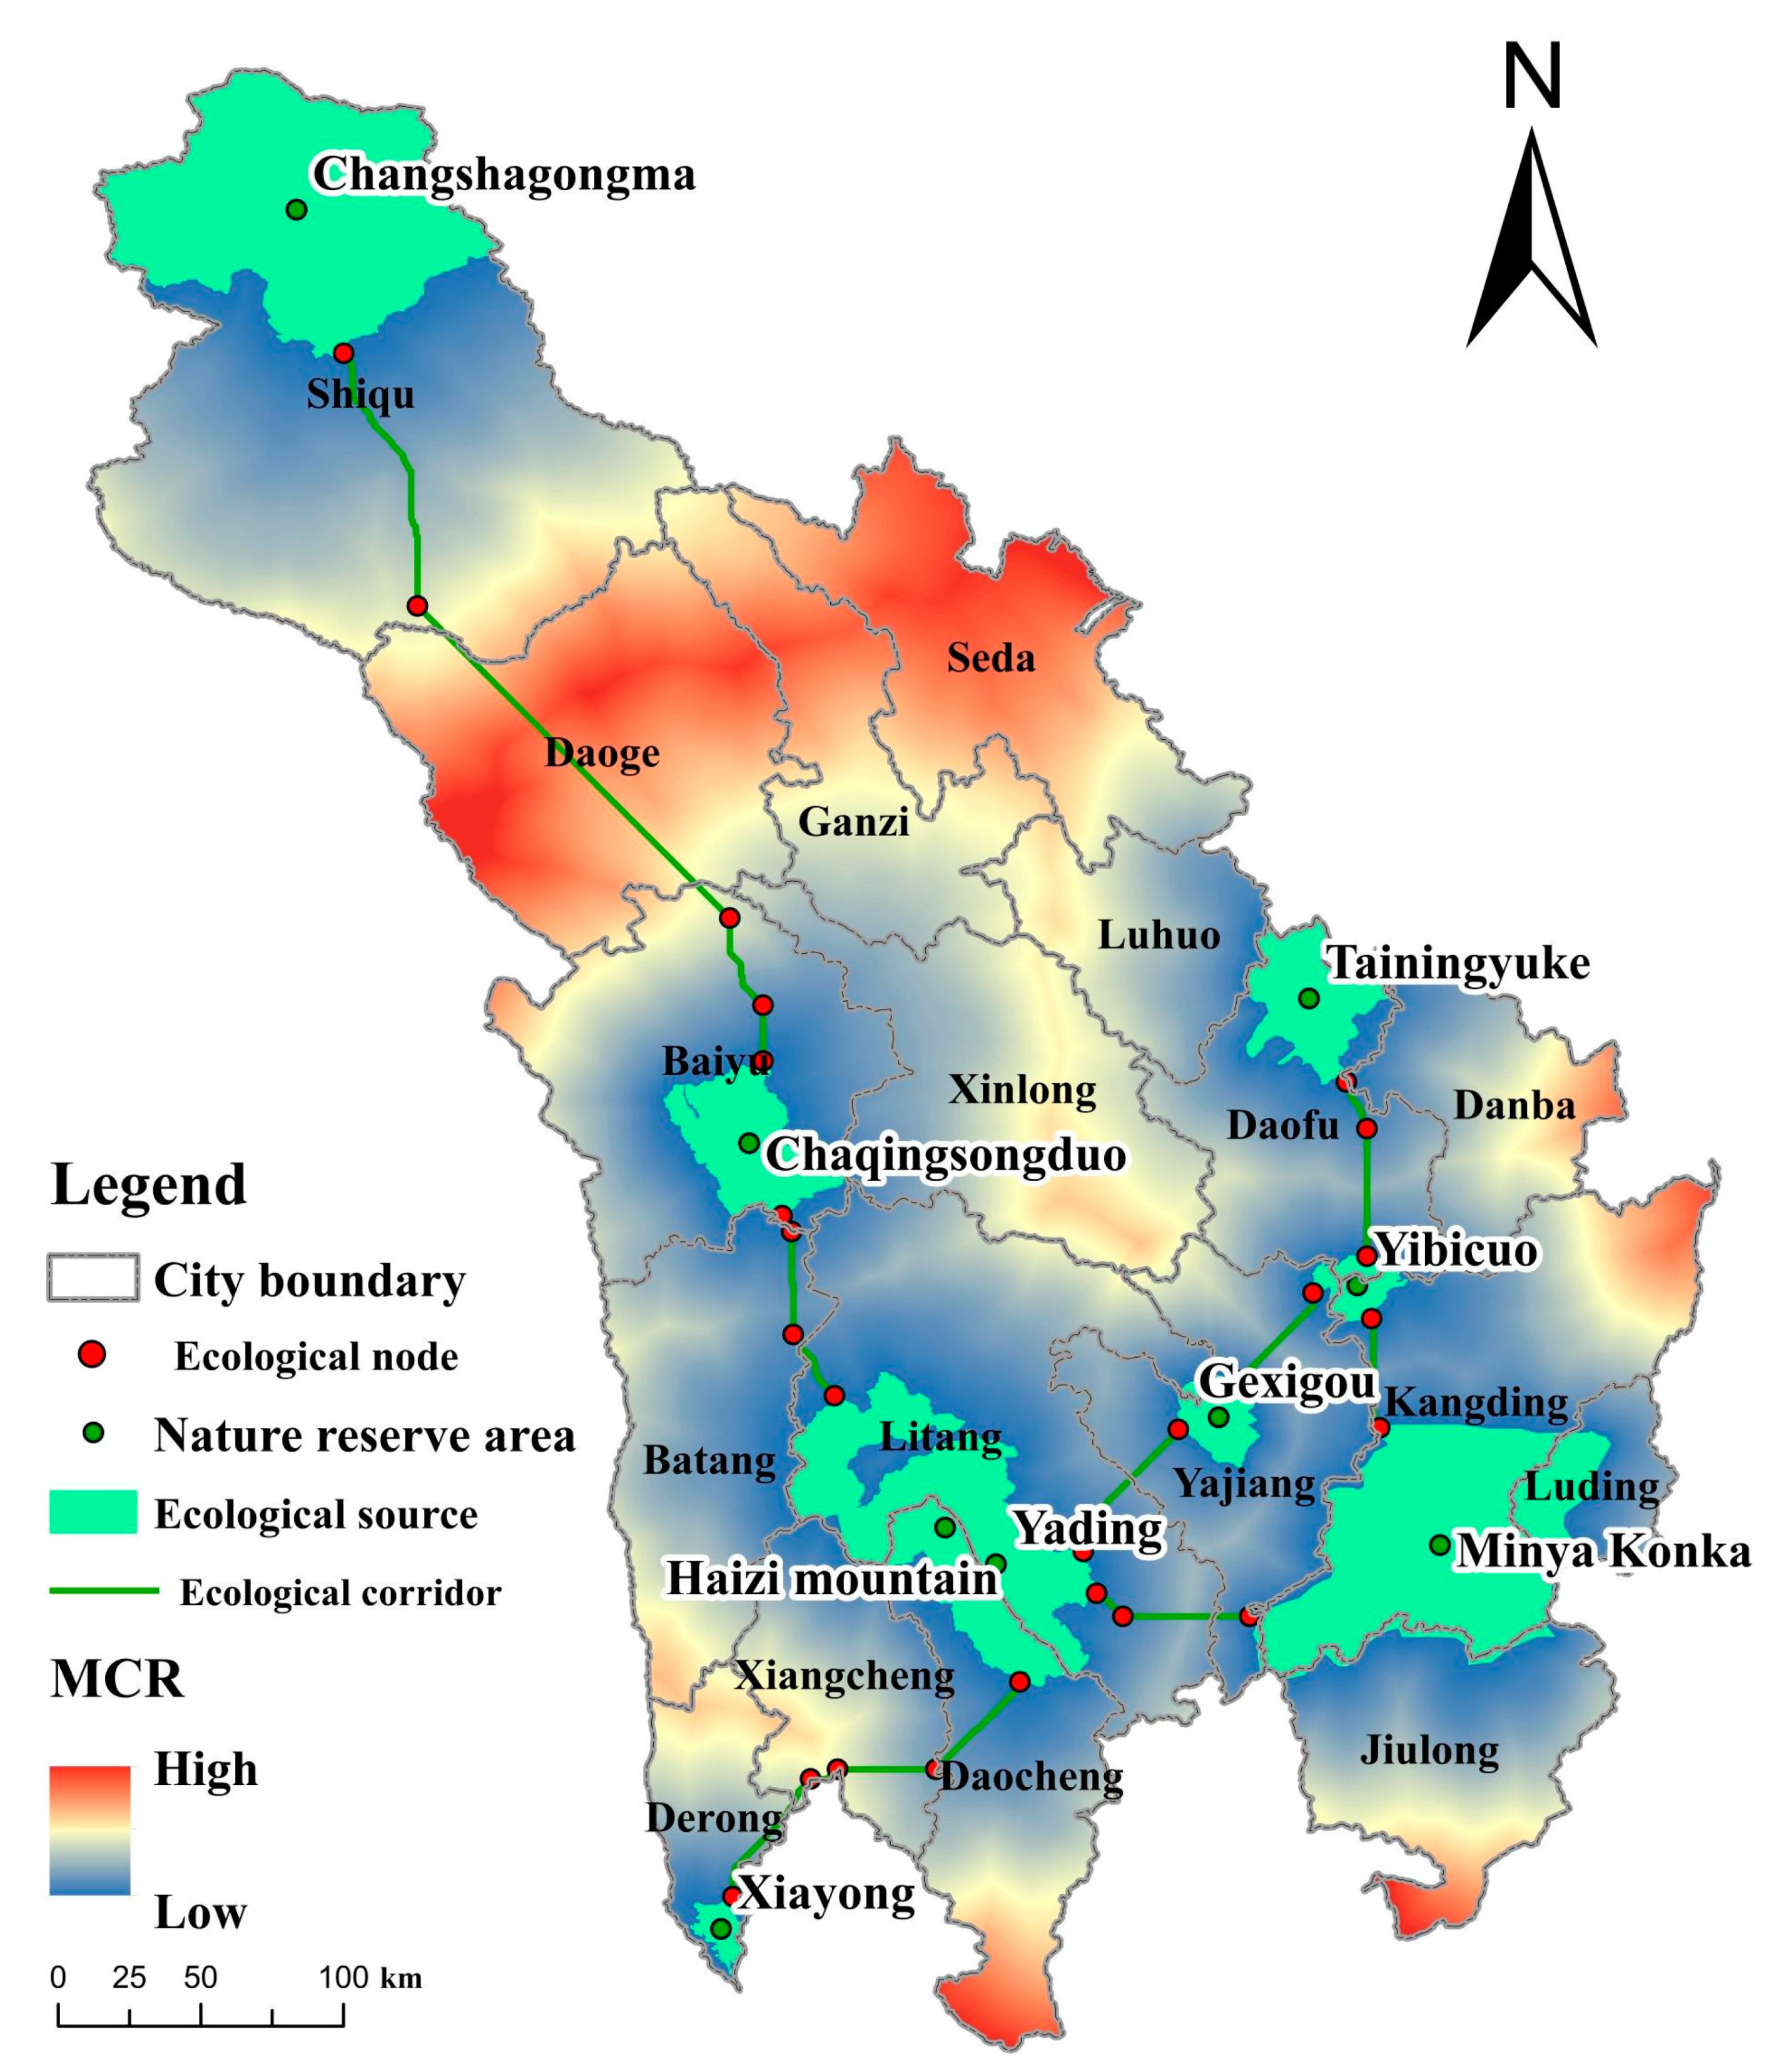
In this study, ArcGIS 10.4 was used to determine the ecological nodes and the results of the study are shown in Figure 7. The eight ecological corridors in the study area had a total length of 702.96 km and were characterized by a “claw-like” spatial distribution pattern. The ecological corridors ran through the north and south of the study area, mainly along the distribution zone of “Changshagongma–Chaqingsongduo–Haizi Mountain”, “Tainingyuke–Yibicuo Swamp-Wetland–Gexigou–Yading” and “Gongga Mountain–Yading–Xiayong”. The spatial distribution of the 35 ecological nodes in the study area generally showed a pattern of “gathering in the middle, dispersing around, and less in the north and more in the south”.

3.2.3. Construction of an Ecological Security Pattern

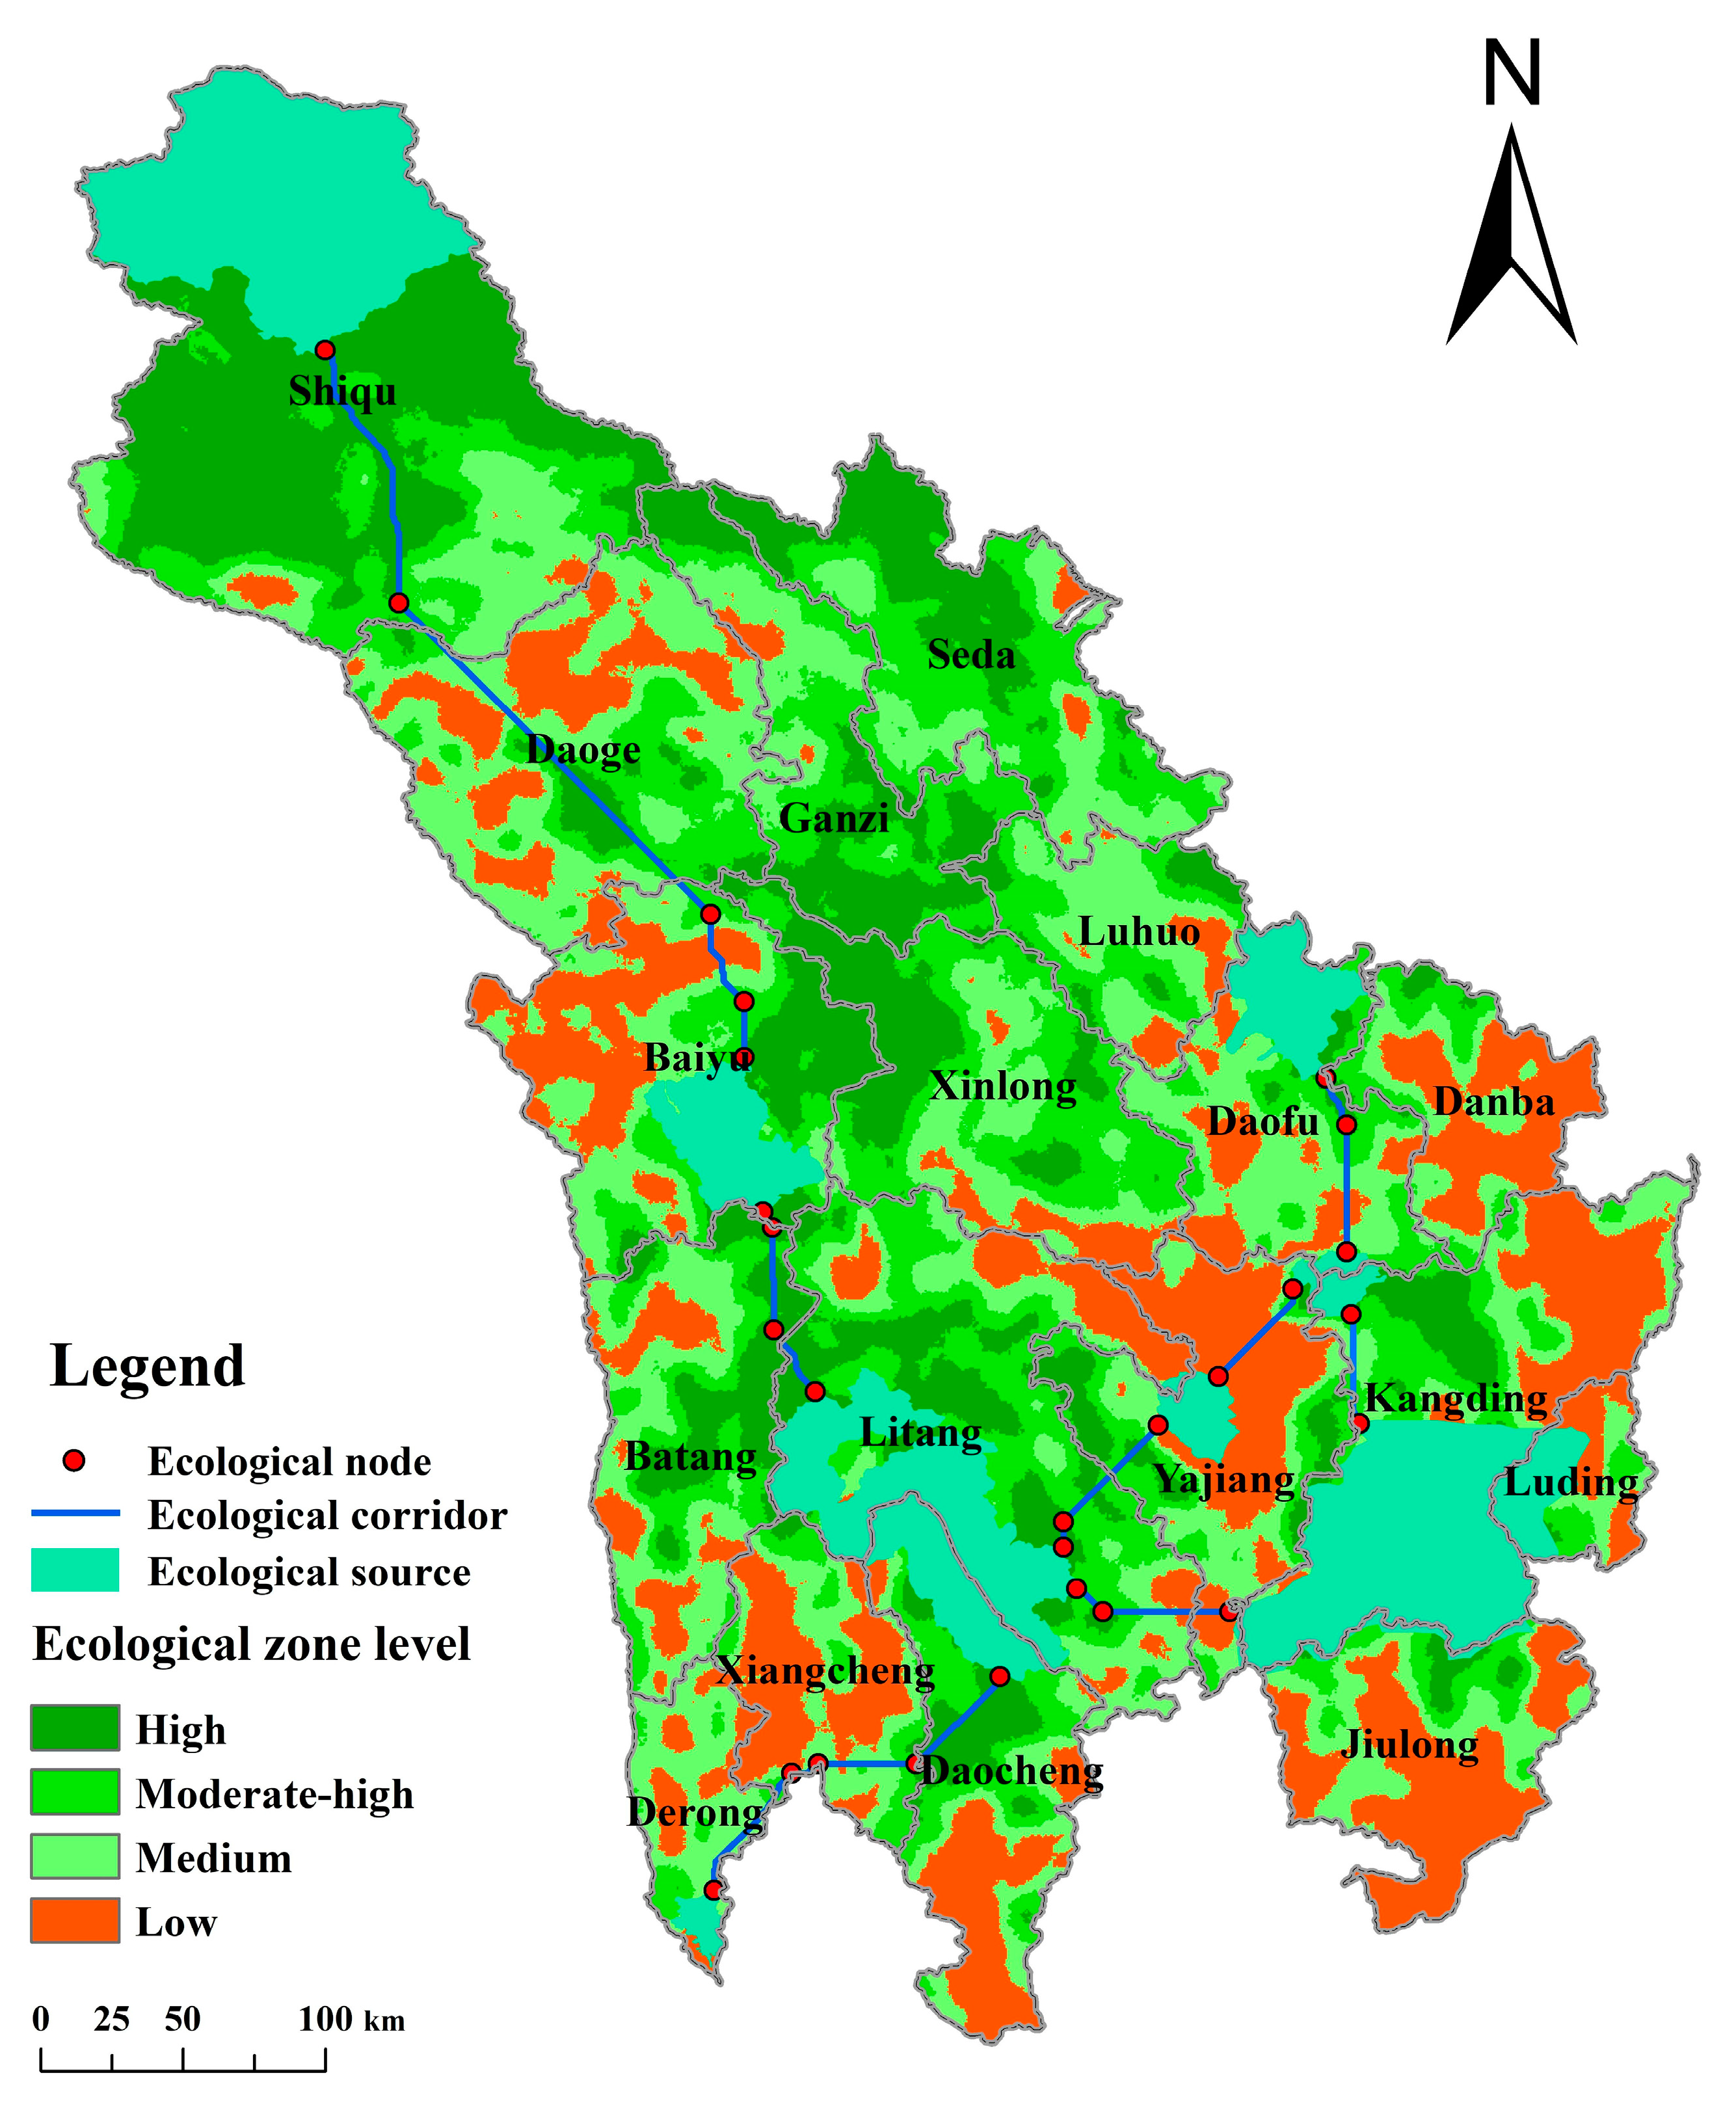
Based on the results of the minimum cumulative resistance surface, the natural breakpoint tool of ArcGIS 10.4 was used for grading and overlaying with the identified ecological components (ecological corridors and ecological nodes) to obtain a distribution map of the ecological security pattern in the study area (Figure 8).
In this study, the study areas’ high-level ecological safety zone was 42,264.47 km2, accounting for 27.55% of the total area (Table 5), mainly distributed in and around the nature reserves in Shiqu County, Litang County, Kangding City and the eastern part of Baiyu County. The moderate-high level ecological safety zone is 37,557.68 km2, accounting for 24.48% of the total area, and was mainly distributed in the northern part of the study area. The rest of the area was distributed around the high-level ecological safety zone. The medium-level ecological safety zone had an area of 41,942 km2, accounting for 27.35% of the total area, and was mainly distributed in the northwestern Daoge County, Luhuo County and the western Tibetan transition area. The area of the low-level ecological safety zone was 31,627.24 km2, accounting for 20.62% of the total area and the least percentage, showing obvious block distribution, mainly in the western part of Baiyu, Xiangcheng, Daocheng, Yajiang, Danba, and Jiulong County and other nature reserve intersection areas.

4. Discussion

In this study, technical methods from landscape ecology, geography and planning were used to bridge the gap between landscape ecological risk evaluation, nature reserves and ecological security pattern construction, expanding the way to study ecological security patterns in regional cities. The landscape ecological risk evaluation model was applied to the evaluation of landscape ecological risk characteristics based on land use data, and this model has been widely used [40,72]. The spatial distribution characteristics of landscape ecological risks were more complex in highland areas due to their geographical location and resource characteristics. Nature reserves, as an important means of conserving biodiversity, have a huge impact on landscape structure as well as on landscape diversity and species conservation [75,76,77]. Therefore, with the help of the evaluation results, it was reasonable and scientific to select nature reserves as the ecological sources to establish an ecological safety pattern. This provides new methods and ideas for the conservation of ecological security in nature reserves and the development of urban ecological management.

4.1. The Landscape Ecological Risk in the Garze Tibetan Autonomous Prefecture

The results show that the overall landscape ecological risk in the study area was at a low level, with the landscape pattern more resistant to external disturbances, which was mainly due to the establishment of a nature reserve [38]. The study area had a large number of nature reserves with abundant woodland and grassland resources, which were of special ecological significance for maintaining the natural ecosystem patterns, functions and processes in the study area [78,79]. Landscape ecological risk is a comprehensive reflection of human activities and natural conditions, and its changes are often associated with the continuous expansion, scope and increasing intensity of human activities [80]. The landscape’s ecological risk index tends to be lower in areas that are unfavorable for engaging in human production, development and construction [81], such as high mountain areas with high altitudes and steep slopes, which is consistent with the results of the study that the landscape’s ecological risk is lower in high-altitude areas in the northwest. These areas, such as Daoge, Ganzi and Luhuo counties, are typical agro-pastoral ecological zones [82], and the development of agro-pastoral industries inevitably affects the landscape ecology. Therefore, it leads to these areas being the main areas of medium ecological risk. Special human construction activities, such as rural revitalization and tourism development [83,84], are also influenced by the government’s planning and the geographical location of the nature reserve, so they are inextricably linked to the spatial distribution of landscape ecological risks [85]. The surrounding areas of the nature reserve, such as Luding, Yajiang, Jiulong and Dacheng counties, are located in the southeastern part of the study area, where tourism is more prominent. Therefore, the frequent and concentrated construction activities in this area and high degrees of landscape fragmentation have caused increased ecological conservation pressure in the area, and most of the area was found to be a high ecological risk area, which is more consistent with the findings of Dong and others [86].

4.2. The Ecological Security Pattern in the Garze Tibetan Autonomous Prefecture

The results show that the ecological security pattern of the study area was relatively stable, with mainly high and moderate-high ecological safety areas. The low-level ecological safety areas accounted for the least and showed an obvious block shape, mainly distributed at the intersection of nature reserves. This could be attributed to the fact that the development of the tourism economy has been accompanied by the construction of roads and others that are highly disruptive to the landscape, such as rivers, woodlands and meadows, reducing ecological safety [45]. Additionally, the construction of ecological safety zones cannot be separated from the selection and determination of nature reserves, which is consistent with the views of Xu et al. [32] and Yan et al. [87]. In particular, the nine nature reserves selected for this study have been research hotspots in the field of ecological research [88,89]. Therefore, according to the actual situation of the study area, this study integrated natural and human factors and constructed a resistance factor system “nature–society–landscape” model, with specific indicators including distance from settlements, distance from roads, landscape ecological risk index, NDVI, slope and elevation to calculate the ecological resistance value of the study area.
The construction of the ecological security pattern required the integration of safety elements such as ecological source sites, corridor protection and ecological safety buffer zones, and full consideration of overall landscape connectivity and species migration and recovery was made in the study area [90,91]. The results showed that the eight ecological corridors indicated a “claw-like” spatial distribution. The number of corridors was higher in areas with a dense distribution of nature reserves, and the ecological connectivity among nature reserves also improved, which is consistent with the results of Zhang et al. [92]. A large number of nature reserves have been established in the study area, with the main categories including forest, wetland and animal nature reserves. These nature reserves cover most of the landscape types and animal species in the study area and are therefore reasonable and scientifically compatible as ecological source sites for the study area [57,92].

4.3. Implications for Regional Sustainable Development

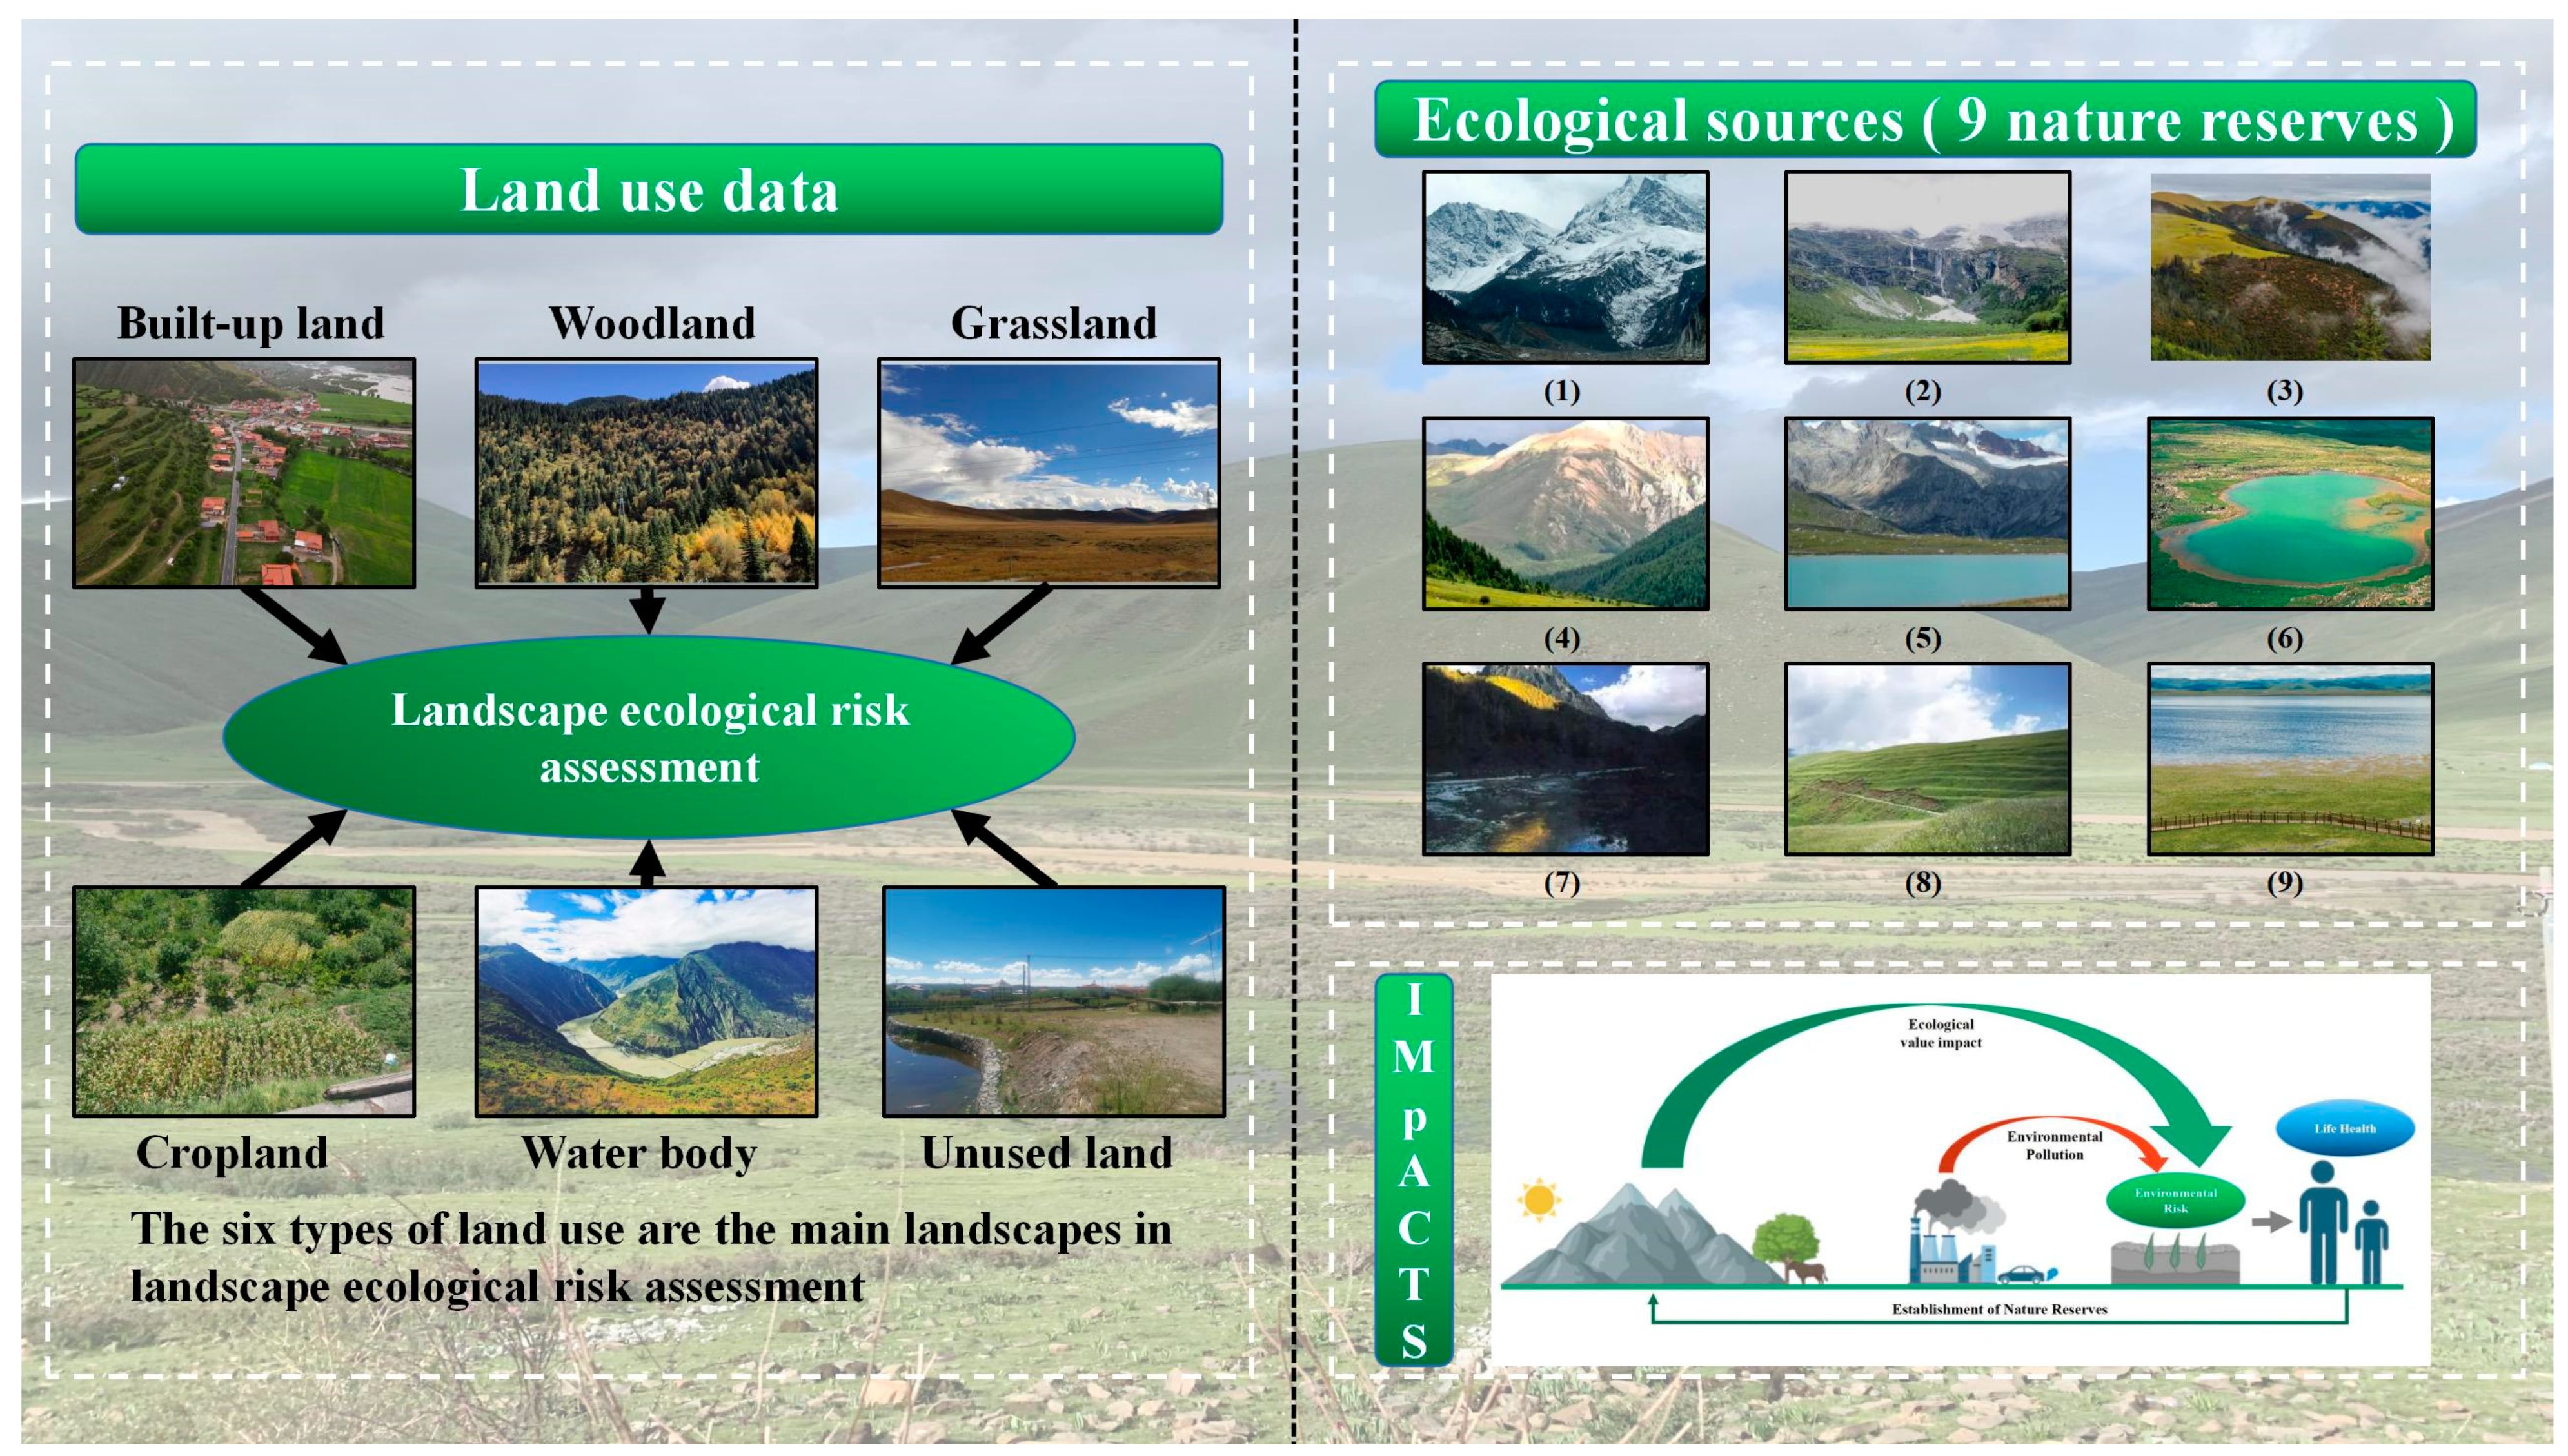
As the scope of human activity continues to expand and increase in intensity, regional sustainable development is receiving increasing attention [11]. Additionally, the sustainable development of this region cannot be separated from the enhancement of ecological protection and landscape ecological security patterns. The establishment of nature reserves and the management of land use have special ecological significance in maintaining ESPs, functions, and the processes of regional landscapes [22,93] (Figure 9). In recent years, the effective management of land use has greatly enhanced the ecological effect of the regional landscape, especially in controlling industrial construction, returning farmland to forests and grazing land to grass [94,95]. Thoroughly investigating the sources of land contamination and implementing source control and management have further become important tools for mitigating the adverse effects of human activities on the ecological environment [66]. In addition, the increasing level of human society’s awareness of natural ecology has made people gradually realize the importance of protecting representative natural ecosystems, endangered plants and animals, and habitats to guarantee regional ecological security and maintain the sustainable development of human society [40]. The relationship between nature reserves and the construction of ESPs is an important basis for the subsequent construction of nature reserves and the scientific guarantee of ESPs. With a wide spatial distribution alongside complex and diverse types of ecosystem composition, nature reserves can provide significant ecological value impacts and are of great importance to human life and health and economic development [75,78]. Therefore, it is an essential part of this sustainable development of the region to reasonably supplement and enrich the construction of nature reserves, building and forming a more complete ecological security pattern.
The landscape ecological risk assessment in this paper emphasizes the risk effects of spatial patterns, which can provide scientific reference and technical support for the construction of ecological safety patterns and ecological risk management in nature reserves. Due to the limitations of methods and data, this paper only emphasizes the static landscape mosaic pattern, while the analysis of landscape functions and the dynamic evolution of the pattern are insufficient. Future research needs to introduce and adopt a process-based pattern analysis method to correlate risk assessment results with specific ecological elements so that the direction of risk management can be more clearly defined. In addition, the selection of nature reserves and the classification of ecological risk levels are subjective or based on the findings of others and need to be further improved in future work.

5. Conclusions

In this study, the focus was on the ecological safety of cities with more nature reserves. By building a bridge between landscape ecological risk assessment and nature reserves, a “nature-society-landscape” resistance coefficient system was constructed. An ecological resistance surface was also constructed using a minimum resistance model to establish an ecological safety pattern of 35 ecological nodes, 8 ecological corridors and 4 ecological safety zones. This study proposes a framework for landscape ecological research that is related to nature reserves and can be applied to the management and optimization of urban ecological security. In future studies, it is necessary to include factors such as economic development to explore the relationship between social development and the ecological security patterns of nature reserves and cities and enhance integrated management.

Author Contributions

Conceptualization, L.J. and Y.L.; methodology, Y.L.; software, L.J.; resources, Q.X. and W.H.; investigation, L.J.; data curation, L.J.; writing—original draft preparation, L.J.; writing—review and editing, Y.L.; visualization, L.J.; supervision, Z.D.; funding acquisition, J.Y. and M.X. All authors have read and agreed to the published version of the manuscript.

Funding

This research was supported by the Natural Science Foundation of Sichuan Province (2022NSFSC1096), and funded by the National Natural Science Foundation of China (No. 42071232), Open Foundation of the Research Center for Human Geography of Tibetan Plateau and Its Eastern Slope (No. RWDL2022-YB008).

Informed Consent Statement

Informed consent was obtained from all subjects involved in the study.

Data Availability Statement

Data sharing is not applicable to this article.

Acknowledgments

The authors thank the editors and the anonymous reviewers for their helpful comments and suggestions, which greatly improved this manuscript.

Conflicts of Interest

The authors declare no conflict of interest.

References

  1. Li, H.; Li, D.; Li, T.; Qiao, Q.; Yang, J.; Zhang, H. Application of Least-Cost Path Model to Identify a Giant Panda Dispersal Corridor Network after the Wenchuan Earthquake—Case Study of Wolong Nature Reserve in China. Ecol. Model. 2010, 221, 944–952. [Google Scholar] [CrossRef]
  2. Su, S.; Li, D.; Yu, X.; Zhang, Z.; Zhang, Q.; Xiao, R.; Zhi, J.; Wu, J. Assessing Land Ecological Security in Shanghai (China) Based on Catastrophe Theory. Stoch Env. Res. Risk Assess. 2011, 25, 737–746. [Google Scholar] [CrossRef]
  3. Larson, K.L.; Nelson, K.C.; Samples, S.R.; Hall, S.J.; Bettez, N.; Cavender-Bares, J.; Groffman, P.M.; Grove, M.; Heffernan, J.B.; Hobbie, S.E.; et al. Ecosystem Services in Managing Residential Landscapes: Priorities, Value Dimensions, and Cross-Regional Patterns. Urban Ecosyst. 2016, 19, 95–113. [Google Scholar] [CrossRef]
  4. Kowe, P.; Mutanga, O.; Odindi, J.; Dube, T. A Quantitative Framework for Analysing Long Term Spatial Clustering and Vegetation Fragmentation in an Urban Landscape Using Multi-Temporal Landsat Data. Int. J. Appl. Earth Obs. Geoinf. 2020, 88, 102057. [Google Scholar] [CrossRef]
  5. Kong, F.; Nobukazu, N.; Yin, H.; Akira, K. Spatial Gradient Analysis of Urban Green Spaces Combined with Landscape Metrics in Jinan City of China. Chin. Geograph. Sci. 2005, 15, 254–261. [Google Scholar] [CrossRef]
  6. Li, J.; Li, C.; Zhu, F.; Song, C.; Wu, J. Spatiotemporal Pattern of Urbanization in Shanghai, China between 1989 and 2005. Landsc. Ecol. 2013, 28, 1545–1565. [Google Scholar] [CrossRef]
  7. Fu, B.; Liang, D.; Lu, N. Landscape Ecology: Coupling of Pattern, Process, and Scale. Chin. Geogr. Sci. 2011, 21, 385–391. [Google Scholar] [CrossRef]
  8. Yin, H.; Kong, F.; Hu, Y.; James, P.; Xu, F.; Yu, L. Assessing Growth Scenarios for Their Landscape Ecological Security Impact Using the SLEUTH Urban Growth Model. J. Urban Plan. Dev. 2016, 142, 05015006. [Google Scholar] [CrossRef]
  9. Kukkala, A.S.; Moilanen, A. Ecosystem Services and Connectivity in Spatial Conservation Prioritization. Landsc. Ecol. 2017, 32, 5–14. [Google Scholar] [CrossRef]
  10. Liu, G.; Liang, Y.; Cheng, Y.; Wang, H.; Yi, L. Security Patterns and Resistance Surface Model in Urban Development: Case Study of Sanshui, China. J. Urban Plan. Dev. 2017, 143, 05017011. [Google Scholar] [CrossRef]
  11. Chen, J.; Wang, S.; Zou, Y. Construction of an Ecological Security Pattern Based on Ecosystem Sensitivity and the Importance of Ecological Services: A Case Study of the Guanzhong Plain Urban Agglomeration, China. Ecol. Indic. 2022, 136, 108688. [Google Scholar] [CrossRef]
  12. Liu, Z.; Lin, Y.; De Meulder, B.; Wang, S. Can Greenways Perform as a New Planning Strategy in the Pearl River Delta, China? Landsc. Urban Plan. 2019, 187, 81–95. [Google Scholar] [CrossRef]
  13. Peng, J.; Zhao, S.; Dong, J.; Liu, Y.; Meersmans, J.; Li, H.; Wu, J. Applying Ant Colony Algorithm to Identify Ecological Security Patterns in Megacities. Environ. Model. Softw. 2019, 117, 214–222. [Google Scholar] [CrossRef]
  14. Vergnes, A.; Kerbiriou, C.; Clergeau, P. Ecological Corridors Also Operate in an Urban Matrix: A Test Case with Garden Shrews. Urban Ecosyst. 2013, 16, 511–525. [Google Scholar] [CrossRef]
  15. Zhao, X.Q.; Xu, X.H. Research on Landscape Ecological Security Pattern in a Eucalyptus Introduced Region Based on Biodiversity Conservation. Russ. J. Ecol. 2015, 46, 59–70. [Google Scholar] [CrossRef]
  16. Wang, Y.; Pan, J. Building Ecological Security Patterns Based on Ecosystem Services Value Reconstruction in an Arid Inland Basin: A Case Study in Ganzhou District, NW China. J. Clean. Prod. 2019, 241, 118337. [Google Scholar] [CrossRef]
  17. Xu, L.; Huang, Q.; Ding, D.; Mei, M.; Qin, H. Modelling Urban Expansion Guided by Land Ecological Suitability: A Case Study of Changzhou City, China. Habitat Int. 2018, 75, 12–24. [Google Scholar] [CrossRef]
  18. Bai, Y.; Wong, C.P.; Jiang, B.; Hughes, A.C.; Wang, M.; Wang, Q. Developing China’s Ecological Redline Policy Using Ecosystem Services Assessments for Land Use Planning. Nat. Commun. 2018, 9, 3034. [Google Scholar] [CrossRef]
  19. Liang, J.; He, X.; Zeng, G.; Zhong, M.; Gao, X.; Li, X.; Li, X.; Wu, H.; Feng, C.; Xing, W.; et al. Integrating Priority Areas and Ecological Corridors into National Network for Conservation Planning in China. Sci. Total Environ. 2018, 626, 22–29. [Google Scholar] [CrossRef]
  20. Lin, J.; Yang, W.; Yu, K.; Geng, J.; Liu, J. Identification and Construction of Ecological Nodes in the Fuzhou Ecological Corridors. Forests 2022, 13, 1837. [Google Scholar] [CrossRef]
  21. Pan, J.; Liu, X. Landscape ecological risk assessment and landscape security pattern optimization in Shule river basin. Chin. J. Ecol. 2016, 35, 791–799. [Google Scholar] [CrossRef]
  22. Peng, J.; Yang, Y.; Liu, Y.; Hu, Y.; Du, Y.; Meersmans, J.; Qiu, S. Linking Ecosystem Services and Circuit Theory to Identify Ecological Security Patterns. Sci. Total Environ. 2018, 644, 781–790. [Google Scholar] [CrossRef] [PubMed]
  23. Tang, Y.; Gao, C.; Wu, X. Urban Ecological Corridor Network Construction: An Integration of the Least Cost Path Model and the InVEST Model. ISPRS Int. J. Geo-Inf. 2020, 9, 33. [Google Scholar] [CrossRef]
  24. Guan, H.; Bai, Y.; Zhang, C. Research on Ecosystem Security and Restoration Pattern of Urban Agglomeration in the Yellow River Basin. Sustainability 2022, 14, 11599. [Google Scholar] [CrossRef]
  25. Wu, Y.; Han, Z.; Meng, J.; Zhu, L. Circuit Theory-Based Ecological Security Pattern Could Promote Ecological Protection in the Heihe River Basin of China. Environ. Sci. Pollut. Res. 2022, 30, 27340–27356. [Google Scholar] [CrossRef] [PubMed]
  26. Zhu, S.; Kong, X.; Jiang, P. Identification of the Human-Land Relationship Involved in the Urbanization of Rural Settlements in Wuhan City Circle, China. J. Rural Stud. 2020, 77, 75–83. [Google Scholar] [CrossRef]
  27. Li, F.; Ye, Y.; Song, B.; Wang, R. Evaluation of Urban Suitable Ecological Land Based on the Minimum Cumulative Resistance Model: A Case Study from Changzhou, China. Ecol. Model. 2015, 318, 194–203. [Google Scholar] [CrossRef]
  28. Ke, X.; Gui, S.; Huang, H.; Zhang, H.; Wang, C.; Guo, W. Ecological Risk Assessment and Source Identification for Heavy Metals in Surface Sediment from the Liaohe River Protected Area, China. Chemosphere 2017, 175, 473–481. [Google Scholar] [CrossRef]
  29. Piet, G.J.; Knights, A.M.; Jongbloed, R.H.; Tamis, J.E.; de Vries, P.; Robinson, L.A. Ecological Risk Assessments to Guide Decision-Making: Methodology Matters. Environ. Sci. Policy 2017, 68, 1–9. [Google Scholar] [CrossRef]
  30. Feng, Y.; Wang, J.; Bai, Z.; Reading, L. Effects of Surface Coal Mining and Land Reclamation on Soil Properties: A Review. Earth-Sci. Rev. 2019, 191, 12–25. [Google Scholar] [CrossRef]
  31. Zhang, W.; Chang, W.J.; Zhu, Z.C.; Hui, Z. Landscape Ecological Risk Assessment of Chinese Coastal Cities Based on Land Use Change. Appl. Geogr. 2020, 117, 102174. [Google Scholar] [CrossRef]
  32. Xu, W.; Wang, J.; Zhang, M.; Li, S. Construction of Landscape Ecological Network Based on Landscape Ecological Risk Assessment in a Large-Scale Opencast Coal Mine Area. J. Clean. Prod. 2021, 286, 125523. [Google Scholar] [CrossRef]
  33. Turner, M.G. Landscape Ecology in North America: Past, Present, and Future. Ecology 2005, 86, 1967–1974. [Google Scholar] [CrossRef]
  34. Fu, B.; Lu, Y. The Progress and Perspectives of Landscape Ecology in China. Prog. Phys. Geogr. Earth Environ. 2006, 30, 232–244. [Google Scholar] [CrossRef]
  35. Luo, Z.; Liang, J.; Zhang, R.; Wang, J. Space zoning identification and control of tourism destinations in eco-sensitive areas based on all-in-one strategy: Taking Aba Tibetan and Qiang Autonomous Prefecture of Sichuan, China as an example. Mt. Res. 2022, 40, 887–901. [Google Scholar] [CrossRef]
  36. Chen, B. Evaluation of ecological security in plateau areas of southwest Sichuan based on ecological footprint model: A case study of Ganzi Tibetan Autonomois Prefecure. Chin. J. Agric. Resour. Reg. Plan. 2019, 40, 185–190. [Google Scholar]
  37. Xu, J.; Chao, B.; Peng, L.; Li, Z.; Zhang, B.; Guo, F.; Bian, F.; Yu, B.; Zou, Q. Ecological corridor construction of Hainan tropical rainforest national park based on biodiversity conservation. J. Southwest For. Univ. (Nat. Sci.-Ences.) 2023, 43, 1–10. [Google Scholar]
  38. Peng, L.; Chen, S.; Peng, P. Establishment and application of assessment indicator system for biodiversity conservation priority on the county scale: A case study in Ganzi Tibetan Autonomous Prefecture. Res. Soil Water Conserv. 2014, 21, 127–132. [Google Scholar] [CrossRef]
  39. Wang, W.; Zheng, H.; Xu, C.; Jiang, W.; Du, Y.; Wang, W.; Zhang, Z.; Liu, X. Spatial Correlation and Ecological Characteristics Analysis of Management Area for Biodiversity Conservation and Relevant Regionalization. Chin. Geogr. Sci. 2014, 24, 71–82. [Google Scholar] [CrossRef]
  40. Hou, P.; Yang, M.; Zhai, J.; Liu, X.; Wan, H.; Li, J.; Cai, M.; Liu, H. Discussion about natural reserve and construction of national ecological security pattern. Geogr. Res. 2017, 36, 420–428. [Google Scholar]
  41. Xu, J.; Fan, F.; Liu, Y.; Dong, J.; Chen, J. Construction of Ecological Security Patterns in Nature Reserves Based on Ecosystem Services and Circuit Theory: A Case Study in Wenchuan, China. Int. J. Environ. Res. Public Health 2019, 16, 3220. [Google Scholar] [CrossRef]
  42. Liu, Y.; Zhao, C.; Liu, X.; Chang, Y.; Wang, H.; Yang, J.; Yang, X.; Wei, Y. The Multi-Dimensional Perspective of Ecological Security Evaluation and Drive Mechanism for Baishuijiang National Nature Reserve, China. Ecol. Indic. 2021, 132, 108295. [Google Scholar] [CrossRef]
  43. Shen, R.; Shi, Z.; He, G.; Lin, Y.; Xu, R. Construction and optimization of the ecological security pattern of Xishuangbanna based on fragmentation index. Trop. Geogr. 2022, 42, 1363–1375. [Google Scholar] [CrossRef]
  44. Song, S.; Zhou, Y.; Li, X.; Zhang, Y.; Peng, B.; Duan, F. Investigation and development countermeasures of wild fruit trees resources in Garze Prefecture, Sichuan Province. Chin. Wild Plant Resour. 2023, 42, 7–16. [Google Scholar]
  45. Song, S.; Chen, L.; Zhang, M.; Wang, X.; Liang, C.; Zhou, X. Discussion on the ecological status and protection measures of wetland nature reserve in Garze Prefecture. Contemp. Hortic. 2021, 44, 79–82. [Google Scholar] [CrossRef]
  46. Li, B.; Wu, F.; Ye, F. Temporal and spatial differentiation of land use benefit evaluation in counties in ethnic minority areas based on TOPSIS method: Taking Ganzi Tibetan Autonomous Prefecture as an example. Southwest China J. Agric. Sci. 2022, 35, 2379–2386. [Google Scholar] [CrossRef]
  47. Liang, J.; Dong, J.; Zhang, S.; Zhao, C.; Liu, B.; Yang, L.; Yan, S.; Ma, X. Discussion on InSAR Identification Effectivity of Potential Landslides and Factors That Influence the Effectivity. Remote Sens. 2022, 14, 1952. [Google Scholar] [CrossRef]
  48. Xie, F.; Lu, B.; You, Z.; Li, G.; Zhang, H.; Yang, K.; Yang, N. Survey on resources and bird diversity in the Gexigou National Nature Reserve, Sichuan. Sichuan J. Zool. 2022, 41, 107–120. [Google Scholar]
  49. Qiao, J.; Jia, Q.; Zhou, H.; Gong, L.; Jiang, Y.; Xiao, N.; Gao, X.; Wen, A.; Wang, J. Mammal and bird diversity recorded with camera traps in Gongga Mountain National Nature Reserve, Sichuan, China. Biodivers. Sci. 2022, 30, 20395. [Google Scholar] [CrossRef]
  50. Zhang, X.; Shi, P.; Luo, J.; Liu, H.; Wei, W. The ecological risk assessment of arid inland river basin at the landscape scale: A case study on Shiyang river basin. J. Nat. Resour. 2014, 29, 410–419. [Google Scholar]
  51. Lamine, S.; Petropoulos, G.P.; Singh, S.K.; Szabó, S.; Bachari, N.E.I.; Srivastava, P.K.; Suman, S. Quantifying Land Use/Land Cover Spatio-Temporal Landscape Pattern Dynamics from Hyperion Using SVMs Classifier and FRAGSTATS®. Geocarto Int. 2018, 33, 862–878. [Google Scholar] [CrossRef]
  52. Wu, T.; Zha, P.; Yu, M.; Jiang, G.; Zhang, J.; You, Q.; Xie, X. Landscape Pattern Evolution and Its Response to Human Disturbance in a Newly Metropolitan Area: A Case Study in Jin-Yi Metropolitan Area. Land 2021, 10, 767. [Google Scholar] [CrossRef]
  53. Jiang, P.; Cheng, L.; Li, M.; Zhao, R.; Huang, Q. Analysis of Landscape Fragmentation Processes and Driving Forces in Wetlands in Arid Areas: A Case Study of the Middle Reaches of the Heihe River, China. Ecol. Indic. 2014, 46, 240–252. [Google Scholar] [CrossRef]
  54. Yang, X.; Wang, L.; Wu, T.; Qiu, Q. Ecological Risk Assessment Based on Road Network Development Analysis of Xiamen City, China. Int. J. Sustain. Dev. World Ecol. 2018, 25, 458–467. [Google Scholar] [CrossRef]
  55. Ricotta, C.; Avena, G. On the Relationship between Pielou’s Evenness and Landscape Dominance within the Context of Hill’s Diversity Profiles. Ecol. Indic. 2003, 2, 361–365. [Google Scholar] [CrossRef]
  56. Han, X.; Liu, X.; Wang, Y.; Wen, S.; Ye, J. Ecological risk assessment and its management of oasis in arid area based on landscape pattern. Res. Soil Water Conserv. 2017, 24, 285–290. [Google Scholar] [CrossRef]
  57. Zhang, X.; Zhao, Z.; Zhao, Y.; Gao, X.; Ma, Y.; Liu, N.; Ji, W. Landscape ecological risk assessment and ecological security pattern optimization construction in Yinchuan City. Arid Land Geogr. 2022, 45, 1626–1636. [Google Scholar]
  58. Li, C.; Zhang, W.; Lin, N.; Wu, M.; Jiang, R. Landscape ecological risk assessment and driving force analysis based on Shenyang land use changes. J. Inn. Mong. Univ. 2022, 53, 383–393. [Google Scholar] [CrossRef]
  59. Liu, Y.; Wang, Y.; Peng, J.; Zhang, T.; Wei, H. Urban landscape ecological risk assessment based on the 3D framework of adaptive cycle. Acta Geogr. Sin. 2015, 70, 1052–1067. [Google Scholar]
  60. Gao, B.; Li, C.; Wu, Y.; Zheng, K.; Wu, Y. Landscape ecological risk assessment and influencing factors in ecological con-servation area in Sichuan-Yunnan provinces, China. Chin. J. Appl. Ecol. 2021, 32, 1603–1613. [Google Scholar] [CrossRef]
  61. Gong, J.; Xie, Y.; Zhao, C.; Gao, Y. Landscape ecological risk assessment and its spatiotemporal variation of the Bailongjiang watershed, Gansu. China Environ. Sci. 2014, 34, 2153–2160. [Google Scholar]
  62. Kang, Z.; Zhang, Z.; Wei, H.; Liu, L.; Ning, S.; Zhao, G.; Wang, T.; Tian, H. Landscape ecological risk assessment in Manas River Basin based on land use change. Acta Ecol. Sin. 2020, 40, 6472–6485. [Google Scholar]
  63. Cui, L.; Zhao, Y.; Liu, J.; Han, L.; Ao, Y.; Yin, S. Landscape Ecological Risk Assessment in Qinling Mountain. Geol. J. 2018, 53, 342–351. [Google Scholar] [CrossRef]
  64. Chen, X.; Yang, Z.; Wang, T.; Han, F. Landscape Ecological Risk and Ecological Security Pattern Construction in World Natural Heritage Sites: A Case Study of Bayinbuluke, Xinjiang, China. ISPRS Int. J. Geo-Inf. 2022, 11, 328. [Google Scholar] [CrossRef]
  65. Ju, L.; Yu, H.; Xiang, Q.; Hu, W.; Xu, X. Spatial Coupling Pattern and Driving Forces of Rural Settlements and Arable Land in Alpine Canyon Region of the Maoxian County, China. Int. J. Environ. Res. Public Health 2023, 20, 4312. [Google Scholar] [CrossRef] [PubMed]
  66. Xiang, Q.; Yu, H.; Chu, H.; Hu, M.; Xu, T.; Xu, X.; He, Z. The Potential Ecological Risk Assessment of Soil Heavy Metals Using Self-Organizing Map. Sci. Total Environ. 2022, 843, 156978. [Google Scholar] [CrossRef] [PubMed]
  67. Li, S.; He, W.; Wang, L.; Zhang, Z.; Chen, X.; Lei, T.; Wang, S.; Wang, Z. Optimization of Landscape Pattern in China Luojiang Xiaoxi Basin Based on Landscape Ecological Risk Assessment. Ecol. Indic. 2023, 146, 109887. [Google Scholar] [CrossRef]
  68. Li, X.; Li, S.; Zhang, Y.; O’Connor, P.J.; Zhang, L.; Yan, J. Landscape Ecological Risk Assessment under Multiple Indicators. Land 2021, 10, 739. [Google Scholar] [CrossRef]
  69. Cao, C.; Yang, B.; Xu, M.; Li, X.; Singh, R.P.; Zhao, X.; Chen, W. Evaluation and Analysis of Post-Seismic Restoration of Ecological Security in Wenchuan Using Remote Sensing and GIS. Geomatics. Nat. Hazards Risk 2016, 7, 1919–1936. [Google Scholar] [CrossRef]
  70. Wang, X.; Wan, R.; Pan, P. Construction and adjustment of ecological security pattern based on MSPA-MCR Model in Taihu Lake Basin. Acta Ecol. Sin. 2022, 42, 1968–1980. [Google Scholar] [CrossRef]
  71. Yan, Y.; Ju, H.; Zhang, S.; Chen, G. The Construction of Ecological Security Patterns in Coastal Areas Based on Landscape Ecological Risk Assessment—A Case Study of Jiaodong Peninsula, China. Int. J. Environ. Res. Public Health 2021, 18, 12249. [Google Scholar] [CrossRef]
  72. Wang, F.; Yuan, X.; Zhou, L.; Zhang, M. Integrating Ecosystem Services and Landscape Connectivity to Construct and Optimize Ecological Security Patterns: A Case Study in the Central Urban Area Chongqing Municipality, China. Env. Sci. Pollut. Res. 2022, 29, 43138–43154. [Google Scholar] [CrossRef]
  73. Graves, T.; Chandler, R.B.; Royle, J.A.; Beier, P.; Kendall, K.C. Estimating Landscape Resistance to Dispersal. Landsc. Ecol. 2014, 29, 1201–1211. [Google Scholar] [CrossRef]
  74. Knaapen, J.P.; Scheffer, M.; Harms, B. Estimating Habitat Isolation in Landscape Planning. Landsc. Urban Plan. 1992, 23, 1–16. [Google Scholar] [CrossRef]
  75. Chen, L.; Li, X.; Fu, B.; Xiao, D.; Zhao, W. Development history and future research priorities of landscape ecology in China. Acta Ecol. Sin. 2014, 34, 3129–3141. [Google Scholar] [CrossRef]
  76. Liu, Y.; Xu, W.; Hong, Z.; Wang, L.; Ou, G.; Lu, N. Assessment of Spatial-Temporal Changes of Landscape Ecological Risk in Xishuangbanna, China from 1990 to 2019. Sustainability 2022, 14, 10645. [Google Scholar] [CrossRef]
  77. Raphela, T.D.; Duffy, K.J. Effects of the Density of Invasive Lantana Camara Plants on the Biodiversity of Large and Small Mammals in the Groenkloof Nature Reserve (GNR) in South Africa. Biology 2023, 12, 296. [Google Scholar] [CrossRef] [PubMed]
  78. Zhao, T.; Ouyang, Z.; Jia, L.; Zheng, H. Ecosystem services and their valuation of China grassland. Acta Ecol. Sin. 2004, 24, 1101–1110. [Google Scholar]
  79. Zhao, T.; Ouyang, Z.; Zheng, H.; Wang, X.; Miao, H. Forest ecosystem services and their valuation in China. J. Nat. Resour. 2004, 19, 480–491. [Google Scholar]
  80. Peng, J.; Dang, W.; Liu, Y.; Zong, M.; Hu, X. Review on landscape ecological risk assessment. Acta Geogr. Sin. 2015, 70, 664–677. [Google Scholar]
  81. Wang, K.; Zheng, H.; Zhao, X.; Sang, Z.; Yan, W.; Cai, Z.; Xu, Y.; Zhang, F. Landscape Ecological Risk Assessment of the Hailar River Basin Based on Ecosystem Services in China. Ecol. Indic. 2023, 147, 109795. [Google Scholar] [CrossRef]
  82. Du, M. Exploring the Economic Development Model of Ecologically Fragile Ethnic Regions from the Perspective of Ecological Capital: A case study on Garze Tibetan Autonomous Prefecture, Sichuan. J. Social. Theory Guide 2016, 6, 78–81. [Google Scholar]
  83. Xiao, Y.; Gong, X. A study of tourism—Based poverty eradication and income growth of farmers and herdsmen in Ganzi Tibetan Autonomous Prefecture. J. Yunnan Minzu Univ. 2018, 35, 107–113. [Google Scholar] [CrossRef]
  84. Wang, Q.; Yang, X.; Fang, Y. Spatial mismatch evolution and influencing factors of tourism resource abundance and tourism network attention in Sichuan Province. Tour. Sci. 2023, 37, 43–58. [Google Scholar] [CrossRef]
  85. Wang, X.; Liu, G.; Xiang, A.; Xiao, S.; Lin, D.; Lin, Y.; Lu, Y. Terrain Gradient Response of Landscape Ecological Environment to Land Use and Land Cover Change in the Hilly Watershed in South China. Ecol. Indic. 2023, 146, 109797. [Google Scholar] [CrossRef]
  86. Dong, T.; Xu, W.; Zheng, H.; Xiao, Y.; Kong, L.; Ouyang, Z. A Framework for Regional Ecological Risk Warning Based on Ecosystem Service Approach: A Case Study in Ganzi, China. Sustainability 2018, 10, 2699. [Google Scholar] [CrossRef]
  87. Yan, L.; Yu, L.; An, M.; Su, H.; Li, H.; Yuan, C. Explanation of the Patterns, Spatial Relationships, and Node Functions of Biodiversity and Island: An Example of Nature Reserves in Guizhou, Southwest China. Sustainability 2019, 11, 6197. [Google Scholar] [CrossRef]
  88. You, Z.; Lu, B.; Du, B.; Liu, W.; Jiang, Y.; Ruan, G.; Yang, N. Spatio-Temporal Niche of Sympatric Tufted Deer (Elaphodus Cephalophus) and Sambar (Rusa unicolor) Based on Camera Traps in the Gongga Mountain National Nature Reserve, China. Animals 2022, 12, 2694. [Google Scholar] [CrossRef]
  89. Zhang, W.; Wang, T.; Levkov, Z.; Juttner, I.; Ector, L.; Zhou, Q.-C. Halamphora Daochengensis sp. nov., a New Freshwater Diatom Species (Bacillariophyceae) from a Small Mountain Lake, Sichuan Province, China. Phytotaxa 2019, 404, 12–22. [Google Scholar] [CrossRef]
  90. He, H.; Jiang, Y.; Cao, Y.; He, Z.; Zhao, M.; Xu, Z. Ecological security pattern of arid oasis area: Taking Kashi prefecture as an example. Southwest China J. Agric. Sci. 2023, 36, 159–168. [Google Scholar] [CrossRef]
  91. Xiao, M.; Qin, M.; Zhu, L.; Xie, Y. Construction and optimization of the ecological security pattern in Weiyuan County. J. Lanzhou Univ. 2023, 59, 1641. [Google Scholar] [CrossRef]
  92. Yu, J.; Tang, B.; Chen, Y.; Zhang, L.; Nie, Y.; Deng, W. Landscape ecological risk assessment and ecological security pattern construction in landscape resource-based city: A case study of Zhangjiajie City. Acta Ecol. Sin. 2022, 42, 1290–1299. [Google Scholar] [CrossRef]
  93. Kang, J.; Zhang, X.; Zhu, X.; Zhang, B. Ecological Security Pattern: A New Idea for Balancing Regional Development and Ecological Protection. A Case Study of the Jiaodong Peninsula, China. Glob. Ecol. Conserv. 2021, 26, e01472. [Google Scholar] [CrossRef]
  94. Wu, Z.; Wang, M.; Zhang, H.; Du, Z. Vegetation and Soil Wind Erosion Dynamics of Sandstorm Control Programs in the Agro-Pastoral Transitional Zone of Northern China. Front. Earth Sci. 2019, 13, 430–443. [Google Scholar] [CrossRef]
  95. Wang, X.; Ge, Q.; Geng, X.; Wang, Z.; Gao, L.; Bryan, B.A.; Chen, S.; Su, Y.; Cai, D.; Ye, J.; et al. Unintended Consequences of Combating Desertification in China. Nat. Commun. 2023, 14, 1139. [Google Scholar] [CrossRef]
Figure 1. Location of the Sichuan, China (a), location of the Garze Tibetan Autonomous Prefecture (b) and study area (c).
Sustainability 15 08707 g001
Figure 2. Analytical framework of ecological security model construction in nature reserves based on landscape ecology risk assessment.
Sustainability 15 08707 g002
Figure 3. Schematic diagram of ecological risk grid division in the study area of 1 km (a), 5 km (b), and 10 km (c).
Sustainability 15 08707 g003
Figure 4. Spatial distribution map of land use (a) and landscape ecological risk (b) in GTAP.
Sustainability 15 08707 g004
Figure 5. Resistance factor grading diagram.
Sustainability 15 08707 g005
Figure 6. Ecological resistance surface (a) and minimum cumulative resistance value (b) in GTAP.
Sustainability 15 08707 g006
Figure 7. Ecological corridor and ecological node distribution map in GTAP.
Sustainability 15 08707 g007
Figure 8. Ecological security pattern of GTAP.
Sustainability 15 08707 g008
Figure 9. Management, control framework and strategy of ecological risk based on land use and establishment of nature reserve.
Sustainability 15 08707 g009
Table 1. Type, Grade and Area of Nature Reserves in GTAP.
NumberNameTypeGradeArea (km2)
1Gongga Mountain National Nature ReserveForest Nature ReserveCountry5970.5
2Yading National Nature Reserve of Sichuan ProvinceForest Nature ReserveCountry1449.92
3Gexigou National Nature ReserveAnimal Nature ReserveCountry551.82
4Chaqingsongduo National Nature ReserveAnimal Nature ReserveCountry1570.33
5Haizi Mountain National Nature ReserveWetland Nature ReserveCountry4628.37
6Changshagongma National Nature ReserveAnimal Nature ReserveCountry6662.09
7Xiayong Nature ReserveForest Nature ReserveProvince234.97
8Tainingyuke Nature ReserveForest Nature ReserveProvince1340.97
9Yibicuo Swamp-Wetland Nature ReserveWetland Nature ReserveProvince423.91
Table 2. The evaluation factors used to determine ecological resistance.
TypeResistance FactorResistance Value/GradeWeightAttribute
SocietyDistance to the settlements (m)>3200/1; 2401~3200/2; 1601~2400/3; 801~1600/4; 0~800/50.0593-
Distance to the roads (m)>3200/1; 2401~3200/2; 1601~2400/3; 801~1600/4; 0~800/50.0677-
LandscapeLandscape ecological risklow/1; moderate-low/2; medium/3; moderate-high/4; high/50.3576+
Normalized difference vegetation(0.8, 1]/1; (0.6, 0.8]/2; (0.4, 0.6]/3; (0.2, 0.4]/4; (0, 0.2]/50.1866-
NatureSlope/(°)(0, 2]/1; (2, 6]/2; (6, 15]/3; (15, 25]/4; >25/50.1596+
Elevation/m975~1000/1; 1001~2500/2; 2501~4000/3; 4001~5500/4; >5500/50.1692+
Table 3. Indices of landscape in the study area.
Landscape TypeCiNiDiEiFiRi
Cropland0.01320.55450.05780.092240.0176
Woodland0.00270.04740.43940.051720.0049
Grassland0.00040.01310.32350.034430.0049
Waterbody0.01370.66480.04350.107550.0256
Built-up land0.04113.81840.01120.584110.0278
Unused land0.00260.08560.12460.026060.0074
Table 4. Areas of different landscape ecological risk levels.
Ecological RiskArea (km2)Percentage of the Area (%)
Low42,108.9527.45
Moderate-low34,391.5622.42
Medium33,863.9922.08
Moderate-high28,179.7418.37
high14,847.169.68
Table 5. Areas of different ecological security levels.
Ecological SecurityArea (km2)Percentage of the Area (%)
Low31,627.2420.62
Medium41,94227.35
Moderate-high37,557.6824.48
High42,264.4727.55
Disclaimer/Publisher’s Note: The statements, opinions and data contained in all publications are solely those of the individual author(s) and contributor(s) and not of MDPI and/or the editor(s). MDPI and/or the editor(s) disclaim responsibility for any injury to people or property resulting from any ideas, methods, instructions or products referred to in the content.