Article

Utilizing Stearic-Acid-Coated Marble Dust for the Production of Eco-Friendly Self-Cleaning Concrete: RSM Modeling and Optimization

1
Department of Civil Engineering, Amity School of Engineering & Technology, Amity University Uttar Pradesh, Noida 201303, India
2
Department of Civil & Environmental Engineering, Faculty of Engineering, Universiti Teknologi PETRONAS, Seri Iskandar 32610, Perak, Malaysia
*
Author to whom correspondence should be addressed.
Sustainability 2023, 15(11), 8635; https://doi.org/10.3390/su15118635
Submission received: 29 March 2023 / Revised: 27 April 2023 / Accepted: 4 May 2023 / Published: 26 May 2023

Abstract

:
With the growing demands of the construction industry, the need for manufacturing cement increases, and it causes challenges to the climate as one ton of cement results in the release of around one ton of CO2. Therefore, it is essential to find an alternative to reduce the environmental impact. This study aims to optimize the properties of concrete containing marble dust and stearic acid to produce eco-friendly and self-cleaning concrete. Stearic acid induces a self-cleaning property in concrete to make it free from moisture, leading to its prolonged service life. Thirteen mixes are designed, using marble dust as a partial replacement of cement by weight (at 10%, 20%, and 30%) and stearic acid by cement weight (at 0.5%, 1%, and 1.5%) in this eco-friendly self-cleaning concrete. Nine mixes were developed using response surface methodology (RSM), where two variable inputs were considered. The compressive, tensile, and flexural strengths were assessed. Other tests such as ultrasonic pulse velocity, Young’s modulus of elasticity, density, scanning electron microscopy (SEM), energy dispersive X-ray (EDX) analysis, and self-cleaning property have been conducted and evaluated. At 10% replacement of marble dust by the weight of cement and with a 0.5% coating of stearic acid, the compressive, tensile, and flexural strength of concrete increases by 12.68%, 21.71%, and 16.73% over the control mix, whereas the best self-cleaning property is observed at 30% partial replacement of cement with marble dust coated with 1.5% of stearic acid.

1. Introduction

Concrete is one of the world’s most widely used building materials, and cement is the key ingredient of concrete, as reported by Zhang et al. [1]. However, cement production is highly energy-intensive and contributes to pollution, including emissions of SO2 and CO2, as stated by Xing et al. [2]. Around 8% of all manmade greenhouse gas emissions come from this sector, according to Sahoo et al. [3]. Therefore, reducing the use of cement can lower CO2 emission, leading to positive environmental and economic impacts. One way to achieve this is by using pozzolanic materials, such as fly ash, studied by Babu and Neeraja [4], slag by Liu et al. [5], marble dust utilization by Vardhan et al. [6], rice husk ash by Ma et al. [7], silica fume experimented by Ahmad et al. [8], or copper mine tailings [9,10] as a partial replacement for cement.
Researchers have identified marble dust as another pozzolanic material that can partially replace cement in concrete, as studied by Tokyay [11]. As marble belongs to one of the types of metamorphic rock, it is composed mainly of finely crystallized calcite grains resulting from low-intensity metamorphism of calcareous and dolomitic rocks. Calcium carbonate makes up to 99% of the content of the carbonated rock, which also contains magnesium oxide, silicon dioxide, aluminum oxide, ferric oxide, sodium oxide, potassium oxide, phosphorus pentoxide, manganese oxide, sulfur, fluorine, copper, lead, and zinc according to the analysis in Revuelta et al. [12].
Marble dust (MD) is produced when marble stones are cut, ground, or polished, as reported by Nayak et al. [13]; however, it does not lead to the production of CO2 or any green gas emission. As the highest exporter of marble, India’s processing plants generate millions of tons of marble waste each year, as studied by Kumar et al. [14]. Disposing of waste marble dust in the soil reduces its permeability and pollutes groundwater, as concluded by Rana et al. [15]. To combat this problem, researchers have begun substituting marble dust for cement in concrete production, which can offer economic and environmental benefits, leading to the development of eco-friendly concrete. This concrete consumes less cement (which means a lower carbon footprint and reduced energy consumption) with the utilization of waste marble dust, thus making it an eco-friendly concrete since 1 ton of cement releases 0.94 tons of CO2 into the atmosphere [16].
According to Kuoribo and Mahmoud [17], the optimal range for replacing cement with MD is between 5% and 20%. Compressive strength has been observed to decrease with increasing marble dust percentage in concrete. However, when utilized as a cement substitute, waste MD increases the concrete’s thermal efficiency, as studied by Li et al. [18]. Moreover, it has also been reported that using MD as a substitute for cement does not affect hardened concrete’s durability or dimensional stability as long as the water/cement ratio remains unchanged. Zhang et al. [19] concluded that when discarded marble powder is partially substituted for cement in concrete, between 5% to 15%, the compressive strength and splitting tensile strength of the concrete both increase significantly.
Aruntaş et al. [20] and Ruiz-Sánchez et al. [21] have documented that using 10% MD as an additive with cement lowers manufacturing costs and improves the long-term compressive strength of concrete. Studies have found that replacing 10% of cement with MD achieves the required strength without adversely affecting the mechanical properties, as shown by Vardhan et al. [6]. According to the authors, replacing 10% of cement with MD yields the highest compressive strength and improves workability. Singh et al. [22] concluded that replacing 15% of cement with marble slurry while maintaining a water–binder ratio between 0.35 and 0.4 improves the mechanical properties of the concrete. Further, the authors added that replacing 10% of the cement with marble slurry while maintaining a water–binder ratio of 0.45 increases compressive strength. Similarly, in 2010, Corinaldesi et al. [23] reported that using 10% marble powder as a partial substitute for cement provides optimal compressive strength. In addition, Aruntas et al. [20] and Arel et al. [16] analyzed different percentages of MD as a replacement for cement. They found that 10% replacement with MD provides better results than 2.5%, 5%, and 7.5% replacement. However, Ergün et al. [24] claimed that 5% cement replacement with marble dust yields the best results. Meanwhile, Shelke et al. [25] found that using 8% MD as a partial substitute for cement yields better results in terms of compressive strength.
Rana et al. [26] found that a 10% substitution of marble slurry for cement considerably increases compressive strength, permeability, porosity, morphology, and concrete corrosion. Sadek et al. [27] critically investigated using marble MD as a cement alternative in cementitious composites and concluded that MD reduces environmental pollution and concrete production cost without compromising the engineering properties of cementitious composites, making it suitable for replacing cement within certain limits. Moreover, using MD as a cement substitute increases the durability of cementitious composites by improving resistance to carbonation, sulfate attack, chloride migration, and alkali–silica reaction, as stated by the authors. Aliabdo et al. [28] and Gencel et al. [29] also found that the addition of marble dust to cement mortar enhances its compressive strength, and a similar finding was observed for the split tensile strength of concrete.
Furthermore, few researchers have explored the possibility of using MD to replace fine aggregates in concrete. Kumar [30] suggested that replacing 15% of fine aggregate with marble powder improves concrete’s durability and compressive strength by 4.5%. It has also been stated that using MD to replace cement and sand in concrete significantly increases its tensile strength. Concrete containing MD as a cement or fine aggregate replacement has lower porosity than concrete without marble dust. A lower water–cement ratio enhances the effectiveness of using MD as a sand replacement. Some researchers have come up with eco-friendly cement-based materials blended with recycled materials. A novel and feasible method suggested by Ma et al. [31] proposes to crush recycled coarse aggregate into recycled manufactured sand that exhibits superior characteristics similar to those of natural-stone-derived manufactured sand which is intended for producing high-quality recycled mortar.
The existing literature mainly deals with fresh and hardened properties of concrete, containing marble dust as a replacement for cement or fine aggregate. Based on the review of the related literature, it was found that no work has been conducted on the manufacturing of eco-friendly self-cleaning concrete containing stearic acid to mitigate the hydrophilic property of concrete. Concrete structures are inherently hydrophilic and porous, and they tend to develop micro-cracks on the surface due to water absorption, which decreases durability. The hydrophilic property of concrete is still predominating, despite attempts being made to reduce the voids, pores, and capillary action of concrete by utilizing filler materials. This has a direct impact on the durability of concrete.
The effect of stearic acid on the watertightness properties of cementitious materials was observed by Na et al. [32]. Albayrak et al. [33] examined the effects of stearic acid as an additive to cement on the fineness and strength of concrete and showed that it increases both. Stearic acid is found to possess a water-repellent property in concrete, as concluded by Li et al. [34] and Song et al. [35]. The repelling behavior of concrete is an important property related to its ability to resist the penetration of oils, chemicals, and other liquids, often referred to as concrete impermeability or concrete resistance to permeation and hence making it self-cleaning concrete. This property is crucial in maintaining the appearance of concrete over time, as concrete that absorbs liquids may be prone to staining or coloration, which detracts from its aesthetic appeal. Several researchers have investigated using a titanium dioxide catalyst coating to make concrete hydrophobic, which can help repel dirt and pollutants on the concrete surface and induce self-cleaning properties, as interpreted by Subbiah et al. [36]. Al-kheetan et al. [37] added titanium dioxide to the fresh concrete mix, which is activated in the hardened concrete when exposed to the sun. The activated titanium dioxide changes its electric charge and creates a repelling force between the concrete and the dust and contaminants on its surface, allowing the concrete to clean itself. It has been reported, by Zhao et al., that activated titanium dioxide can help decompose airborne pollutants in congested cities [38]. As Na et al. [32] discovered the impact of stearic acid on the watertightness quality of cementitious materials, SA utilization in concrete affects the hydration and watertightness property of cement, i.e., stearic acid showed improvement of watertightness by reducing the amount of total pore volume, according to the authors.
An attempt has been made in this research work to utilize stearic acid (SA) in the concrete to make it water-repellent since stearic acid is 35% to 50% cheaper than titanium oxide, thus making it a self-cleaning concrete (SCC). The main application of self-cleaning concrete is to maintain the aesthetic appearance of structures for a long time with its greater durability.
The main objective of the study reported in this paper was to assess the influence of MD and SA on the mechanical properties of concrete, develop and evaluate predictive models for the desired responses, and finally optimize the concrete mixtures for construction applications. Response surface methodology (RSM) is employed for developing mathematical models for predicting the mechanical properties of concrete, mainly the compressive, flexural, and tensile strength of eco-friendly self-cleaning concrete.

2. Materials and Methods

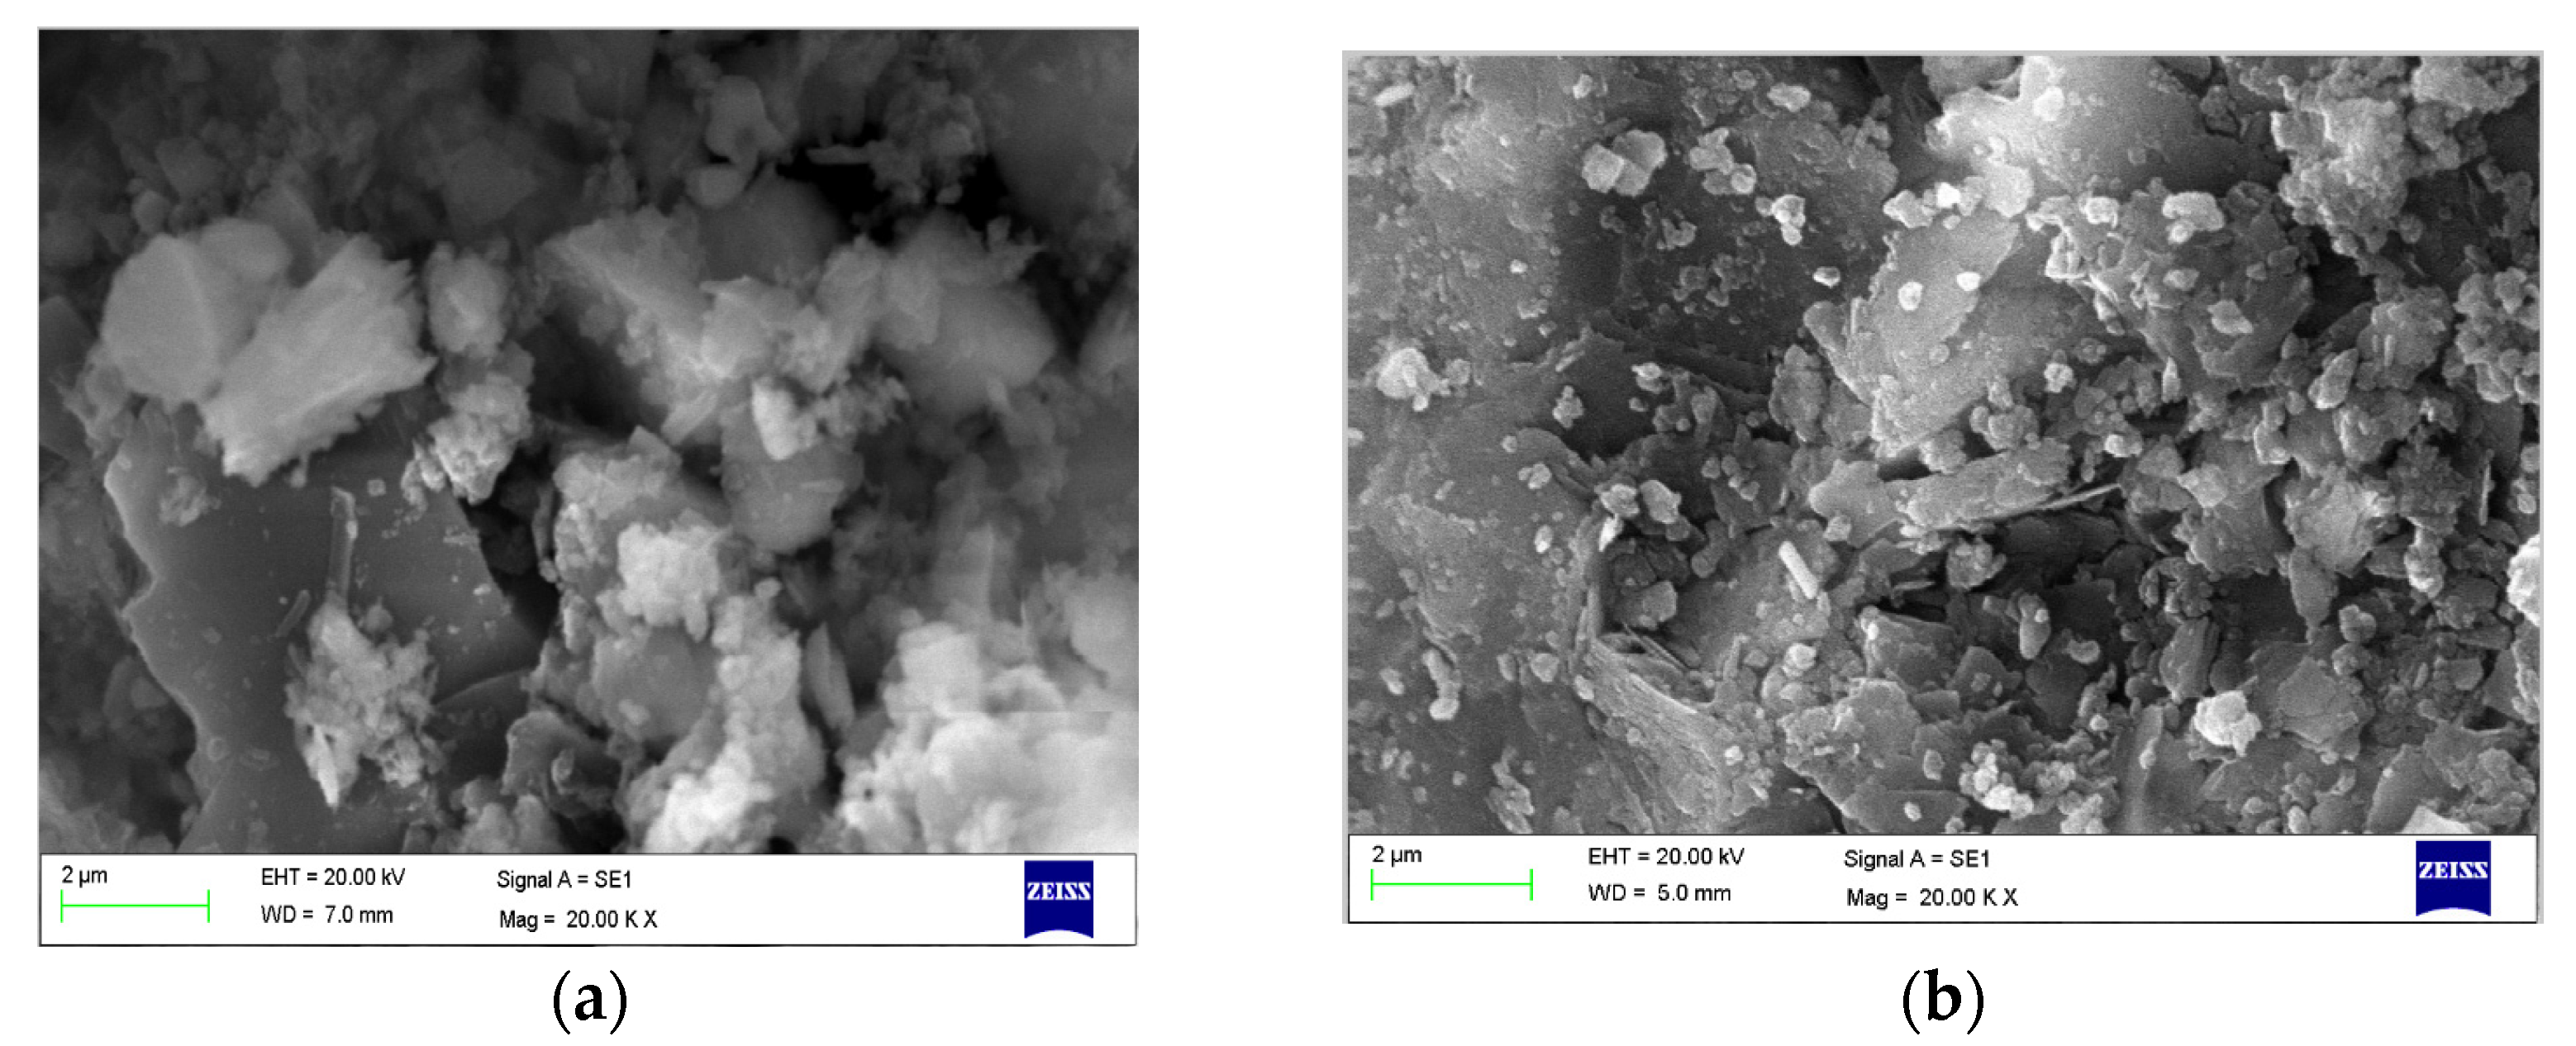
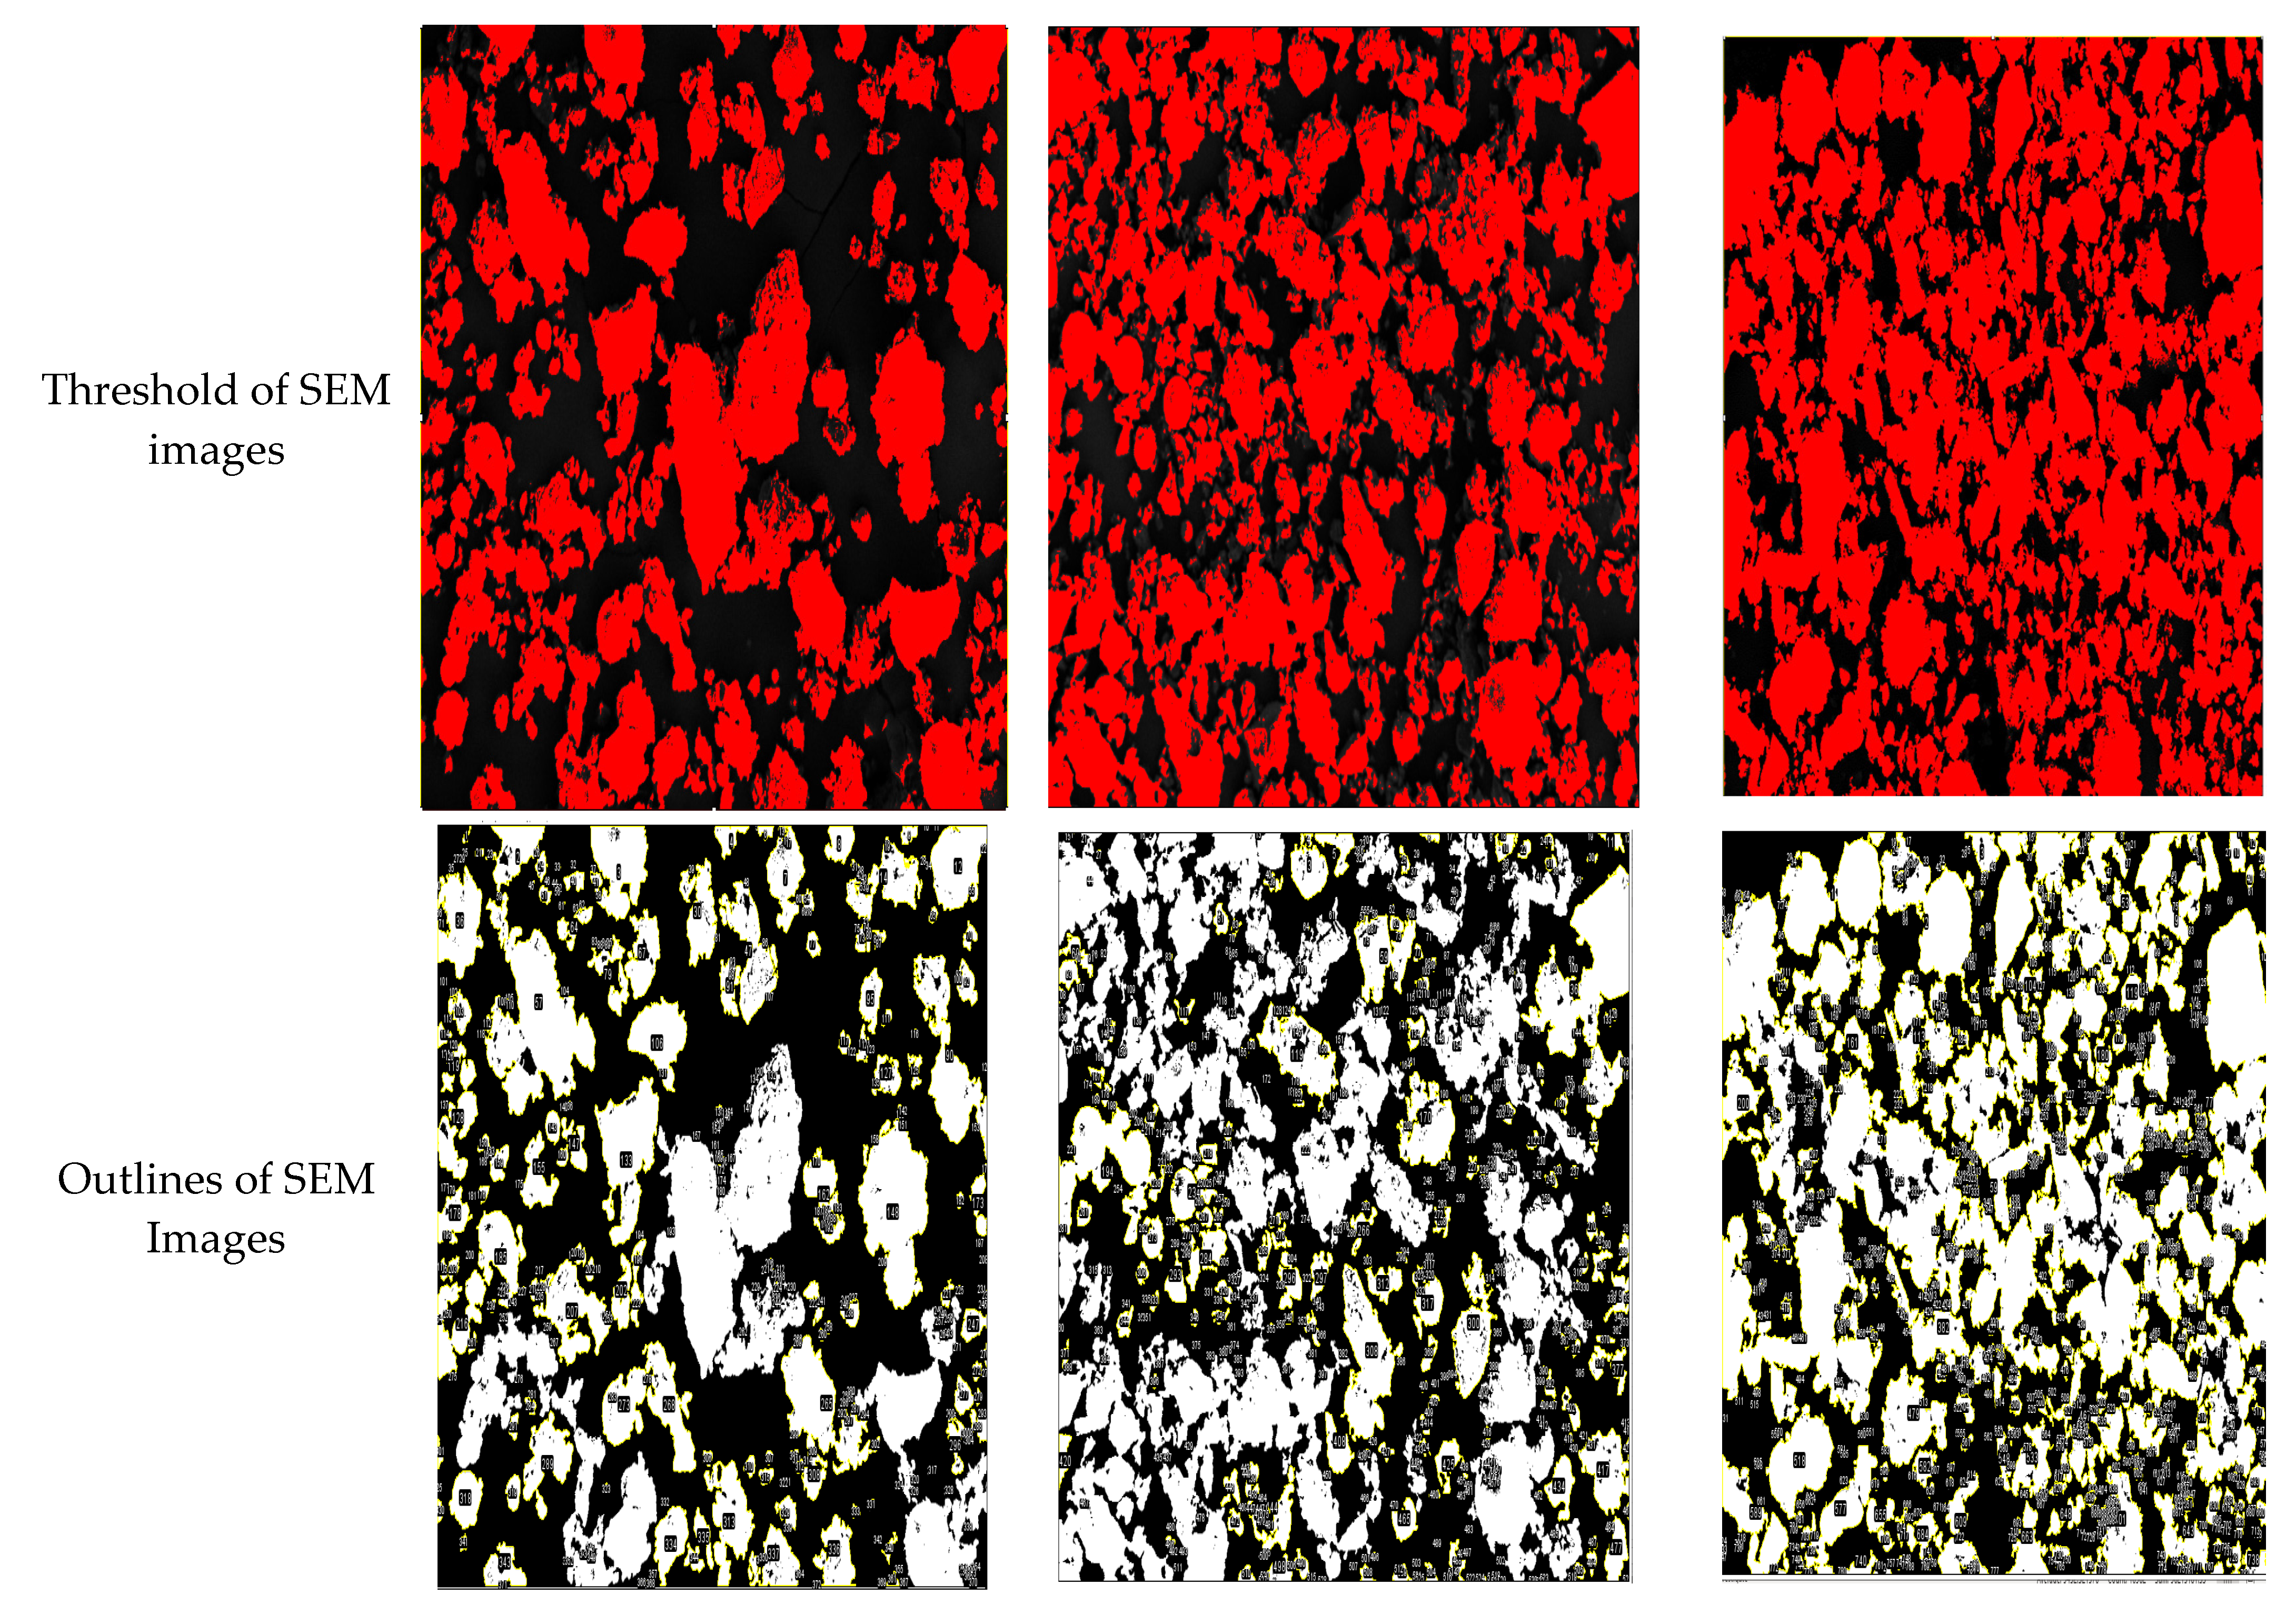
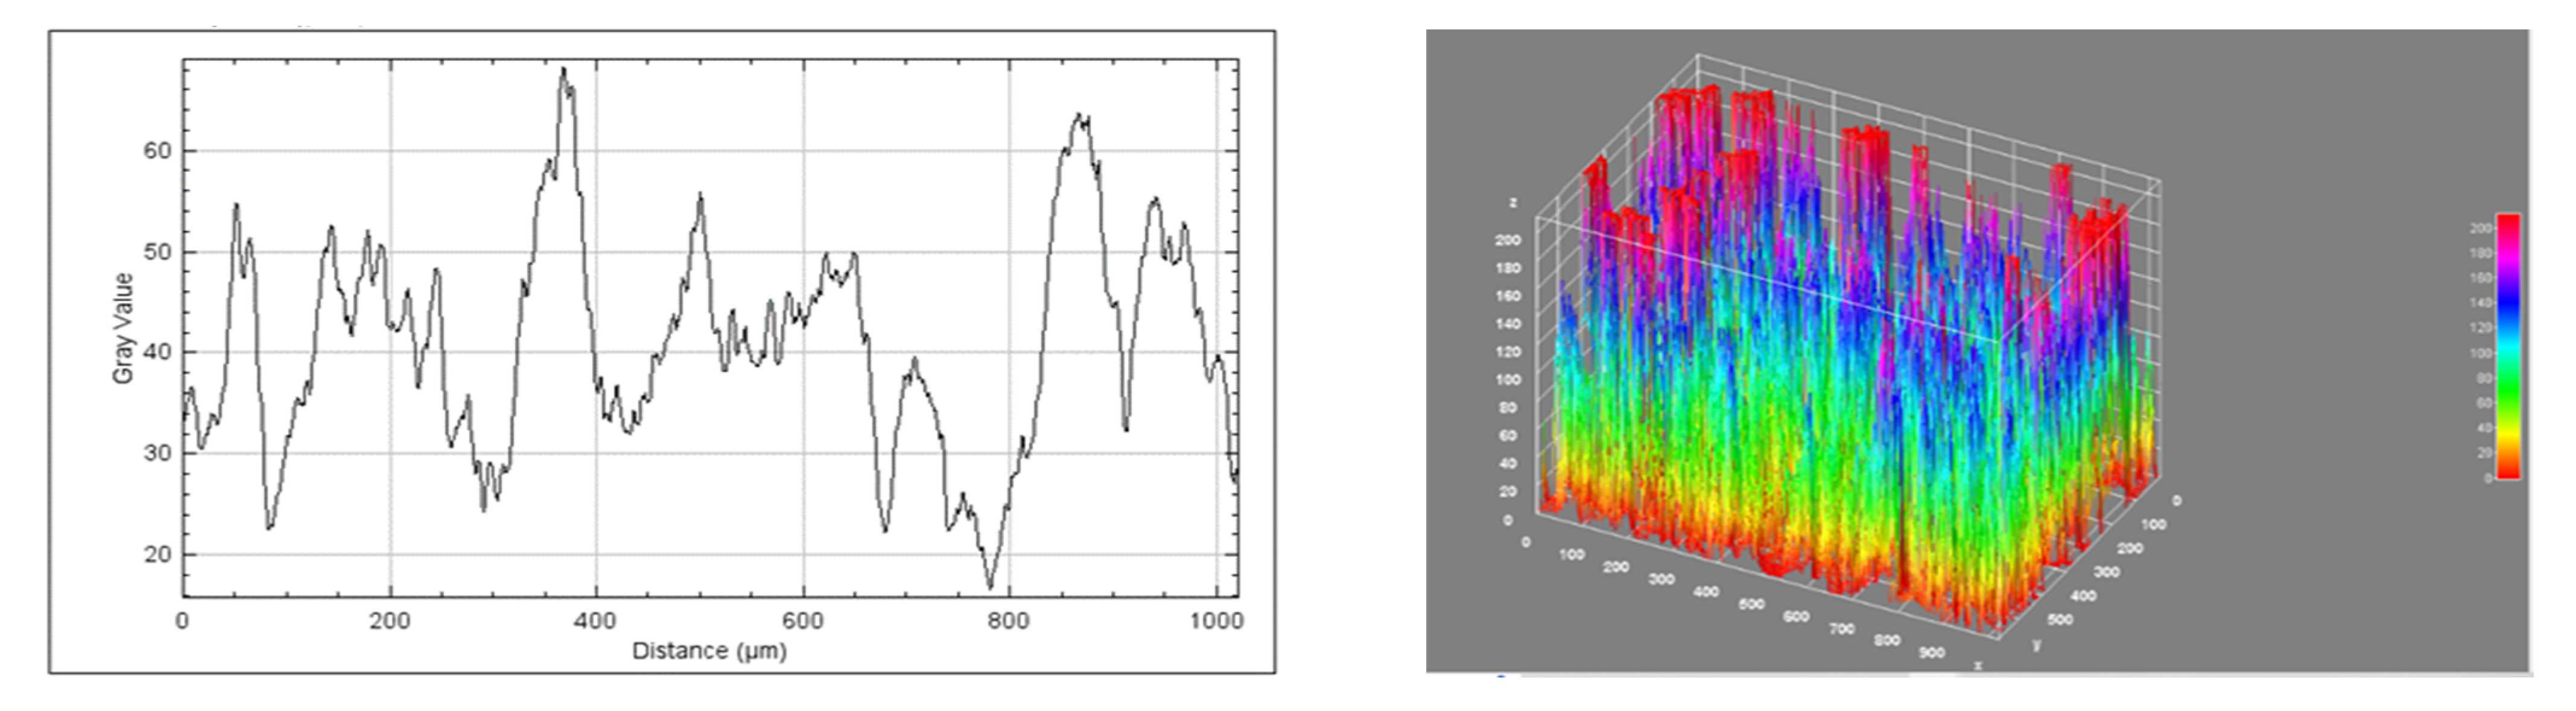
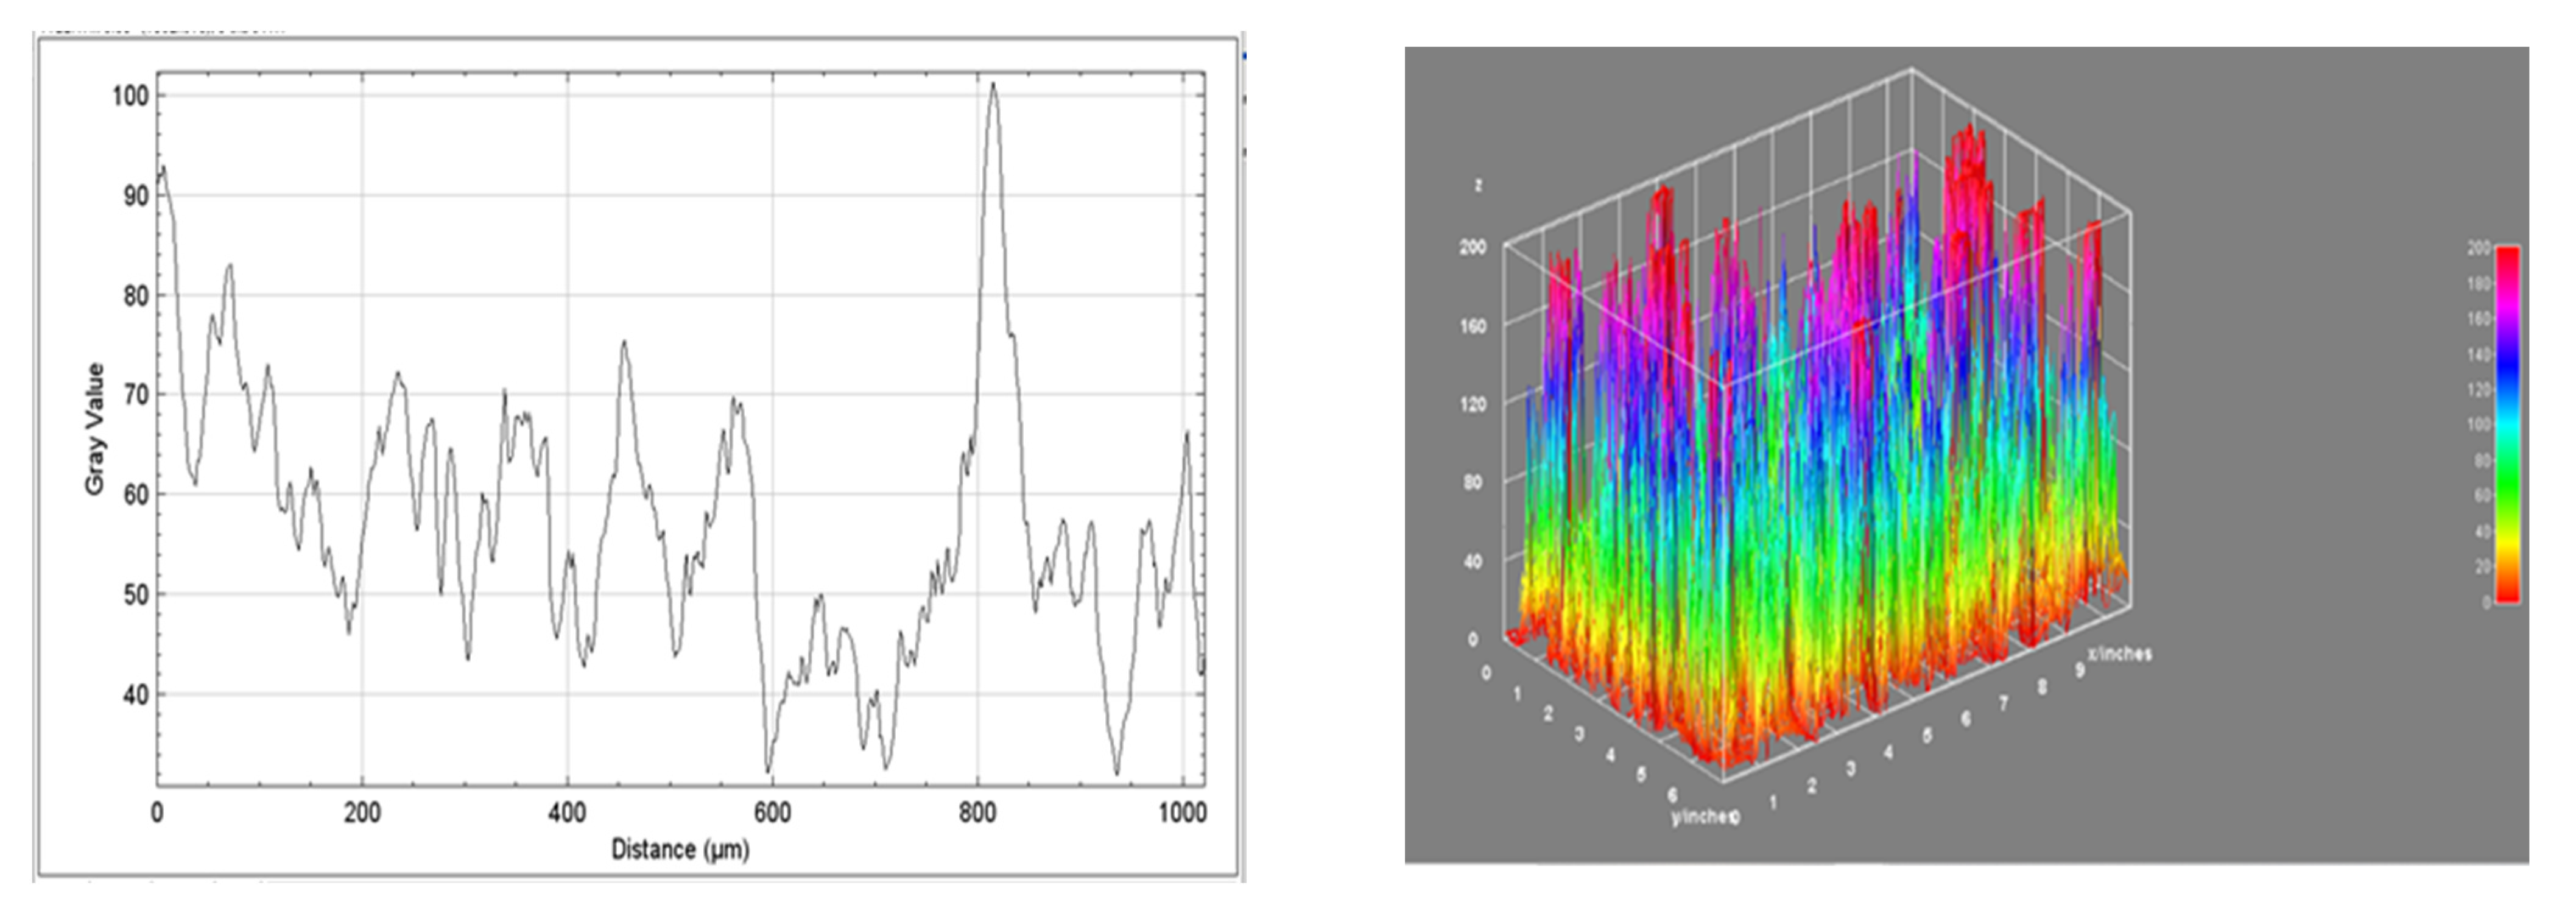
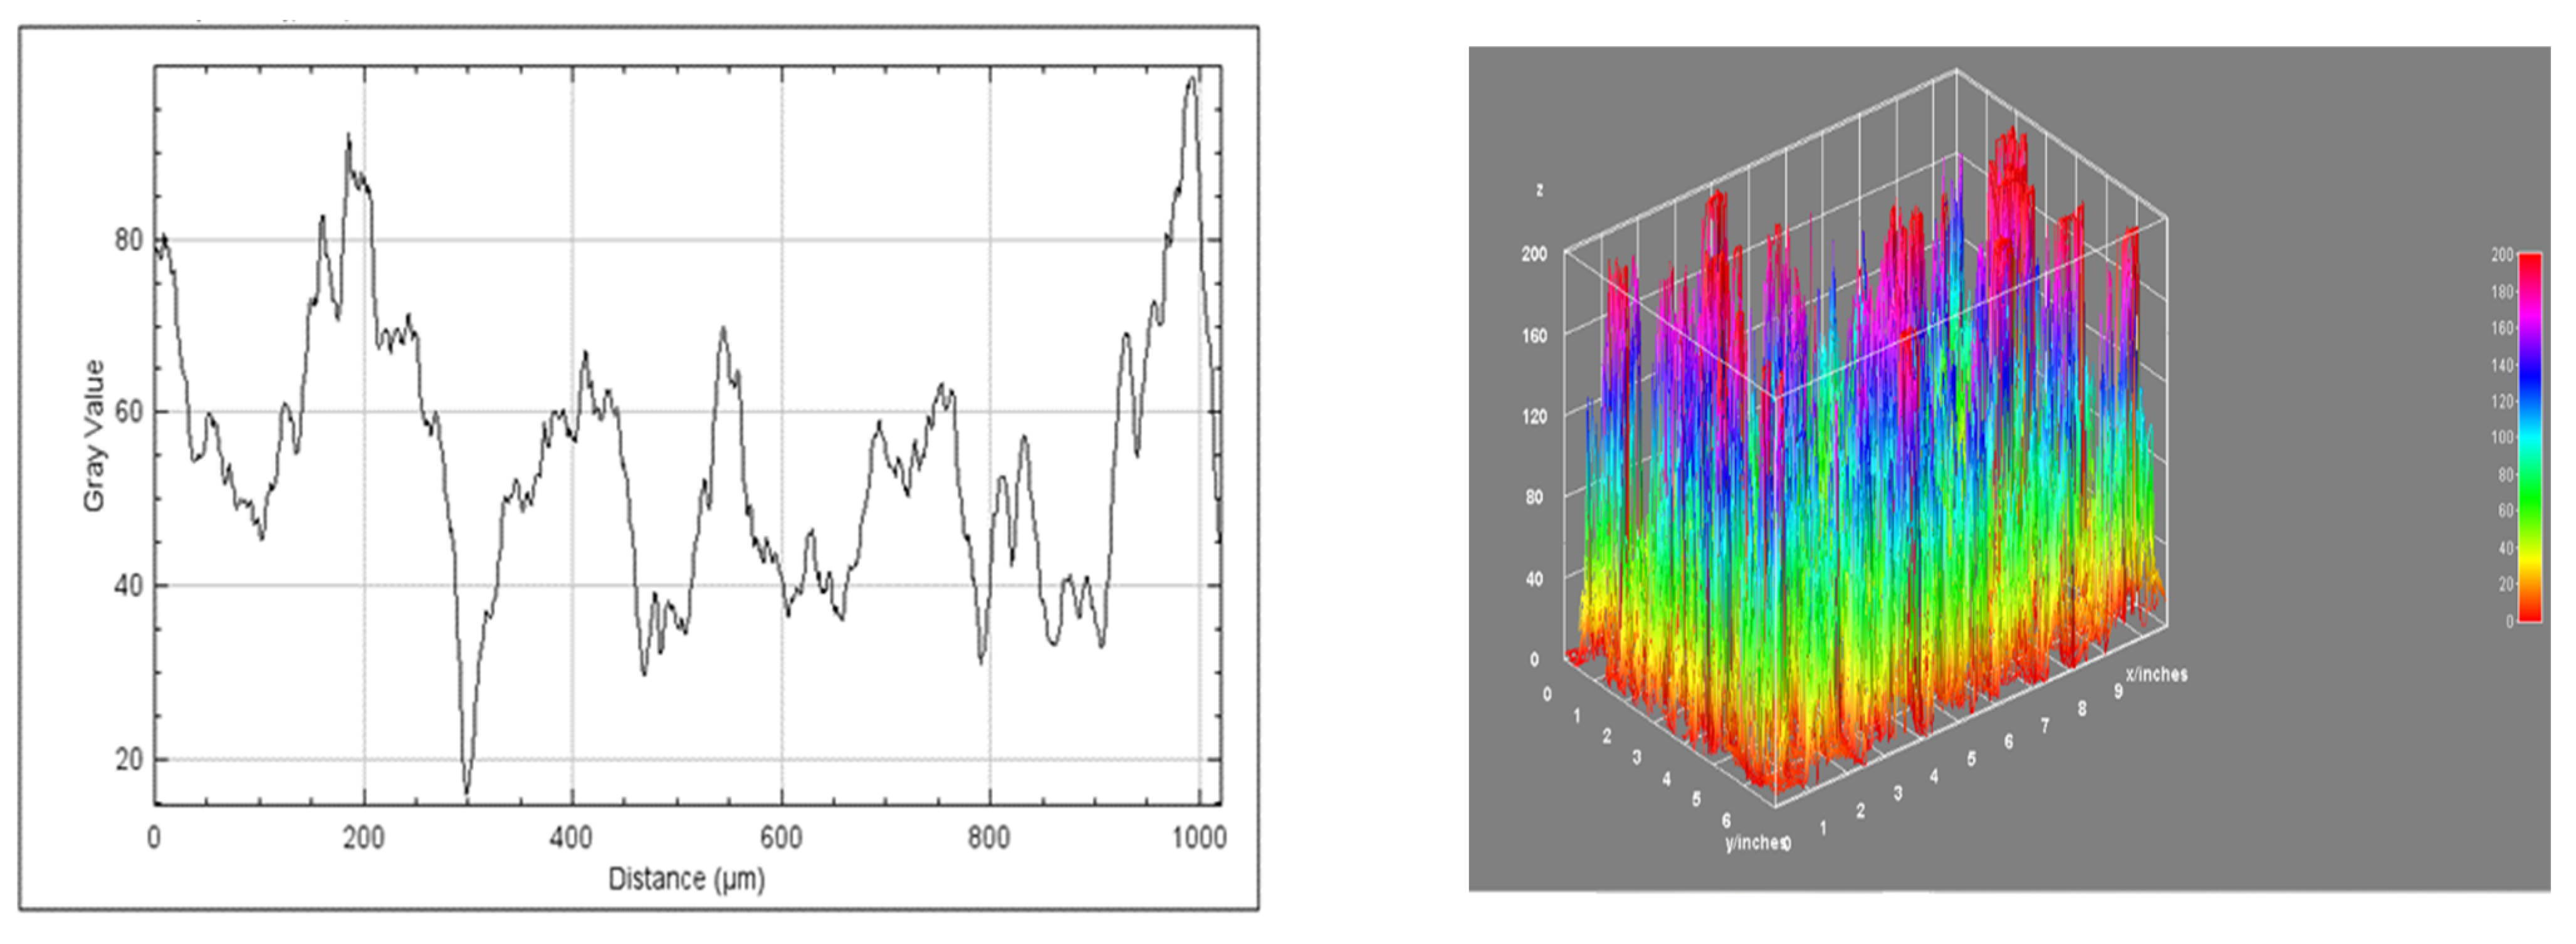
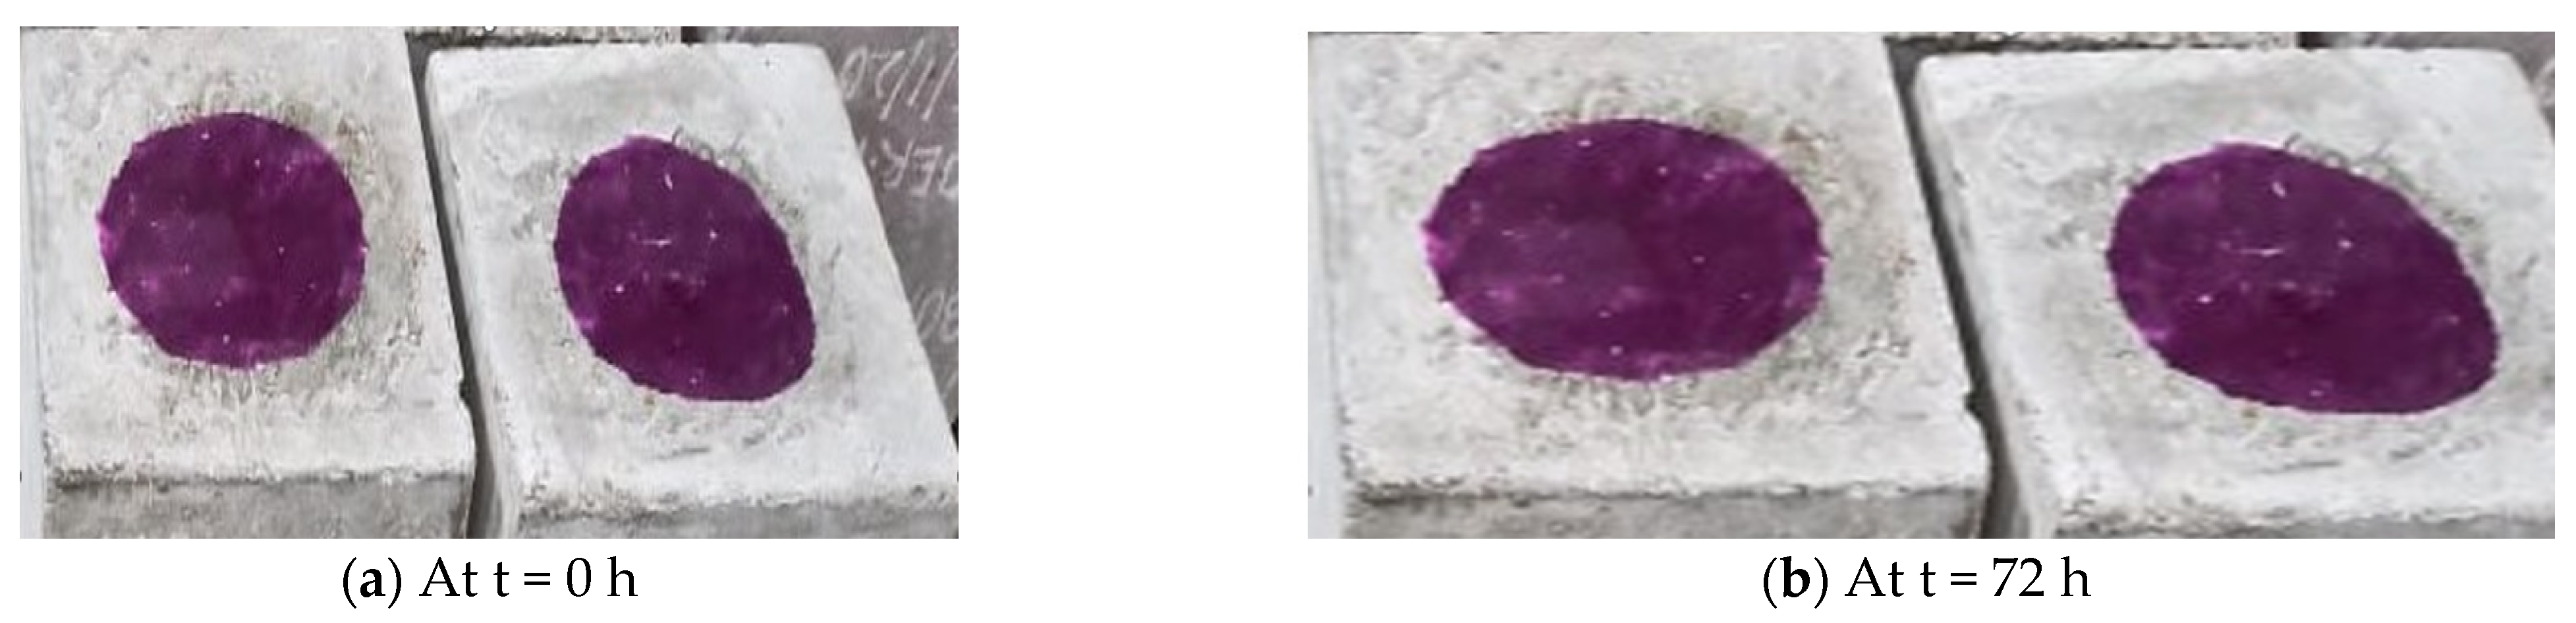
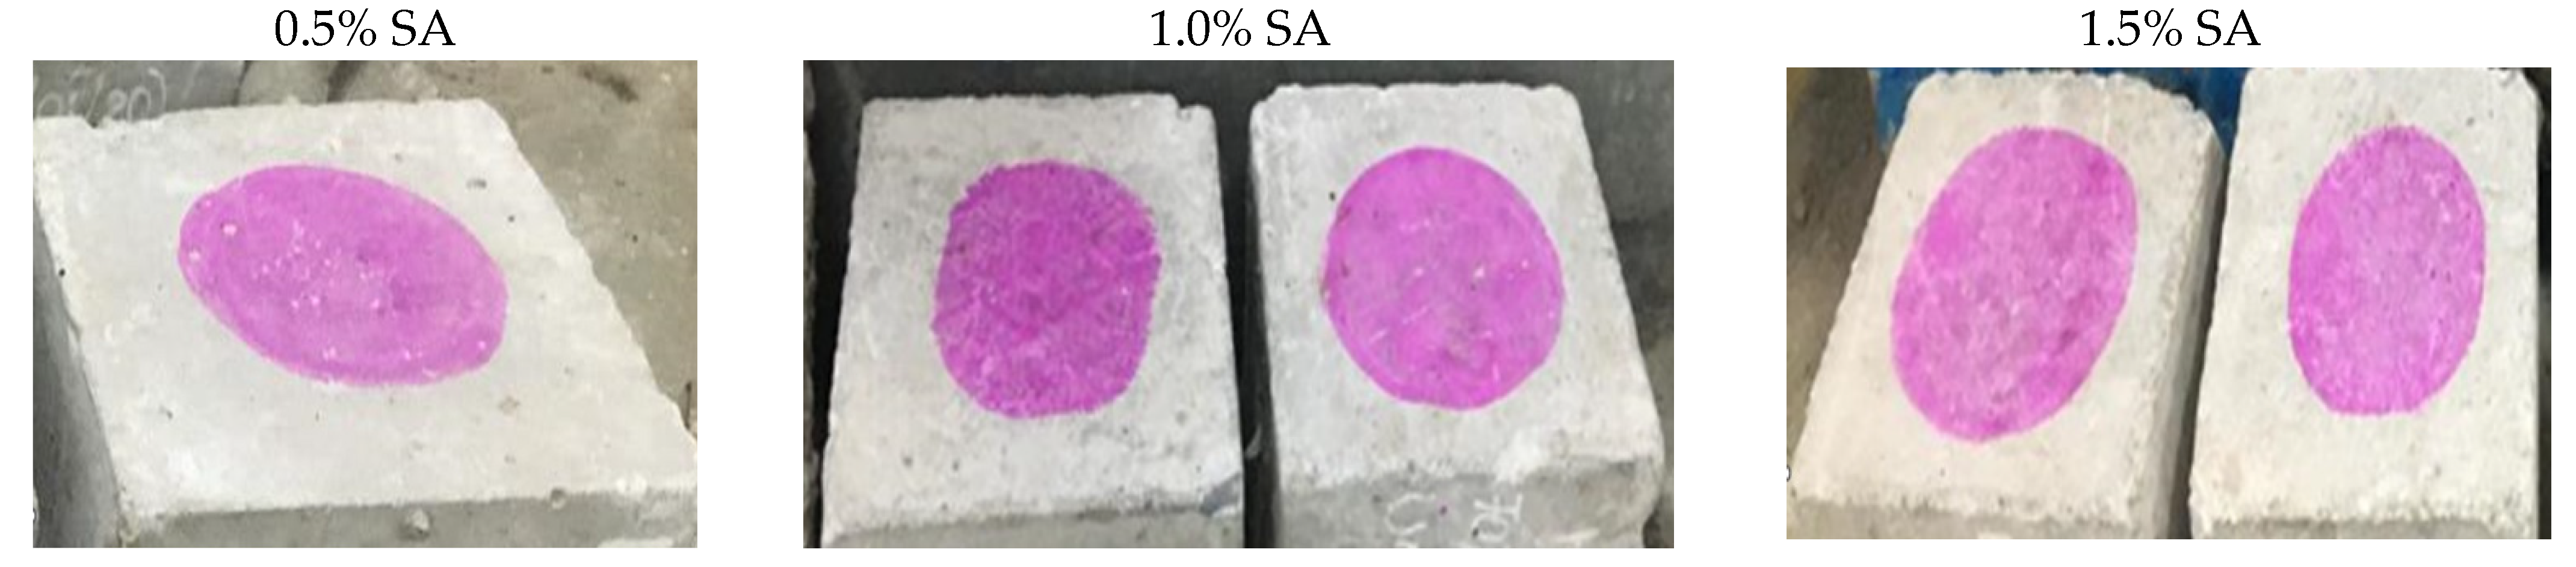
In this work, MD was used as a partial replacement for cement in different proportions, at 10%, 20%, and 30%, and the stearic acid is used as a surface coating at 0.5%, 1.0%, and 1.5% by weight of cement. The fresh concrete mixes were tested for workability with a slump cone test. Hardened concrete samples were tested for compressive strength, tensile strength, flexural strength, ultrasonic pulse velocity, density, Young’s modulus of elasticity, and self-cleaning property by discoloration test. These eco-friendly self-cleaning concrete samples were further characterized by SEM and EDX analysis.
A mix design of M25 grade was prepared using 53 grade ordinary Portland cement following IS 10262-2009 [39] and IS 12269-2013 [40] requirements and cast into the required samples. The fineness modulus of the fine aggregate used was 3.485 in the saturated surface dry (SSD) form, and the water absorption level of 2.3% with a specific gravity of 2.76, confirming it to be in zone II. The specific gravity of the coarse aggregate in the saturated surface dry form was 2.856, with a maximum size of 20 mm, confirming grading as per IS 383-1973 [
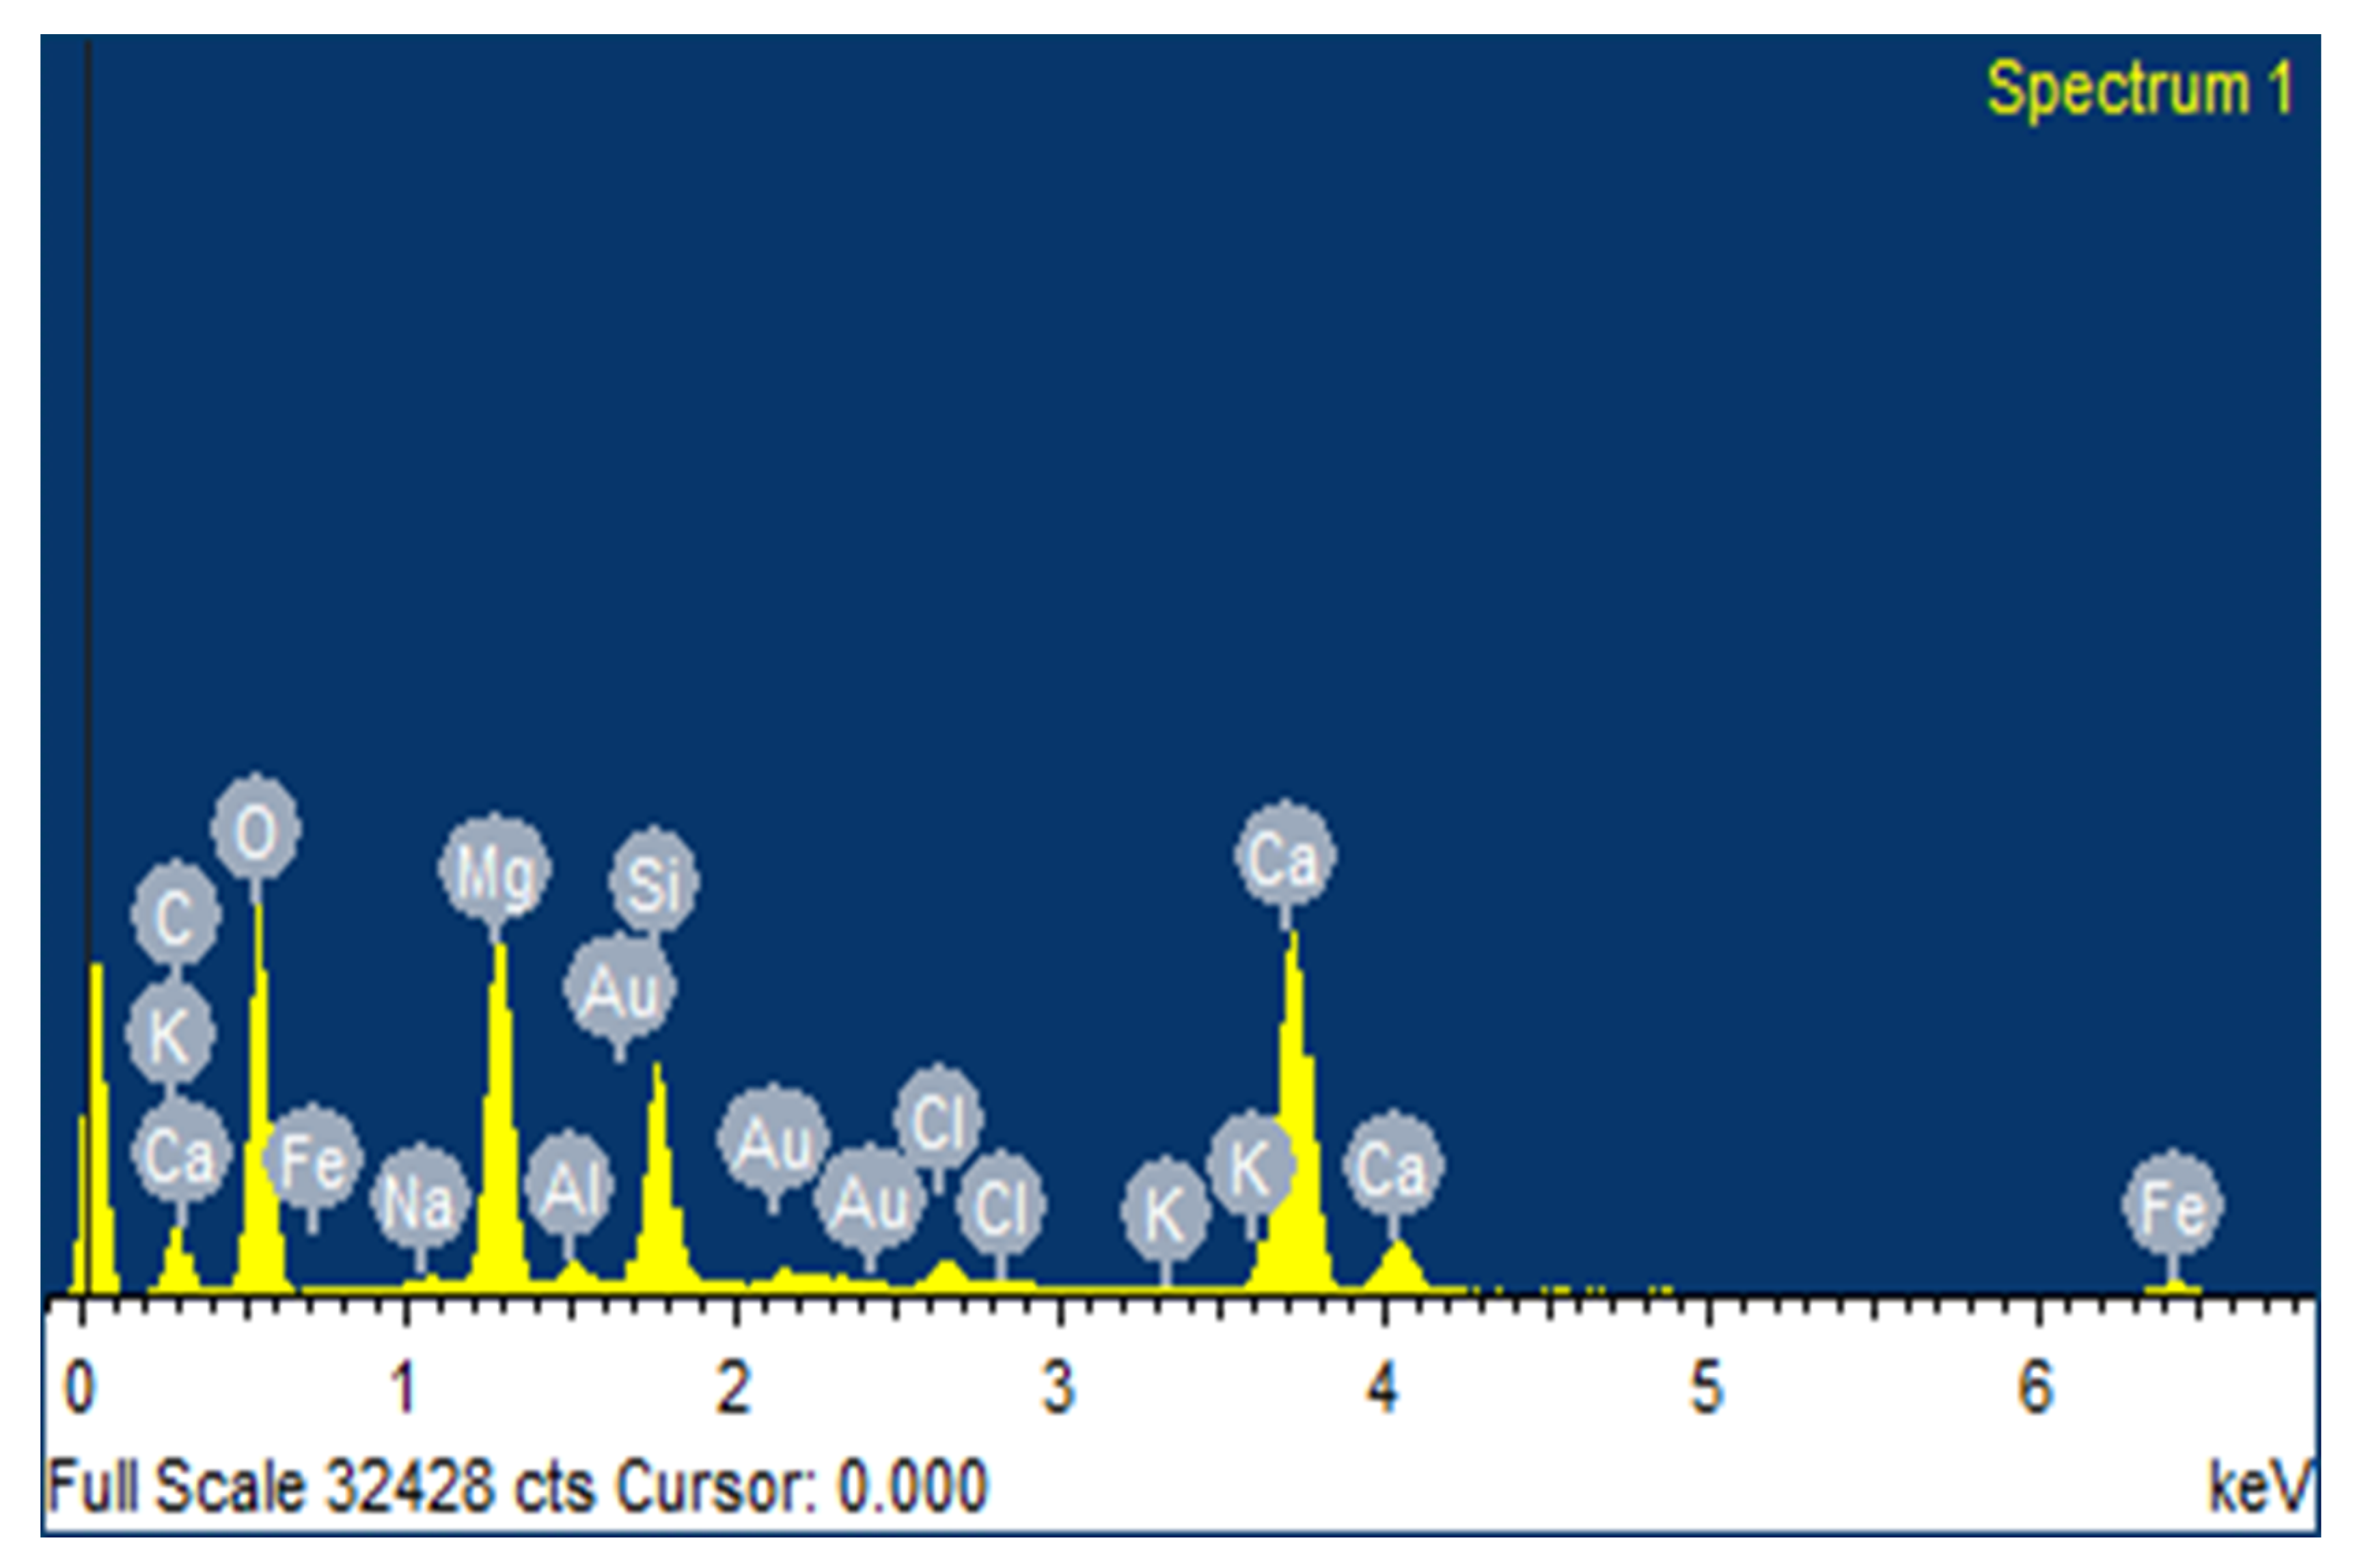
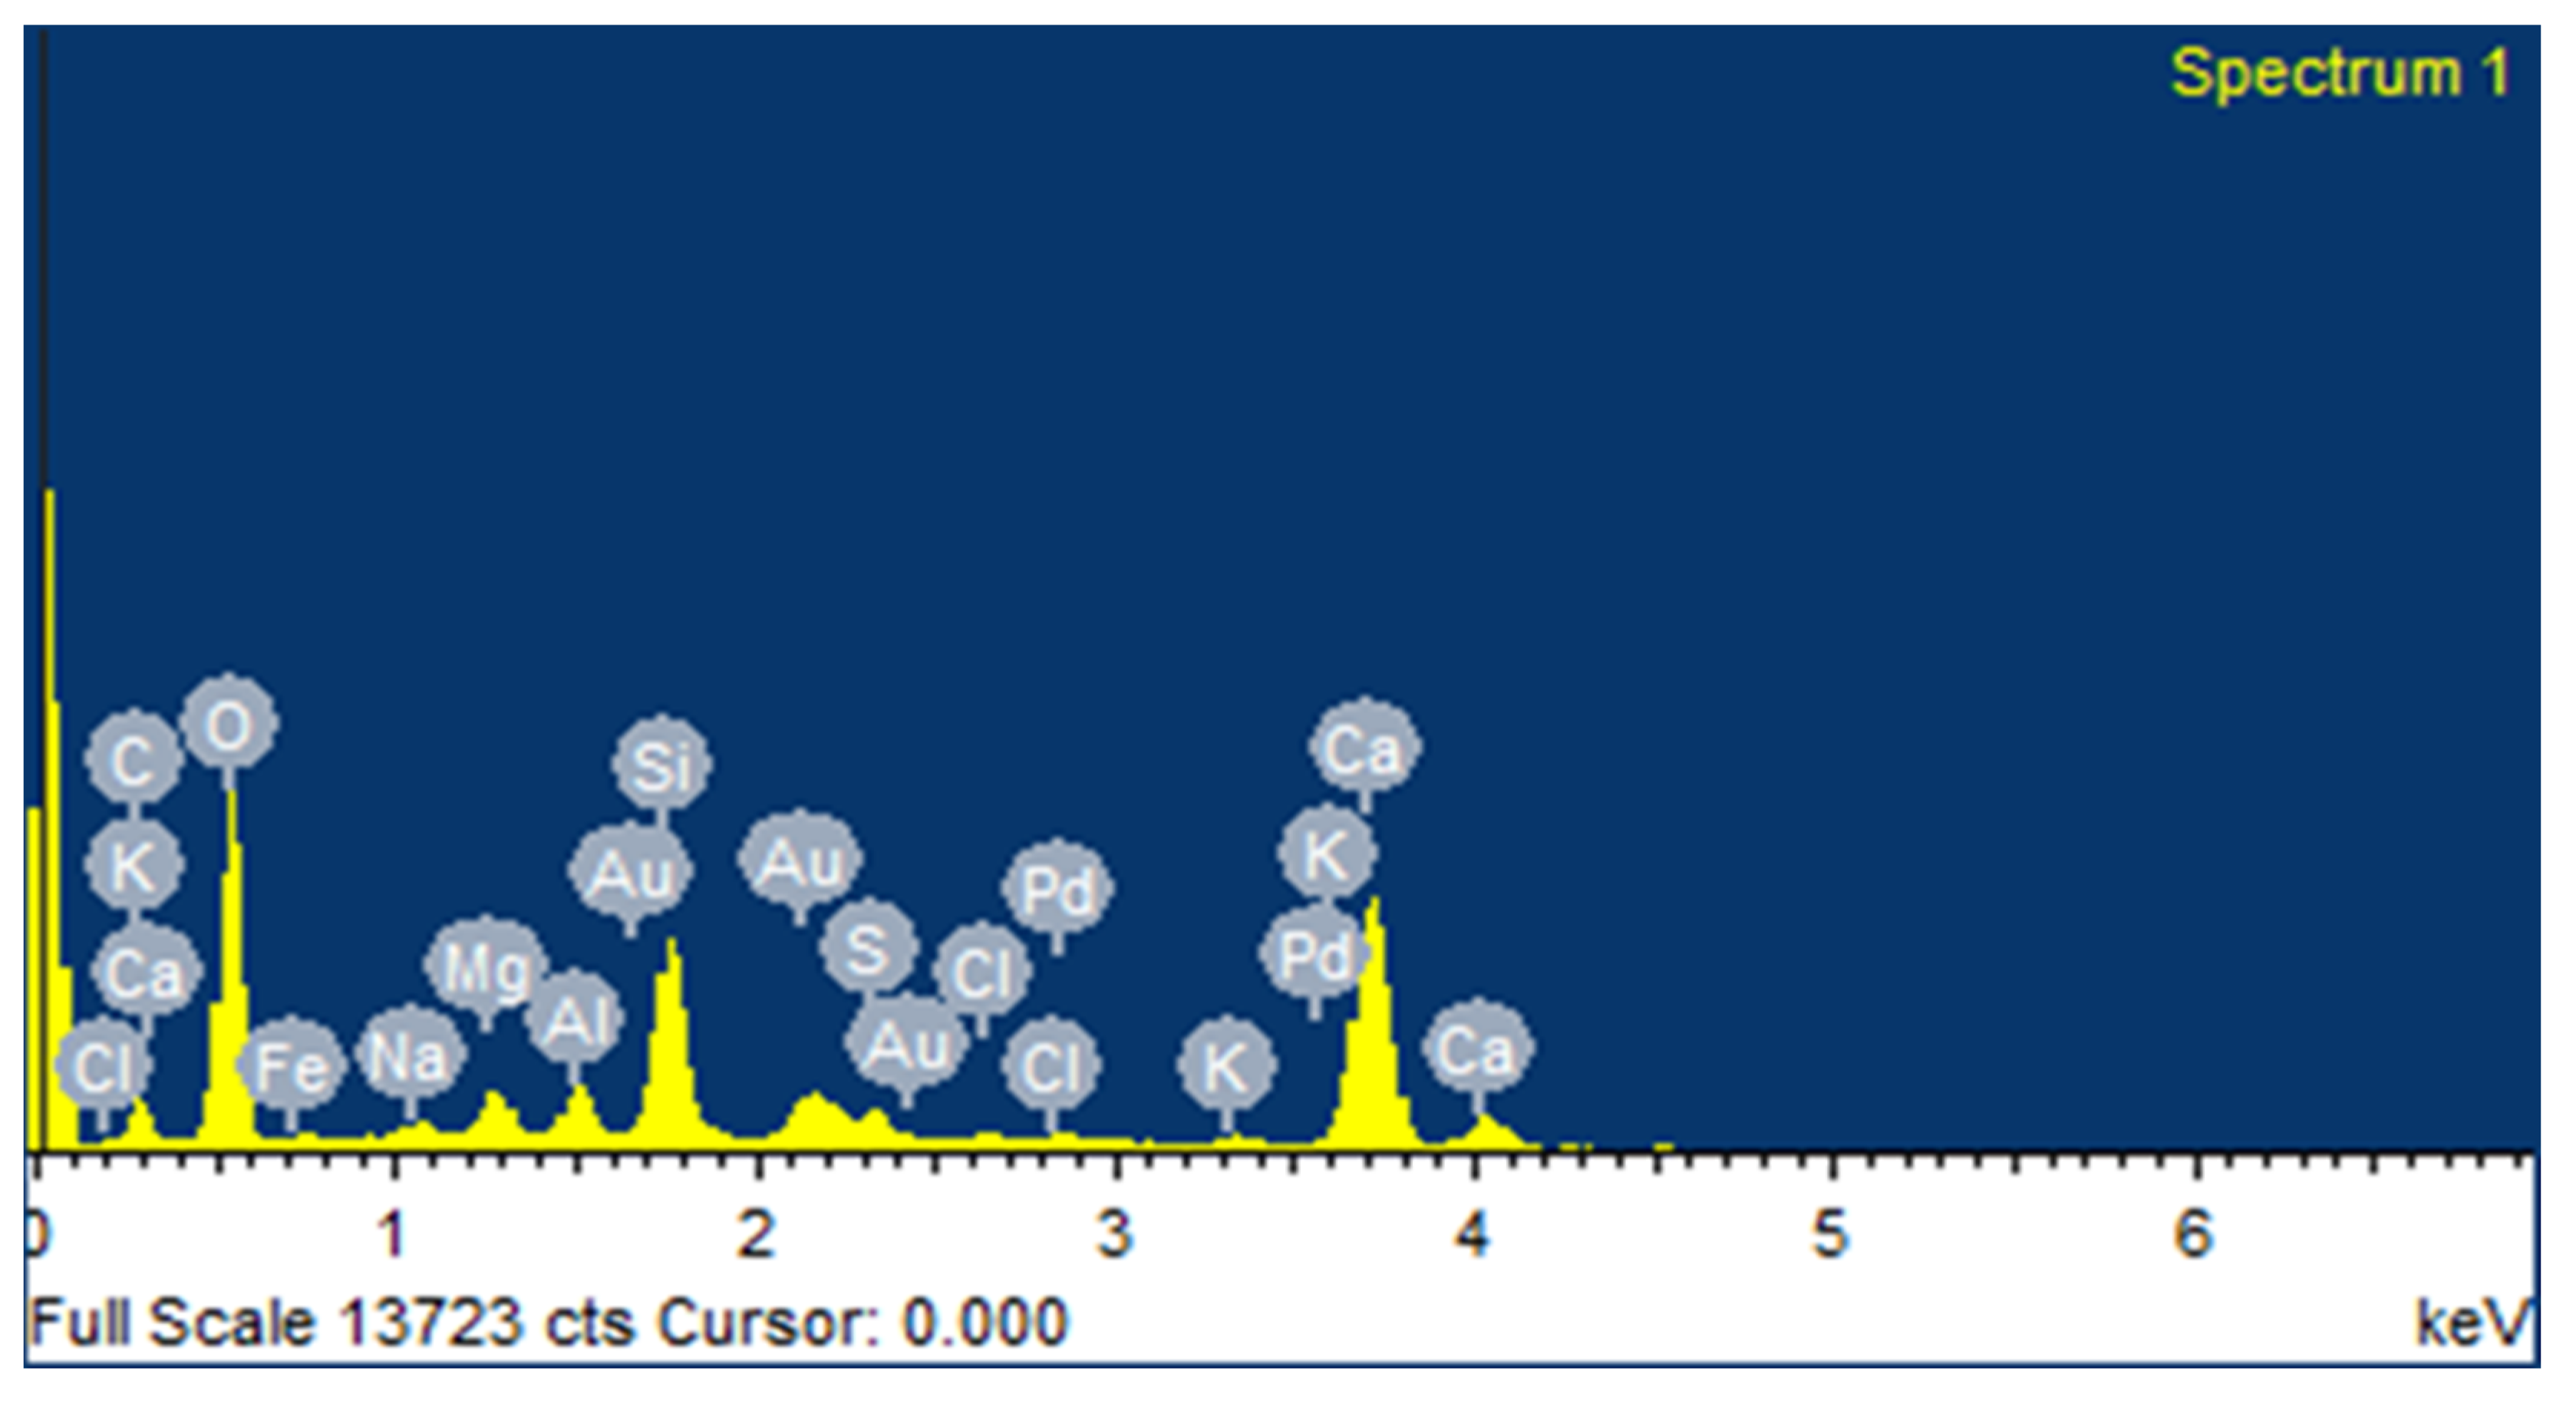
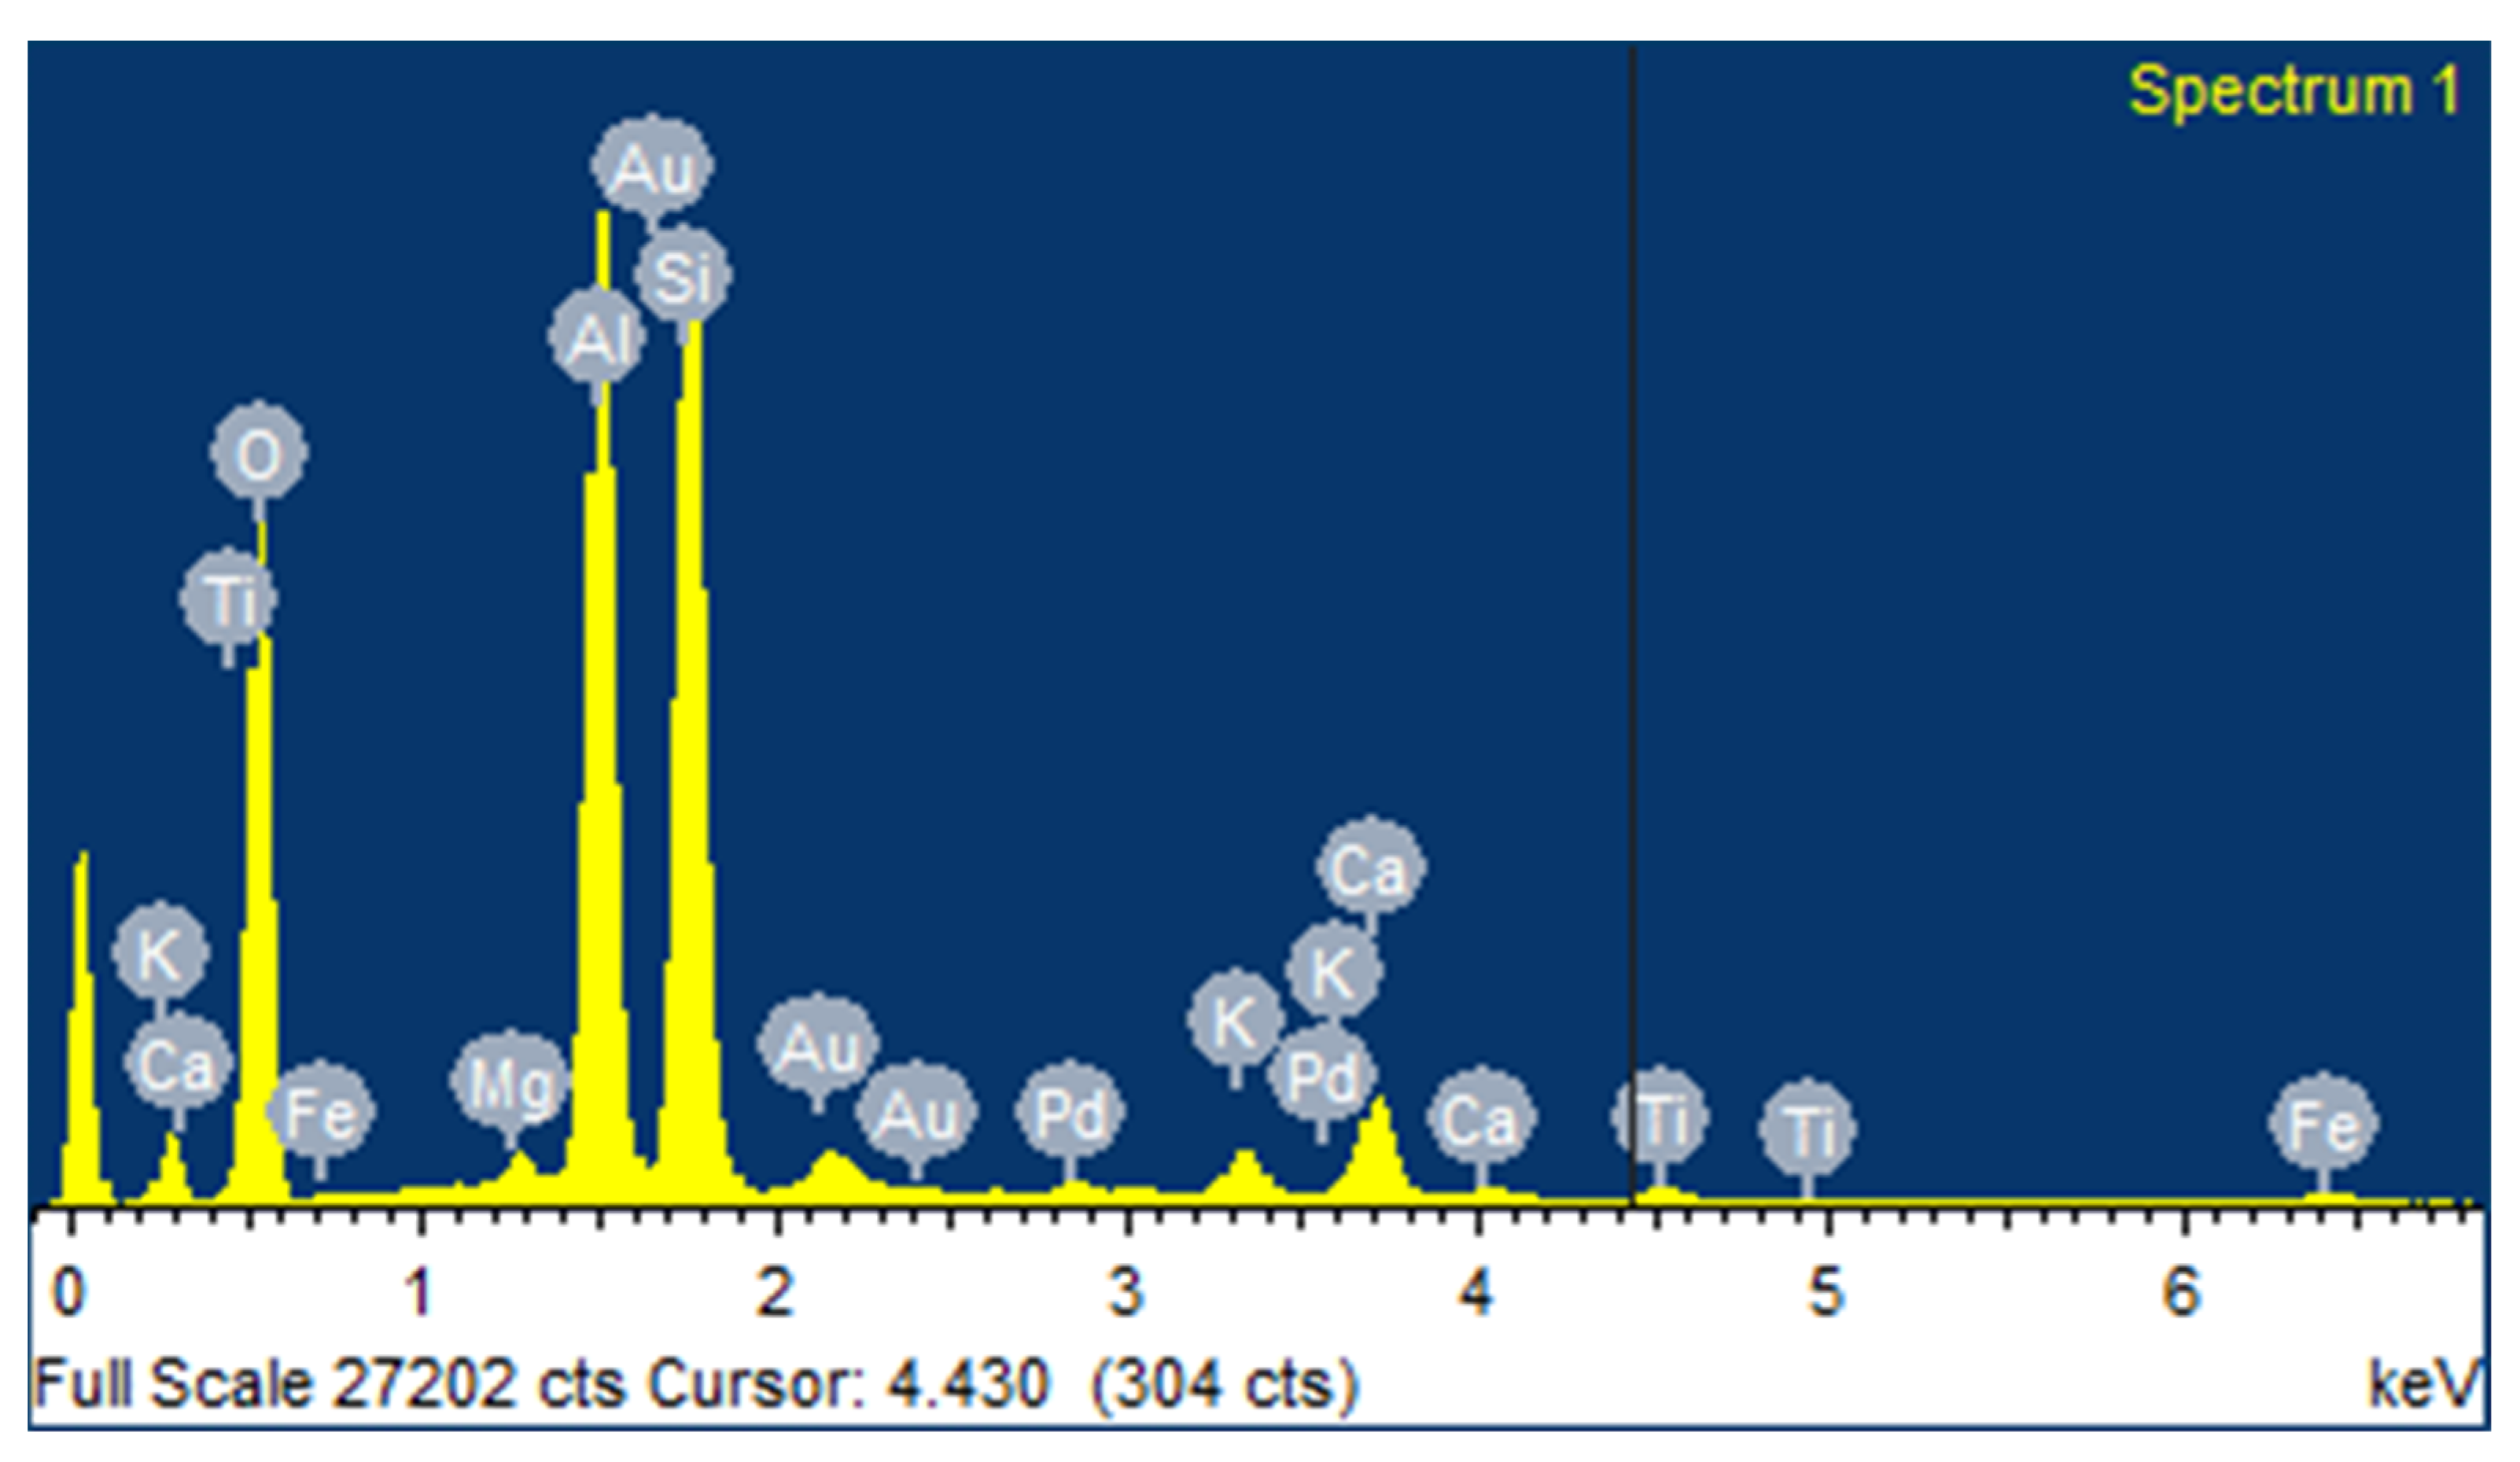
41]. The specific gravity of cement was 3.25, with a density of 3.10 g/cc. EDX analysis provides the chemical elements that constitute the marble dust as displayed in Table 1. The specific gravity of MD varied from 2.84 to 2.89, and density was found to be 1.96 g/cc.
The MD used in this study mainly consisted of calcium with major silicon, sodium, and magnesium traces, while aluminum, chlorine, potassium, and iron were present in minor amounts. It primarily comprises pozzolanic chemical compounds, including calcium oxide, silica, and alumina. Through EDX analysis, it was observed that the weight percentage of silica was 57.84% in the MD, which is the maximum as compared with other elements, as indicated in Table 1. The active SiO2 in waste marble powder reacts with the Ca(OH)2 in cement to form secondary calcium silicate hydrate, making it chemically stable and structurally dense concrete, as interpreted by Omar et al. [42], which leads to an increment in compressive strength. It possesses a strong binding property as a result of the interaction between calcite (CaCO3) and tricalcium aluminate (C3A), which results in calcium carboaluminates, as studied by Ulubeyli and Artir [43]. The SA (C18H36O2) used in this study has a density of 0.9408 g/cm3 and specific gravity of 0.847 g/mL at 20 °C. Stearic acid is a saturated fatty acid that can deposit on the surface. This acid is insoluble in water but soluble in acetone and toluene.

Mixing Proportions and Manufacturing of Concrete Specimens

For the manufacturing of self-cleaning concrete, different proportions of MD coated with different concentrations of SA were used to prepare thirteen mixes with a water-to-cement ratio (w/c) of 0.45. The surface coating of MD was performed by soaking it in SA solutions. For every 5 g of SA, 100 milliliters of a mixture of acetone and toluene (3:1 by volume) were used to dissolve it under steady stirring for 15 min. Coated MD was allowed to dry at room temperature for two days, and the solvents were then removed entirely by vacuum drying. The MD was coated with SA to induce a self-cleaning property in the proposed concrete.
To evaluate the workability of the concrete mixes, a slump test was conducted in accordance with IS:7320–1974 (reaffirmed 1999) [44]. The freshly mixed concrete was poured into designated molds, left to set at room temperature, and further cured for 28 days in water before testing.
The compressive, tensile, and flexural strength tests were performed as per the specifications of IS: 516-1959 [45]; three specimens for each mix were cast, and the results are reported as the average. Table 2 shows the mix proportions of all the SCC specimens.

3. Test Results

3.1. Fresh Properties

The slump of the fresh concrete of the control mix was observed to increase with SA content, as shown in Figure 1. This increase in slump value is due to the pearly or smoothening effect of SA (as it is a saturated fatty acid), which reduces the friction between the particles. The slump of the fresh concrete mix was observed to increase with 10% marble content and 0.5% and 1.0% of SA. MD particles are comparatively smooth; they fill in the voids and increase the cohesiveness of concrete.
On the other hand, the slump test shows that the addition of more than 10 percent marble dust has a detrimental impact on workability. This is due to the higher surface area of MD than that of the cement, resulting in an increase in internal friction with the increase in the replacement percentage. This may also be because marble dust adsorbs more water when the concrete is in fresh condition, as concluded by Rid et al. [46].

3.2. Hardened Properties

3.2.1. Compressive, Tensile, and Flexural Strength Tests, and Density, Modulus of Elasticity, and UPV Tests of Hardened Concrete

Table 3 shows the test results of the compressive, tensile, and flexural tests with the density, modulus of elasticity, and ultrasonic pulse velocity tests performed on the hardened concrete specimens of the SCC.
From the results of the tests, it can be inferred that M4 exhibits the highest compressive, tensile, and flexural strengths with values of 36.6 MPa, 4.7 MPa, and 9.7 MPa, respectively, as compared to the control mix. This is attributed to the fact that M4 comprises 10% replacement of cement with MD and 0.5% of SA, resulting in 12.68%, 21.71%, and 16.73% increase in compressive, tensile, and flexural strength. These results indicate that the addition of MD and SA to concrete could reduce the micro-voids and enhance the pozzolanic reaction, resulting in the formation of C-S-H gels that improve the binding property. The above results agree with the findings of Vardhan et al. [46]. However, it was observed that increasing the replacement level of cement with MD to 20% and 30% does not affect the hydration process, which leads to a significant decrease in compressive strength.
M2 (i.e., with the 0% replacement of cement with MD and 1.0% coating of SA) shows higher values of UPV and Young’s modulus of elasticity of the concrete as compared to all the mixes. According to IS 13,311 (Part 1) (1992) [47], when the UPV values are above 4.5 km/s, the concrete is said to be of good quality. The marginal decrease in the UPV values of the remaining mixes in the presence of the MD and SA may be because of greater porosity and low bonding of cement particles with MD. On the other hand, M5 possesses the maximum density of the concrete as compared to the control mix and all other different mixes. It is observed from the test results that further addition (20% and 30%) of MD in the concrete leads to a significant decrease in the density of concrete because the density of MD and SA is lower than that of cement.

3.2.2. Characterization of SCC Specimens

The EDX analysis results of concrete containing cement and MD are shown in Figure 2, Figure 3 and Figure 4 respectively. Table 4 shows the element weight percentage of MD and the mixes with partial replacement of cement with MD at 10%, 20%, and 30%.
The EDX patterns of the SCC show the presence of CaCO3, SiO2, Albite, MgO, Al2O3, KCl, Feldspar, and Wollastonite. Marble dust, also known as limestone powder, contains 60% calcium as the oxide observed upon analysis. The presence of SiO2 silicious material in the EDX graphs of marble dust is maximum with an element weight percentage of 57.84% which is reduced considerably to 59.29% in M6 and 54.66% and 51.45% in M9 and M12, as shown in Figure 2, Figure 3 and Figure 4. This is one of the reasons for the decrement in the compressive strength of concrete with the decrease in the percentage of silica, validated by EDX results. Another reason for the decrement in the compressive strength is the increase in the percentage of CaCO3 in M9 (6.3%) and M12 (6.98%) as compared to M6 (3.07%), as the concrete with the CaCO3 addition exhibits lower strength as compared with concrete without it. Thus, EDX analysis is in good agreement with the experimental test results.
The SEM images of marble dust and cement at a magnification of 20KX are shown in Figure 5 and specimens containing 10%, 20%, and 30% MD at 28 days are shown in Figure 6. The plot profile and interactive surface plot of SEM images of M6, M9, and M12 are given below in Figure 7, Figure 8 and Figure 9.
The SEM test was conducted to assess the microscopic structure of concrete and the effect of utilizing MD and SA on the physical and chemical structure of concrete. It was observed that when MD is added to cement, its particles effectively fill the pores, reducing the frequency of microcracks and enhancing the compressive strength of concrete. Due to the presence of CaCO3, the minute particles of MD can contribute to the adhesive properties of the cement matrix, while larger particles of MD powder contribute to the compressive strength of concrete. The SEM image clearly indicates that the combination of cement and MD effectively bridges and fills the cement mortar’s pores. The threshold and outline of microstructures of the specimens containing 10%, 20%, and 30% MD at 28 days are shown in Figure 6. The cement matrix surrounds the MD particles, and the specimen with 30% MD structures is more consolidated with a more uniform structure consisting of tiny particles bound together with limited porosity. This supports the denser microstructure observed in the specimens containing MD as compared to the control concrete specimen. MD particles are smaller than those of cement, providing a filling action that densifies and compacts the microstructure of concrete, enhancing its strength. The MD particles spread uniformly throughout the concrete matrix.
As the amount of MD in the concrete increases, the material becomes denser and more compact. This is interpretable through the SEM images’ plot profiles and interactive surface plots, as shown in Figure 7, Figure 8 and Figure 9. The plot profile shows the intensity of the gray values of the SEM images per unit length (in µm). The interactive surface plots of M6, M9, and M12 show the spectrum analysis of the SEM images indicating the density of solid formations in the samples. Table 5 shows the particle analysis of the SEM images. M12 possesses a denser structure with the maximum number of counts, i.e., 782 as compared to M6 and M9, which have 532 and 372 counts, respectively. This is because of the presence of 30% MD in M12, which is finer (having a larger surface area) than cement, leading to denser and more compact concrete formation.

3.2.3. Self-Cleaning Property of Concrete

The self-cleaning property of the concrete is determined using a discoloration test, which involves applying a chemical called rhodamine B (RhB) dye. The dye is in powder form, and a solution with a concentration of 0.005 g/l is prepared by dissolving 1.5 mg of rhodamine B powder in 30 mL of distilled water. The fresh solution is then applied to the surface of hardened concrete cube samples of different proportions. The changes in color or discoloration are then monitored and noted progressively over time. Figure 10a depicts the application of rhodamine B dye on the surface of the M0 concrete sample at t = 0 h, and Figure 10b shows the discoloration of M0 at t = 72 h.

Visual Inspection

The self-cleaning property of concrete with SA-coated MD is determined by observing the discoloration through surface inspection. The repelling property of the concrete is assessed by the fading of the color that has been applied on all the hardened concrete samples (28 days after casting). Figure 10b shows the discoloration of rhodamine B dye on the hardened concrete surfaces of the M0 specimen. Upon visual inspection, it was observed that M0 shows negligible discoloration as compared to M10, M11, and M12. Figure 11 depicts the discoloration of rhodamine B dye on the hardened concrete surfaces of the M10, M11, and M12 specimens at t = 72 h. After 72 h of coloration on the concrete samples, the specimen with the maximum fading of color shows the best self-cleaning property of concrete. After 3 days of observation (72 h), M12, the concrete mix containing 30% of MD and 1.5% of SA coating, shows a better water-repelling property compared to the control mix. This is due to the presence of a maximum percentage of stearic acid in the concrete and calcium carbonate in the MD which is white in color. Hence, both these factors contributed to M12 having the best self-cleaning property.

4. RSM Analysis

Response surface methodology (RSM) is a mathematical and statistical technique of experimental design in which a group of independent variables, known as the input factors, affects the outcome of the dependent variables, known as the response variables, as studied by Abdulkadir et al. [48] and Murali et al. [49]. In concrete technology, the independent variables are usually the mixed ingredients, while the responses are the concrete properties of interest. When using RSM for concrete, three distinct steps are involved: (a) performing a series of experimental runs to collect empirical response data, (b) developing response surface models and using analysis of variance (ANOVA) to test their reliability and validity, and (c) optimization.
Hence, the analysis involves selecting a suitable mathematical model that adequately reflects the relationship between the input and output variables, as concluded by Al-Fakih et al. [50], Balqis et al. [51], Choo et al. [52], Mohammed et al. [53], and Mohammed et al. [53,54]. Different design configurations can be chosen to perform the RSM analysis, including the central composite design (CCD), the Box–Behnken design (BBD), the user-defined design (UDD), etc. The UDD option was chosen as the most suitable in this experiment based on the experimental runs conducted and the responses generated. Table 6 shows the input variables and their limits used in the experiment, while Table 7 shows the experimental runs based on the varying combinations of the input factors and their corresponding response values. The research only focused on nine mixes (M4 to M12), as these are the only mixes that contain the main input variables (MD and SA).
Based on the response data, the influence of the input factors can be mathematically modeled using either linear or higher-order polynomials as represented in general forms by Equations (1) and (2).
y = β 0 + β i x i + β 2 x 2 + β n x n +
y = β 0 + i = 1 k β i x i + i = 1 k β i i x i 2 + j = 2 k i = 1 j = 1 β i j x i x j +
where y is the desired response, i and j are the linear and quadratic coefficients, b is the regression coefficient, k is the number of variables to be investigated and optimized, and ε is the random error.

4.1. Response Surface Models and ANOVA

The developed predictive response models are shown in Equations (3)–(9). The equations are represented in coded factors of the variables which range from −1 to +1, where the lowest value of the variable is represented by −1, the intermediate value is represented by 0, and the highest value is represented by +1. In addition, the input variables MD and SA are represented by x 1 and x 2 , while the responses are represented by SV (slump value in mm), CS (compressive strength in MPa), TS (tensile strength in MPa), FS (flexural strength in MPa), UPV (ultrasonic pulse velocity in m/s), D (density in kg/m3), and ME (modulus of elasticity in × 106 MPa). SV, CS, TS, and FS were all fitted with a linear model while quadratic models were found more suitable for CS, UPV, D, and ME.
S V = + 136.11 11.67 x 1 13.33 x 2
C S = + 29.24 5.16 x 1 1.77 x 2 + 0.15 x 1 x 2 + 0.34 x 1 2 0.8 x 2 2
T S = + 4.26 0.16 x 1 0.2 x 2
F S = + 7.98 1.39 x 1 0.65 x 2
U P V = + 5268.71 112.97 x 1 + 34.8 x 2 43.65 x 1 x 2 337.07 x 1 2 203.87 x 2 2
D = + 2643.29 33.83 x 1 + 2.72 x 2 14.45 x 1 x 2 38.27 x 1 2 33.83 x 2 2
M E = + 6.20 0.3 x 1 + 0.082 x 2 0.12 x 1 x 2 0.81 x 1 2 0.51 x 2 2
Analysis of variance (ANOVA) was used to verify the models at a 0.1 level of significance corresponding to a 90% confidence interval. For this reason, any model or model term with a probability (p-value) of less than 1% is considered significant, and insignificant for any model or model term with a p-value of greater than 0.1. Table 8 shows the summary of the ANOVA, where the significance status of each model and model term is presented. For example, the p-value for the SV model is more than 0.781, which is less than 0.1, hence the model is significant. However, the model term represented by x1 (MD) is not significant (0.1111), which shows that the MD has less effect on the slump value of the concrete compared to the effect of the SA, which is significant due to its p-value of less than 0.1 (0.0768). Generally, most of the developed models are significant except for TS, whose p-value exceeds 0.1. Additional assessment using the model validation parameters, as presented in Table 9, is necessary to understand whether the models are strong enough to be used for the navigation of the design space.
One of the most important model validation parameters is the coefficient of determination (R2). R2 evaluates the strength of the correlation between the model and the dependent variable on a scale of 0–100%, as studied by Abdulkadir et al. [55]. It gives an idea of how well the model fits the data. In this case, the R2 values for all the developed models ranged between 16% and 100%. While a low R2 indicates a low fit between the developed model and the response data, it is not always an indication of a problem with the data. The adequate precision value is used to assess the signal-to-noise ratio, and a value of more than 4 is desirable. All the developed models have an adequate precision value of more than 4.

4.2. Model Diagnostic Plots

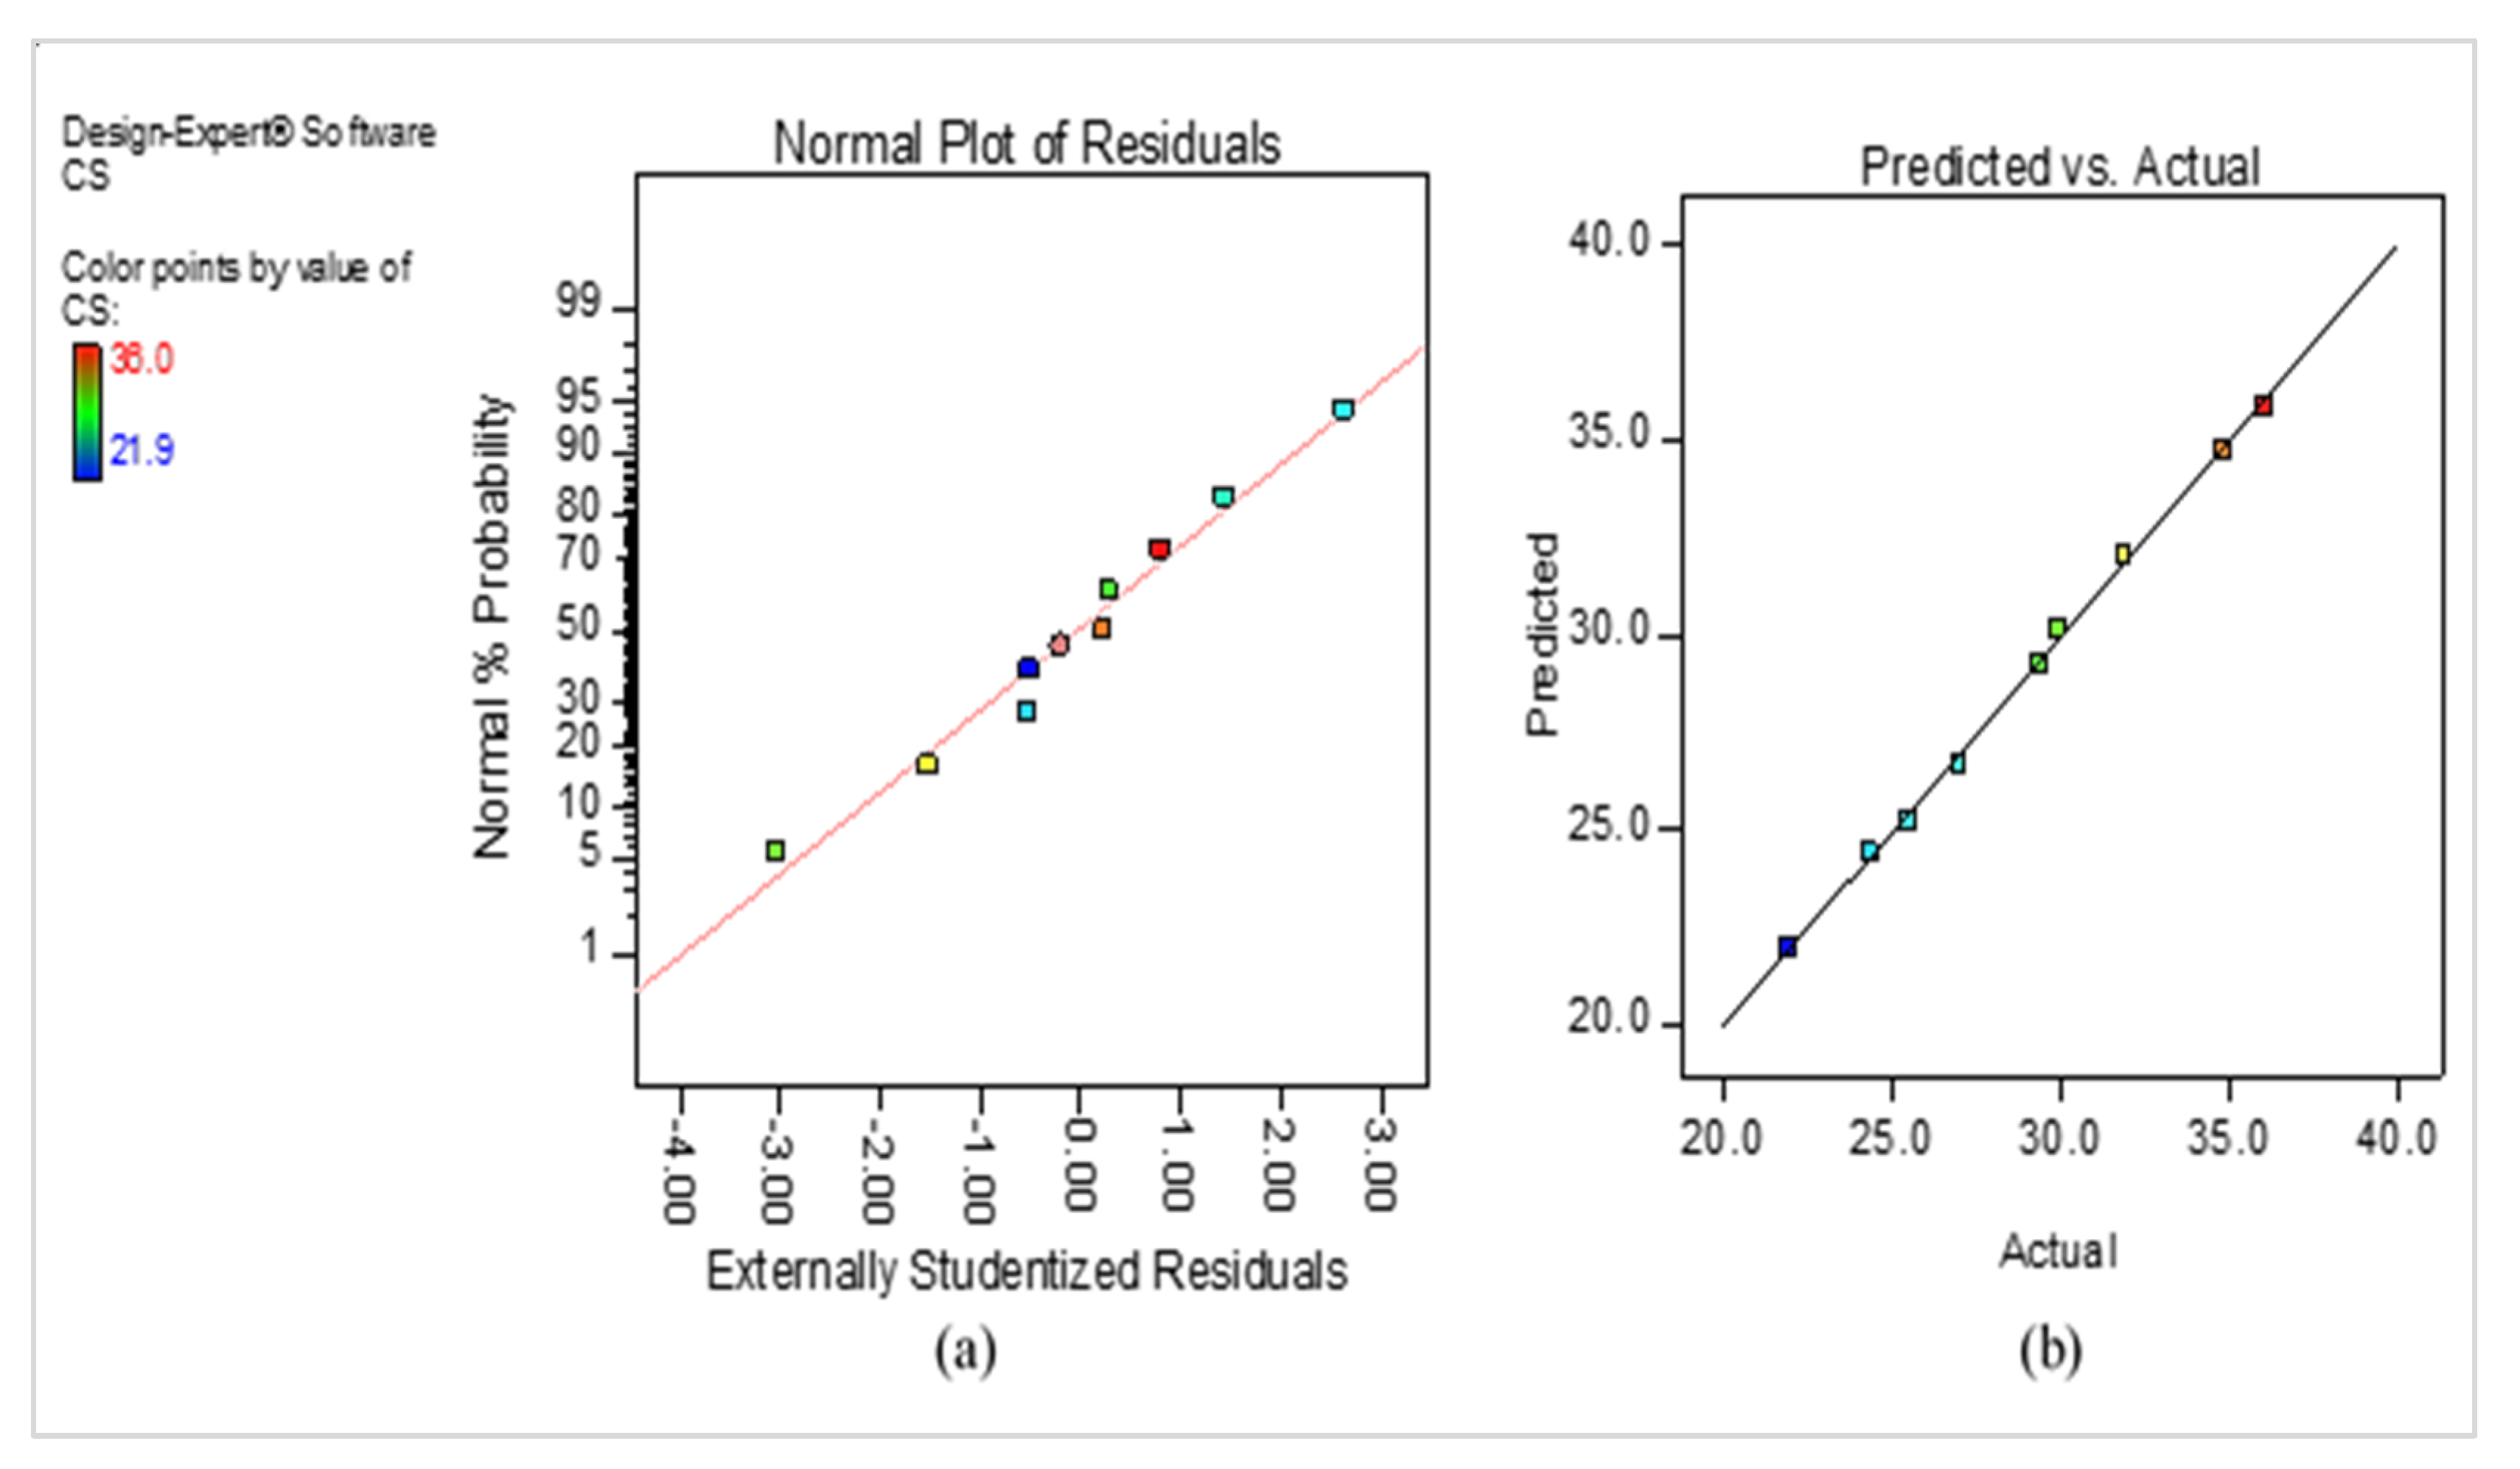
Furthermore, the strength of the developed models can be assessed using the model diagnostic tools. Two of the most important of these tools are the normal plot of residuals and the actual versus predicted plots. The normal plot of residuals assesses whether the error terms are normally distributed, which is indicated by more than 90% of the data points lying between −2 to +2 of the externally studentized residuals. On the other hand, the actual versus predicted plot shows how the results of the predicted responses correlate with the experimental results. The plot assesses the fit of the developed model and the variation resulting from random effects. Hence, the alignment of the data points shows the strength of the models. These conditions are satisfied by all the developed models. As an example, the diagnostic plots for the SV and CS models are shown in Figure 12 and Figure 13, respectively.

4.3. Model Graphs

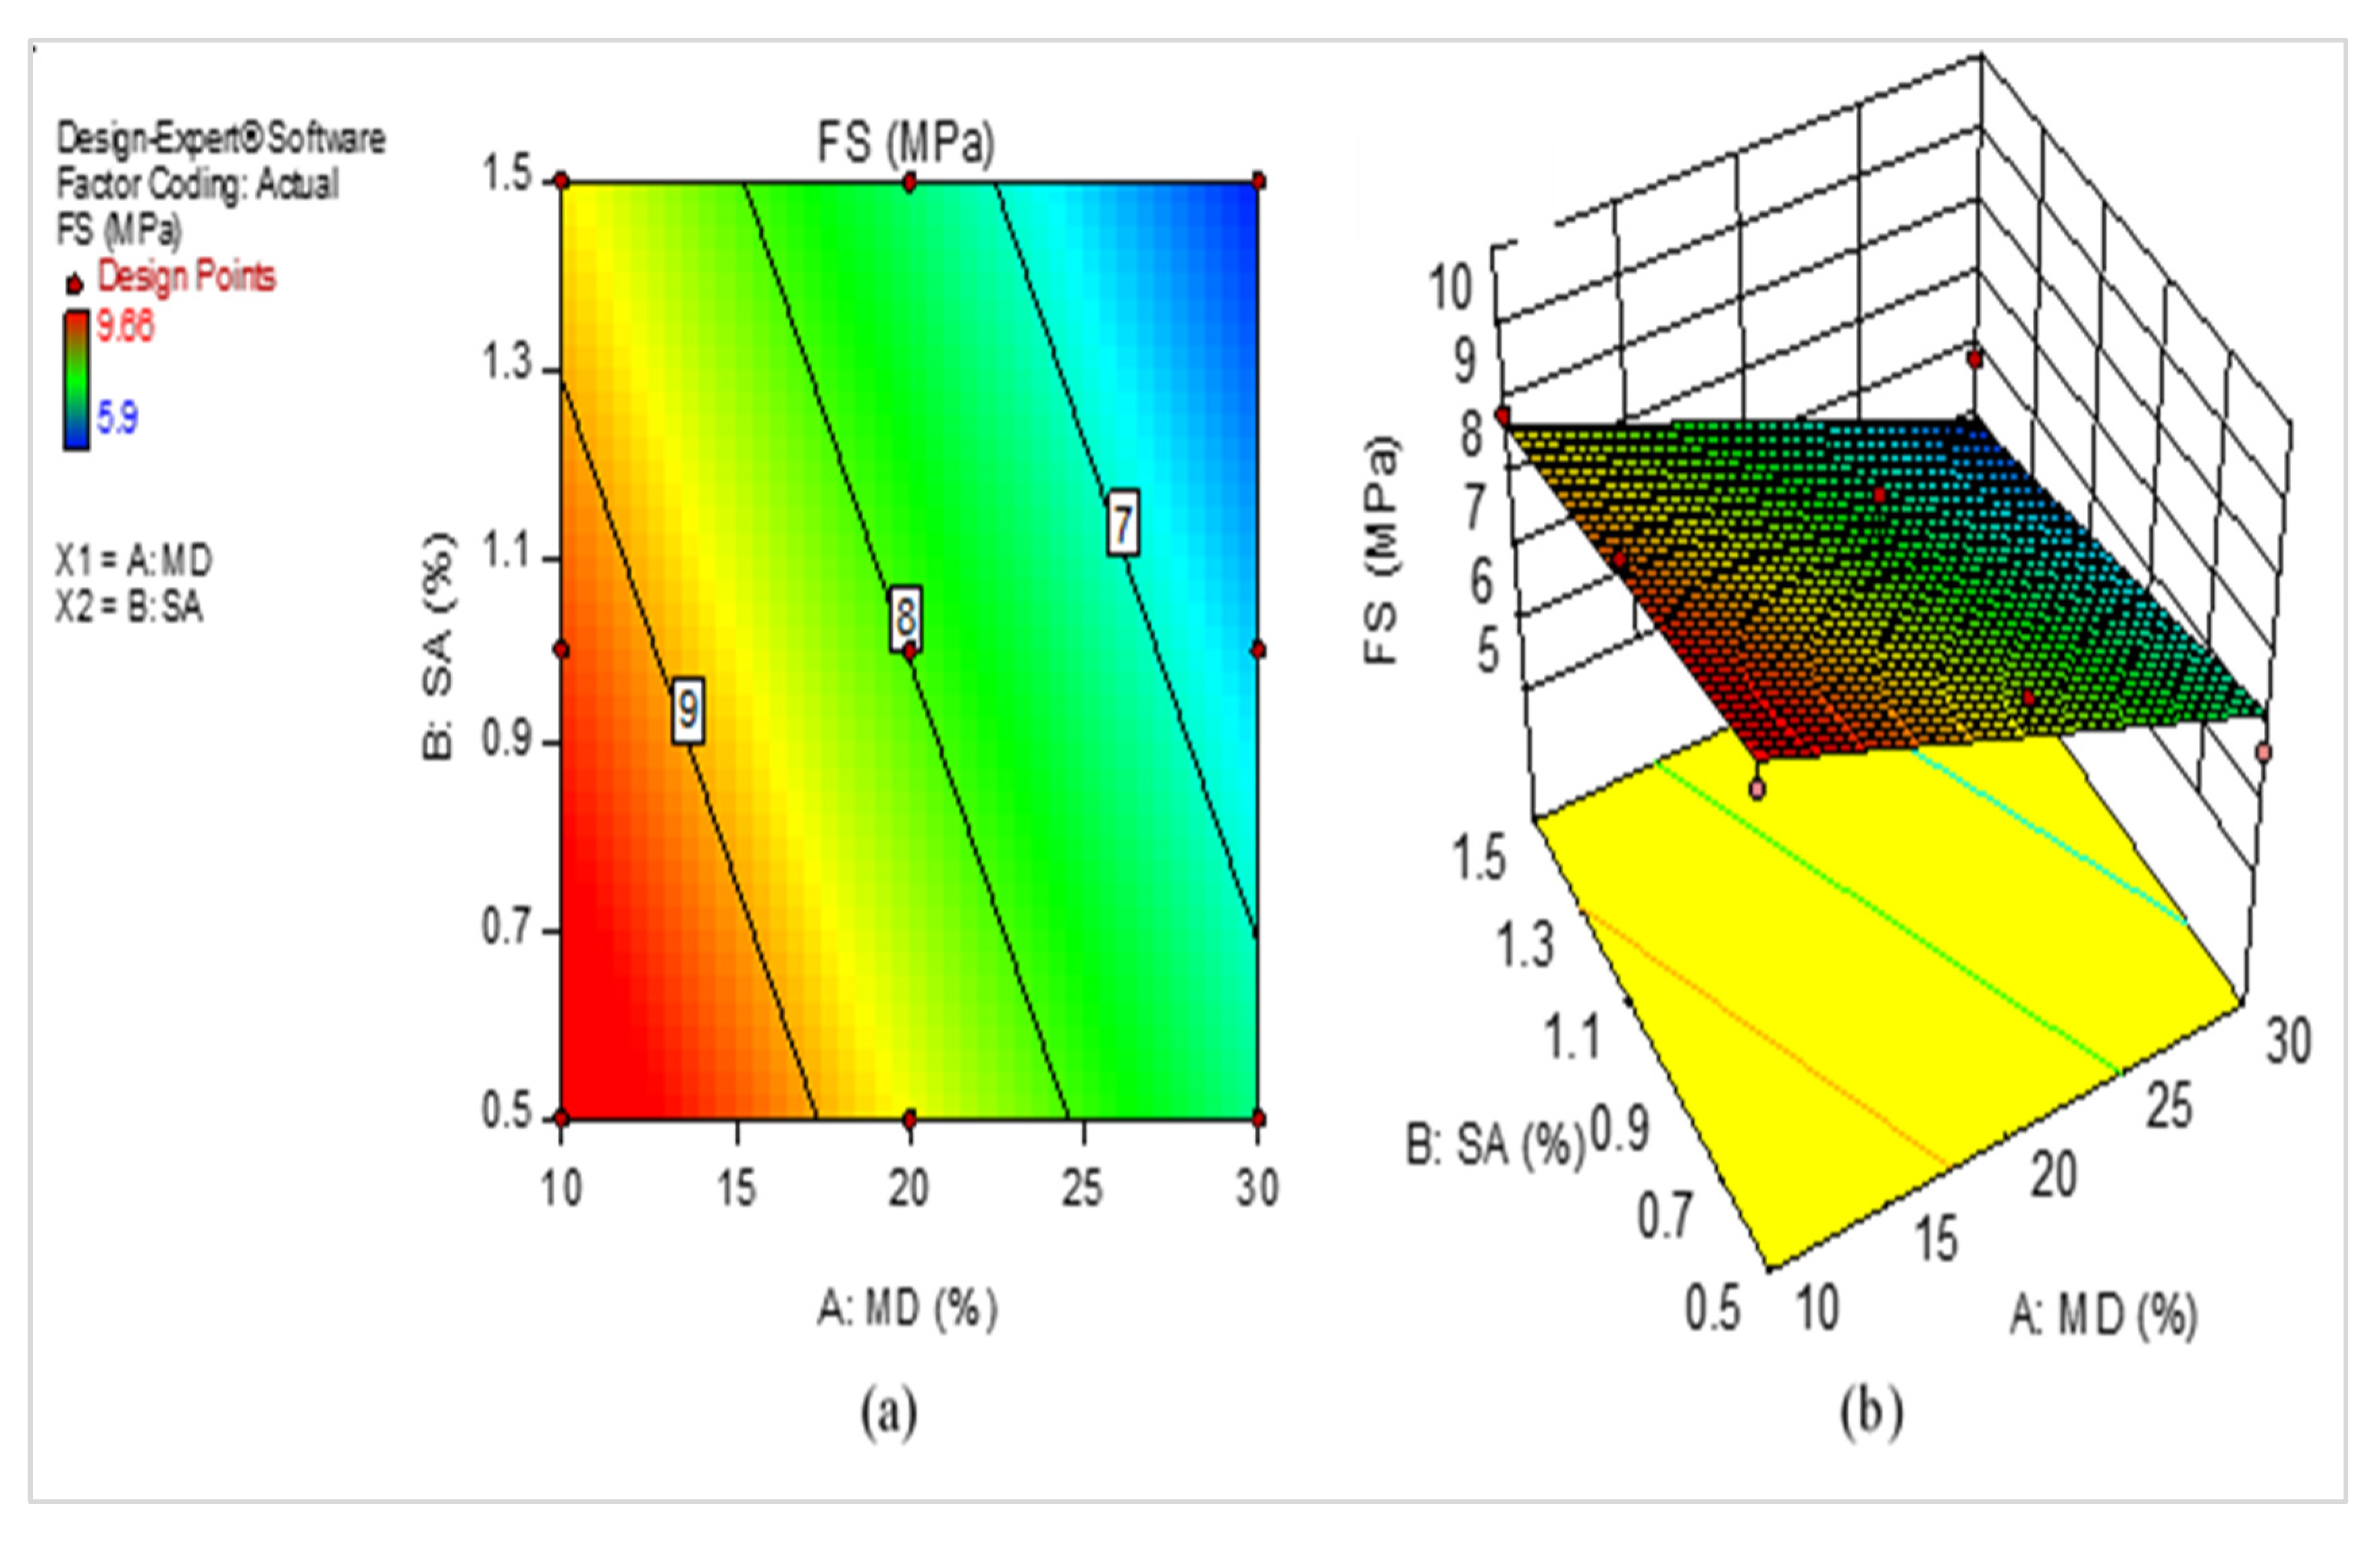
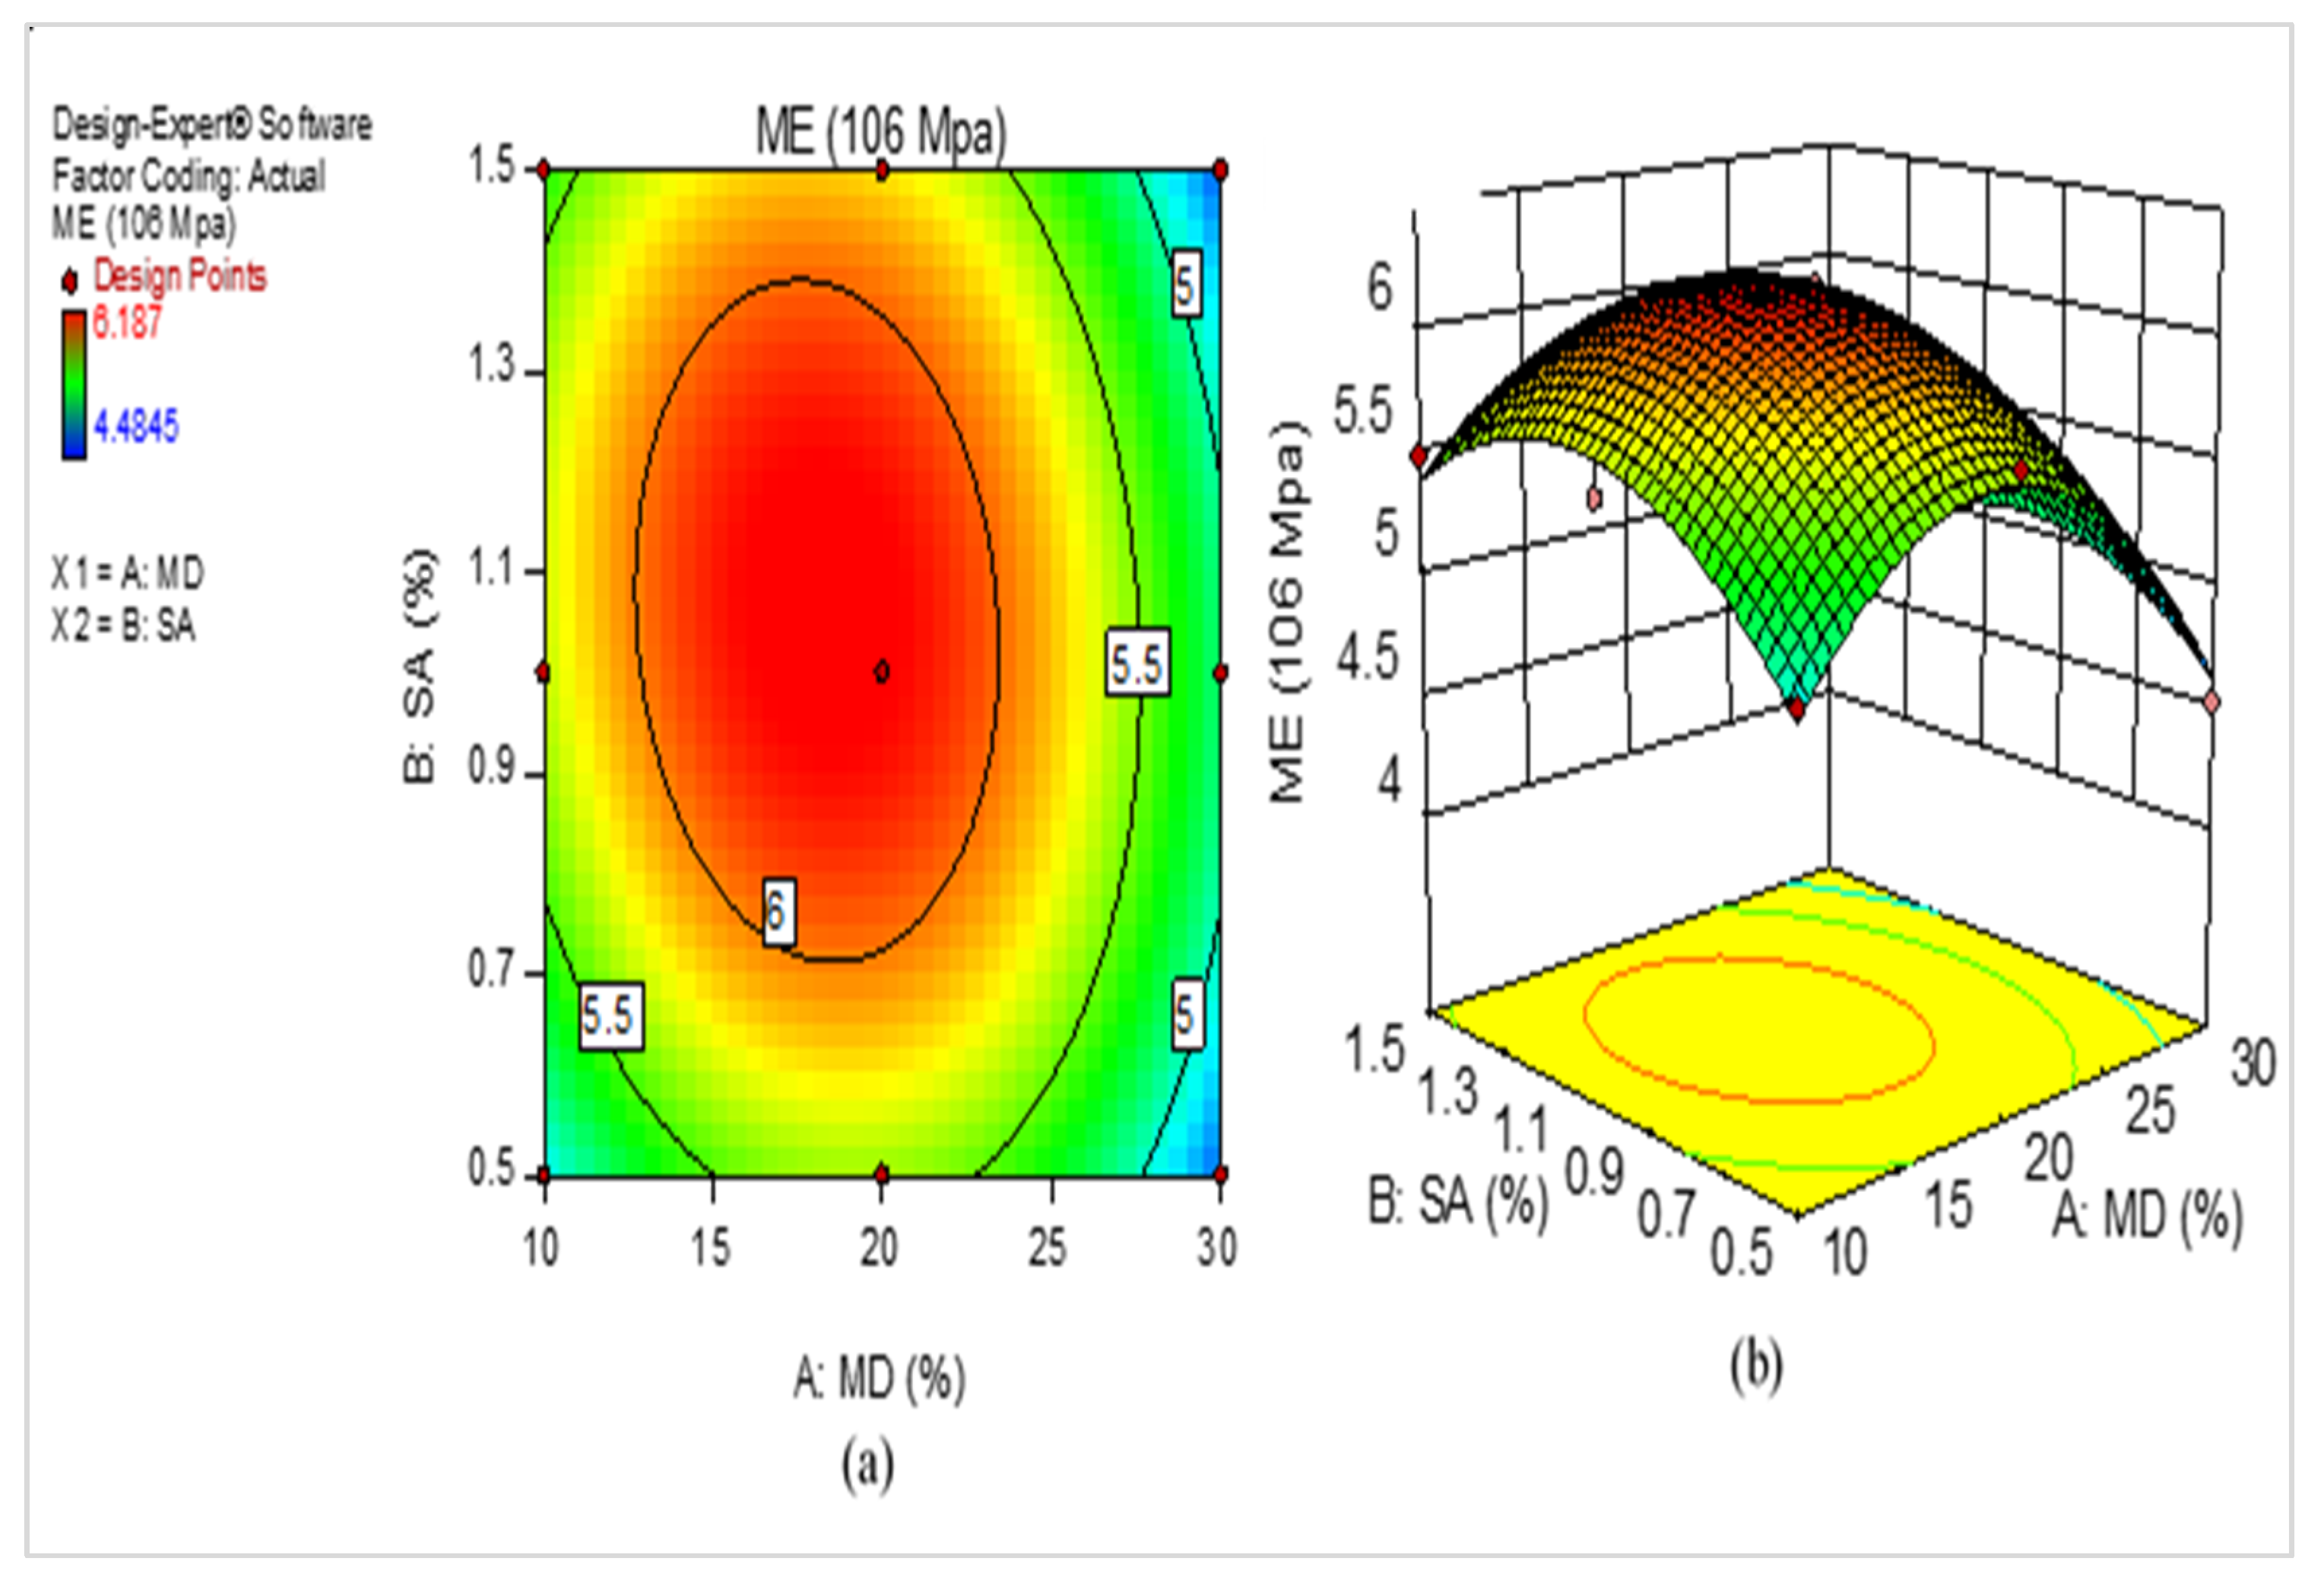
The relationship between the input variables and their individual and combined effects on the response is illustrated using 2D contour and 3D response surface diagrams. Through a color gradient, these graphs demonstrate how the quantities of the independent variables influence the response. Using contours that depict various response levels at certain levels of the input factors, the 2D diagram demonstrates how the variables’ interaction influences the responses. In addition, the 3D response surface diagrams, as their name suggests, provide the same information as the 2D diagrams but in a 3D form. Examples of the model graphs are given in Figure 14, Figure 15 and Figure 16 for the FS, UPV, and ME models, respectively. The color gradient depicts the intensity of the responses relative to the levels of the input factors. Higher magnitudes are indicated by the red regions, intermediate values are represented by the green and yellow regions, and the lowest response values are shown by the blue regions of the graphs. The graphs show how the levels of the input factors affect the output factors. For example, high FS values can be achieved by using less than 20% MD and less than 1.5% SA. These are the values below which the FS values are bounded by the red zone (high-intensity zones) of the 2D and 3D model graphs. Similar interpretations can be made of the other model graphs.

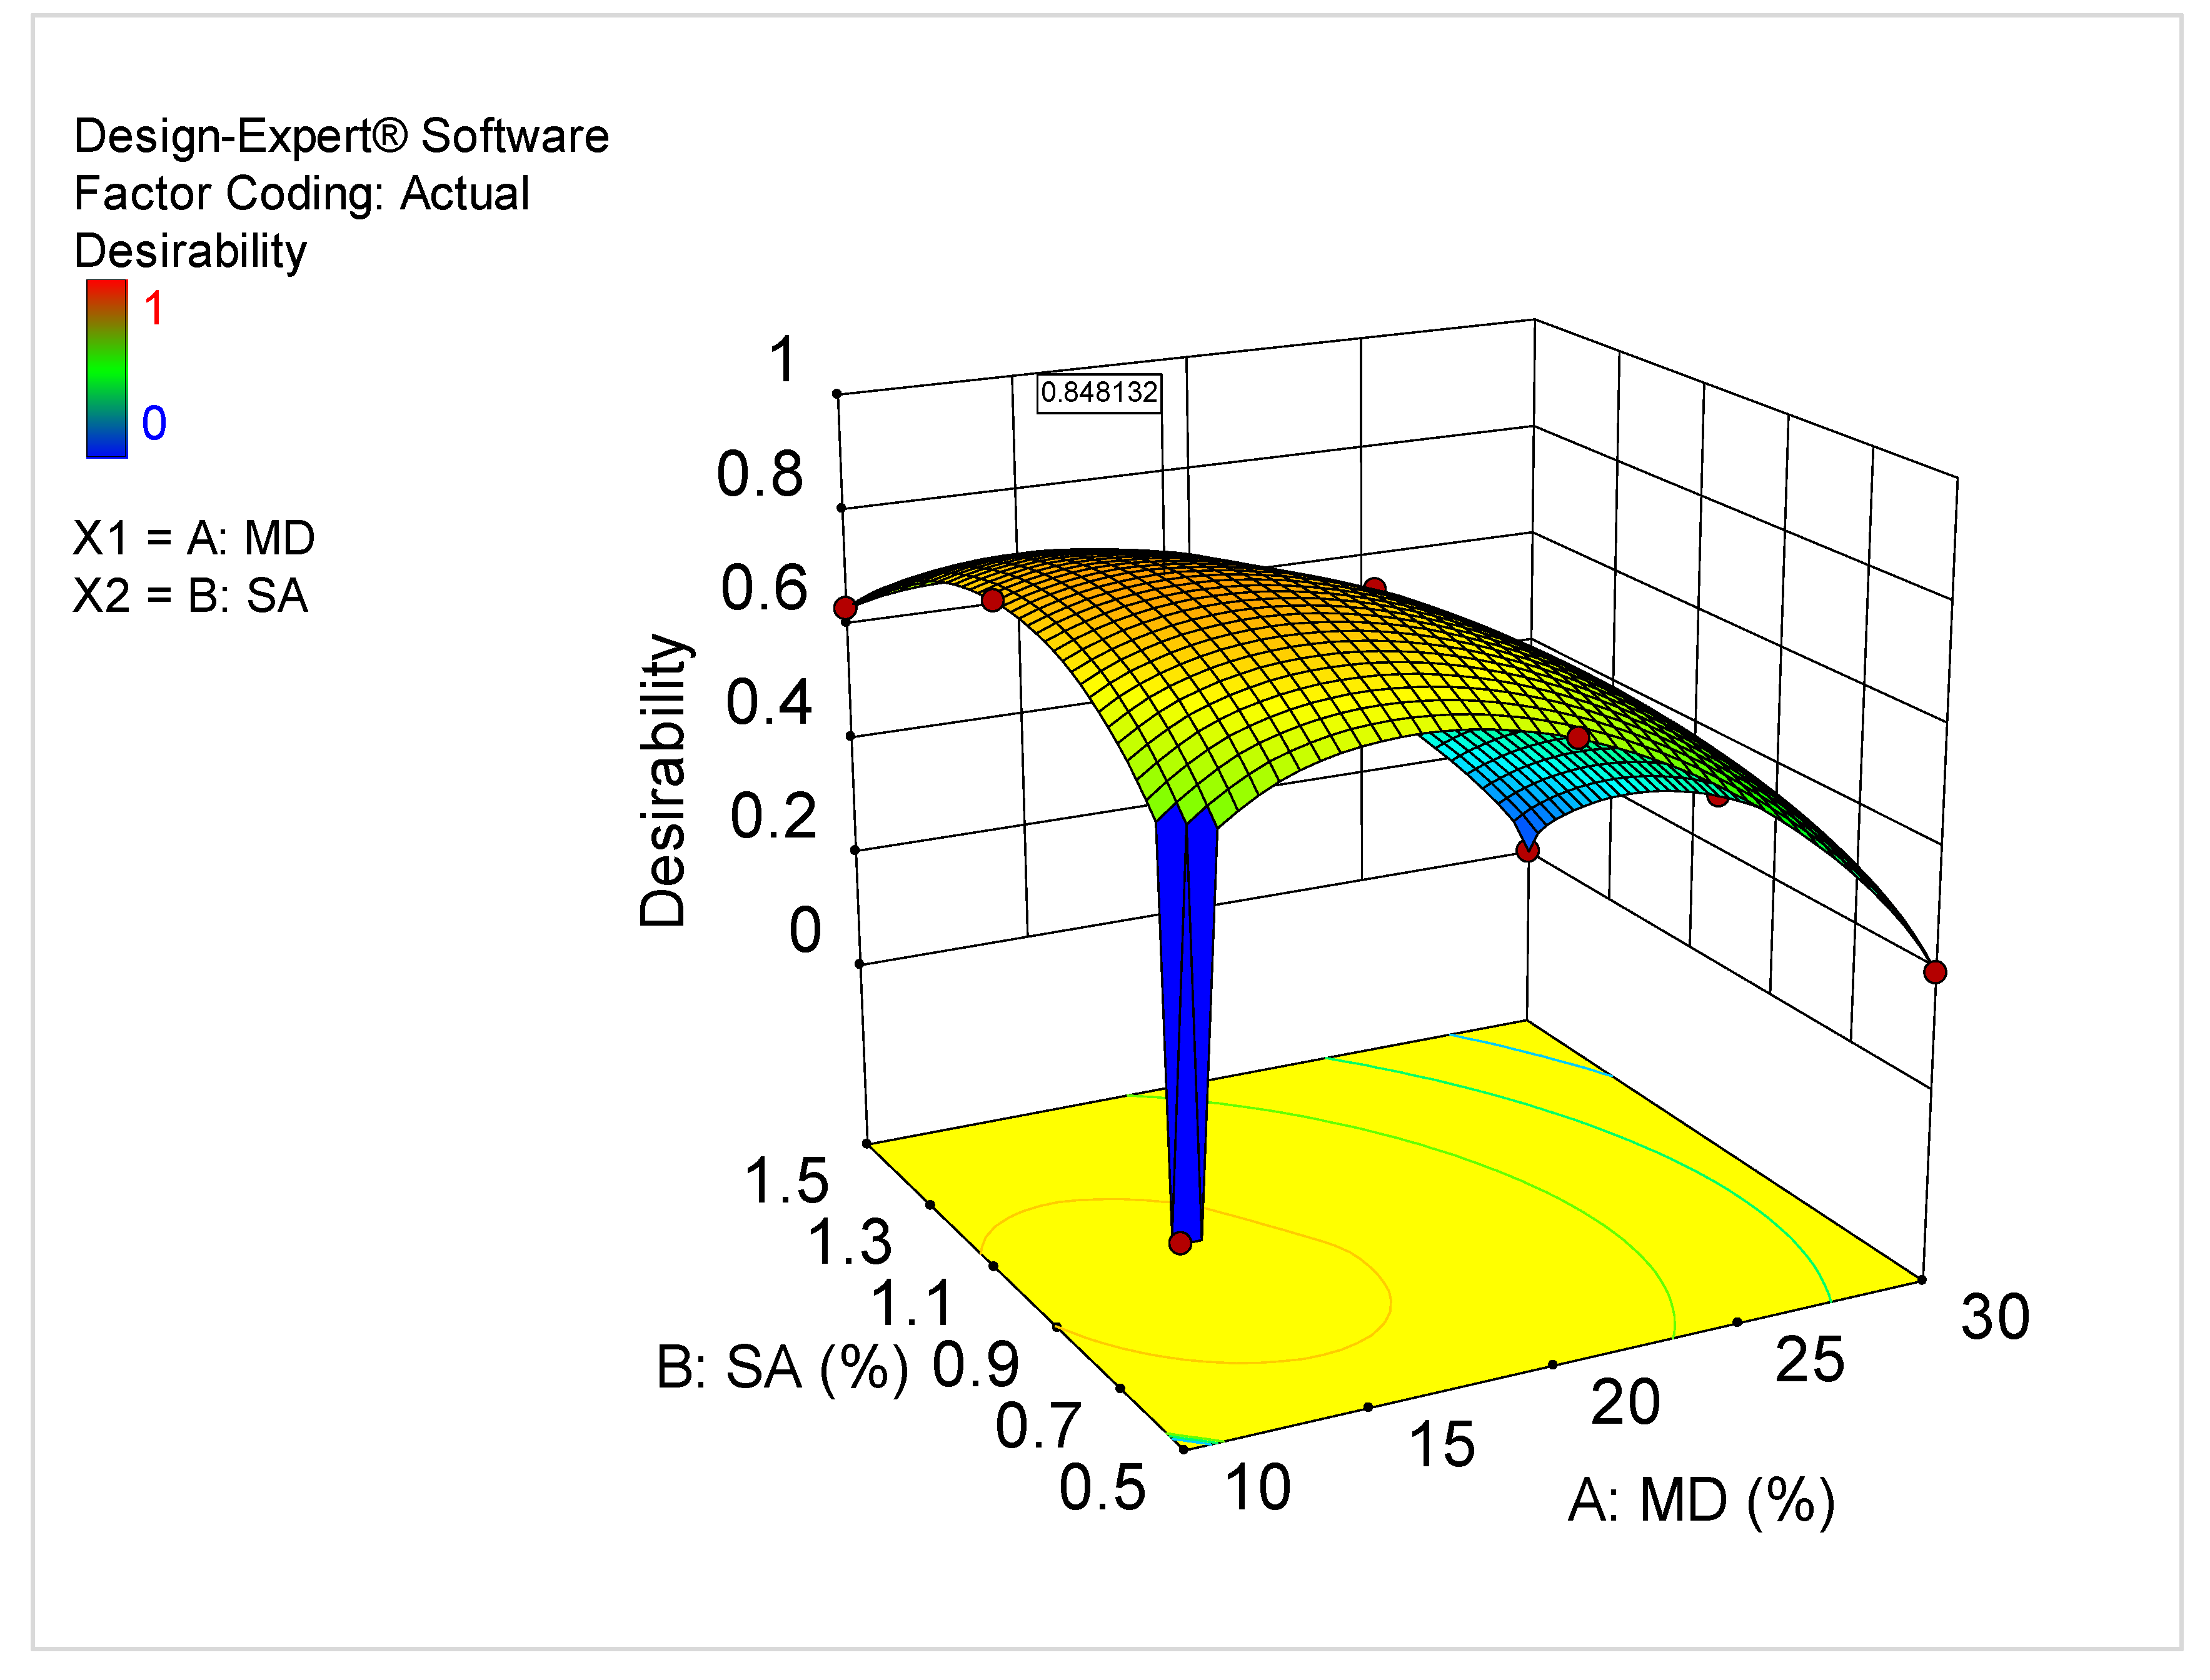
4.4. Multi-Objective Optimization

A type of multiple-criteria decision-making called multi-objective optimization deals with optimization issues that require the simultaneous optimization of multiple objective functions. This strategy is recommended because identifying the optimal solutions between many conflicting objectives is a basic feature of real-world optimization issues. Various criteria and levels of priority are used to specify goals for the independent and dependent variables in order to fulfill the objective functions without compromising the responses. The optimization is assessed using the desirability value dj, with a range of values set as 0 < dj < 1. The higher the dj value (given as a percentage), the better the result.
Table 10 shows the optimization goals set for each of the input and output factors. The input factors were set “in range” in order for the system to select the most suitable amount of the material that could produce concrete with properties (responses) satisfying the stated objective functions. For the responses, the goal was set to “maximize” all the hardened properties (CS, TS, FS, UPV, D, and ME) while it was set at “in range” for the fresh properties (SV). Furthermore, the level of importance was set at 3 (out of 5) which is the default configuration so that none of the variables will be compromised in favor of another. The solution obtained after running the optimization is shown in Figure 17 in the form of ramps. The result shows that at optimal input factors of 13.7% and 0.92% for MD and SA, respectively, an eco-friendly self-cleaning concrete can be produced with optimal response values of 145.6 mm, 32.9 MPa, 4.4 MPa, 9.0 MPa, 5189.82 m/s, 2646.65 kg/m3, and 6.03 × 10⁶ MPa, for SV, CS, TS, FS, UPV, D, and ME, respectively. The optimization solution was attained at a desirability value of 85%, as shown in the 3D response surface diagram in Figure 18. This is an excellent value considering the complexity of the multi-objective optimization process.

5. Discussion

The slump of the fresh concrete was observed to increase with SA content, due to the pearly or smoothening effect of SA (as it is a saturated fatty acid), which reduces the friction between the particles. The slump of the fresh concrete mix was observed to increase with 10% marble content and 0.5% and 1.0% of SA because the presence of the SA in the concrete mix gives flow to the concrete mix. This decrease in slump value with an increase in the percentage of MD may be because of the difference in the specific surface area of cement and MD. The specific surface area of MD is greater than that of the cement, so higher replacement increased the internal friction between particles and hence decreased the slump value. With 10% MD in the concrete mix and 0.5% of SA, the concrete compressive strength increases by 12.68% over the control mix. The compressive strength decreases up to 32.51% with 30% MD and 1% SA in the concrete mix. The test results are as per the findings of the literature review. The decrement in the compressive strength of the self-cleaning concrete is due to a) the lack of binding ability in MD; b) the replacement ratio increase resulting in less cement available to bind the concrete constituents, and c) MD acting only as a filler and not playing a prominent role in hydration. With an increase in the percentage of MD, the ultrasonic pulse velocity (UPV) value decreases for the concrete mixes. The decrease in UPV value is due to the difference in the hydraulicity of cement and MD. The hydraulicity of cement is higher than that of the MD, which increases the concrete compactness. However, the overall values of UPV test results obtained were in the excellent category range, which indicates that the quality of concrete is not affected by MD and SA addition. The results also showed that with an increase in the percentage of MD, the modulus of elasticity decreases, with a maximum decrement of 28.69% in the M12 mix. Moreover, SA coating in the concrete mix does not significantly affect the dynamic modulus of elasticity of the concrete. After 3 days of observation, M12 had better repelling properties than the control mix and all the other mixes.
The experimental work was modeled and optimized using the recommended input factors. After testing for the various properties, an experimental error between the experimental result and the predicted results is computed to find the accuracy of the optimization and, by extension, the developed predictive response models. An error margin of less than 10% is acceptable. The modeling and optimization results show that at optimal input factors of 13.7% and 0.92% for MD and SA, respectively, an eco-friendly self-cleaning concrete can be produced with optimal response values of 145.6 mm, 32.9 MPa, 4.4 MPa, 9.0 MPa, 5189.82 m/s, 2646.65 kg/m3, and 6.03 × 10⁶ MPa, for SV, CS, TS, FS, UPV, D, and ME, respectively which is in agreement with the experimental results. The optimal response value is 32.9 MPa for the compressive strength of concrete with optimal input factors of 13.7% and 0.92% for MD and SA, respectively. The UPV test results and density obtained in the modeling and optimization of the concrete indicate the value of UPV to be 5189.82 m/s and a density of 2646.65 kg/m3. The modeling and optimization findings show a value that is very close to the UPV test value of M8 and the density of M5. Thus, it is concluded that the modeling value shows coherence with the experimental results.

6. Conclusions and Recommendations

The results provide technical data on the feasibility of using MD (waste material) to replace cement, and SA for eco-friendly self-cleaning concrete production. The study reports the mechanical and physical characteristics of concrete, which substantially confirm MD and SA compatibility in structural applications. These findings were corroborated with scanning electron microscopy and EDX analysis of concrete mixes. The following conclusions can be drawn based on the experimental results:
  • Improvement in the workability of concrete mix is obtained at 10% MD (as a partial replacement for cement) and 0.5% and 1% of SA.
  • With 10% MD and 0.5% of SA in the concrete, the compressive, tensile, and flexural strength increases by 12.68%, 21.71%, and 16.73% over the control concrete.
  • The self-cleaning property is better with 30% replacement of cement by MD and 1.5% SA coating but results in a decrement in its mechanical properties. Up to 1% SA in the concrete mix does not adversely affect the mechanical or chemical properties of the concrete.
  • Adding MD in concrete production significantly lowers the concrete production cost and the risk of environmental concerns about its usability in concrete. SCC mixes showed better workability than conventional mixes within range. It is also important to note that laboratory mixes could be more sustainable if the waste product market share is increased and if it exhibits hydrophobic properties.
  • Using these industrial byproducts in concrete helps to significantly reduce carbon dioxide emissions, which in turn prompts a re-evaluation of the potential for reviving the economy and helps in cleaning up the environment.
  • The authors suggest that SCC mixes should be investigated for a potential pozzolanic reaction and contribution to concrete performance. Microstructural analysis and XRD are further recommended for future studies on SCC mixes to monitor the presence of calcium and silica.
  • It is further suggested to study the long-term self-cleaning property and repelling efficiency of the SA in concrete as there is a shortage of such studies, and further investigation is recommended to determine the permeability, watertightness effect, and durability of concrete for its long-term usability.

Author Contributions

Conceptualization, P.S.; methodology, P.S.; validation, B.S.M. and N.C.Y.; formal analysis, B.S.M. and N.C.Y.; investigation, P.S. and B.S.M.; resources, B.S.M. and N.C.Y.; data curation, P.S. and B.S.M.; writing—original draft preparation, P.S.; writing—review and editing, B.S.M. and N.C.Y.; supervision, B.S.M.; project administration, B.S.M. and N.C.Y.; funding acquisition, N.C.Y. All authors have read and agreed to the published version of the manuscript.

Funding

This study and APC were funded by a Malaysia–Thailand Joint Authority (MTJA) research grant (Cost Centre: 015ME0-318) in collaboration with the Science and Engineering Research Board (SERB International Research Experience), a statutory body of the Department of Science and Technology, New Delhi, Government of India (Award Number: SIR/2022/000455).

Institutional Review Board Statement

Not applicable.

Informed Consent Statement

Not applicable.

Data Availability Statement

All data are contained within the article.

Acknowledgments

This research work was supported by the Science and Engineering Research Board (SERB International Research Experience), a statutory body of the Department of Science and Technology, New Delhi, Government of India (Award Number: SIR/2022/000455). The authors would also like to acknowledge the technical support received from the Department of Civil and Environmental Engineering, Faculty of Engineering, Universiti Teknologi PETRONAS, Perak, Malaysia. The authors would like to express very great appreciation to Bashar S. Mohammed, Chair, Civil and Environmental Engineering, Universiti Teknologi PETRONAS, Malaysia for his cooperation, and valuable and constructive suggestions in the course of this research work.

Conflicts of Interest

The authors declare no conflict of interest.

References

  1. Zhang, C.; Hu, M.; van der Meide, M.; Di Maio, F.; Yang, X.; Gao, X.; Li, K.; Zhao, H.; Li, C. Life cycle assessment of material footprint in recycling: A case of concrete recycling. Waste Manag. 2022, 155, 311–319. [Google Scholar] [CrossRef] [PubMed]
  2. Xing, W.; Tam, V.W.; Le, K.N.; Butera, A.; Hao, J.L.; Wang, J. Effects of mix design and functional unit on life cycle assessment of recycled aggregate concrete: Evidence from CO2 concrete. Constr. Build. Mater. 2022, 348, 128712. [Google Scholar] [CrossRef]
  3. Sahoo, N.; Kumar, A. Samsher Review on energy conservation and emission reduction approaches for cement industry. Environ. Dev. 2022, 44, 100767. [Google Scholar] [CrossRef]
  4. Babu, T.R.; Neeraja, D. A experimental study of natural admixture effect on conventional concrete and high volume class F flyash blended concrete. Case Stud. Constr. Mater. 2017, 6, 43–62. [Google Scholar] [CrossRef]
  5. Liu, Q.-F.; Cai, Y.; Peng, H.; Meng, Z.; Mundra, S.; Castel, A. A numerical study on chloride transport in alkali-activated fly ash/slag concretes. Cem. Concr. Res. 2023, 166, 107094. [Google Scholar] [CrossRef]
  6. Vardhan, K.; Goyal, S.; Siddique, R.; Singh, M. Mechanical properties and microstructural analysis of cement mortar incorporating marble powder as partial replacement of cement. Constr. Build. Mater. 2015, 96, 615–621. [Google Scholar] [CrossRef]
  7. Ma, W.; Wang, Y.; Huang, L.; Yan, L.; Kasal, B. Natural and recycled aggregate concrete containing rice husk ash as replacement of cement: Mechanical properties, microstructure, strength model and statistical analysis. J. Build. Eng. 2022, 66, 105917. [Google Scholar] [CrossRef]
  8. Ahmad, S.; Al-Amoudi, O.S.B.; Khan, S.M.; Maslehuddin, M. Effect of silica fume inclusion on the strength, shrinkage and durability characteristics of natural pozzolan-based cement concrete. Case Stud. Constr. Mater. 2022, 17, e01255. [Google Scholar] [CrossRef]
  9. Ghazi, A.B.; Jamshidi-Zanjani, A.; Nejati, H. Utilization of copper mine tailings as a partial substitute for cement in concrete construction. Constr. Build. Mater. 2021, 317, 125921. [Google Scholar] [CrossRef]
  10. Ghazi, A.B.; Jamshidi-Zanjani, A.; Nejati, H. Clinkerisation of copper tailings to replace Portland cement in concrete construction. J. Build. Eng. 2022, 51, 104275. [Google Scholar] [CrossRef]
  11. Tokyay, M. CRC Press; CRC Press: Boca Raton, FL, USA, 2016. [Google Scholar]
  12. Revuelta, L.; Sorando, M.B.; Casado, J.P.C. Industrial Rocks: Typology, Applications in Construction and Companies in the Sector; Rocks and Minerals; Taylor & Francis: Abingdon, UK, 2001; Volume 76. [Google Scholar]
  13. Nayak, S.K.; Satapathy, A.; Mantry, S. Use of waste marble and granite dust in structural applications: A review. J. Build. Eng. 2021, 46, 103742. [Google Scholar] [CrossRef]
  14. Kumar, V.; Singla, S.; Garg, R. Strength and microstructure correlation of binary cement blends in presence of waste marble powder. Mater. Today Proc. 2020, 43, 857–862. [Google Scholar] [CrossRef]
  15. Rana, A.; Kalla, P.; Verma, H.; Mohnot, J. Recycling of dimensional stone waste in concrete: A review. J. Clean. Prod. 2016, 135, 312–331. [Google Scholar] [CrossRef]
  16. Arel, H.Ş. Recyclability of waste marble in concrete production. J. Clean. Prod. 2016, 131, 179–188. [Google Scholar] [CrossRef]
  17. Kuoribo, E.; Mahmoud, H. Utilisation of waste marble dust in concrete production: A scientometric review and future research directions. J. Clean. Prod. 2022, 374, 133872. [Google Scholar] [CrossRef]
  18. Li, L.; Huang, Z.; Tan, Y.; Kwan, A.; Liu, F. Use of marble dust as paste replacement for recycling waste and improving durability and dimensional stability of mortar. Constr. Build. Mater. 2018, 166, 423–432. [Google Scholar] [CrossRef]
  19. Zhang, S.; Cao, K.; Wang, C.; Wang, X.; Wang, J.; Sun, B. Effect of silica fume and waste marble powder on the mechanical and durability properties of cellular concrete. Constr. Build. Mater. 2020, 241, 117980. [Google Scholar] [CrossRef]
  20. Aruntaş, H.Y.; Gürü, M.; Dayı, M.; Tekin, I. Utilization of waste marble dust as an additive in cement production. Mater. Des. 2010, 31, 4039–4042. [Google Scholar] [CrossRef]
  21. Ruiz-Sánchez, A.; Sánchez-Polo, M.; Rozalen, M. Waste marble dust: An interesting residue to produce cement. Constr. Build. Mater. 2019, 224, 99–108. [Google Scholar] [CrossRef]
  22. Singh, M.; Srivastava, A.; Bhunia, D. An investigation on effect of partial replacement of cement by waste marble slurry. Constr. Build. Mater. 2017, 134, 471–488. [Google Scholar] [CrossRef]
  23. Corinaldesi, V.; Moriconi, G.; Naik, T.R. Characterization of marble powder for its use in mortar and concrete. Constr. Build. Mater. 2010, 24, 113–117. [Google Scholar] [CrossRef]
  24. Ergün, A. Effects of the usage of diatomite and waste marble powder as partial replacement of cement on the mechanical properties of concrete. Constr. Build. Mater. 2011, 25, 806–812. [Google Scholar] [CrossRef]
  25. Shelke, V. Effect of marble powder with and without silica fume on mechanical properties of concrete. IOSR J. Mech. Civ. Eng. 2012, 1, 40–45. [Google Scholar] [CrossRef]
  26. Rana, A.; Kalla, P.; Csetenyi, L.J. Sustainable use of marble slurry in concrete. J. Clean. Prod. 2015, 94, 304–311. [Google Scholar] [CrossRef]
  27. Sadek, D.M.; El-Attar, M.M.; Ali, H.A. Reusing of marble and granite powders in self-compacting concrete for sustainable development. J. Clean. Prod. 2016, 121, 19–32. [Google Scholar] [CrossRef]
  28. Aliabdo, A.A.; Elmoaty, A.E.M.A.; Auda, E.M. Re-use of waste marble dust in the production of cement and concrete. Constr. Build. Mater. 2014, 50, 28–41. [Google Scholar] [CrossRef]
  29. Gencel, O.; Benli, A.; Bayraktar, O.Y.; Kaplan, G.; Sutcu, M.; Elabade, W.A.T. Effect of waste marble powder and rice husk ash on the microstructural, physico-mechanical and transport properties of foam concretes exposed to high temperatures and freeze–thaw cycles. Constr. Build. Mater. 2021, 291, 123374. [Google Scholar] [CrossRef]
  30. Ashish, D.K. Concrete made with waste marble powder and supplementary cementitious material for sustainable development. J. Clean. Prod. 2019, 211, 716–729. [Google Scholar] [CrossRef]
  31. Ma, Z.; Shen, J.; Wang, C.; Wu, H. Characterization of sustainable mortar containing high-quality recycled manufactured sand crushed from recycled coarse aggregate. Cem. Concr. Compos. 2022, 132, 104629. [Google Scholar] [CrossRef]
  32. Na, S.-H.; Kang, H.-J.; Song, M.-S. Effects of Stearic Acid on the Watertightness Properties of the Cementitious Materials. J. Korean Ceram. Soc. 2009, 46, 365–371. [Google Scholar] [CrossRef]
  33. Albayrak, A.T.; Yasar, M.; Gurkaynak, M.A.; Gurgey, I. Investigation of the effects of fatty acids on the compressive strength of the concrete and the grindability of the cement. Cem. Concr. Res. 2005, 35, 400–404. [Google Scholar] [CrossRef]
  34. Li, X.; Wang, Q.; Lei, L.; Shi, Z.; Zhang, M. Amphiphobic concrete with good oil stain resistance and anti-corrosion properties used in marine environment. Constr. Build. Mater. 2021, 299, 123945. [Google Scholar] [CrossRef]
  35. Song, Q.; Wang, Q.; Xu, S.; Mao, J.; Li, X.; Zhao, Y. Properties of water-repellent concrete mortar containing superhydrophobic oyster shell powder. Constr. Build. Mater. 2022, 337, 127423. [Google Scholar] [CrossRef]
  36. Karthick, S.; Park, D.-J.; Lee, Y.S.; Saraswathy, V.; Lee, H.-S.; Jang, H.-O.; Choi, H.-J. Development of water-repellent cement mortar using silane enriched with nanomaterials. Prog. Org. Coat. 2018, 125, 48–60. [Google Scholar] [CrossRef]
  37. Al-Kheetan, M.J.; Rahman, M.M.; Chamberlain, D.A. Fundamental interaction of hydrophobic materials in concrete with different moisture contents in saline environment. Constr. Build. Mater. 2019, 207, 122–135. [Google Scholar] [CrossRef]
  38. Zhao, J.; Gao, X.; Chen, S.; Lin, H.; Li, Z.; Lin, X. Hydrophobic or superhydrophobic modification of cement-based materials: A systematic review. Compos. Part B Eng. 2022, 243, 110104. [Google Scholar] [CrossRef]
  39. IS 10262; Indian Standard: Concrete Mix Proportioning Guidelines; Guidelines of Indian Standards. Bureau of Indian Standards (BIS): New Delhi, India, 2009.
  40. IS 12269; Indian Standard 53 Grade Specification Ordinary Portland Cement. Bureau of Indian Standards (BIS): New Delhi, India, 2013.
  41. IS:383; Specification for Coarse and Fine Aggregates from Natural Sources for Concrete. Bureau of Indian Standards (BIS): New Delhi, India, 1970; pp. 1–24.
  42. Omar, O.M.; Elhameed, G.D.A.; Sherif, M.A.; Mohamadien, H.A. Influence of limestone waste as partial replacement material for sand and marble powder in concrete properties. HBRC J. 2012, 8, 193–203. [Google Scholar] [CrossRef]
  43. Ulubeyli, G.C.; Artir, R. Properties of Hardened Concrete Produced by Waste Marble Powder. Procedia-Soc. Behav. Sci. 2015, 195, 2181–2190. [Google Scholar] [CrossRef]
  44. IS:7320–1974(reaffirmed1999); Specification for Concrete Slump Test Apparatus. Bureau of Indian Standards (BIS): New Delhi, India, 1999.
  45. IS 516; Method of Tests for Strength of Concrete. Bureau of Indian Standards (BIS): New Delhi, India, 1959; pp. 1–30.
  46. Rid, Z.A.; Shah, S.N.R.; Memon, M.J.; Jhatial, A.A.; Keerio, M.A.; Goh, W.I. Evaluation of combined utilization of marble dust powder and fly ash on the properties and sustainability of high-strength concrete. Environ. Sci. Pollut. Res. 2022, 29, 28005–28019. [Google Scholar] [CrossRef]
  47. IS 13311 (Part 1); Method of Non-Destructive Testing of Concrete, Part 1: Ultrasonic Pulse Velocity. Bureau of Indian Standards (BIS): New Delhi, India, 1992; pp. 1–7.
  48. Abdulkadir, I.; Mohammed, B.S.; Liew, M.; Wahab, M. Modelling and multi-objective optimization of the fresh and mechanical properties of self-compacting high volume fly ash ECC (HVFA-ECC) using response surface methodology (RSM). Case Stud. Constr. Mater. 2021, 14, e00525. [Google Scholar] [CrossRef]
  49. Murali, M.; Mohammed, B.S.; Abdulkadir, I.; Liew, M.S.; Alaloul, W.S. Utilization of Crumb Rubber and High-Volume Fly Ash in Concrete for Environmental Sustainability: RSM-Based. Materials 2021, 14, 3322. [Google Scholar] [CrossRef]
  50. Al-Fakih, A.; Mohammed, B.S.; Al-Shugaa, M.A.; Al-Osta, M.A. Experimental investigation of dry-bed joints in rubberized concrete interlocking masonry. J. Build. Eng. 2022, 58, 105048. [Google Scholar] [CrossRef]
  51. Zaman, A.B.K.; Mustaffa, Z.; Mohammed, B.S.; Ng, C.Y. Lateral Infiltration Capacity of Pervious Concrete and Its Performance as Pavement Curb. J. Mater. Civ. Eng. 2022, 34, 04021468. [Google Scholar] [CrossRef]
  52. Choo, J.; Mohammed, B.S.; Chen, P.; Abdulkadir, I.; Yan, X. Modeling and Optimizing the Effect of 3D Printed Origami Properties of Rubberized ECC. Buildings 2022, 12, 2201. [Google Scholar] [CrossRef]
  53. Mohammed, B.S.; Khed, V.C.; Nuruddin, M.F. Rubbercrete mixture optimization using response surface methodology. J. Clean. Prod. 2018, 171, 1605–1621. [Google Scholar] [CrossRef]
  54. Mohammed, B.S.; Abdulkadir, I.; Ali, M.O.A.; Liew, M.S. Mechanical, Microstructural and Drying Shrinkage Properties of NaOH-Pretreated Crumb Rubber Concrete: RSM-Based. Materials 2022, 15, 2588. [Google Scholar]
  55. Abdulkadir, I.; Mohammed, B.S.; Liew, M.; Wahab, M. Modelling and optimization of the mechanical properties of engineered cementitious composite containing crumb rubber pretreated with graphene oxide using response surface methodology. Constr. Build. Mater. 2021, 310, 125259. [Google Scholar] [CrossRef]
Figure 1. Slump value of fresh SCC.
Sustainability 15 08635 g001
Figure 2. EDX patterns of specimen M6 of the SCC.
Sustainability 15 08635 g002
Figure 3. EDX patterns of specimen M9 of the SCC.
Sustainability 15 08635 g003
Figure 4. EDX patterns of specimen M12 of the SCC.
Sustainability 15 08635 g004
Figure 5. SEM microstructure images of (a) MD and (b) cement (at 20 KX magnification).
Sustainability 15 08635 g005
Figure 6. Threshold and outline of SEM images of M6, M9, and M12.
Sustainability 15 08635 g006aSustainability 15 08635 g006b
Figure 7. Plot profile and interactive surface plot of the SEM image of M6.
Sustainability 15 08635 g007
Figure 8. Plot profile and interactive surface plot of the SEM Image of M9.
Sustainability 15 08635 g008
Figure 9. Plot profile and interactive surface plot of the SEM image of M12.
Sustainability 15 08635 g009
Figure 10. Application of rhodamine b dye on the concrete surface of M0.
Sustainability 15 08635 g010
Figure 11. Discoloration of rhodamine b dye on the concrete surface of M10, M11, and M12 at t = 72 h.
Sustainability 15 08635 g011
Figure 12. (a) The normal plot of residuals and (b) predicted versus actual plot for the SV model.
Sustainability 15 08635 g012
Figure 13. (a) The normal plot of residuals and (b) predicted versus actual plot for the CS model.
Sustainability 15 08635 g013
Figure 14. (a) Two-dimensional contour and (b) 3D response surface diagrams for FS.
Sustainability 15 08635 g014
Figure 15. (a) Two-dimensional contour and (b) 3D response surface diagrams for UPV.
Sustainability 15 08635 g015
Figure 16. (a) Two-dimensional contour and (b) 3D response surface diagrams for ME.
Sustainability 15 08635 g016
Figure 17. Optimization solution ramps.
Sustainability 15 08635 g017
Figure 18. Three-dimensional response surface diagram for desirability.
Sustainability 15 08635 g018
Table 1. Chemical composition of marble dust.
ElementWeight%Atomic%
CaCO315.2722.89
SiO257.8462.51
NaAlSi3O80.320.25
MgO9.46.97
Al2O30.60.4
KCl0.740.37
CaAl2Si2O80.10.05
CaSiO313.576.1
Fe1.150.37
Au1.010.09
Total100
Table 2. Mix proportions of concrete.
Mix ProportionsMix IDCoarse AggregateFine AggregateMarble DustStearic AcidCementWater
(Divided by Weight of Cement a)
CM bM02.9871.510.0010.45
CM + 0.5% SAM12.9871.510.00.00510.45
CM + 1.0% SAM22.9871.510.00.01010.45
CM + 1.5% SAM32.9871.510.00.01510.45
MD10% + 0.5% SAM42.9871.510.10.0050.90.45
MD10% + 1.0% SAM52.9871.510.10.0100.90.45
MD10% + 1.5% SAM62.9871.510.10.0150.90.45
MD20% + 0.5% SAM72.9871.510.20.0050.80.45
MD20% + 1.0% SAM82.9871.510.20.0100.80.45
MD20% + 1.5% SAM92.9871.510.20.0150.80.45
MD30% + 0.5% SAM102.9871.510.30.0050.70.45
MD30% + 1.0% SAM112.9871.510.30.0100.70.45
MD30% + 1.5% SAM122.9871.510.30.0150.70.45
a Cement = 413.33 kg/m3, b CM: control mix.
Table 3. Compressive, tensile, and flexural strength and density, modulus of elasticity, and UPV of hardened SCC.
Mix IDCompressive Strength (MPa)Tensile Strength (MPa)Flexural Strength (MPa)Density (kg/m3)Modulus of Elasticity (106 MPa)Ultrasonic Pulse Velocity (m/s)
M032.53.88.32601.56.295338.0
M133.54.48.92607.46.055226.5
M232.94.38.92613.36.325338.0
M330.83.98.92591.16.185300.3
M436.64.79.72580.75.044792.3
M534.84.59.62647.45.544966.9
M631.84.48.92620.75.484966.9
M729.84.59.12617.75.665050.5
M829.34.18.92632.66.185263.2
M926.93.55.92611.85.735084.7
M1025.54.36.72545.14.524573.2
M1124.34.16.32573.35.244901.9
M1221.94.36.82527.44.484573.3
Table 4. Elemental oxide composition of the raw materials determined by EDX analysis.
Mix ID/MDM6M9M12
ElementWeight%
CaCO315.273.076.36.98
SiO257.8459.2954.651.45
NaAlSi3O8 0.320.330.460.66
MgO 9.40.821.630.45
Al2O3 0.62.061.611.89
KCl0.7400.790
KAlSi3O 0.10.571.061.37
CaSiO3 13.5529.2425.0925.34
Fe 1.151.561.740.96
Au 1.032.282.789.57
S -0.781.890
PD --2.050.8
Ti ---0.53
Table 5. Particle analysis of SEM images.
Particle Analysis of SEM Images
MIX IDCounts
M6372
M9532
M12783
Table 6. Input variables and their ranges.
Variables
(Input Factors)
SymbolsRange of Values
ActualCoded−10+1
Marble Dust (%)MDx1102030
Stearic Acid (%)SAx20.511.5
Table 7. Experimental runs and responses considered in the analysis.
RSM RunsEquivalent Mix No.Input FactorsResponses
x 1 :   MD   ( % ) x 2 :   SA   ( % ) SV (mm)CS (MPa)TS (MPa)FS (MPa)UPV (m/s)D kg/m3ME
(×106 MPa
1M10300.515025.54.36.74573.22545.184.5
2M6101.513031.84.48.94966.92620.745.5
3M12301.513021.94.36.84573.22527.44.5
4M820112529.34.18.95263.22632.596.2
5M4100.516036.64.79.74792.32580.745.0
6M1130110024.34.16.34901.92573.335.2
7M7200.515029.94.59.15050.52617.775.7
8M510116034.84.59.64966.92647.45.5
9M9201.512026.93.55.95084.72611.855.7
Table 8. ANOVA results.
ResponseSourceSum of SquaresDfMean SquareF-Valuep-Value > FSignificance
SVModel1883.332941.674.020.0781YES
x 1 -MD816.671816.673.490.1111NO
x 2 -SA1066.6711066.674.550.0768YES
Residual1405.566234.26
Cor Total3288.898
CSModel180.13536.03320.340.0003YES
x 1 -MD159.751159.751420.55<0.0001YES
x 2 -SA18.76118.76166.830.0010YES
x 1 x 2 0.09010.0900.800.4369NO
x 1 2 0.2410.242.100.2435NO
x 2 2 1.2911.2911.430.0431YES
Residual0.3430.11
Cor Total180.468
TSModel0.4020.202.400.1712NO
x 1 -MD0.1510.151.790.2294NO
x 2 -SA0.2510.253.010.1332NO
Residual0.4960.082
Cor Total0.898
FSModel14.1427.079.260.0147YES
x 1 -MD11.62111.6215.210.0080YES
x 2 -SA2.5212.523.300.1191NO
Residual4.5860.76
Cor Total18.738
UPVModel4.018 × 105580,361.4911.800.0346YES
x 1 -MD76,568.81176,568.8111.240.0440YES
x 2 -SA7266.2417266.241.070.3776NO
x 1 x 2 7621.2917621.291.120.3678NO
x 1 2 2.272 × 10512.272 × 10533.360.0103YES
x 2 2 83,123.24183,123.2412.200.0397YES
Residual20,432.8636810.95
Cor Total4.222 × 1058
DModel12,962.9852592.6020.200.0162YES
x 1 -MD6866.1416866.1453.500.0053YES
x 2 -SA44.28144.280.350.5982NO
x 1 x 2 834.631834.636.500.0839YES
x 1 2 2929.4412929.4422.830.0174YES
x 2 2 2288.4912288.4917.830.0243YES
Residual385.023128.34
Cor Total13,348.008
MEModel2.4750.4918.830.0179YES
x 1 -MD0.5410.5420.770.0198YES
x 2 -SA0.04010.0401.520.3053NO
x 1 x 2 0.06010.0602.270.2289NO
x 1 2 1.3111.3150.030.0058YES
x 2 2 0.5110.5119.570.0215YES
Residual0.07930.026
Cor Total2.558
Table 9. Model validation factors.
Model Validation ParametersResponses
SV (mm)CS (MPa)TS (MPa)FS (MPa)UPV (m/s)D (kg/m3)ME
(106 MPa)
Std. Dev.15.310.340.290.8782.5311.330.16
Mean136.1128.944.267.984908.092595.225.32
C.V. %11.241.166.7410.951.680.443.04
PRESS3311.594.051.199.77248,800.003470.110.96
−2 Log Likelihood71.00−4.01−0.5919.4795.0959.35−17.11
R20.570.99810.44470.760.950.970.97
Adj. R20.430.9950.25960.670.870.920.92
Pred. R2−0.010.98−0.33990.480.410.740.62
Adeq. Precision5.6650.614.3488.099.8412.7212.54
BIC77.599.176.0026.06108.2772.53−3.93
AIC81.8049.9910.2130.27149.09113.3536.89
Table 10. Optimization goals.
FactorsVariable (Input Factors)Response (Output Factors)
MD (%)SA (%)SV (mm)CS (MPa)TS (MPa)FS (MPa)UPV (m/s)D (kg/m3)ME (106 MPa)
Minimum100.510021.93.55.94573.22527.44.48
Maximum301.516036.64.79.665263.22627.46.19
GoalIn rangeIn rangeIn rangeMax.Max.Max.MaxMaxMax
Disclaimer/Publisher’s Note: The statements, opinions and data contained in all publications are solely those of the individual author(s) and contributor(s) and not of MDPI and/or the editor(s). MDPI and/or the editor(s) disclaim responsibility for any injury to people or property resulting from any ideas, methods, instructions or products referred to in the content.

