1. Introduction
The basic industrial status of coal as the main source of energy has not changed [
1]. As the depth and difficulty of coal mining in central and eastern China increase, the coal production capacity is rapidly shifting to mining areas in provinces such as Xinjiang, Inner Mongolia, and Shaanxi. These areas have high mining intensity, and the fully mechanized working face advances at a rate of 10 m per day or even more, requiring the speedy driving of supporting roadways. Generally, the strength of working seams is above 13 MPa, with some reaching over 30 MPa [
2,
3]. During coal roadway driving, coal ejection phenomena occur, posing a threat to the safety of operators.
In the field of rock tunneling, researchers have investigated the load form, unloading rate, and stress level of ejection. Qi Yanjun [
4] found that non-pure static load failure modes could produce block ejection and that the ejection velocity was higher under dynamic load when simulating roadway rock bursts using a similar lithologic simulation. Duan Kang [
5,
6,
7,
8] studied fragment ejection during the experimental process of granite, red sandstone, marble, and other rocks. Si Xuefeng [
9] simulated the process of rock burst generation during driving through experiments and found that particle ejection occurred first during rock failure, with the stress level of particle ejection being lower than that of rock burst.
In the experimental process of coal samples, it is generally found that ejection occurs before the failure of coal samples. Lu Jun [
10,
11] studied composite dynamic disasters in coal mines using true triaxial and five-sided loading experiments and found that particle ejection and local fragment ejection occurred after the samples underwent the initial state. Hao Zhen [
12] investigated the effect of loading rate on rock bursts in mining roadways through conventional triaxial tests on coal and implemented measures such as reducing the advancing speed, controlling the cutting depth in mining, and regulating the stress field in the region of the surrounding rock of the roadway to decrease the loading rate of the coal-rock mass. Gao Fuqiang [
13] investigated the rock burst process of coal by loading rock-coal-rock samples and found that small coal ejection occurred first, followed by large coal ejection during the loading process. Feng Longfei [
14] studied the influence of loading rate on coal sample failure and found that at low loading rates, coal samples failed due to penetrating cracks or monoclinic shear cracks, while at high loading rates, coal samples lost their bearing capacity due to lateral burst and ejection, resulting in coal ejection. Cheng Yunhai [
15] analyzed the composition, microstructure, and acoustic emission characteristics during the unloading of coal samples that were easily ejected.
In terms of research on the ejection phenomenon on-site, Wang Xuhong [
16] investigated the types of rock bursting, such as the blasting wall of mining roadway and the coal ejection from coal walls in the working face under three-hard and shallow burial conditions in the Datong mining area and analyzed the geological and mining factors affecting the occurrence of rock burst. Tan Yunliang [
17] studied the relationships between different depths and widths of the plastic zone and advancing degrees of the backstopping face and the generated kinetic energy. They concluded that the generation of kinetic energy would begin when the mining footage was larger than 0.8 times the width of the plastic zone. This explains the role of reducing the thrust speed and increasing the plastic zone by pressure relief to prevent rock bursts. Xu Yongxiang [
18] studied the rib spalling of coal walls in the working face of an extremely thick hard coal seam in the Yushen mining area and found that under the dynamic load of strong rock pressure, the coal wall broke instantaneously, resulting in the ejected of plate cracking and rib spalling. Song Dazhao [
19] established a dynamic ejected coal burst model for coal mine roadways under the action of stress and believed that the stress concentration area at the side of the roadway was the direct energy source of such ejection. Zhu Sitao [
20] explored the phenomenon of coal particle ejection in the driving face of a composite thick coal seam and concluded that the main reason for frequent coal particle ejection in the tunneling face of the composite thick coal seam was that the soft coal in the surrounding rock would quickly undergo unloading failure after roadway excavation, resulting in coal particle ejection. They proposed an early warning method for big rock noise events. Cao Jinrong [
21] analyzed the horizontal and vertical ejection velocities of the roadway through numerical simulation. Cheng Yunhai [
22] studied the ejection phenomenon of the driving face through field monitoring.
Based on the existing studies, the influencing factors, stress conditions, monitoring and warning mechanisms for the generation of ejection have been investigated. In the case of the roadway driven along goaf by small coal pillars under the influence of roof drainage, the monitored field stress and coal powder on-site did not exceed the standard, yet ejection phenomena still occurred, which are difficult to explain based on existing research.
In order to explain the cause of the ejection phenomenon, this paper is based on the critical energy condition of ejection-induced disaster, the relationship between the elastic energy of head-on static load, the transfer energy of microseismic source and the threshold of ejection-induced disaster energy. The head-on ejection disaster caused by rapid heading under the influence of roof drainage is studied. It is put forward that microseismic monitoring in front of head-on control of driving velocity and pressure relief in advance of boreholes are effective methods to prevent ejection rock bursts.
2. Engineering Background
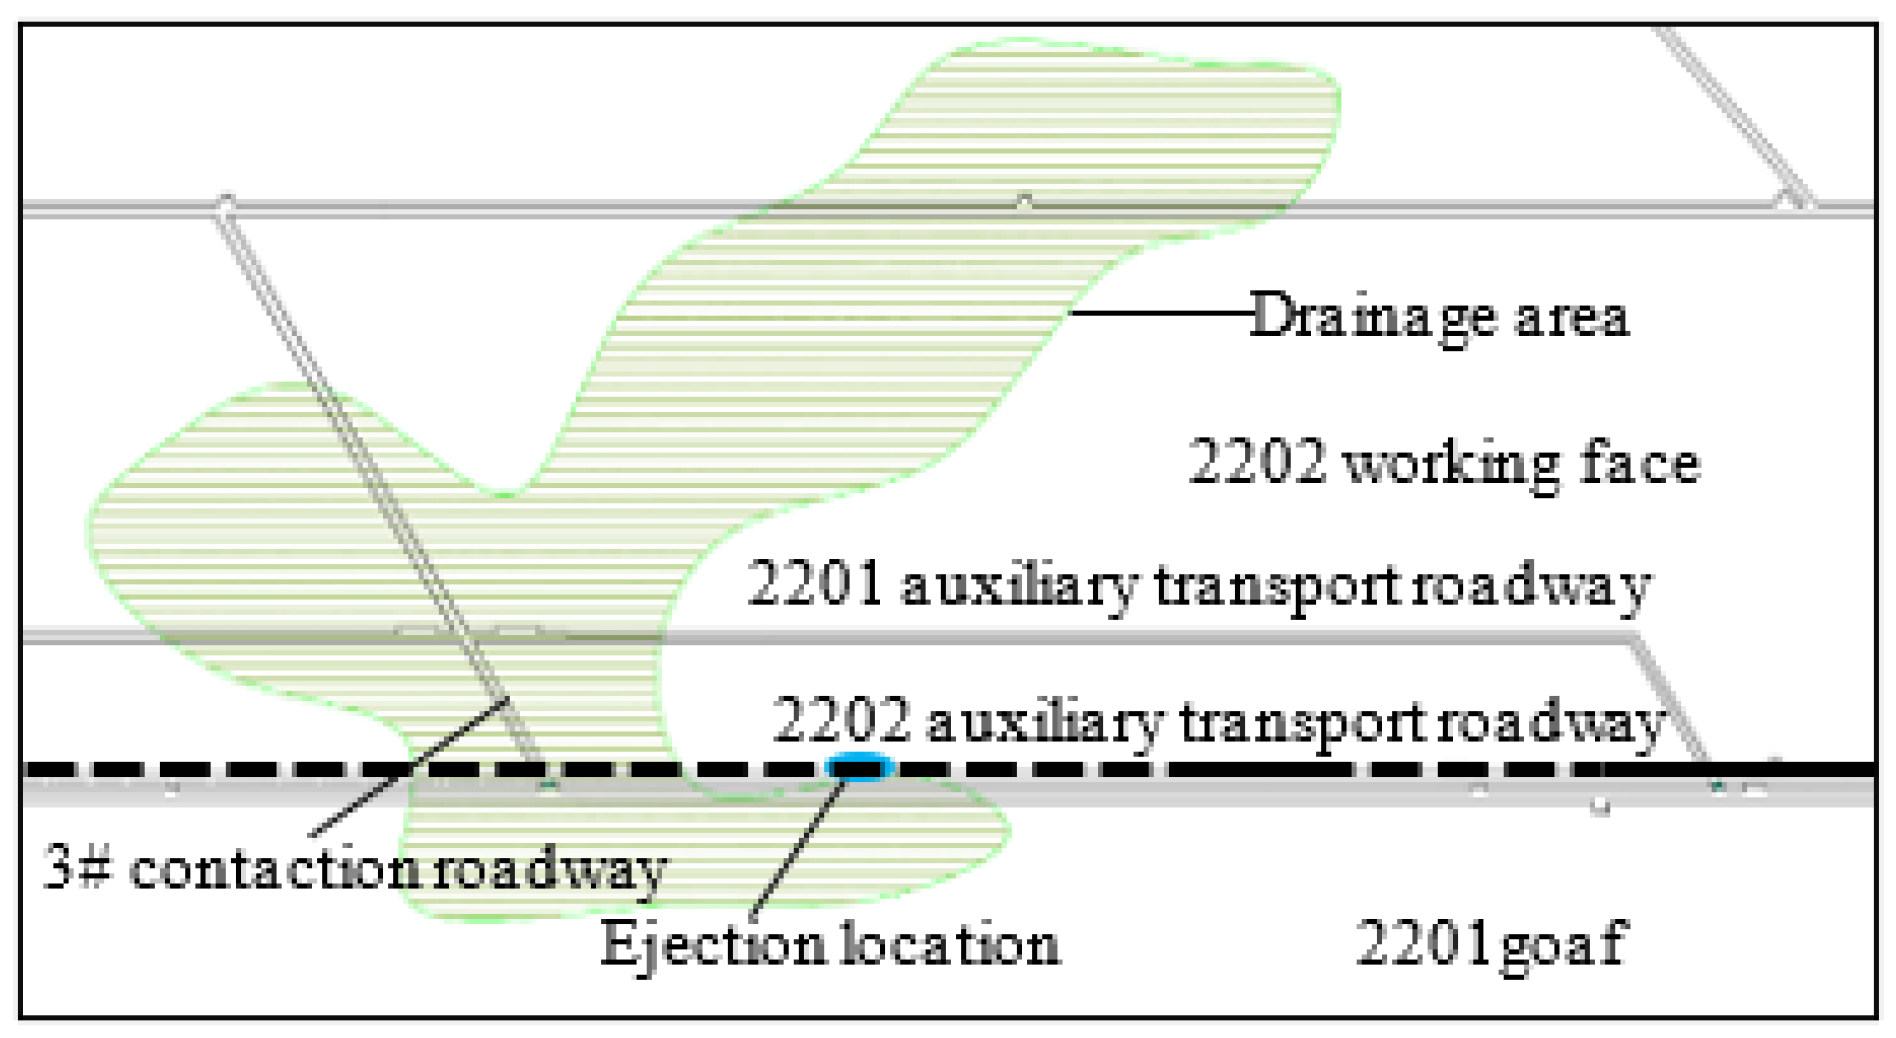
The phenomena of frequent coal blasting and a large amount of pulverized coal occurred in the relief hole during the 2202 auxiliary transport roadway in a mine. In the early morning of 20 April, coal ejection occurred on the driving face during the driving process, accompanied by large coal blasting and the generation of a significant amount of coal dust (19 April, with footage of 8 m per day).
The average burial depth of the 2022 auxiliary transport roadway is 731.4 m, and it is a roadway driven along the goaf located 5 m away from the 2201 goaf. The roadway is located in the low-stress area at the junction of the internal and external stress field [
23]. At a distance of 80 m from the 2202 auxiliary transport roadway, there is a 2201 auxiliary roadway of the working face, which is connected through the #3 contact roadway.
The 2202 auxiliary transport roadway is divided into two sections: one marked by black dotted lines and the other by solid black lines. The section marked by solid black lines indicates the area with large-diameter boreholes for pressure relief, while the section marked by black dotted lines indicates the area with no pressure relief from large-diameter boreholes during the mining process of the 2201 working face as shown in
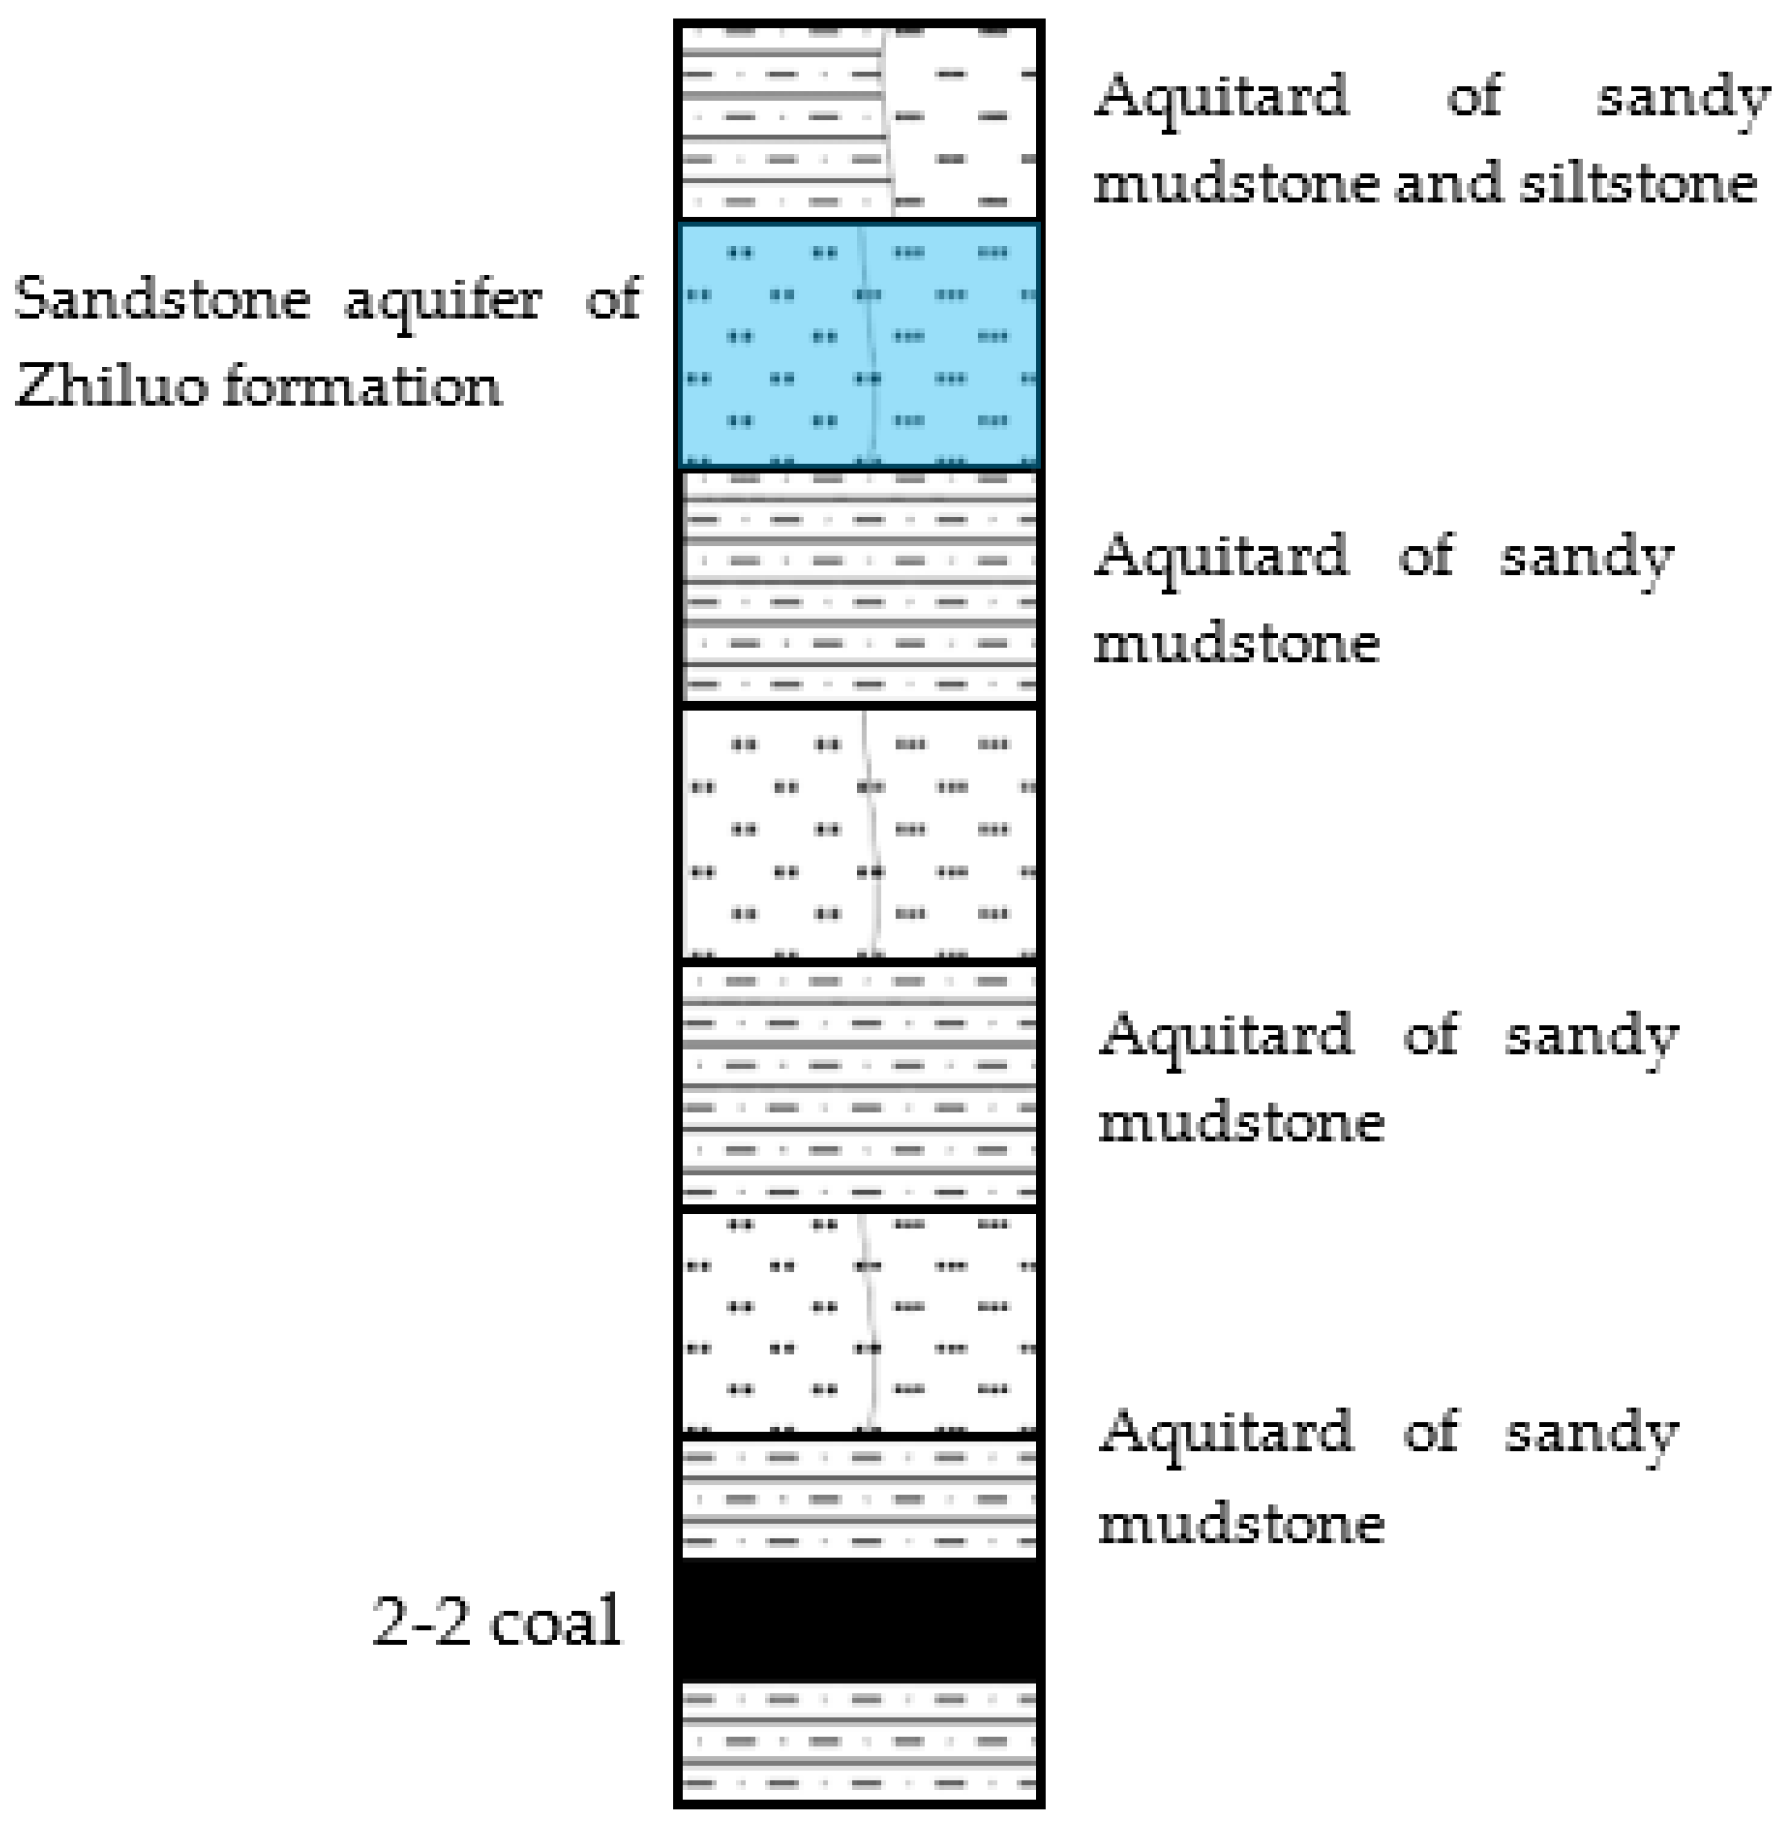
Figure 1. Aquifers and aquitards are shown in
Figure 2.
The coal seam has a simple structure, and no effects of geological structures such as faults and folds are observed. The dip angle ranges from 0~4°, with an average of 2°, and fracture development occurs within the coal.
3. Critical Conditions of Head-On Ejection Energy
With ejection distance as the index for disaster risk caused by head-on ejection, a model for the ejection distance and required energy is established to judge the disaster risk induced by head-on ejection in the case of not considering the contact bounce between coals and the top slope of the roadway.
Figure 3 shows the determination of the critical distance for disasters caused by head-on ejection during driving.
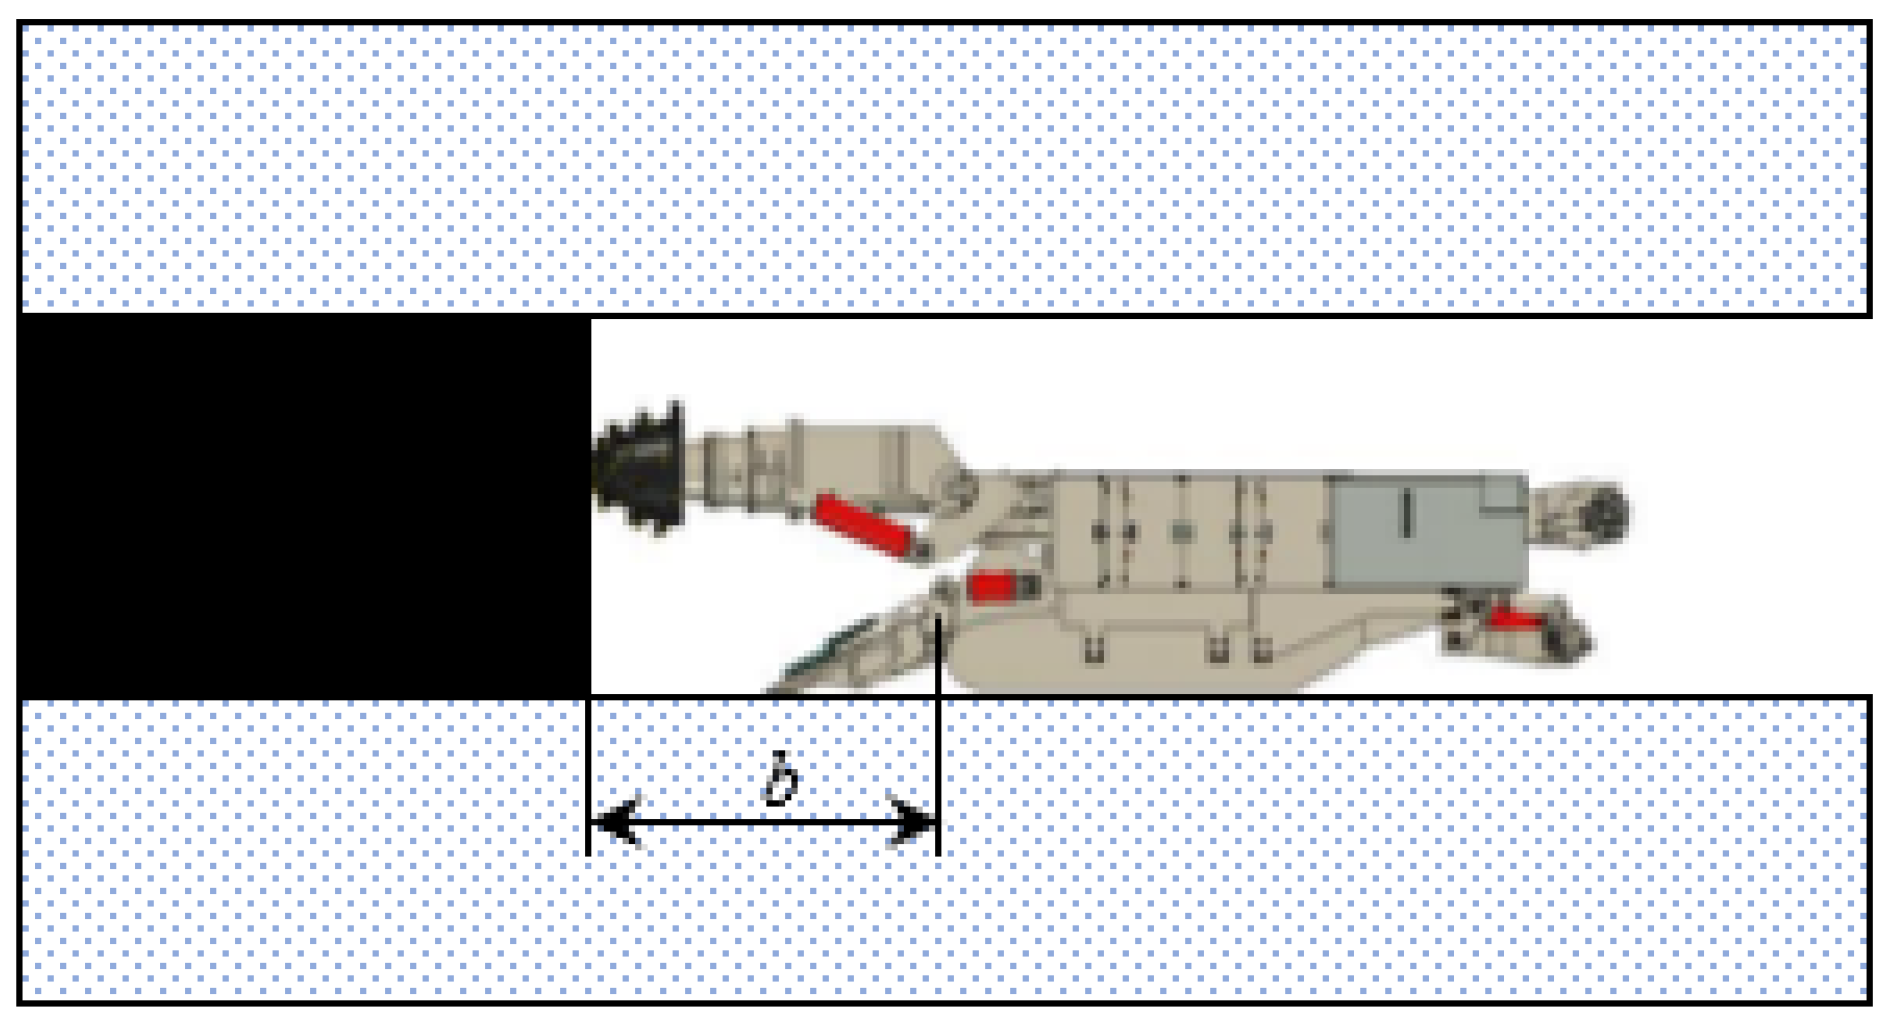
As shown in
Figure 3, the critical distance for the danger induced by head-on ejection is determined by the distance from the tail of the shovel plate in the roadheader to the driving face. The distance between the tail of the shovel plate and the driving face is represented by
b, which is the critical distance for ejection-induced danger. The coal ejection path is shown in
Figure 4.
According to the ejection path shown in
Figure 4, the calculation formula for the initial velocity of coal, determined by the height
h, angle
c, and critical distance
b, and then obtain the required critical energy of ejection-induced danger as shown in Equation (1).
The relational expression between the critical energy and the height
h from the base plate, angle
c, and critical distance
b, as shown in Equation (2).
On-site, distance
b from the tail of the shovel plate of the EBZ220-type roadheader to the driving face is 4.3 m, the density m of coal mass is 1350 kg/m
3, and the gravity acceleration
g is 9.8 m/s
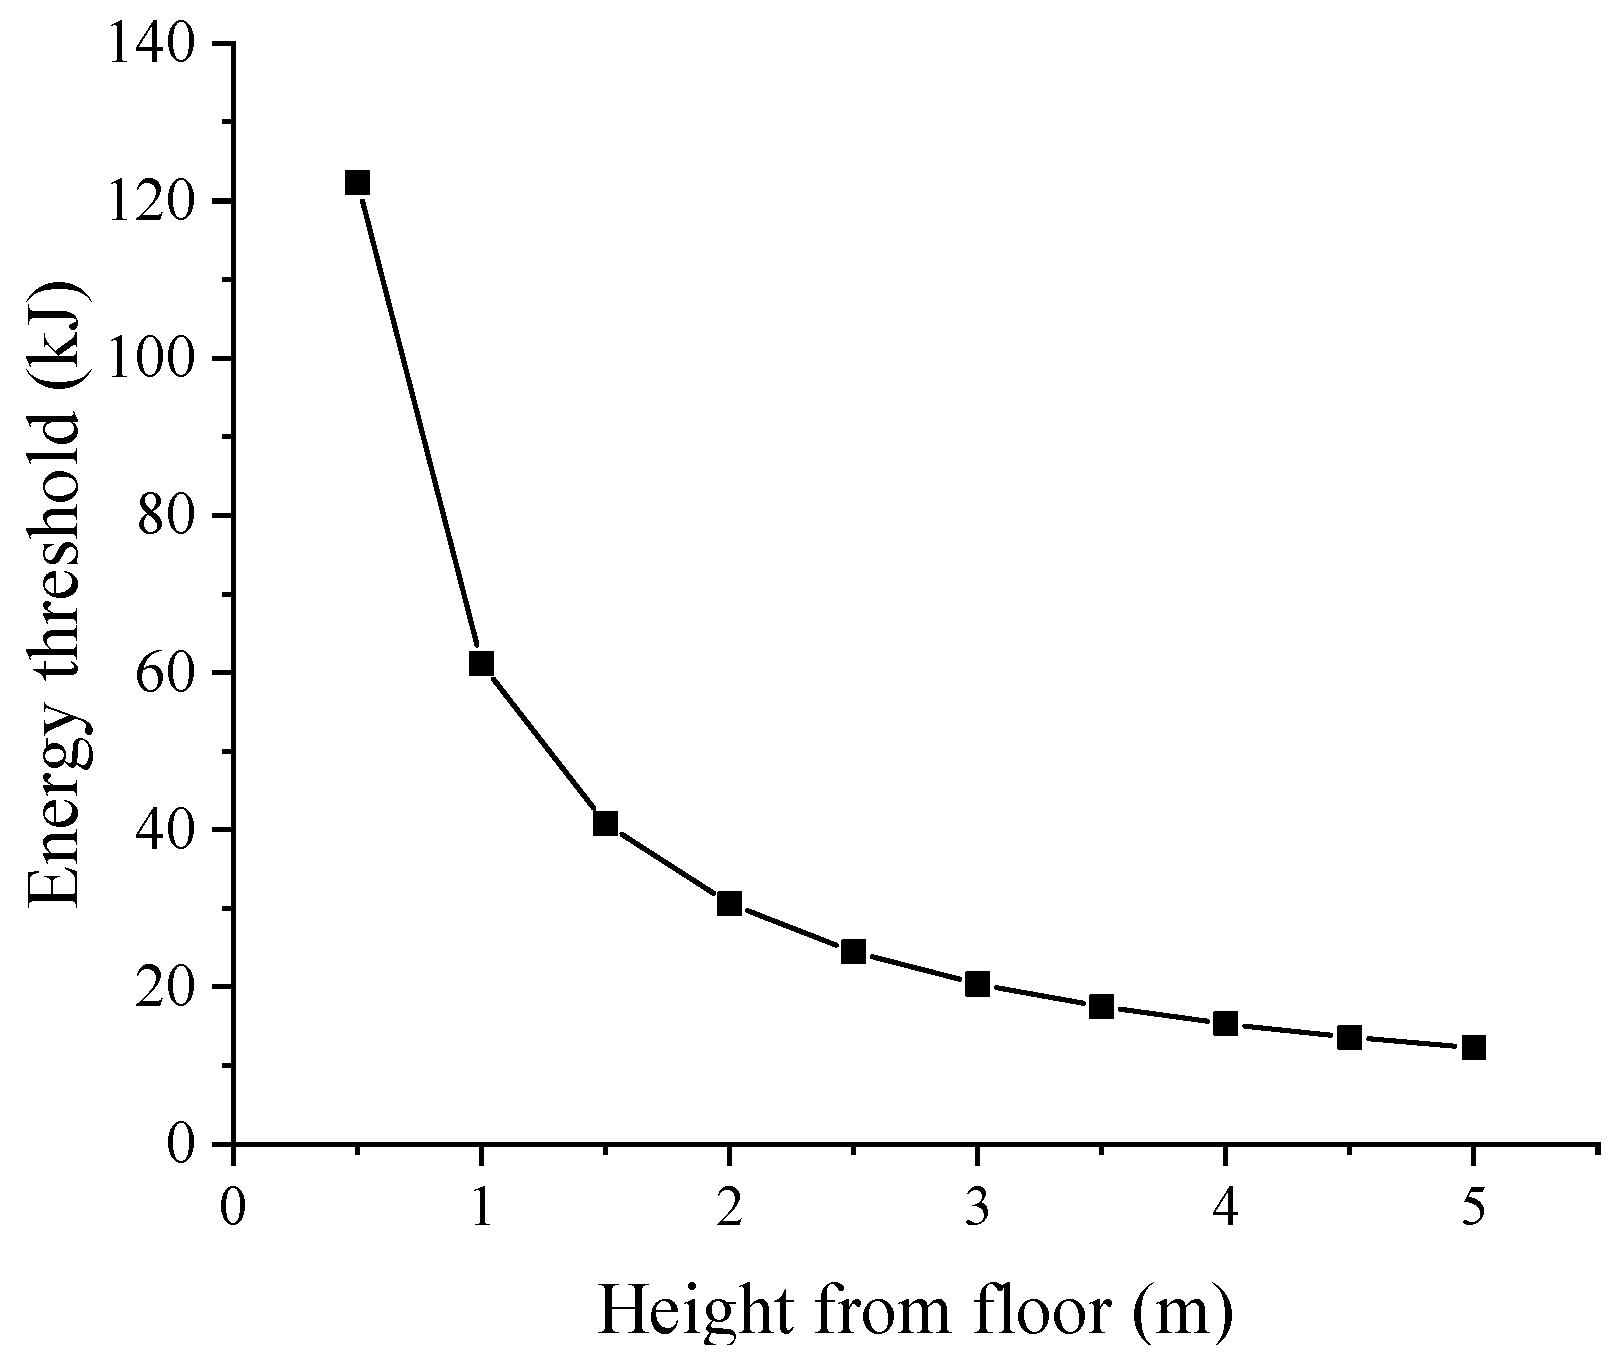
2. When the angle
c is 0°, the relation curve between the energy threshold
E and the height
h from the base plate is shown in
Figure 5. Furthermore, when the height
h from the base plate is 3 m, the coal wall is most likely to sustain damage at the point at 0.578 times the mining height [
24]); the relation curve between energy threshold
E and angle
c is shown in
Figure 6.
According to
Figure 5, the energy threshold gradually decreases with the increase of the height from the base plate. When the height from the base plate is 5 m, the energy threshold reaches the minimum value of 12.23 kJ.
According to
Figure 6, with the increase of angle, the energy threshold decreases gradually and then increases slightly. When the angle is 25–30°, the energy threshold reaches the minimum value of 14.87 kJ.
The minimum energy threshold is taken as the energy threshold for ejection-induced disaster, which is 12.23 kJ. When the elastic energy of the driving face surface exceeds 12.23 kJ, the condition for ejection risk exists.
4. Elastic Energy of the Driving Face under the Influence of Roof Drainage
The studies on rock bursts in roadway driving, including stress and plastic zone, mainly focus on the roadway behind the driving face, and there is a lack of studies on rock bursts of the driving face. In terms of the study on rock bursts of the driving face, the plastic zone expansion of coal damage has a time-dependent effect [
25], and the stress evolution mainly includes two stages: the driving process and the supporting process. During the driving process, the plastic zone range in front of the driving face decreases, the stress peak moves towards the driving face, and the surface of the coal wall has better integrity, making it easier to form local elastic energy accumulation. During the supporting process, due to the damage to the coal body in front of the driving face, the plastic zone expands, the stress peak gradually moves away from the driving face, the surface fragmentation degree of the coal wall intensifies, and the elastic energy of the driving face gradually decreases.
4.1. Elastic Energy of Driving Face under Static Load
The accumulation of elastic energy on the surface of the driving face is an important factor influencing the generation of ejection and is the energy condition for the ejection of coals from the driving face. The surface elastic energy of the driving face is calculated using the elastic energy test curves to identify the bursting tendency of the coal seam.
The average value of elastic energy in the identification of bursting tendency for the 2-2 coal seam is 4.94. The second group of experimental curves, with an elastic energy result of 4.97, is selected to calculate the elastic energy of the driving face. The stress–strain curve for the unloading section of the elastic energy of coal samples is expressed by Equation (3), and the surface elastic energy of the driving face is obtained by integrating Equation (3), as shown in Equation (4). The calculation result is shown in
Figure 7.
As shown in
Figure 7, the elastic energy Φ
SE of the coal body is represented by the area enclosed by the unloading curve of coal mass and the horizontal axis, and the other two boundaries represent the strains corresponding to
σ1 and
σ2. To quantitatively calculate the elastic energy of the coal mass, the unloading section on the index test curve for elastic energy is fitted, obtaining the fitting curve (curve in red) in
Figure 8, with the fitting equation given by Equation (5).
The residual analysis is carried out on the fitting equation to determine the fitting effect of the equation, and the value of R2 is 0.99992, demonstrating a good fitting effect.
The surface elastic energy is calculated by the integral of the fitting equation. The integral of Equation (5) is shown by Equation (6) as follows.
Figure 9 shows the relationship between the surface elastic energy and the stress on the driving surface calculated through Equation (6).
The required energy for inducing danger is 12.23 kJ, and the surface stress needs to reach 5.33 MPa to satisfy the energy condition for ejection-induced disasters. The surface stress of up to 5.33 MPa is the critical threshold of ejection risk.
4.2. Driving Velocity and Static Load of Driving Face under the Influence of Roof Drainage
The drainage in the water-rich anomaly area has a significant effect on the stress distribution of the coal seam. During gob-side entry driving, the stress distribution in the driving face differs from that at the relative location of the water-rich anomaly area. Additionally, the driving velocity significantly influences the advanced stress distribution on the driving face during the driving process.
To analyze the surface stress during gob-side entry driving, the advanced stress evolution of the driving face is studied from two perspectives: the different relative location relationship between the driving face and the water-rich anomaly area and the driving velocity.
The methods for investigating backstopping velocity and driving velocity in the numerical simulation were determined based on the driving of a coal roadway on-site through a fully-mechanized excavator. Different driving velocities correspond to differences in cutting interval time, and in simulations, the driving speed is denoted by different running steps with the same cutting step distance.
To analyze the advance stress distribution on the driving face at different relative locations in the water-rich anomaly area (see
Figure 10), the advance stress distribution on the driving face at the locations of 100 m, 240 m (275 m), 394 m, 461 m (440 m), and 640 m (610 m) from the Y coordinate were selected for the study, based on the distribution of the water-rich anomaly area.
The advanced stress distribution at different locations of the driving face shows similar changes under different running steps. The advanced stress on the driving face under 50 running steps differs significantly from those under 100, 200, and 300 running steps. In terms of value, the advanced stress on the driving face under 50 running steps is greater than those under 100, 200 and 300 sunning steps. Regarding the advanced distance corresponding to the advanced peak stress, the stress peak under 50 running steps is also closer to that on the driving face.
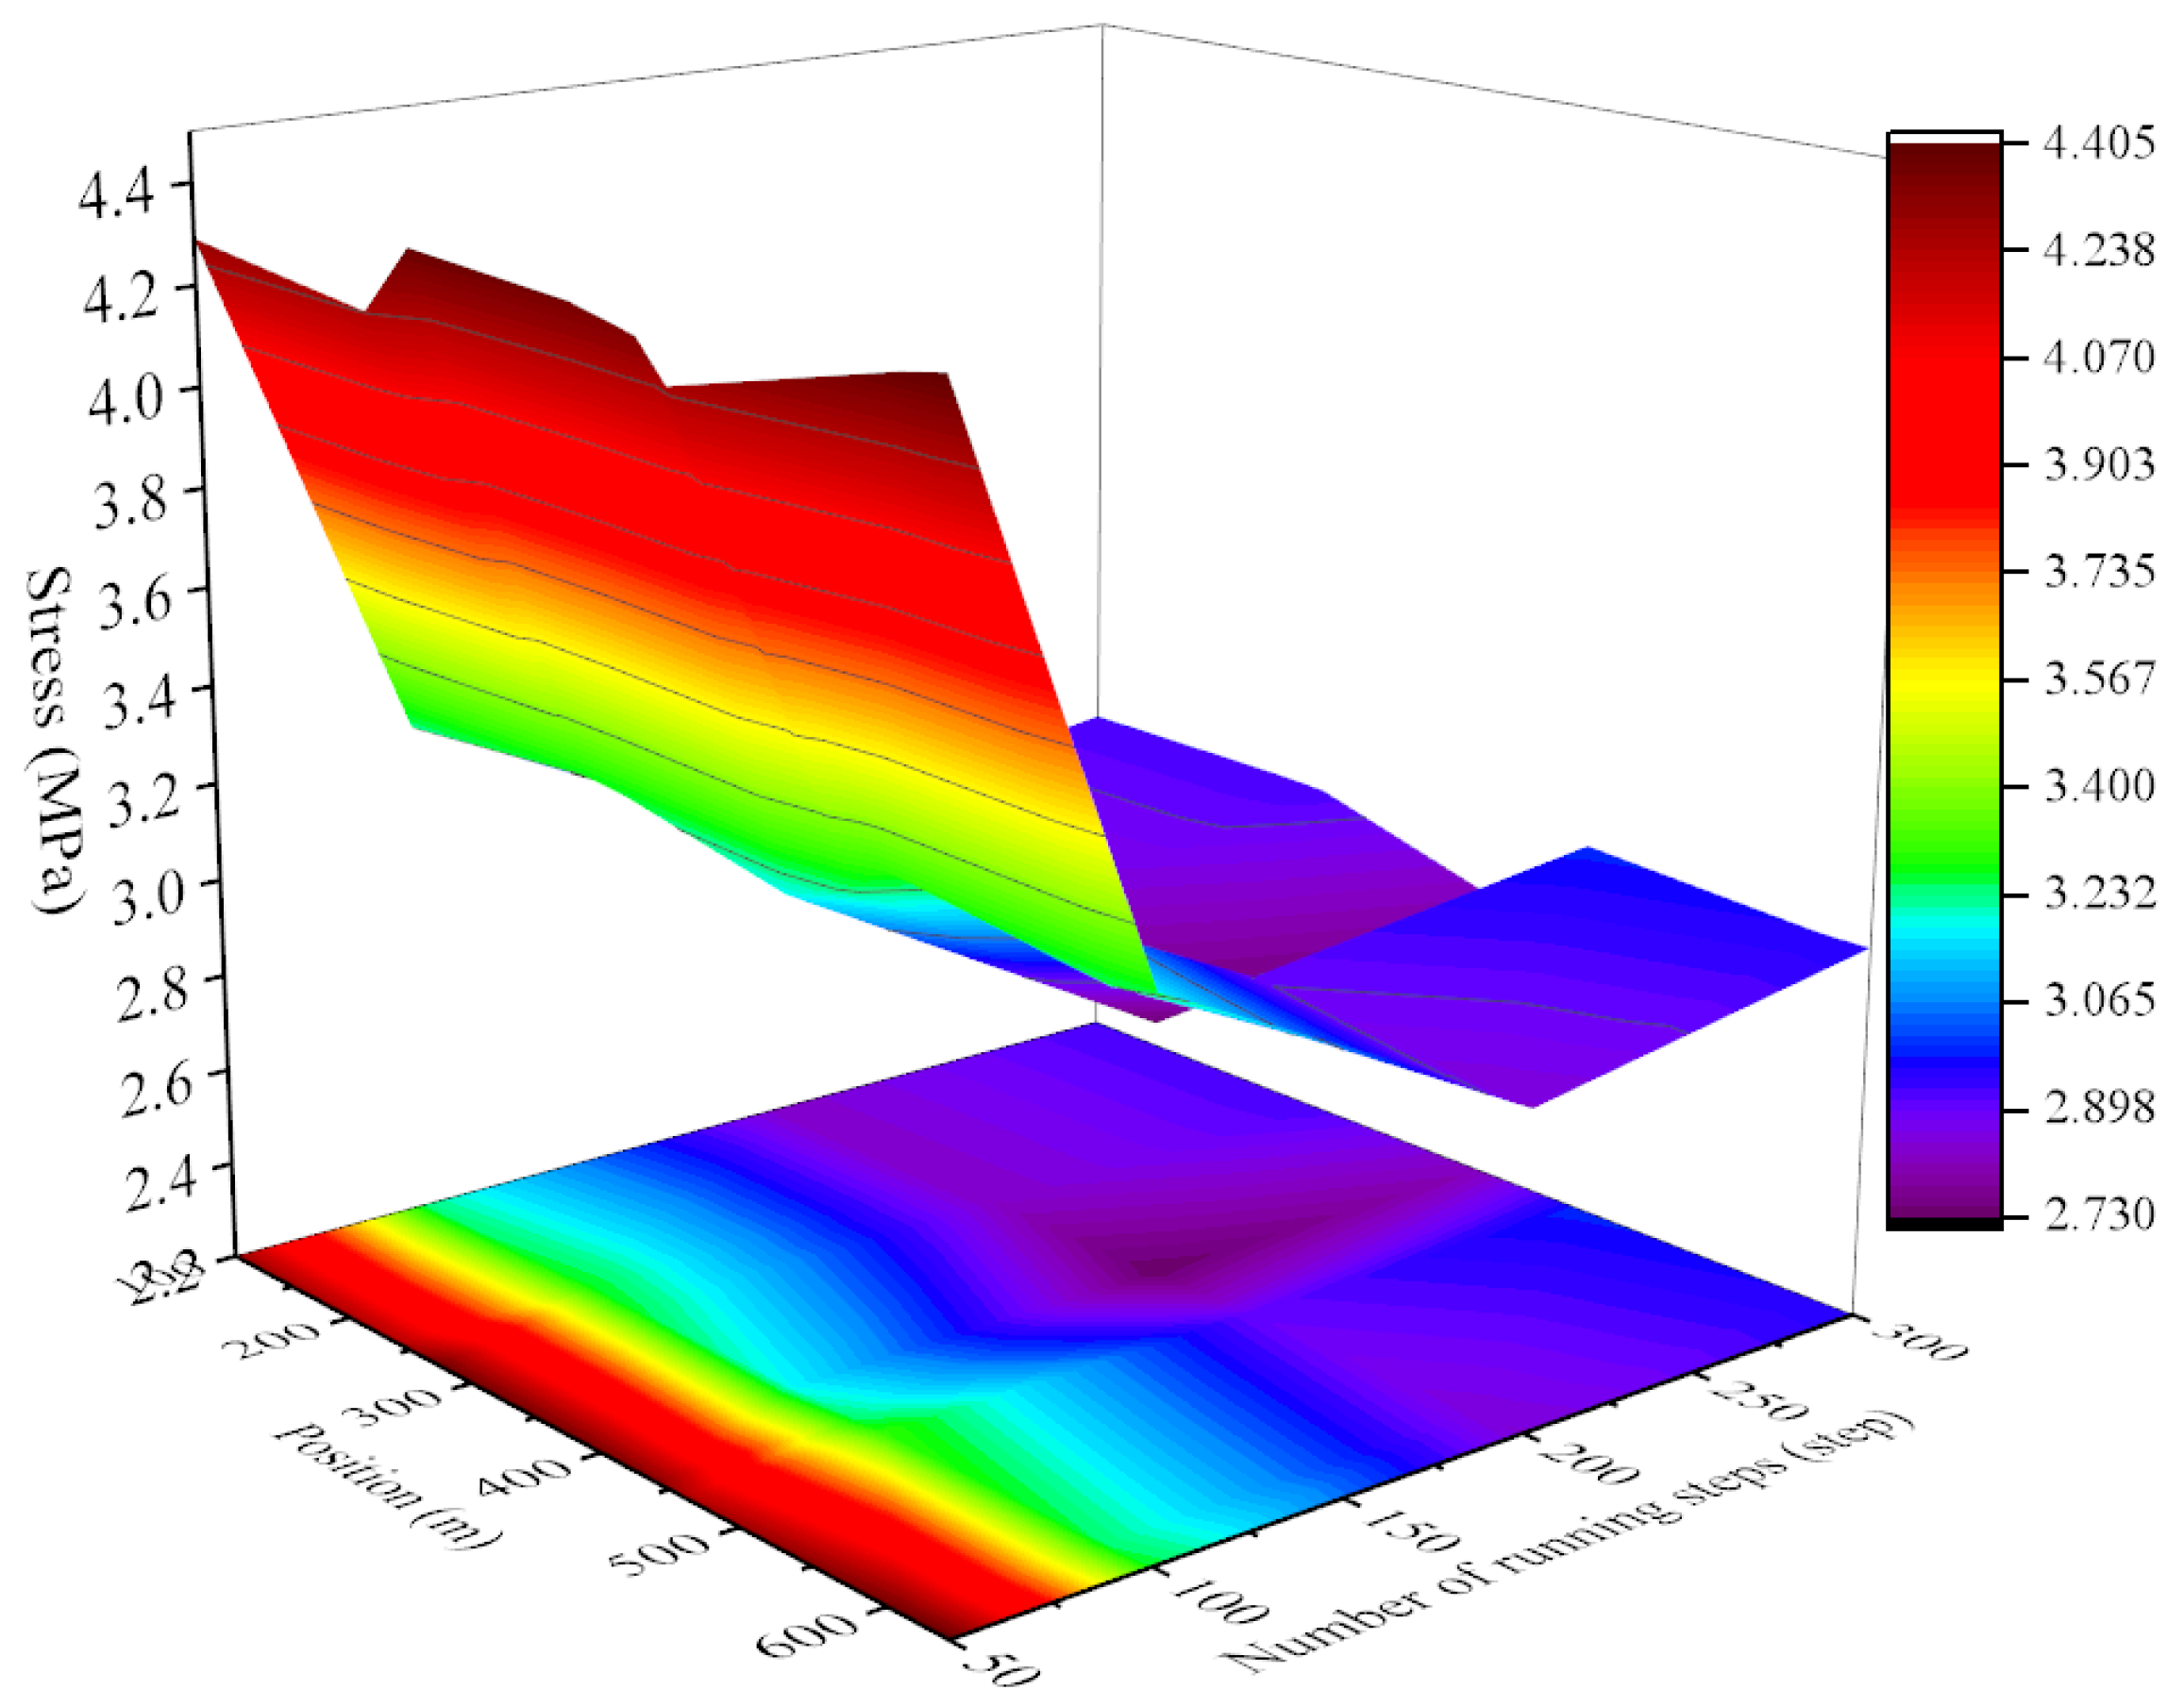
To better present the monitoring results, the diagram for the relationships between the surface stress value for the driving face and the location of the driving face, and the number of running steps are plotted, as shown in
Table 1 and
Figure 11.
The surface stress of the driving face varies with the number of running steps and the location of the driving face. In terms of the numbers of running steps, the surface stress increases from 2.73–2.90 MPa (200 steps) to 4.24–4.40 MPa (50 steps), an increase of 46.68–59.66%. With the number of running steps increasing from 300 to 500, surface stress generally presents a rising trend, with an increase of 46.68–59.66%. In terms of the location of the driving face, the range of variation for the surface stress at different locations is as follows: 2.82–2.99 MPa (300 steps), 2.73–2.90 MPa (200 steps), 3.18–3.30 MPa (100 steps), and 4.24–4.40 MPa (50 steps), with the maximum value of being 3.75–6.24% higher than the minimum value. The results show that the influence degree of driving velocity on the surface stress is much higher than that on the peak advance stress. This provides a basis for regulating the driving velocity in areas influenced by roof drainage to prevent and control rock bursts.
Equation (6) provides a calculation for the surface elastic energy. When the surface stress on the driving face is 2.73 MPa, the energy is calculated to be 4.79 kJ, and when the surface stress is 4.40 MPa, the energy is 9.34 kJ. Both of these values are lower than the critical value of 12.23 kJ for ejection-induced disaster. Therefore, it is difficult for ejection-induced disaster to occur because only under the action of surface stress is the elastic energy of the driving face less than the required energy threshold.
4.3. Driving Velocity and Dynamic Load on the Driving Face under the Influence of Roof Drainage
(1) The Influence of Roof Drainage on Driving Velocity and Microseismic Characteristics. Since the stress in front of the driving face cannot be directly obtained, the critical driving velocity is used as an index to ensure safe driving based on the correlation between the advanced stress distribution on the working face and the backstopping velocity. In this study, the critical driving velocity is determined using field monitoring methods.
For analysis, data including daily footage, energy, events number, energy in front of the driving face, and the number of events in front of the driving face from April 11th to 30th are selected.
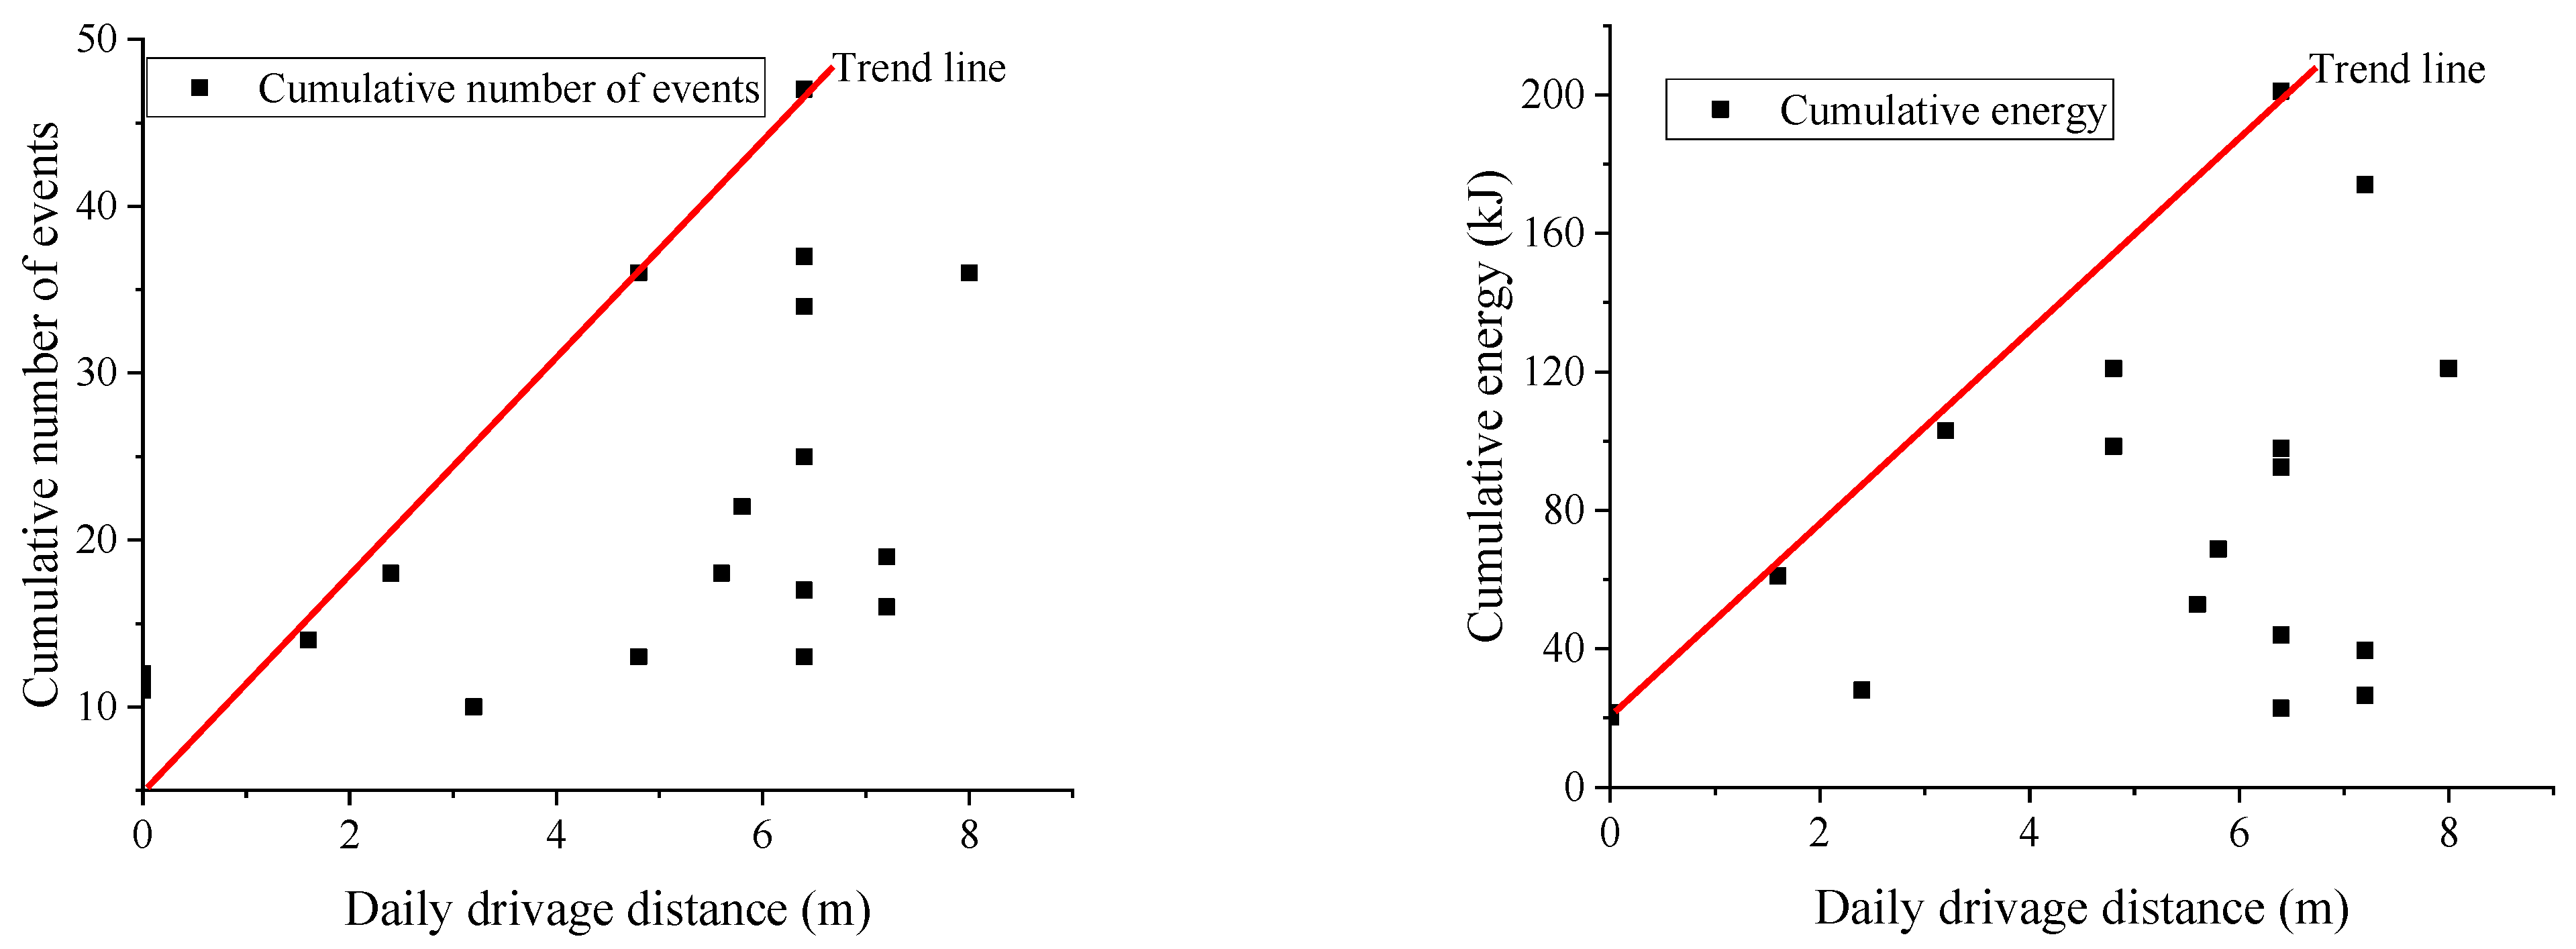
Figure 12 shows a better linear relationship among all microseismic events, energy, and driving velocity in the driving face, with the microseismic events mostly falling within the red line. However, using all microseismic data in this area for early warning purposes would be one-sided.
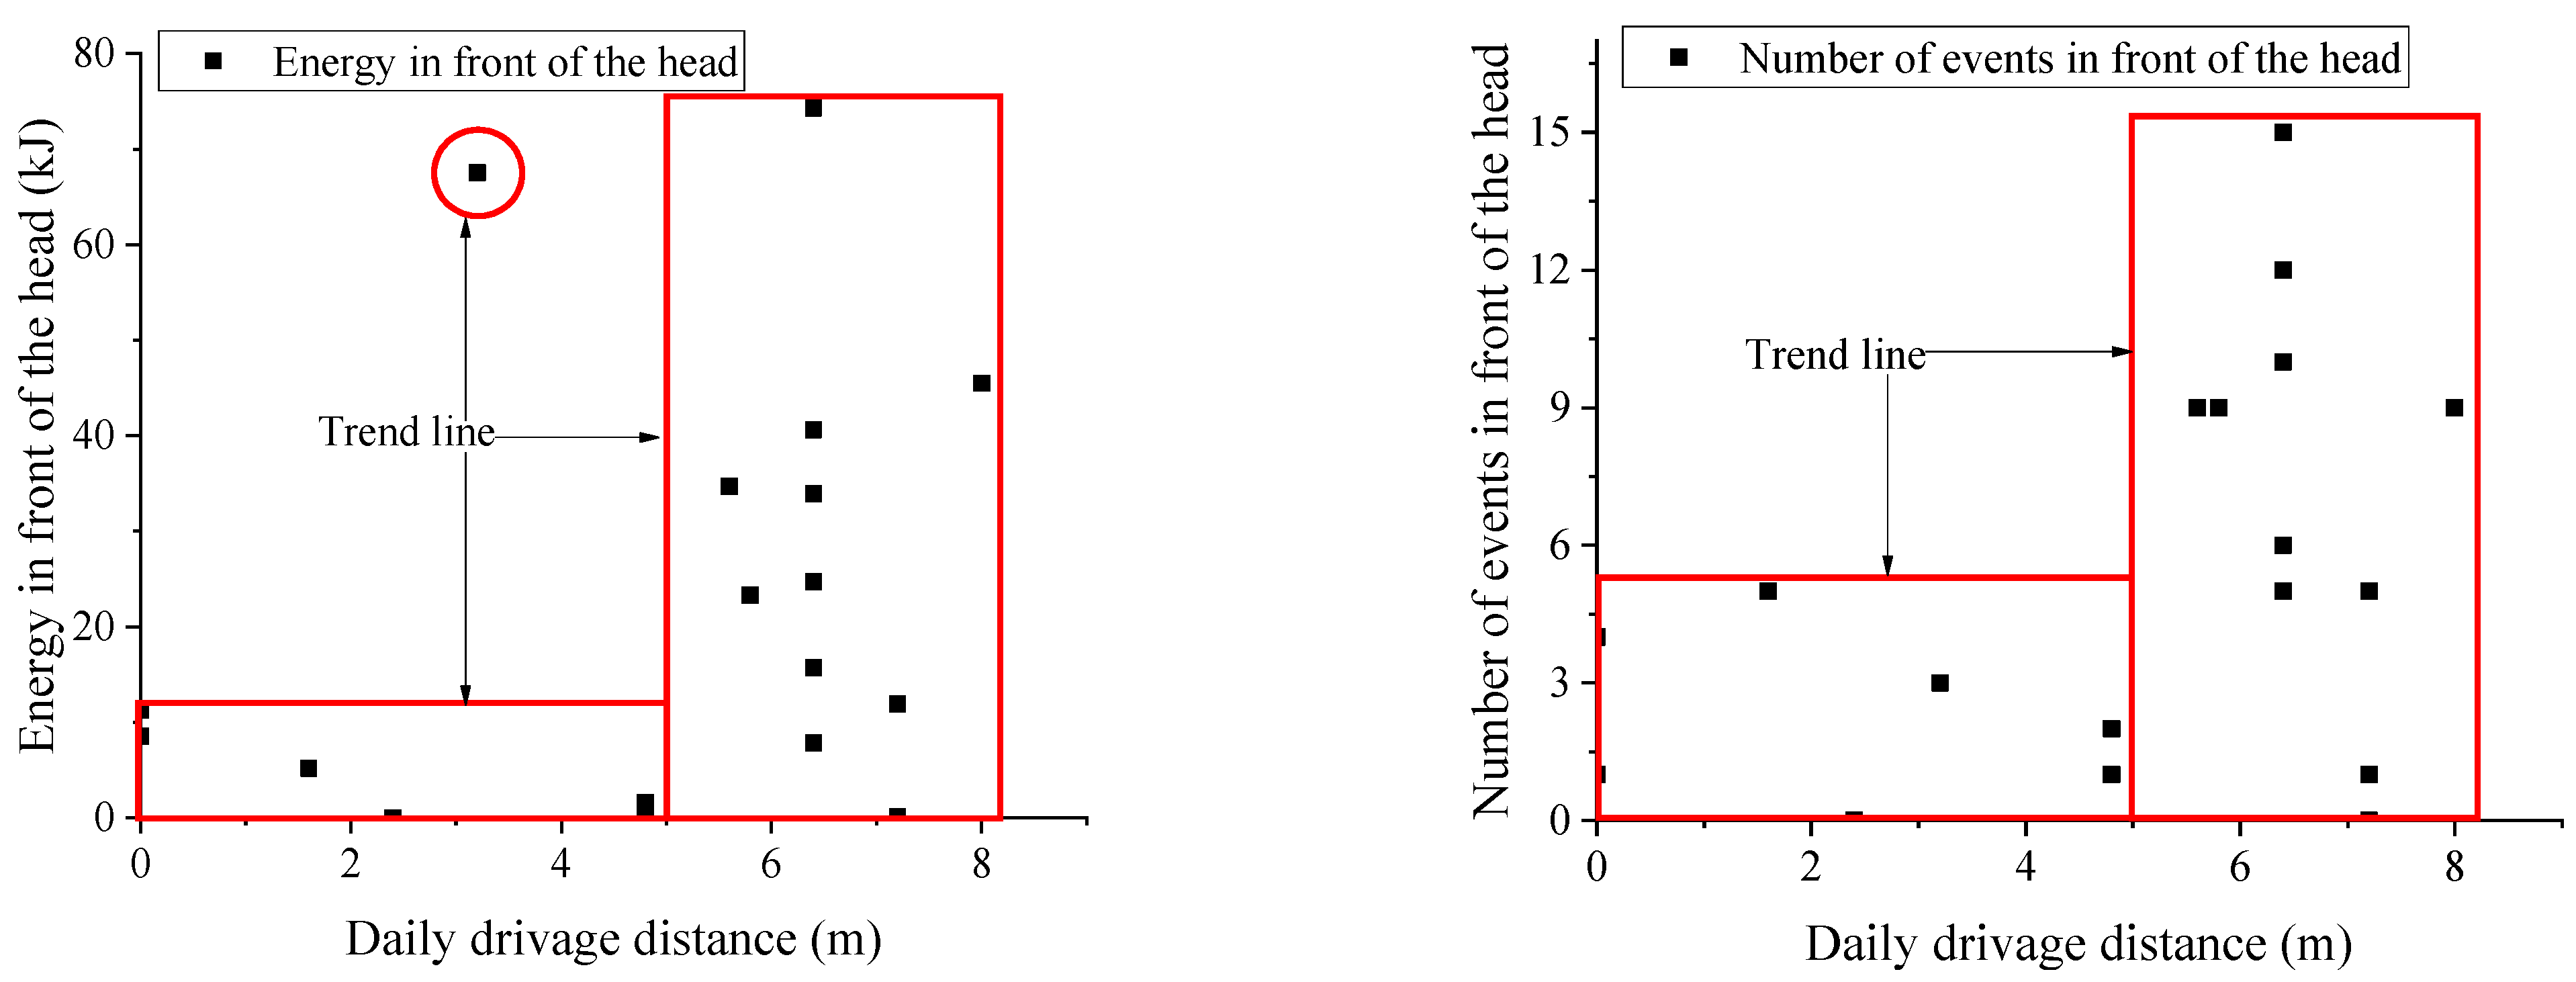
Figure 13 represents a staged relationship among microseismic events, energy and driving velocity in front of the driving face. An obvious demarcation point appears near the driving velocity of 5 m/d. When the driving velocity is less than 5 m/d, the number of microseismic events and energy remains low. Conversely, when the driving velocity is greater than 5 m/d, they are relatively high, as shown in the red box in the figure. The abnormal data in the red circle are from April 20, when an ejection occurred. The occurrence of ejection affected the driving footage on-site, resulting in abnormal data.
After drilling 5–7 m into the head-on pressure relief boreholes, frequent coal blasting and increased coal powder are observed. This phenomenon in the head-on pressure relief borehole is consistent with the conclusion from microseismic monitoring that the advanced stress begins to rise after 5–7 m.
Based on the laws governing plastic zone development and stress evolution in front of the driving face during the driving process, there is a critical velocity for ensuring safe driving, which is also verified in the literature [
16]. The obtained critical driving velocity is 5 m/d, based on the microseismic monitoring results and the observations during the implementation of pressure relief engineering.
(2) Transfer laws of microseismic dynamic load and the risk of ejection-induced disasters.
Numerous microseismic events are generated in front of the driving face under the influence of the drainage area and driving velocity.
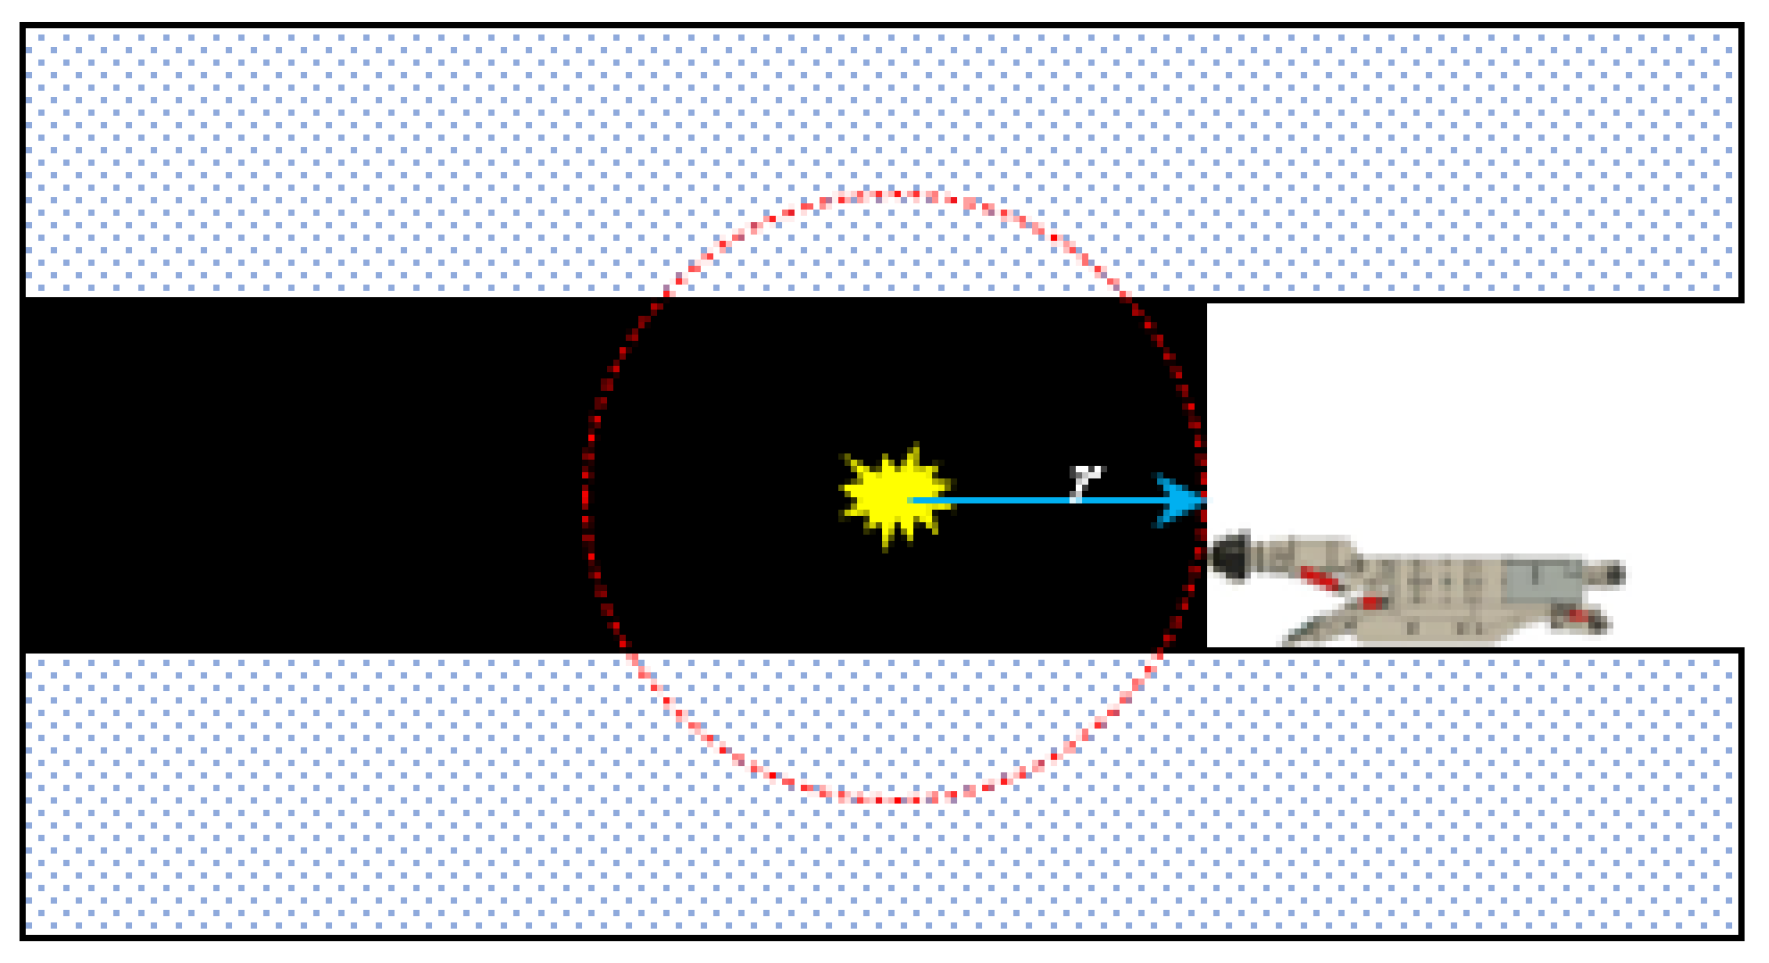
Figure 14 shows the impact of microearthquakes events in front of the driving face on coal mass. The energy transferred from the seismic source to the driving face is related to the energy of the seismic source, the distance from the driving face, and the attenuation coefficient of microseismic wave propagation [
26], as shown in Equation (7).
where
E represents the energy from the location
r away from the seismic source;
E0 represents the seismic source energy, with a value of 1.0 × 10
2–7.7 × 10
4 J;
r denotes the distance from the seismic source, with a range of 6–110 m; and
λ denotes the attenuation coefficient for seismic source energy, with a value of 0.0255.
To investigate the attenuation laws of microseismic energy, the seismic source energy is set to 10 kJ to study the influence of different distances from the seismic source. The distance from the seismic source is set to 20 m to study the impact of different seismic source energy.
Figure 15 is plotted.
As shown in
Figure 15a, the energy value rapidly decreases with increasing distance from the seismic source and then tends to decrease more gradually. At a distance of 60 m, the energy is only 2.17 kJ, which is about 22% of the seismic source energy. As shown in
Figure 15b, the energy value at a certain distance from the seismic source exhibits a linear correlation with the seismic source energy, representing approximately 60% of the seismic source energy.
According to the calculated results from the previous section, the energy threshold causing ejection disaster is 12.23 kJ, the elastic energy caused by surface stress on the driving face is 9.34 kJ, and the minimum energy provided by microquake is 2.89 kJ. In other words, when the driving face receives no less than 2.89 kJ of energy transferred by a microearthquake, there is a risk of ejection-induced disasters.
Taking 2.89 kJ of energy received by the coal mass in the driving face as the standard, the relationship between the required seismic source energy and the distance from the seismic source to the driving face is obtained according to Equation (7), as shown in
Figure 16.
The relationship between the seismic source energy and the distance from the seismic source to the driving face should satisfy the curve shown in
Figure 16. In other words, when the data points for the seismic source energy and the distance from the driving face are located above the curve in
Figure 16 (the blue region in the figure), the energy transferred by the microseismic source reaches the critical value for ejection-induced disasters, indicating a risk of such disasters.
5. Prevention and Control of Ejected Rock Burst in Driving Face
On the basis of determining the elastic energy accumulation on the surface where ejection occurs in the driving face and the disturbance factors for microseismic dynamic load, the prevention methods of microseismic monitoring, advanced powder coal monitoring, driving velocity control, and advanced borehole pressure relief in front of the driving face have been determined.
(1) Microseismic monitoring in front of the driving face
The driving face is an area that constantly changes. The main methods used to monitor the driving face are drilling cuttings monitoring and microseismic monitoring. The drilling cuttings method involves monitoring at a specific frequency, while microseismic monitoring provides real-time monitoring. The driving process involves horizontal unloading and vertical loading of the coal mass in front of the driving face. The driving velocity affects the loading and unloading rates of the coal mass in front of the driving face, which in turn affects the failure and energy release of the coal mass. Microseismic monitoring can detect fractures in the coal mass in front of the driving face, which is indicated by microseismic activity. Microseismic activity in front of the driving face can indicate the risk of ejected rock burst in the driving face.
During the driving process under the drainage area of 2202 auxiliary transport roadway, the stress monitoring and drilling cuttings monitoring show no anomaly, but the microseismic monitoring shows a linear relationship with the driving speed. Therefore, it is impossible to identify the risk of ejected rock burst in the driving face. However, there is an obvious stepwise relationship between the microseismic activity in front of the driving face and the driving velocity. Based on the microseismic activity in front of the head, the risk of ejected rock burst in the driving face can be monitored.
(2) Controlling driving velocity
The role of controlling driving velocity in preventing and controlling ejected rock bursts is reflected in two aspects. One is reducing the disturbance of the surrounding rock, and the other is reducing energy accumulation in the driving face. Reducing the disturbance of the surrounding rock means decreasing the failure intensity of the coal mass and minimizing the influence of fracture on the surface coal mass. Reducing energy accumulation on the driving face means reducing stress concentration on the surface of the coal mass and increasing the widths of the failure zone and plastic zone in the driving face. This approach decreases the elastic energy accumulation in the driving face. Microseismic monitoring can be used to monitor the coal mass fracture in front of the driving face, and advanced borehole pressure relief can promote the process of expanding the failure zone and plastic zone.
The reasonable driving velocity can be determined by monitoring the microseismic activity in front of the driving face. During the driving process under the drainage area in the 2202 auxiliary transport roadway, the microseismic energy and the events number in front of the driving face show an obvious stepwise phenomenon near the driving velocity of 5 m/d. When the driving velocity is less than 5 m/d, the microseismic energy and the number of events in front of the driving face are at a low level; when the driving velocity is above 5 m/d, they are at a high level. Therefore, the reasonable driving velocity for this section of the roadway should be 5 m/d.
(3) Advanced borehole pressure relief
The fracture structure of the coal body has a great influence on the energy accumulation of the coal seam. The effect of temperature on the fracture structure of coal has been studied [
27,
28,
29]. Except for the temperature, large-diameter boreholes in coal mass can change the physical properties of coal mass and the conditions of energy accumulation. They can reduce the elastic modulus of coal mass, increase its deformation, and transfer the stress of coal mass away from the roadway surface [
30]. When the mechanical properties of coal mass change, the time effect of the plastic failure of coal mass also changes. Therefore, the process of expanding the failure zone and plastic zone in front of the coal mass is accelerated under the same stress condition.
During the driving process of the 2202 auxiliary transport roadway in the range of weak and medium burst danger zone, the driving face adopts large-diameter borehole pressure relief with a drilling depth of no less than 30 m and a length of pressure relief protection belt of no less than 10 m.
6. Conclusions
To address the problem of disasters induced by head-on injection during gob-side entry driving under the influence of roof drainage, the critical energy for ejection-induced disasters is studied through theoretical analysis, numerical simulation, and field monitoring. Based on these findings, prevention and control schemes are formulated.
(1) Based on the ejection distance, the energy threshold for ejection-induced disaster was determined to be 12.23 kJ. The maximum elastic energy caused by static load under the influence of roof drainage was found to be 9.34 kJ, which is smaller than the critical value of 12.23 kJ for ejection-induced disasters. This means that the elastic energy caused by the static load is less than the required energy threshold for the occurrence of ejection-induced disasters, making such disasters less likely to occur.
(2) Based on the microseismic activity in front of the driving face under the influence of roof drainage, a critical driving velocity for dynamic load shock was identified. The microseismic monitoring showed that the critical driving velocity is 5 m/d. If the driving velocity exceeds this threshold, the energy from the microseismic source increases in a stepwise manner. When the energy transferred to the driving face exceeds 2.89 kJ, the risk of ejection-induced disasters increases.
(3) Based on the determination of the superposed energy of the accumulated elastic energy caused by the static load of ejection-induced disasters on the driving face and the energy transmitted by microearthquake activity, measures such as microseismic monitoring, drilling cuttings monitoring, driving velocity control and advanced large-diameter borehole pressure relief in front of the driving face are implemented to prevent and control disasters induced by head-on ejection.


