Article

A Comparative Investigation of the Adsorption Characteristics of CO2, O2 and N2 in Different Ranks of Coal

1
School of Geology and Mining Engineering, Xinjiang University, Urumqi 830017, China
2
School of Ecology and Environment, Xinjiang University, Urumqi 830017, China
3
School of Safety Engineering, China University of Mining and Technology, Xuzhou 221116, China
4
School of Civil Engineering, Xuzhou University of Technology, Xuzhou 221018, China
*
Authors to whom correspondence should be addressed.
Sustainability 2023, 15(10), 8075; https://doi.org/10.3390/su15108075
Submission received: 25 March 2023 / Revised: 11 May 2023 / Accepted: 14 May 2023 / Published: 16 May 2023
(This article belongs to the Special Issue Coal and Rock Dynamic Disaster Monitor and Prevention)

Abstract

:
The adsorption mechanism of carbon dioxide, oxygen and nitrogen in coal is important for preventing and controlling coal spontaneous combustion and for understanding the technology of CO2 storage in goaf. Adsorption amount and adsorption heat are key adsorption parameters that are required to understand the material and energy conversions during adsorption in coal. In this study, we studied the factors that influence the adsorption amounts and adsorption heat values of carbon dioxide, oxygen and nitrogen in coal by testing four different coal samples using conventional coal quality analysis, low-pressure nitrogen and carbon dioxide adsorption, Fourier transform infrared spectroscopy and three gas adsorption experiments at different temperatures. Then, we analyzed the relationships between the structural parameters of the coal samples and the adsorption amounts and the adsorption heat values of carbon dioxide, oxygen and nitrogen. The results show that the adsorption isotherms of carbon dioxide conform to the Langmuir equation, and the adsorption isotherms of oxygen and nitrogen conform to Henry’s law between 0 and 110 kPa. The adsorption amounts of carbon dioxide, oxygen and nitrogen decreased with an increase in temperature, and the change in the rate of the adsorption amount with temperature was determined by the adsorption heat. The results of the pore structure show that the pores of the coal samples are composed of mesopores and micropores; the micropores contribute to the main specific surface area. The micropore and mesopore structures are the main determinants of the adsorption amounts of carbon dioxide, oxygen and nitrogen in coal. The gas adsorption heat is affected by the pore structure and the chemical composition of coal. The adsorption heat of nitrogen correlates positively with the pore structure of the coal. The adsorption heat of oxygen correlates positively with the ash, elemental nitrogen, elemental sulfur and mineral contents of the coal. The adsorption heat of carbon dioxide correlates positively with the elemental sulfur content of the coal.

1. Introduction

Coal spontaneous combustion (CSC) fires are major thermodynamic disasters in coal mines [1,2] which directly affect efficient coal mining, threaten the occupational health and life of workers, and destroy the ecosystem around a mining area [3,4]. Underground mining is the main coal mining method, and this method leaves goaf behind the working face after the coal is mined out. The goaf is the main location of spontaneous combustion fires due to the presence of residual coal and serious air leakage in the goaf [5,6,7]. Inert gases such as N2 and CO2 can be injected into goaf to effectively prevent and extinguish fires in the goaf [8,9,10,11]; recent studies have recommended injecting flue gas from power plants (mainly composed of N2 and CO2) into the goaf to prevent coal spontaneous combustion [12,13]. This has the additional benefit of reducing CO2 emissions. Coal is a natural porous adsorbent for many gases [14,15,16]. Since CSC begins with the physisorption of O2 in coal [17,18], injecting inert or flue gas into a goaf, reduces the adsorption of O2 due to the competitive adsorption of CO2, O2 and N2 in coal, thus preventing CSC [19]. Hence, studying the physisorption characteristics of CO2, O2 and N2 in coal is imperative to prevent and control CSC and store CO2 in goaf.
The physisorption of gas in coal is a typical heat and mass transfer process. The adsorption amount and adsorption heat, which reflect the material and energy transfer characteristics of the process [20], are the most widely studied adsorption parameters. Currently, there are many studies on the adsorption behaviors of CO2, CH4 and N2 in coal for coalbed methane exploitation and CO2 geological storage [21,22,23]. Some researchers have also studied the process of CH4 replacement in coal by injecting CO2 or N2 [24,25,26,27]. In addition to external factors (temperature and pressure), the gas adsorption amount is determined by coal properties (such as coal rank, maceral, moisture, minerals, pore characteristics, molecular organization and particle size of coal) [28,29,30,31,32,33,34,35,36,37]; the gas adsorption heat is affected by the macerals, pore characteristics and molecular organization of the coal [38,39,40]. In addition, the adsorption amount and adsorption heat are related to the critical properties of the gas [41,42,43]. The adsorption amount and adsorption heat are key adsorption parameters that are required to understand the material and energy conversions during adsorption in coal. At present, the relationship between adsorption amount and adsorption heat is not clear. Few studies have compared the difference in the influencing factors of adsorption amount and adsorption heat.
The physisorption behaviors of O2 in coal and the influencing factors have been widely studied. Lu et al. tested the physisorption amounts of O2 by using four different coal samples at low temperatures [17,18]. The results showed that the adsorption amount of O2 was related to temperature and coal particle size. Tan et al. measured the pore characteristics of five different coals and the physisorption amount of O2 at room temperature using mercury intrusion porosimetry (MIP) and oxygen adsorption with chromatography (OAC) and concluded that the adsorption amount of O2 was proportional to the pore volume of nanopores in coal [14]. Tan et al. also studied the physisorption behaviors of O2 in low-rank coal microscopically using the grand canonical Monte Carlo (GCMC) method [44]. The results showed that the adsorption amount of O2 was positively correlated with the micropore structure of coal. Deng et al. studied the physisorption mechanism of oxygen molecules on the coal surface side chain containing sulfur and phosphorus groups using quantum chemistry calculation, and the results showed that the oxygen molecule had a strong interaction with the coal surface side chain containing sulfur and phosphorus groups [45,46]. Furthermore, Wu et al. studied the difference in adsorption behaviors of CO2, O2 and N2 in coal by constructing a molecular model of bituminous coal and using the GCMC method [19]. In conclusion, the three gases can be ordered in terms of adsorption amount and adsorption heat as CO2 > O2 > N2. Although comparative studies have been conducted on the adsorption behaviors of CO2, O2 and N2 in coal, the differences in the main influencing factors of the adsorption characteristics of the three gases in coal are still unclear. The main objectives of this research are to explore the influence of coal properties on the adsorption characteristics of CO2, O2, and N2 in coal, and to compare the factors affecting the adsorption amounts and adsorption heat values of the three gases. We tested the coal properties of different ranks of coal, the adsorption amounts and adsorption heat values of CO2, O2 and N2 in different coal samples, and then analyzed the relationships between the coal properties and the adsorption parameters to discover the differences in the adsorption behaviors of CO2, O2 and N2 in coal.

2. Experimental Procedures

2.1. Coal Sample Preparation

Chengzhuang, Jinjia, Daliuta and Donghuai coal mines in China were visited for the coal sample collection. According to the national standard method GB/T 5751-2009 [47], the coals of the Chengzhuang coal mine in Qinshui coalfield are classified as anthracite; the coals of the Jinjia coal mine in Liupanshui coalfield belong to lean coal; the coals of the Daliuta coal mine in Dongsheng coalfield belong to fat coal; the coals of the Donghuai coal mine in Baise coalfield are classified as lignite. The coals of the four coalfields cover the low-rank coal and high-rank coal, and can be sampled to conduct the study. Table 1 shows the geological information of the coal samples. Representative fresh coal blocks were collected from the working face of the underground mines following the national standard method GB/T 482-2008 (sampling of coal seams) [48]. The collected coal blocks were covered with several layers of plastic membrane and sealed with adhesive tape to avoid oxidation. Then, the collected coal blocks were delivered to the laboratory for coal sample preparation. Considering the heterogeneity of coal, several small coal blocks were chosen randomly from the original coal samples. Then, they were crushed and sieved into relatively homogeneous sizes (60–80 mesh for measurement of pore structure and gas adsorption experiments, commonly used in the literatures; 200 mesh for measurement of chemical structure). The coal quality parameters of the samples, including the maximum vitrinite reflectance (Ro,m), proximate analysis, ultimate analysis and maceral composition, are listed in Table 2. The maximum vitrinite reflectance (Ro,m) and maceral composition of the coal samples were performed with a microscope photometer (MPV-III, Leitz Company, Stuttgart, Germany) following the national standard GB/T 6948–2008 [49]. Coal macerals were determined by the point counting technique following the scheme of the International Committee for Coal and Organic Petrology (ICCP) [50]. The proximate analysis of the coal samples was carried out with an SDLA618 industrial analyzer following the national standard GB/T 212–2008 [51], and the ultimate analysis was carried out with a Vario EL element analyzer following the national standard GB/T 214–2007 [52].

2.2. Pore Structure Characterization

The gas adsorption methods, i.e., low-pressure nitrogen adsorption (LP-N2GA) at 77 K and low-pressure carbon dioxide adsorption (LP-CO2GA) at 273.15 K, using an ASAP 2020 automatic surface area and pore size analyzer (Micromeritics Instrument, Atlanta, GA, USA), were used to analyze the pore structure of the coal samples. The surface area, pore volume and pore size distribution (PSD) of the coal samples were obtained using the density functional theory (DFT). In this study, the IUPAC method (micropores, <2 nm; mesopores, 2–50 nm; macropores, >50 nm) was adopted for pore classification [53].

2.3. Chemical Structure Characterization

The chemical structures of the coal samples were analyzed using Fourier transform infrared spectroscopy (FTIR). The FTIR tests were performed using a TIR Vertex 80v spectrometer (Bruker Corporation, Karlsruhe, Germany). The chemical structures of the coal samples were obtained by using a peak fitting analysis of the FTIR spectrum. The apparent aromaticity, fa, was calculated as follows [29]:
H a l H = H a l H a l + H a r = A 2800 3000 A 2800 3000 + A 700 900
C a l C = H a l H × H C / H a l C a l
f a = 1 C a l C
where Hal/H is the ratio of aliphatic (Hal) to total hydrogen atoms (H).
The 2800–3000 cm−1 region of the spectrum is for the aliphatic (Hal) stretching vibration and the 700–900 cm−1 region is for the aromatic hydrogen (Har) out-of-plane deformation [29]. Therefore, the integral area of the two regions can be used to calculate the Hal/H. H/C is the ratio of hydrogen atoms to carbon atoms, calculated from the ultimate analysis; Hal/Cal is valued at approximately 1.8 for coals; Cal/C represents the aliphatic carbon fraction.
The 2940–3000 cm−1 region is for the absorption of aliphatic CH3 asymmetric stretching vibration and the 2900–2940 cm−1 region is for the aliphatic CH2 asymmetric stretching vibration. A(CH2)/A(CH3) (the length of aliphatic chains) is determined as follows [29]:
A C H 2 A C H 3 = A 2900 2940 A 2940 3000
The absorption bands around 1600 cm−1 are due to the aromatic nucleus (C=C) stretching vibration.
The 1650–1800 cm−1 region is assigned to the C=O group vibration. The ”C” factor (the ratio of C=O to C=C groups) is calculated using Equation (5) [32].
C = C = O C = O + C = C = A 1650 1800 A 1650 1800 + A 1600

2.4. Measurement of Adsorption Isotherms

The adsorption isotherms of CO2, O2 and N2 were measured using an ASAP 2020 experimental system (Micromeritics Instrument, Atlanta, GA, USA) with a volumetric method. Considering that the actual conditions inside a goaf are close to room temperature and atmospheric pressure [54], the equilibrium pressure and the equilibrium temperature of the adsorption experiments were set between 0 and 110 kPa and between 303.15 and 323.15 K, respectively.

3. Adsorption Models and Thermodynamics

3.1. Adsorption Model

A reasonable adsorption model quantitatively describes the adsorption isotherms. In addition, the adsorption thermodynamic parameters can be obtained using the adsorption model to indirectly understand the adsorption mechanism [55]. At low pressures (in the low-pressure region of Henry’s law), gas adsorption isotherms follow Henry’s law [56]
n = K H p
where n is the adsorption amount (mmol·g−1), KH is the Henry’s law constant (mmol·g−1·kPa−1), and p is the equilibrium pressure (kPa).
The gas adsorption isotherms at low pressure are also modeled by the virial equation as follows [57]:
ln n p = A 0 + A 1 n + A 2 n 2 +
where A0, A1 and A2 are the virial constants.
When the adsorption amount is small, the high-order term of the virial equation can be neglected, and Equation (7) can be written as follows:
ln n p = A 0 + A 1 n
Equation (8) shows that when the adsorption amount tends to zero, the virial equation transforms into Henry’s law:
lim n 0 n p = exp A 0 = K H
According to Equation (9), Henry’s law constant can be obtained by the virial constant A0.
Since the model parameters are few and have clear physical significance, the Langmuir equation is widely used in research and engineering applications. The Langmuir equation is generally written as [58]:
n = a b p 1 + b p
where a is the saturation adsorption amount (mmol/g) and b is the Langmuir constant (kPa−1).

3.2. Adsorption Thermodynamics

Gas adsorption is usually exothermic; the heat released during the adsorption process is referred as the adsorption heat. The adsorption heat includes the integral heat and differential heat of adsorption [59]. The integral heat is the heat released by the adsorption of n mol of gas, and the differential heat of adsorption is the heat released by the adsorption of a mol of gas. The differential heat, which is also called the isosteric heat of adsorption, directly determines the adsorption intensity and so it is widely studied [60]. In this paper, the adsorption heat refers to the isosteric heat of adsorption. The isosteric heat of adsorption can be obtained using the Clausius–Clapeyron equation as follows [61]:
d ln p d T n = Δ H R T 2
where p is the pressure (kPa), T is the temperature (K), Δ H is the isosteric heat of adsorption (kJ/mol), R is the universal gas constant (8.314 J·mol−1·K−1), and subscript n refers to a fixed adsorption amount.
According to Equation (6), for a fixed adsorption amount, n
d ln n = d ln K H + d ln p = 0
substituting the relation d ln p = d ln K H into Equation (11) yields Van’t Hoff’s equation [56]
d ln K H d T = Δ H 0 R T 2
where Δ H 0 is the isosteric heat of adsorption in Henry’s law region (kJ/mol) [57].
Integrating Equation (13) yields
ln K H = Δ H 0 R 1 T + C 0
where C0 is the integration constant. The adsorption heat in the Henry’s law region can be obtained from the linear correlation between lnKH and 1/T. If the adsorption isotherms satisfy the virial equation, the adsorption heat in the Henry’s law region can be obtained from the linear correlation between A0 and 1/T.

4. Results and Discussion

4.1. Adsorption Characteristics of CO2, O2 and N2 in Coal

4.1.1. Adsorption Amounts of CO2, O2 and N2 in Coal

The adsorption isotherms of CO2, O2 and N2 of the coal samples at three different temperatures are shown in Figure 1. Figure 1 shows that at the experimental pressure ranges, the CO2 adsorption amounts of the coal samples increase with an increase in pressure, but the increasing rate gradually decreases. All the CO2 adsorption isotherms in Figure 1 exhibit type-I isotherms according to IUPAC classification. In addition, the O2 and N2 adsorption amounts of the coal samples increase linearly with an increase in pressure. The CO2 adsorption isotherms of the coal samples were fitted by using the Langmuir equation, and the O2 and N2 adsorption isotherms of the coal samples were fitted using Henry’s law. The fitting results are summarized in Table 3. From Table 3, it can be seen that the Langmuir model fits the CO2 adsorption isotherms well with R2 > 0.99, and the Henry model fits the O2 and N2 adsorption isotherms well with R2 > 0.97.
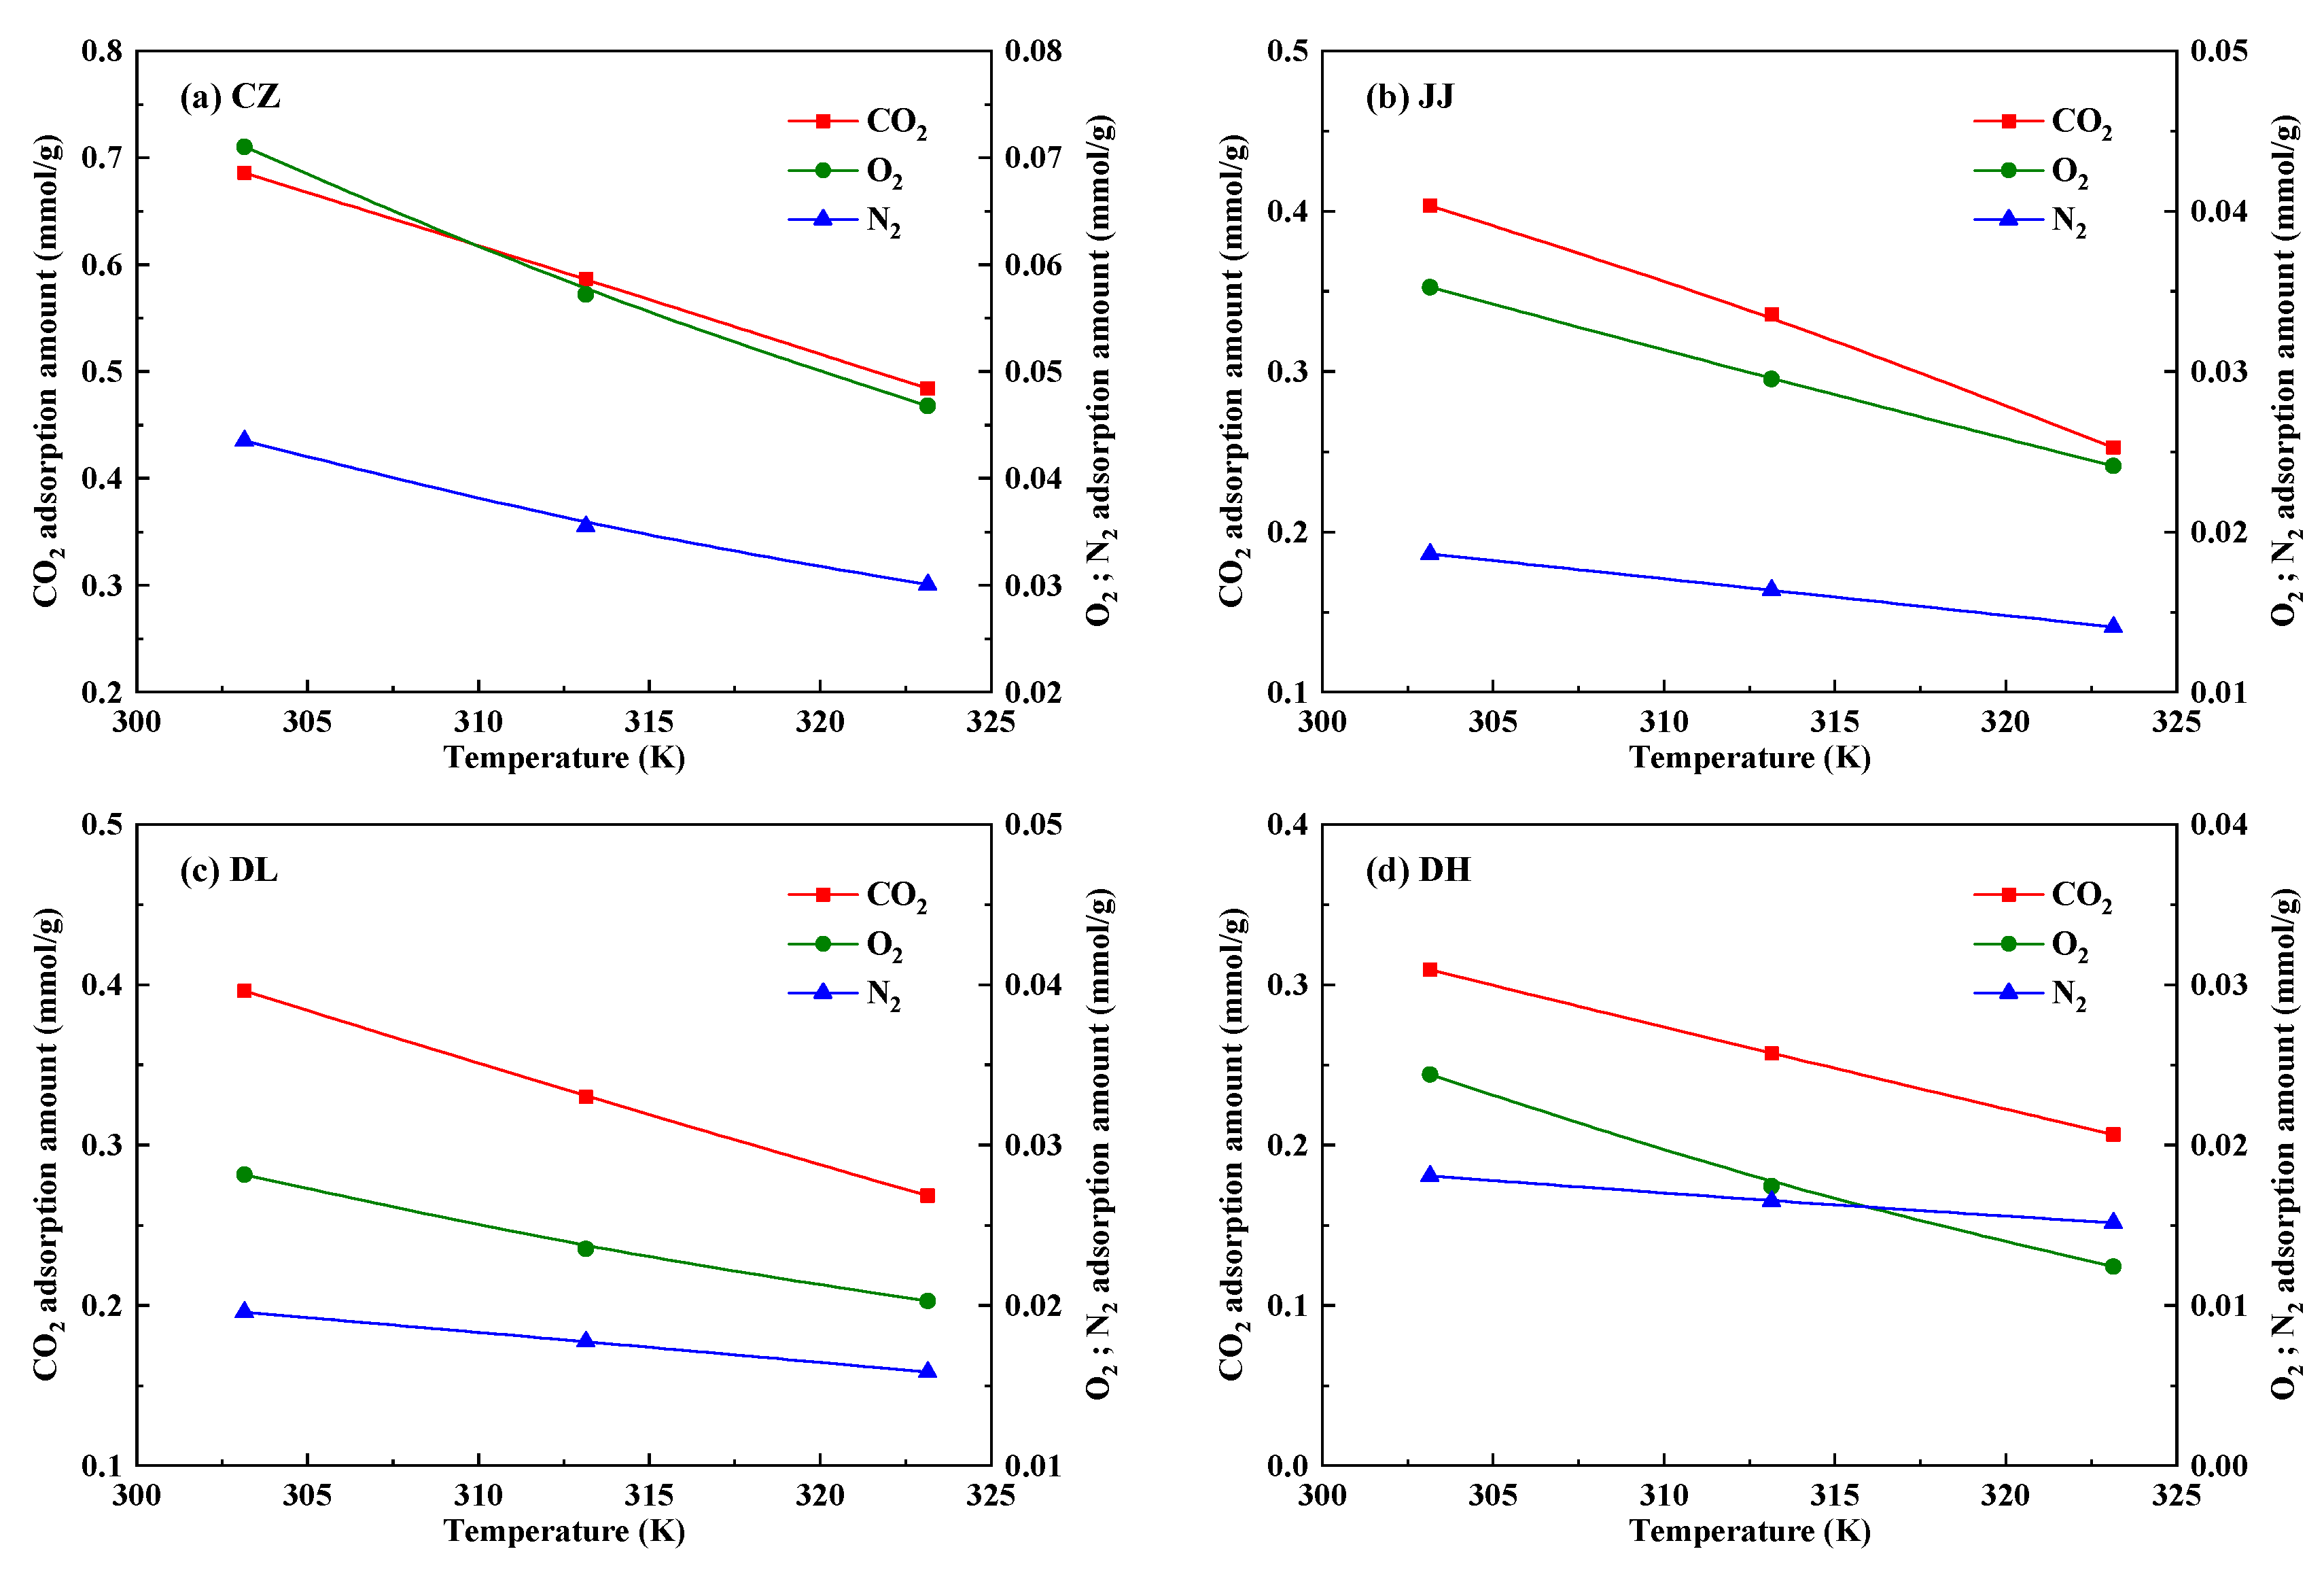
Figure 1 shows that temperature significantly affects the adsorption amounts of the gases; as temperature increases, the adsorption amounts of CO2, O2 and N2 all decrease. Figure 2 shows the adsorption amounts of CO2, O2 and N2 of the coal samples at different temperatures under atmospheric pressure (1.013 × 10⁵ Pa) according to the Langmuir and Henry models in Table 3; as temperature increases under atmospheric pressure, the adsorption amounts of the gases by the coal samples decrease linearly. For all the coal samples, the CO2 adsorption amounts at the experimental temperatures are significantly greater than the O2 and N2 adsorption amounts. For the CZ, JJ and DL samples, the O2 adsorption amounts are greater than the N2 adsorption amounts at the given temperatures. For the DH sample, the O2 adsorption amounts are greater than the N2 adsorption amounts at 303.15 and 313.15 K, but the O2 adsorption amount is less than the N2 adsorption amount at 323.15 K. Figure 2 shows that the decreased rate of O2 adsorption amount with an increase in temperature is greater than that of N2, and this is the reason why the O2 adsorption amount in the DH sample at high temperature is less than the N2 adsorption amount.
In addition, the gas adsorption amounts of the coal samples at room temperatures and under atmospheric pressure decreased in the following order: CO2 > O2 > N2. The properties of the three gases [41,62] are shown in Table 4. According to Table 4, the adsorption amounts of three gases increased with an increase in the critical temperature and pressure. Consistent with previous studies [41,42], the critical parameters of the gases are important factors that affect the adsorption amount. This indicates that the adsorption of the gases is similar to the liquefaction of the gases. The higher the critical pressure and temperature, the easier the gas is adsorbed onto the coal’s surface. In addition, the adsorption amounts of the three gases increased with a decrease in the molecular kinetic diameter, because the smaller the molecular diameter, the more micropores can be entered and the greater the adsorption amount.

4.1.2. Adsorption Heats of CO2, O2 and N2 in Coal

The Henry’s law constants of the O2 and N2 adsorption isotherms in Table 3 were used to calculate the O2 and N2 adsorption heats of the coal samples. First, the virial equation was used to fit the CO2 adsorption isotherms (Table 3); Table 3 shows that the virial model can also describe the CO2 adsorption isotherms well with R2 > 0.98. Then, Henry’s law constants of the CO2 adsorption isotherms were calculated from the virial constant, A0, in Table 3 according to Equation (9). Figure 3 shows the relationships between lnKH and 1/T for CO2, O2 and N2. Linear fitting was performed on all the data in Figure 3 and the fitting results are shown in Table 5 (the linear function fits all curves well with R2 > 0.98). Then, the adsorption heats of CO2, O2 and N2 of the coal samples were calculated using the slope of the linear fitting formulas, as shown in Table 5. Table 5 shows that the adsorption heats of CO2, O2 and N2 range from 7.21 to 32.82 kJ/mol. It also shows that the adsorption is physical. For all the coal samples, the gas adsorption heat decreased in the following order: CO2 > O2 > N2. According to Table 4, the adsorption heats of the gases are closely related to the Van der Waals attractive constant; an increase in the Van der Waals attractive constant of the gas increases the gas adsorption heat. This reveals that the nature of the gas adsorption by coal is Van der Waals force; the greater the Van der Waals force between the gas and coal molecules, the greater the gas adsorption heat for a given coal sample.
In addition, Figure 3 and Table 5 show that the larger the adsorption heat, the greater the slope of the linear relationship between lnKH and 1/T. This indicates that adsorption heat affects the change rate of Henry’s law constant with temperature; the greater the adsorption heat, the greater the change rate of Henry’s law constant with temperature and the greater the change rate of adsorption amount with temperature at the same pressure. Hence, adsorption heat affects adsorption amount. As shown in Figure 2; the O2 adsorption heat is greater than the N2 adsorption heat, and the decrease in the rate of the O2 adsorption amount with temperature is greater than that of N2 for all the coal samples. This also explains why Henry’s law constant and the O2 adsorption amount are greater than those of N2 at 303.15 and 313.15 K for the DH sample, while Henry’s law constant and adsorption amount of O2 are lower than those of N2 at 323.15 K, as shown in Figure 2d.

4.2. Pore and Chemical Structure Characteristics of Coal

4.2.1. Pore Structure Characteristics of Coal

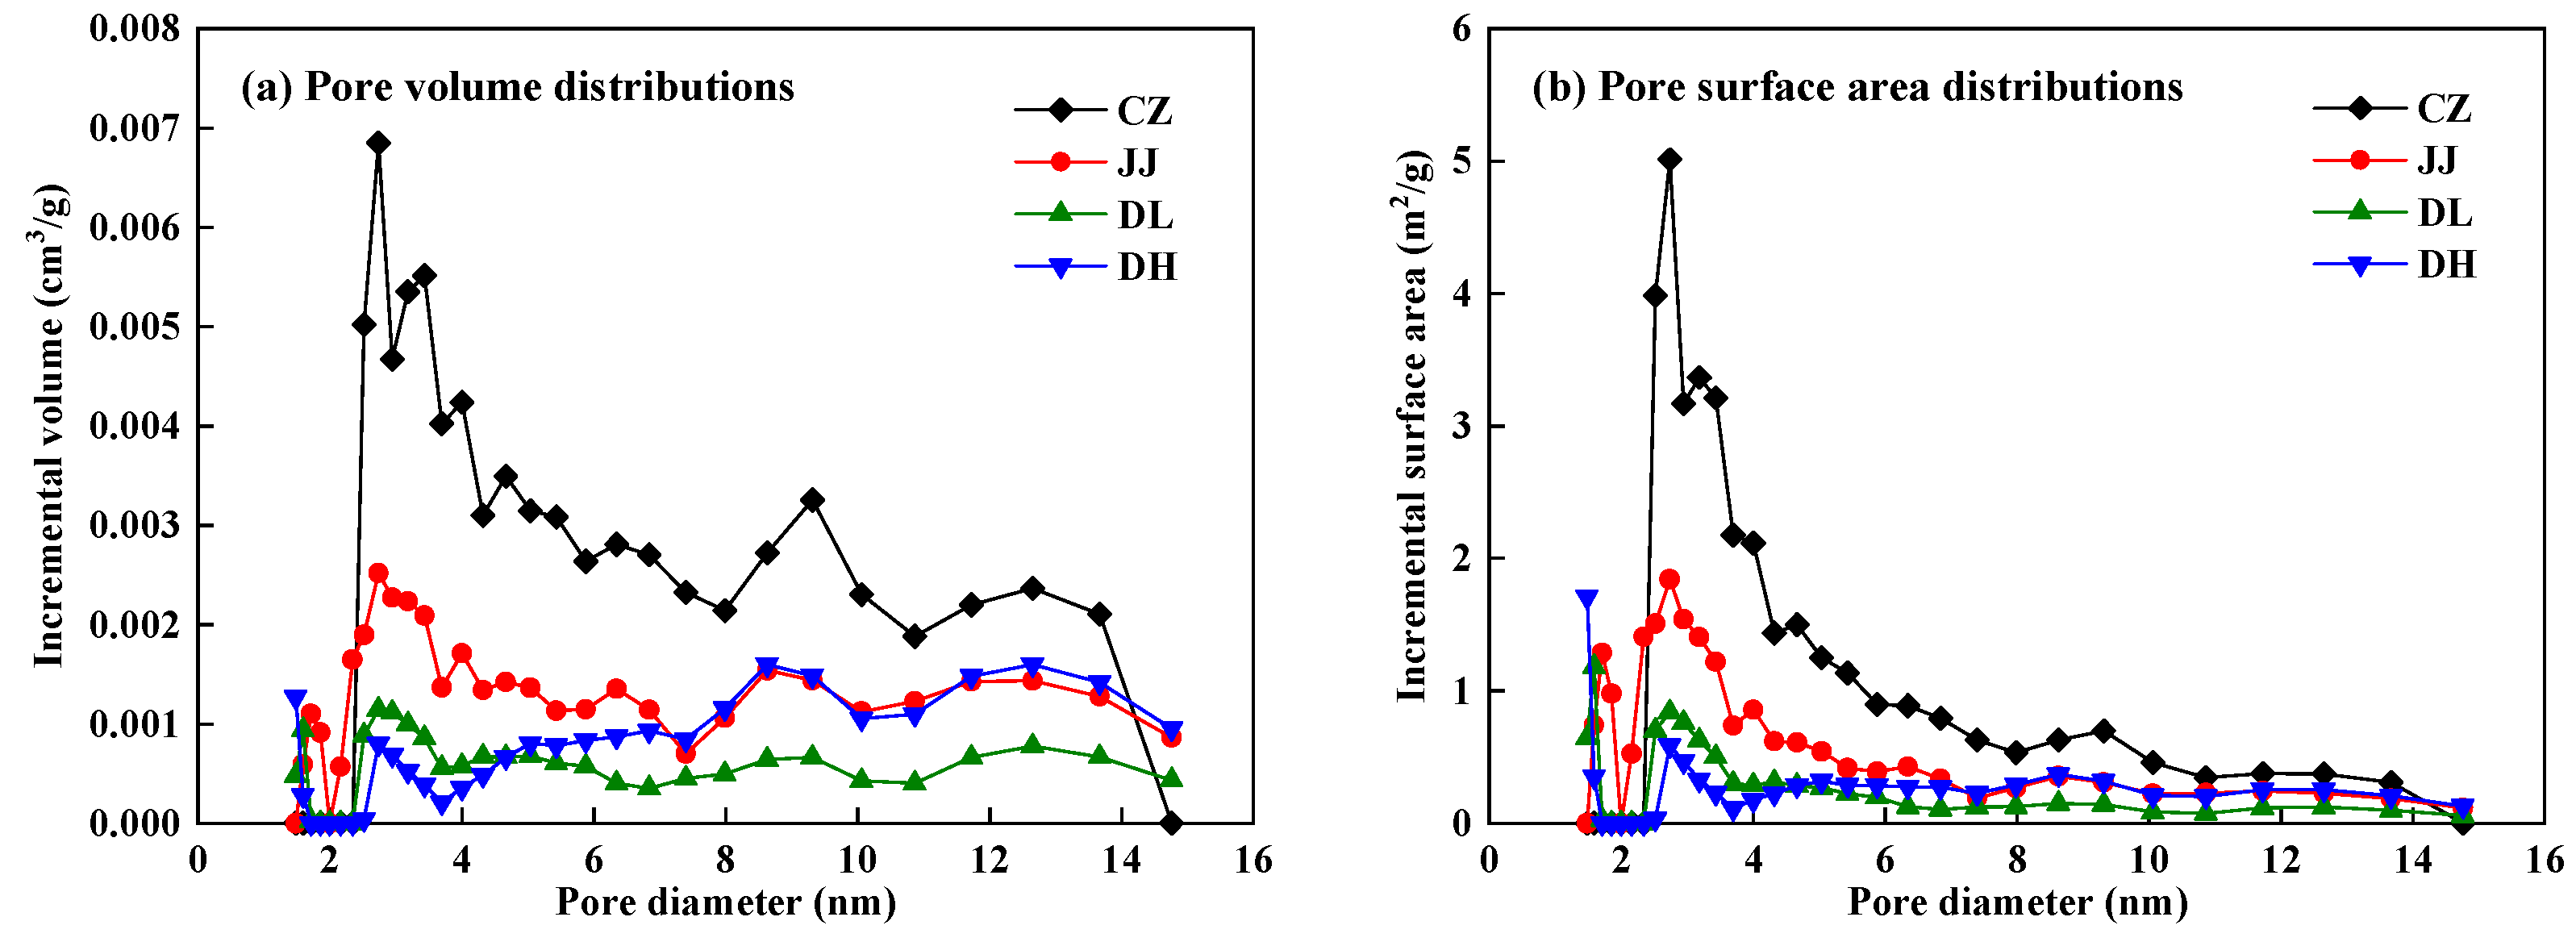
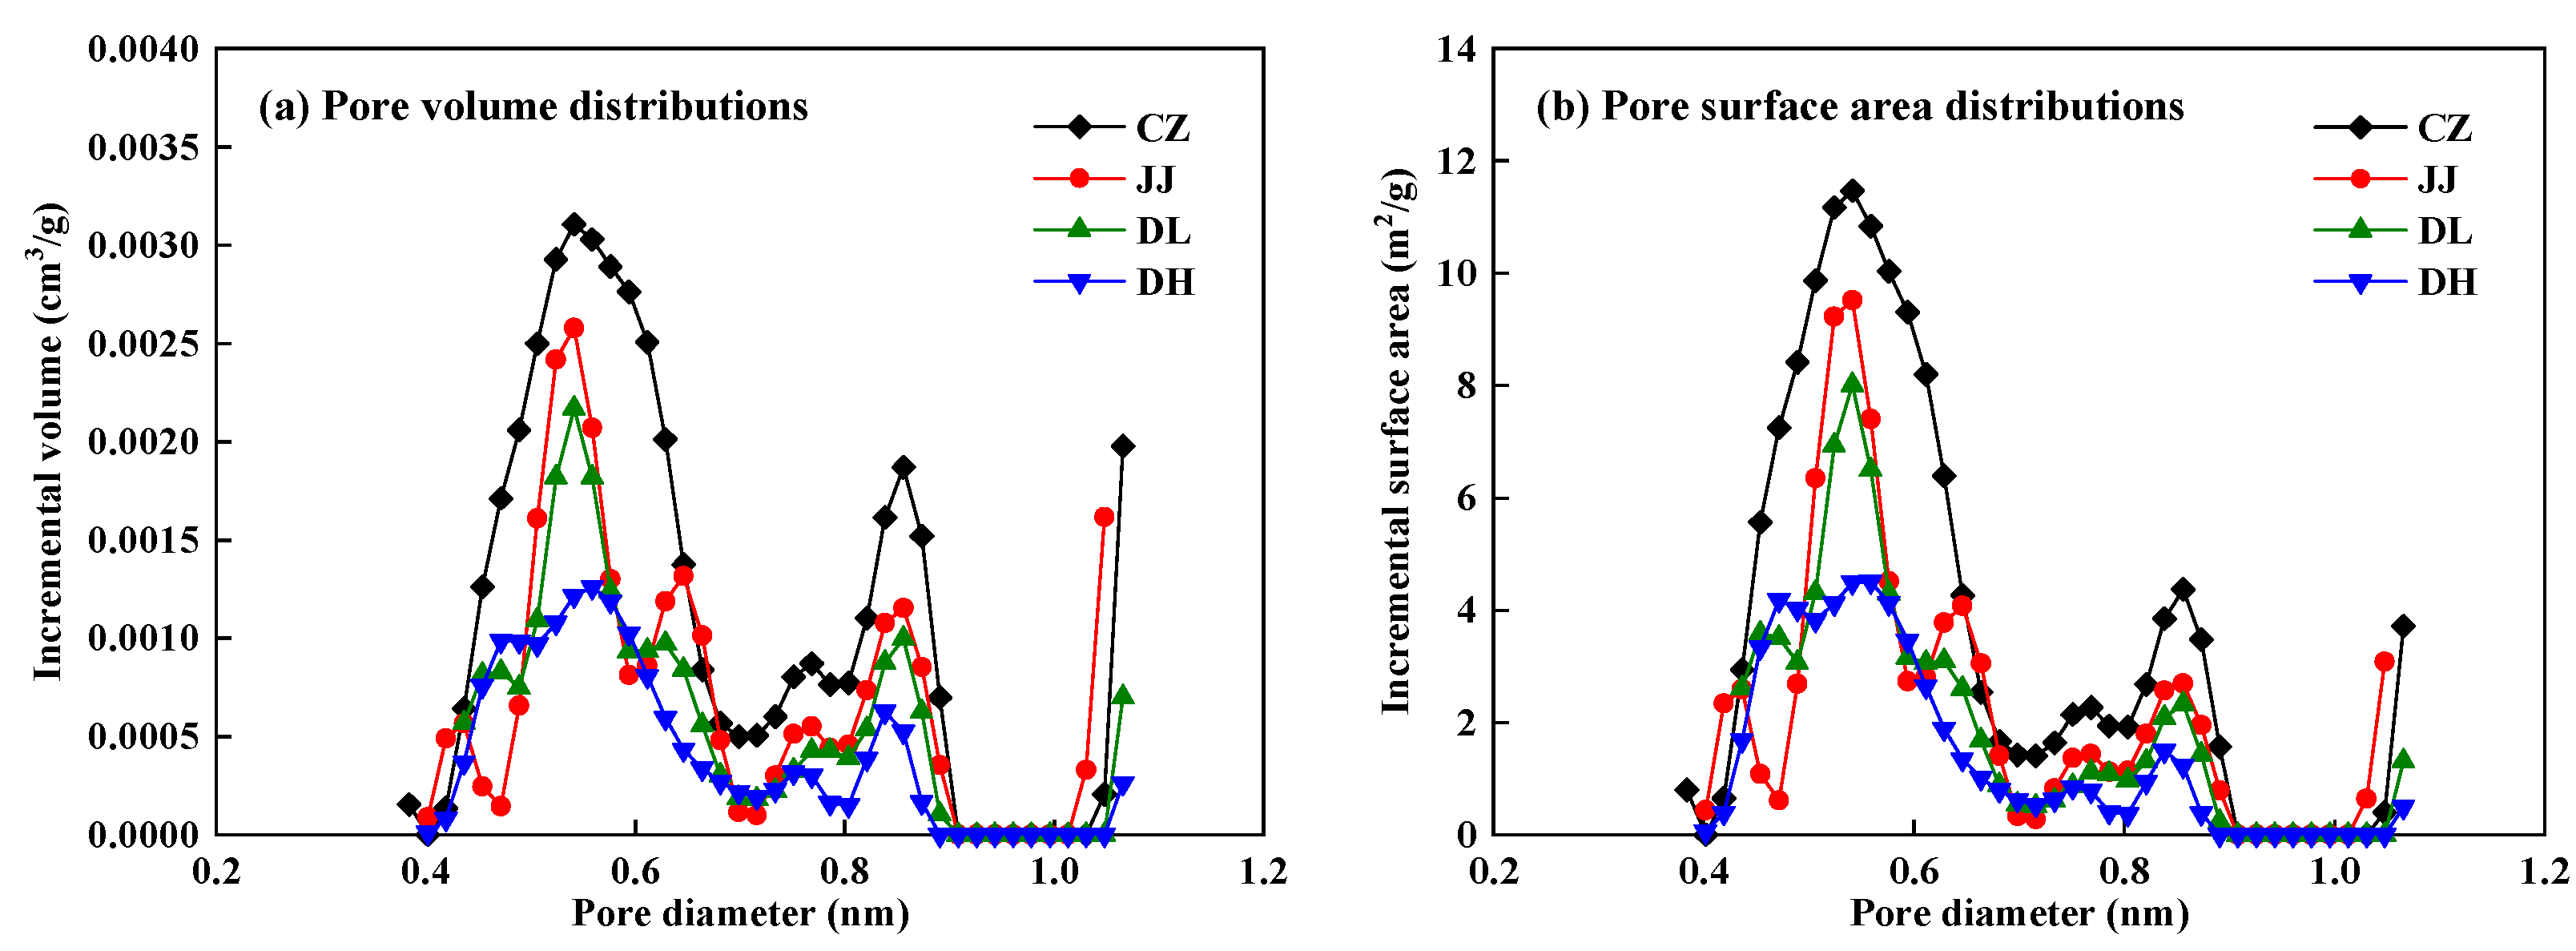
The PSD of the coal samples obtained by the LP-N2GA and LP-CO2GA experiments are shown in Figure 4 and Figure 5. Figure 4 shows that the pore diameter range of the coal samples measured by the LP-N2GA experiment as 1.2–16 nm, and the PSD curves show main peaks at 2–4 nm. Figure 4 also shows the pore type of the coal samples is mainly mesopores (2–50 nm) with a few micropores (<2 nm). Figure 5 shows that the pore diameter range of the coal samples measured by the LP-CO2GA experiment is 0.4–1.1 nm, and the PSD curves show main peaks at 0.4–0.6 nm. Figure 4 and Figure 5 show that the LP-N2GA experiment measures mesopores and micropores, while the LP-CO2GA experiment measures micropores. The micropore parameters of the coal samples were obtained by adding the analysis results of the LP-N2GA and LP-CO2GA experiments, and the mesopores parameters of the coal samples were obtained from the analysis results of the LP-N2GA experiments. The comprehensive pore parameters of the coal samples are shown in Table 6. Table 6 shows that the total surface area and pore volume of the coal samples range from 62.94 to 179.42 m2/g and from 0.0390 to 0.1227 cm3/g, respectively. It can be seen from Table 6 that the surface area of total pore, micropore and mesopore of the coal samples increased with an increase in coal rank. In addition, the surface area of the micropores was significantly larger than that of the mesopores for all the coal samples, indicating that the micropores mainly contribute to the surface area of coal. Table 6 also shows that the total pore volume of the DL sample was the smallest; its micropore volume was slightly larger than its mesopore volume. The micropore volumes of the other three coal samples were smaller than their respective mesopore volumes.

4.2.2. Chemical Structure Characteristics of Coal

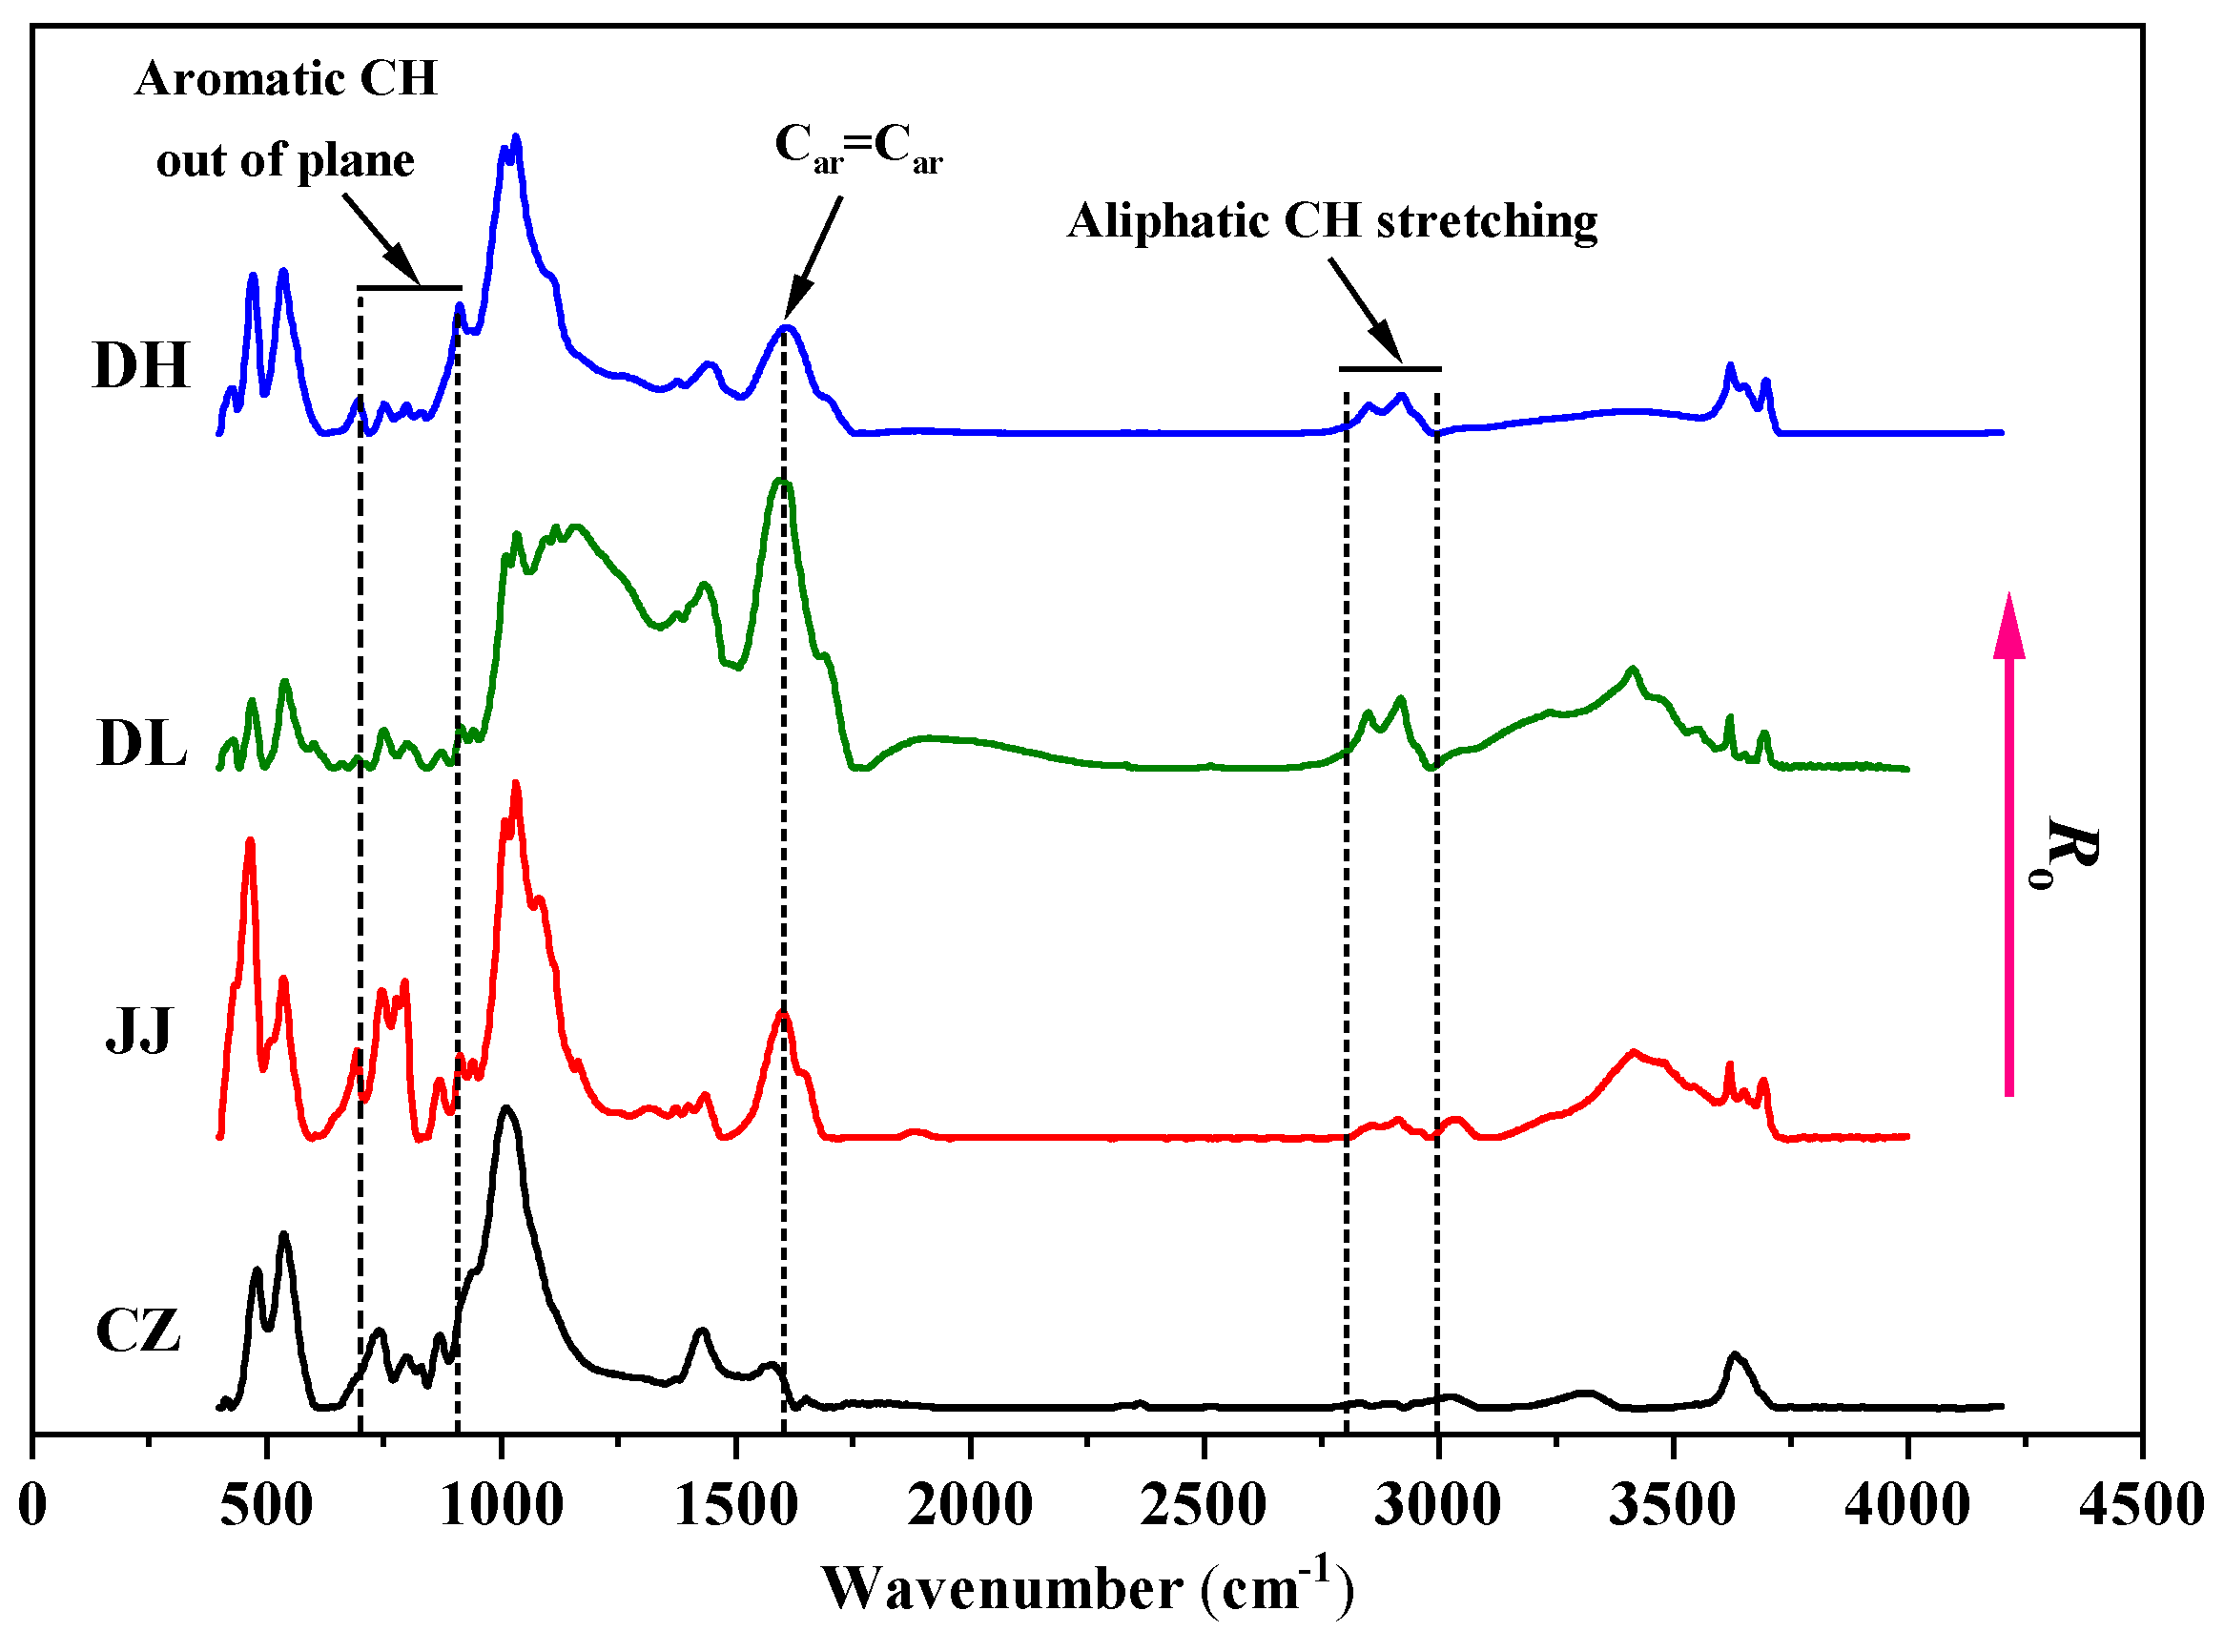
The FTIR spectra of the coal samples are shown in Figure 6. Figure 6 shows that the FTIR spectra of the coal samples have similar shapes and absorbance peaks, but the relative intensities of the absorbance peaks are different. It shows that the four coal samples have the same main functional groups, but the ratio of the groups varies in each coal sample. In this study, 700–900, 1585–1615, 1650–1800 and 2800–3000 cm−1 regions of the FTIR spectra were selected to obtain the chemical structure parameters of coal [29]. The 700–900 cm−1 region of the FTIR spectra is attributed to the aromatic structures with different aromatic hydrogens. Figure 6 shows that there are several absorbance peaks in the 700–900 cm−1 region of the FTIR spectra of the coal samples. The 730–770, 800–860 and 860–900 cm−1 regions are assigned to the aromatic nucleus with from three to four, two and one adjacent hydrogens, respectively. The 1585–1615 cm−1 region of the FTIR spectra is caused by the stretching vibration of the aromatic nucleus with different aromatic hydrogens of coal. Figure 6 shows that all the coal samples have one absorbance peak at around 1600 cm−1. The 1650–1800 cm−1 region of the FTIR spectra is caused by the stretching vibration of C=O groups, and all the coal samples have weak absorbance peaks in this region. The 2800–3000 cm−1 region of the FTIR spectra is attributed to the aliphatic structures, and Figure 6 shows that all the samples have two absorbance peaks in this region. The detailed chemical structure parameters of the coal samples were obtained by peak fitting the above four regions of the FTIR spectra using the OMNIC software, as shown in Table 7. Table 7 shows that the aromaticity of two low-rank coal samples (DL and DH) is less than that of two high-rank coal samples (CZ and JJ). In addition, the Hal/H, the A(CH2)/A(CH3) and the ”C” factor of the two low-rank coal samples (DL and DH) are greater than those of the two high-rank coal samples (CZ and JJ). The results show that with an increase in coalification degree, the content of aliphatic structures and oxygen-containing functional groups of coal gradually decreases, and the aromaticity gradually increases (consistent with previous research results).

4.3. Influencing Factors Analysis of Gas Adsorption Characteristics

In this paper, two analytical techniques, including Pearson’s correlation analysis and linear regression analysis, were used to analyze the relationships between coal properties and adsorption amounts (at 303.15 K under atmospheric pressure) and adsorption heats of CO2, O2 and N2. First, a Pearson correlation analysis was used to preliminarily judge the correlations. According to Pearson’s correlation coefficients, the significant influencing factors of gas adsorption characteristics were determined. Then, a linear regression analysis was performed on the relationships between the influencing factors and adsorption parameters to verify the correlations. Pearson’s correlation coefficient, r, is widely used to reflect the degree of the linear correlation between two variables (the r value ranges from −1 to 1) [63]. The greater the absolute value of r, the higher the correlation between the two variables. A positive r value indicates that two variables are positively correlated, and a negative r value indicates that the two variables are negatively correlated. The resulting r values are summarized in Table 8.
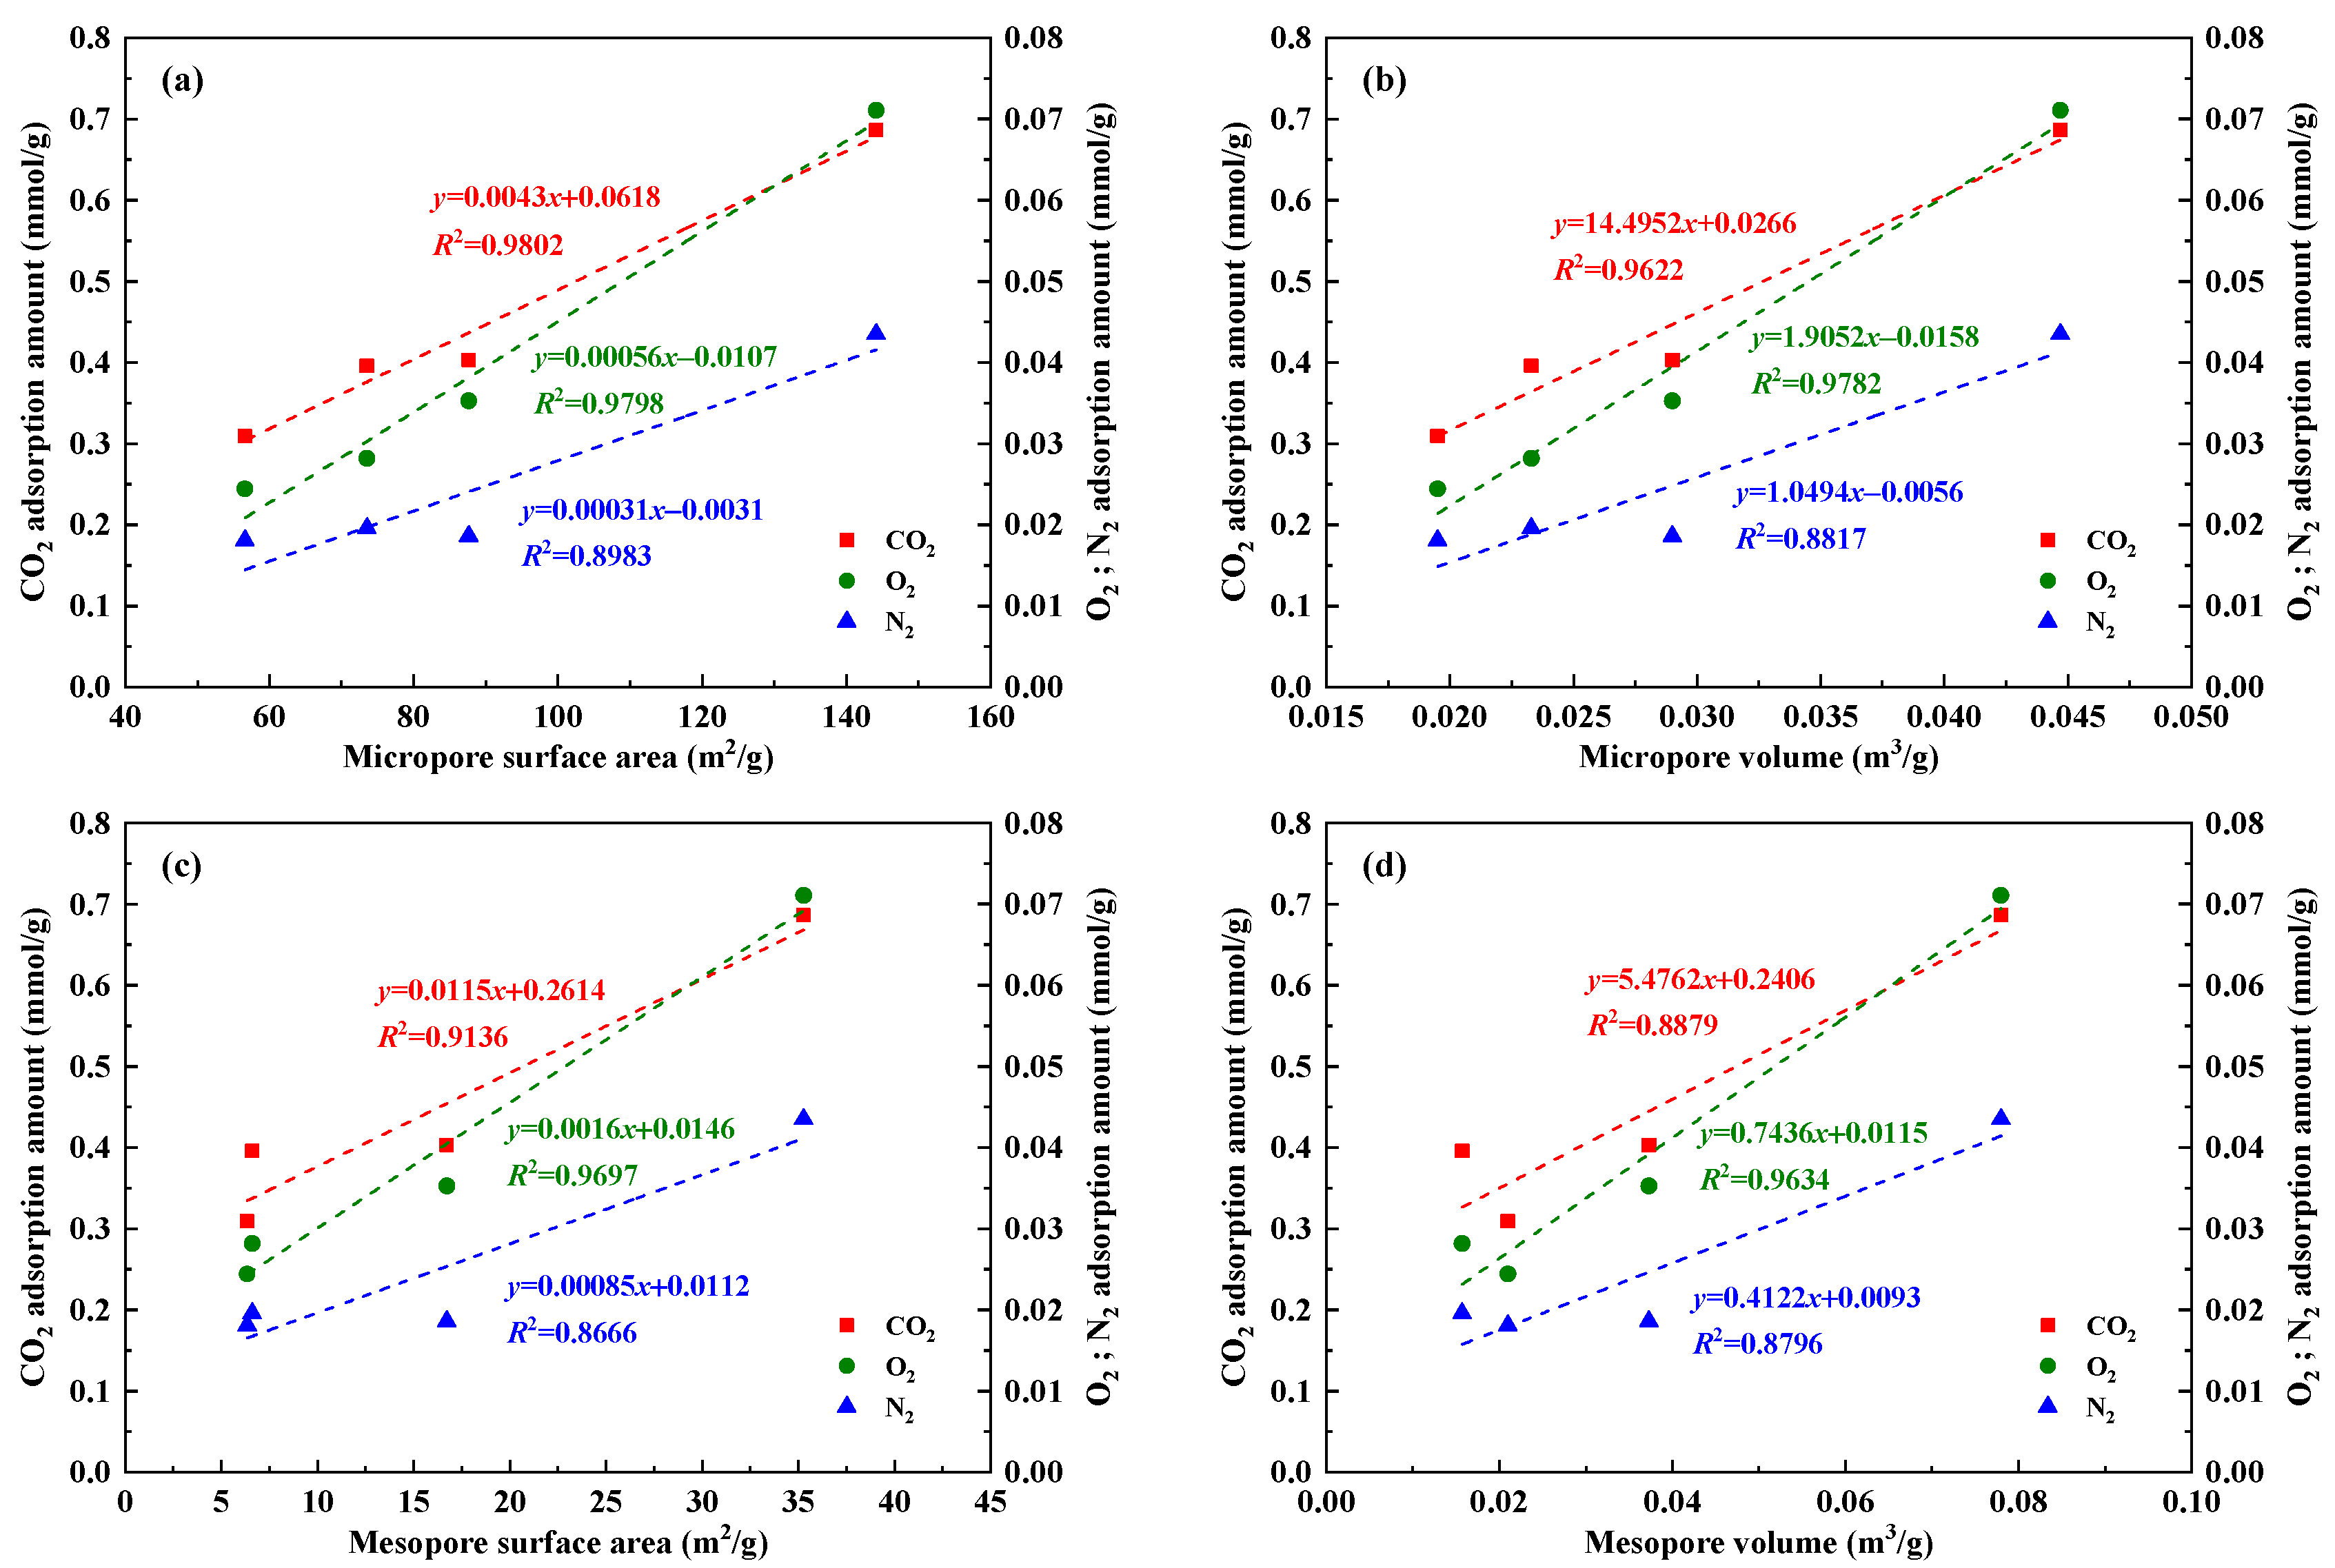
Table 8 shows that the adsorption amounts of CO2, O2 and N2 are all highly positively correlated with the pore structure parameters of the coal samples, including the surface area and pore volume of the micropores and mesopores. The relationships between the adsorption amounts of CO2, O2 and N2 and the pore structure parameters of the coal samples are shown in Figure 7 (linear regression analysis was performed on the data in Figure 7). Figure 7 shows that the correlation coefficients, R2, are greater than 0.8, which proves that the adsorption amounts of the gases are highly positively correlated with the micropore and mesopore structural parameters of coal. This indicates that the micropores and mesopores are the main adsorption and storage sites for gases. The higher the pore content of coal, the more the adsorption sites, and the greater the adsorption amount. In addition, the correlation coefficients between the micropore structural parameters and the adsorption amounts of the gases are greater than those between the mesopore structural parameters and the adsorption amount of the gases. Table 6 shows that the surface area of micropores is significantly larger than that of mesopores, which indicates that gas adsorption mainly occurs in the micropores of coal.
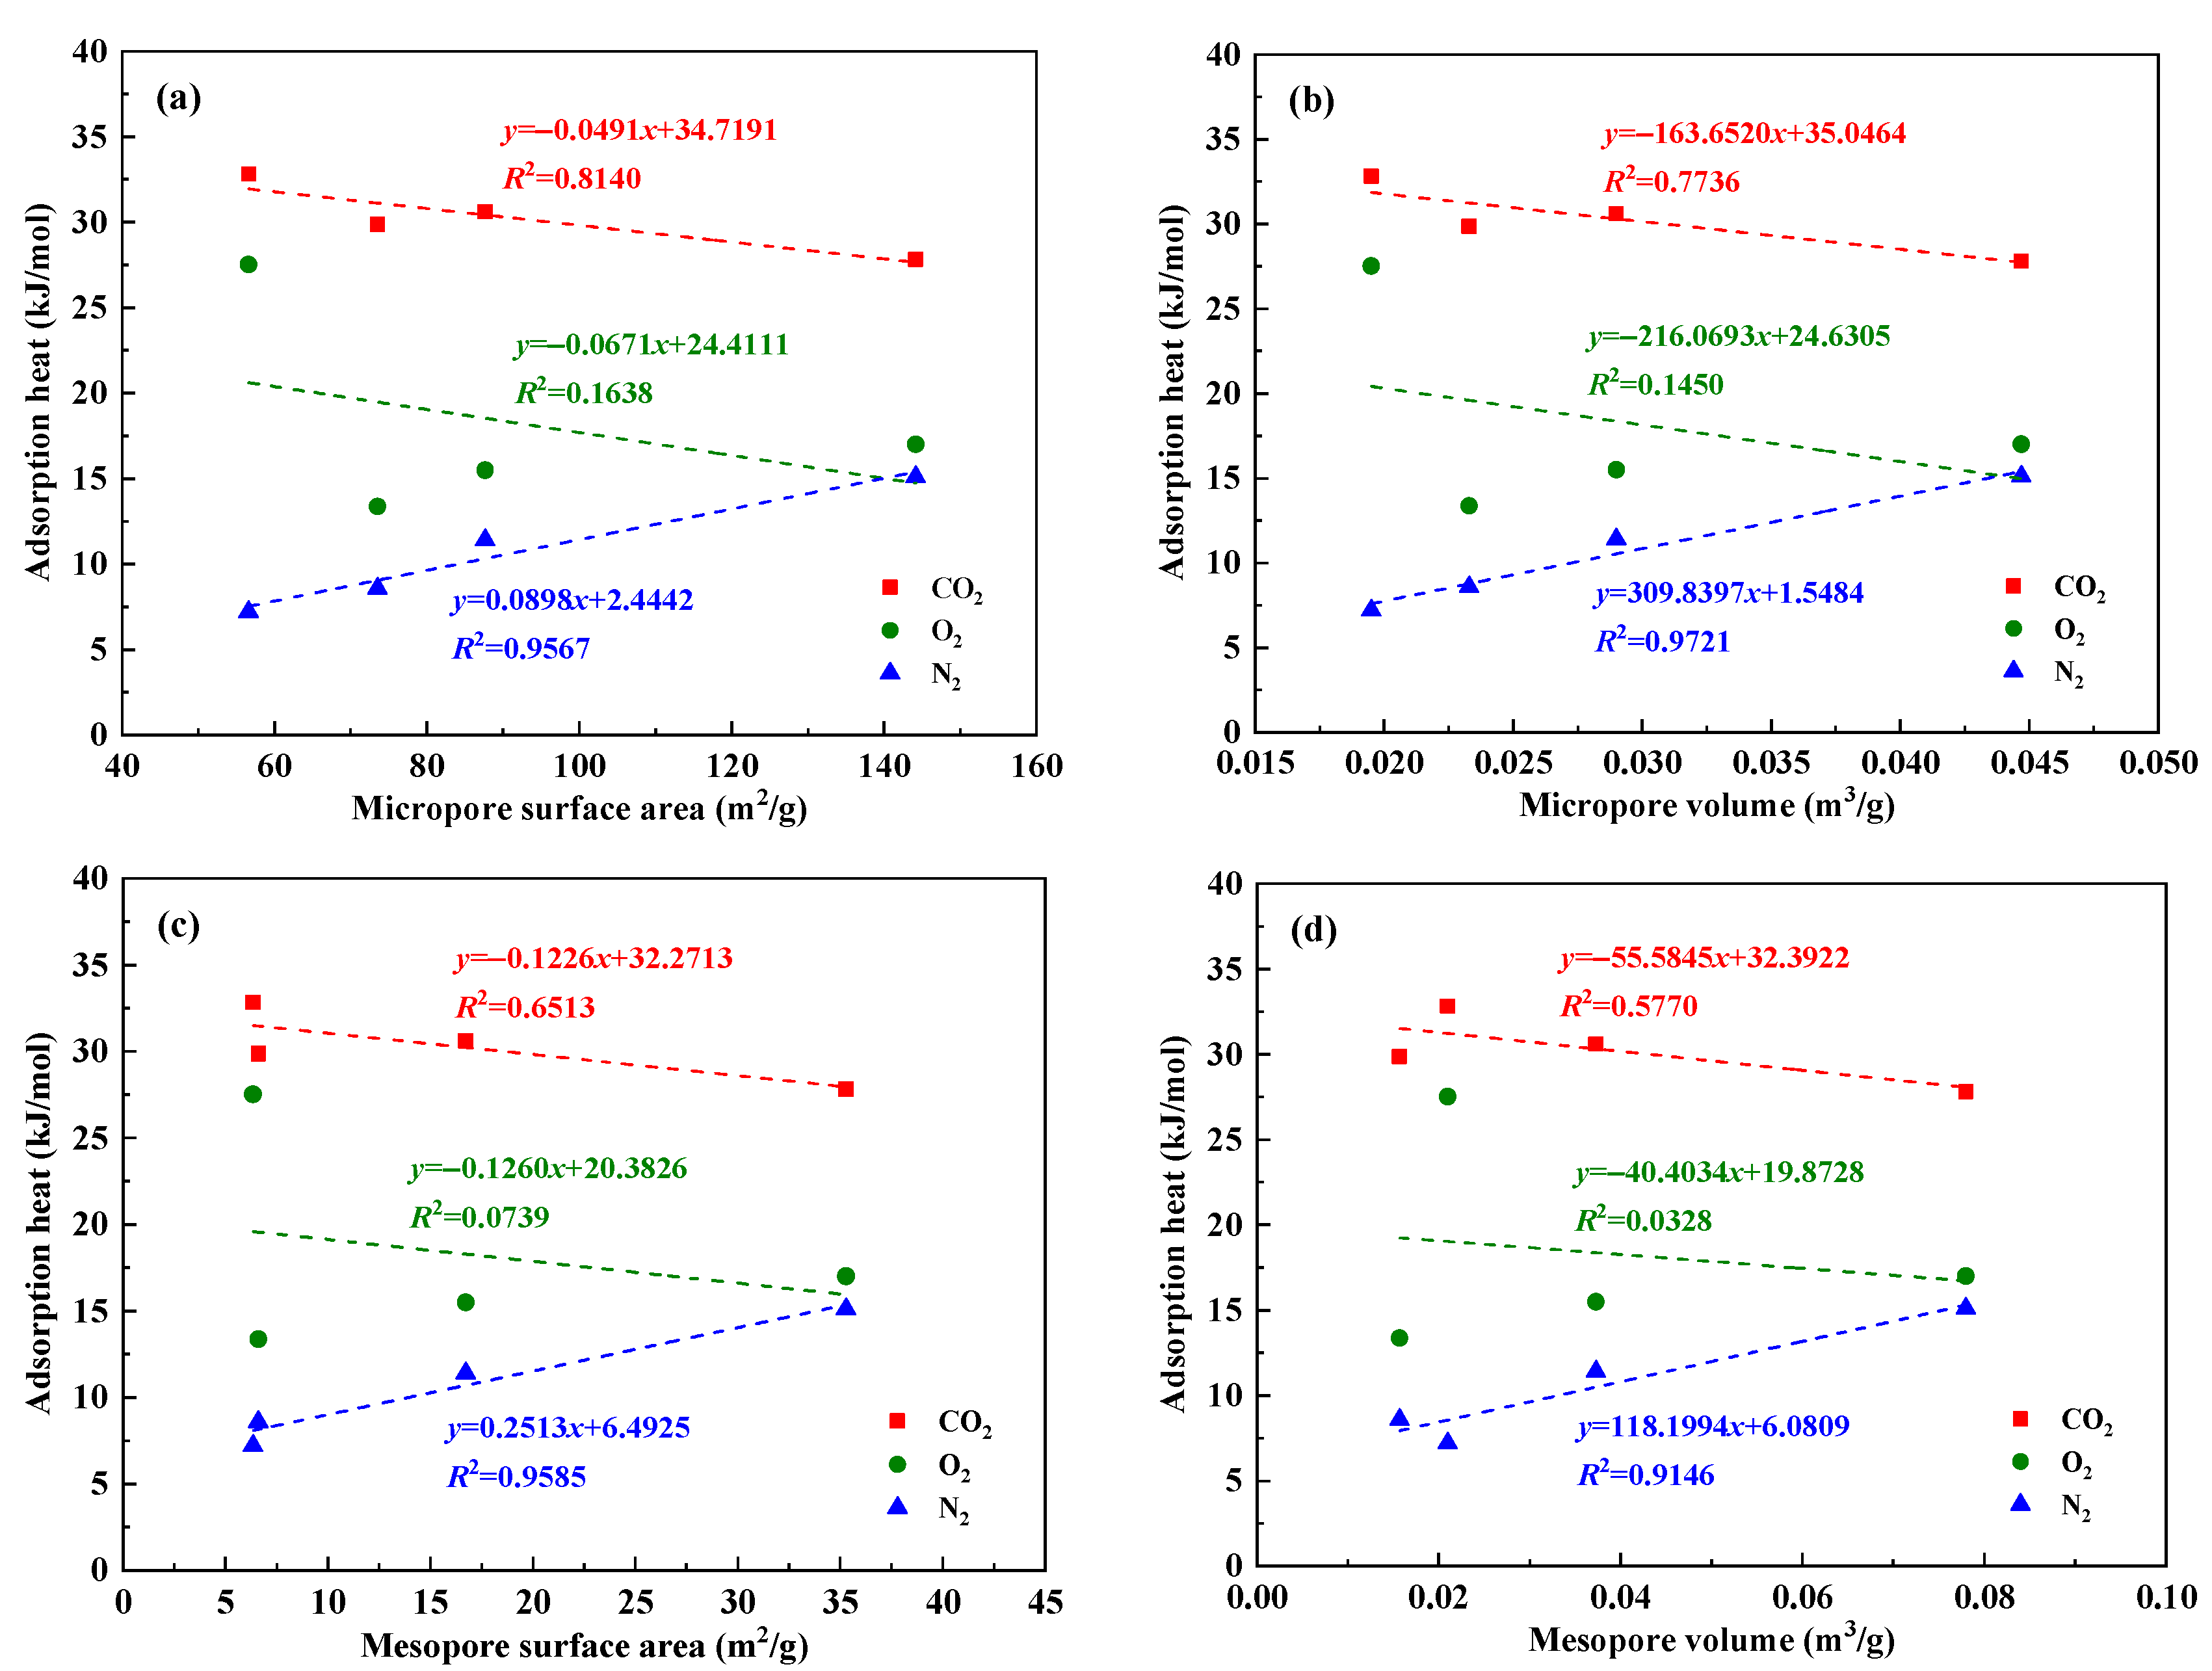
Table 8 also shows that the CO2 and O2 adsorption heats are negatively correlated with the pore structure parameters of the coal samples, while the N2 adsorption heat is positively correlated with the pore structure parameters of the coal samples. The relationships between the adsorption heats of CO2, O2 and N2 and the pore structure parameters of the coal samples are shown in Figure 8 (linear regression analysis was performed on the data in Figure 8). Figure 8 shows that the correlation coefficients, R2, between the N2 adsorption heat and the pore structure parameters are greater than 0.9, which proves that there is a high positive correlation between the N2 adsorption heat and pore structure parameters of the coal samples. Some studies [64,65] have calculated the methane adsorption heat in slit pores with different sizes, and the results have shown that methane adsorption heat decreases with an increase in pore size. Due to the superposition of the adsorption force of adjacent pore walls in micropores, the adsorption potential energy of micropores is higher than that of flat surface. Hence, the more micropores, the greater the gas adsorption heat. The high positive correlation between the N2 adsorption heat and pore structure parameters of the coal samples shows that the pore structure of coal is the main factor determining the N2 adsorption heat. However, there are no positive correlations between the adsorption heats of CO2 and O2 and pore structure parameters of the coal samples. The adsorption heat reflects the strength of the interaction between the gas and coal molecules at each adsorption site. In addition to pore structure of coal, gas adsorption heat may also be affected by the chemical composition of coal. The relationships between gas adsorption heat and chemical composition of coal should also be analyzed.
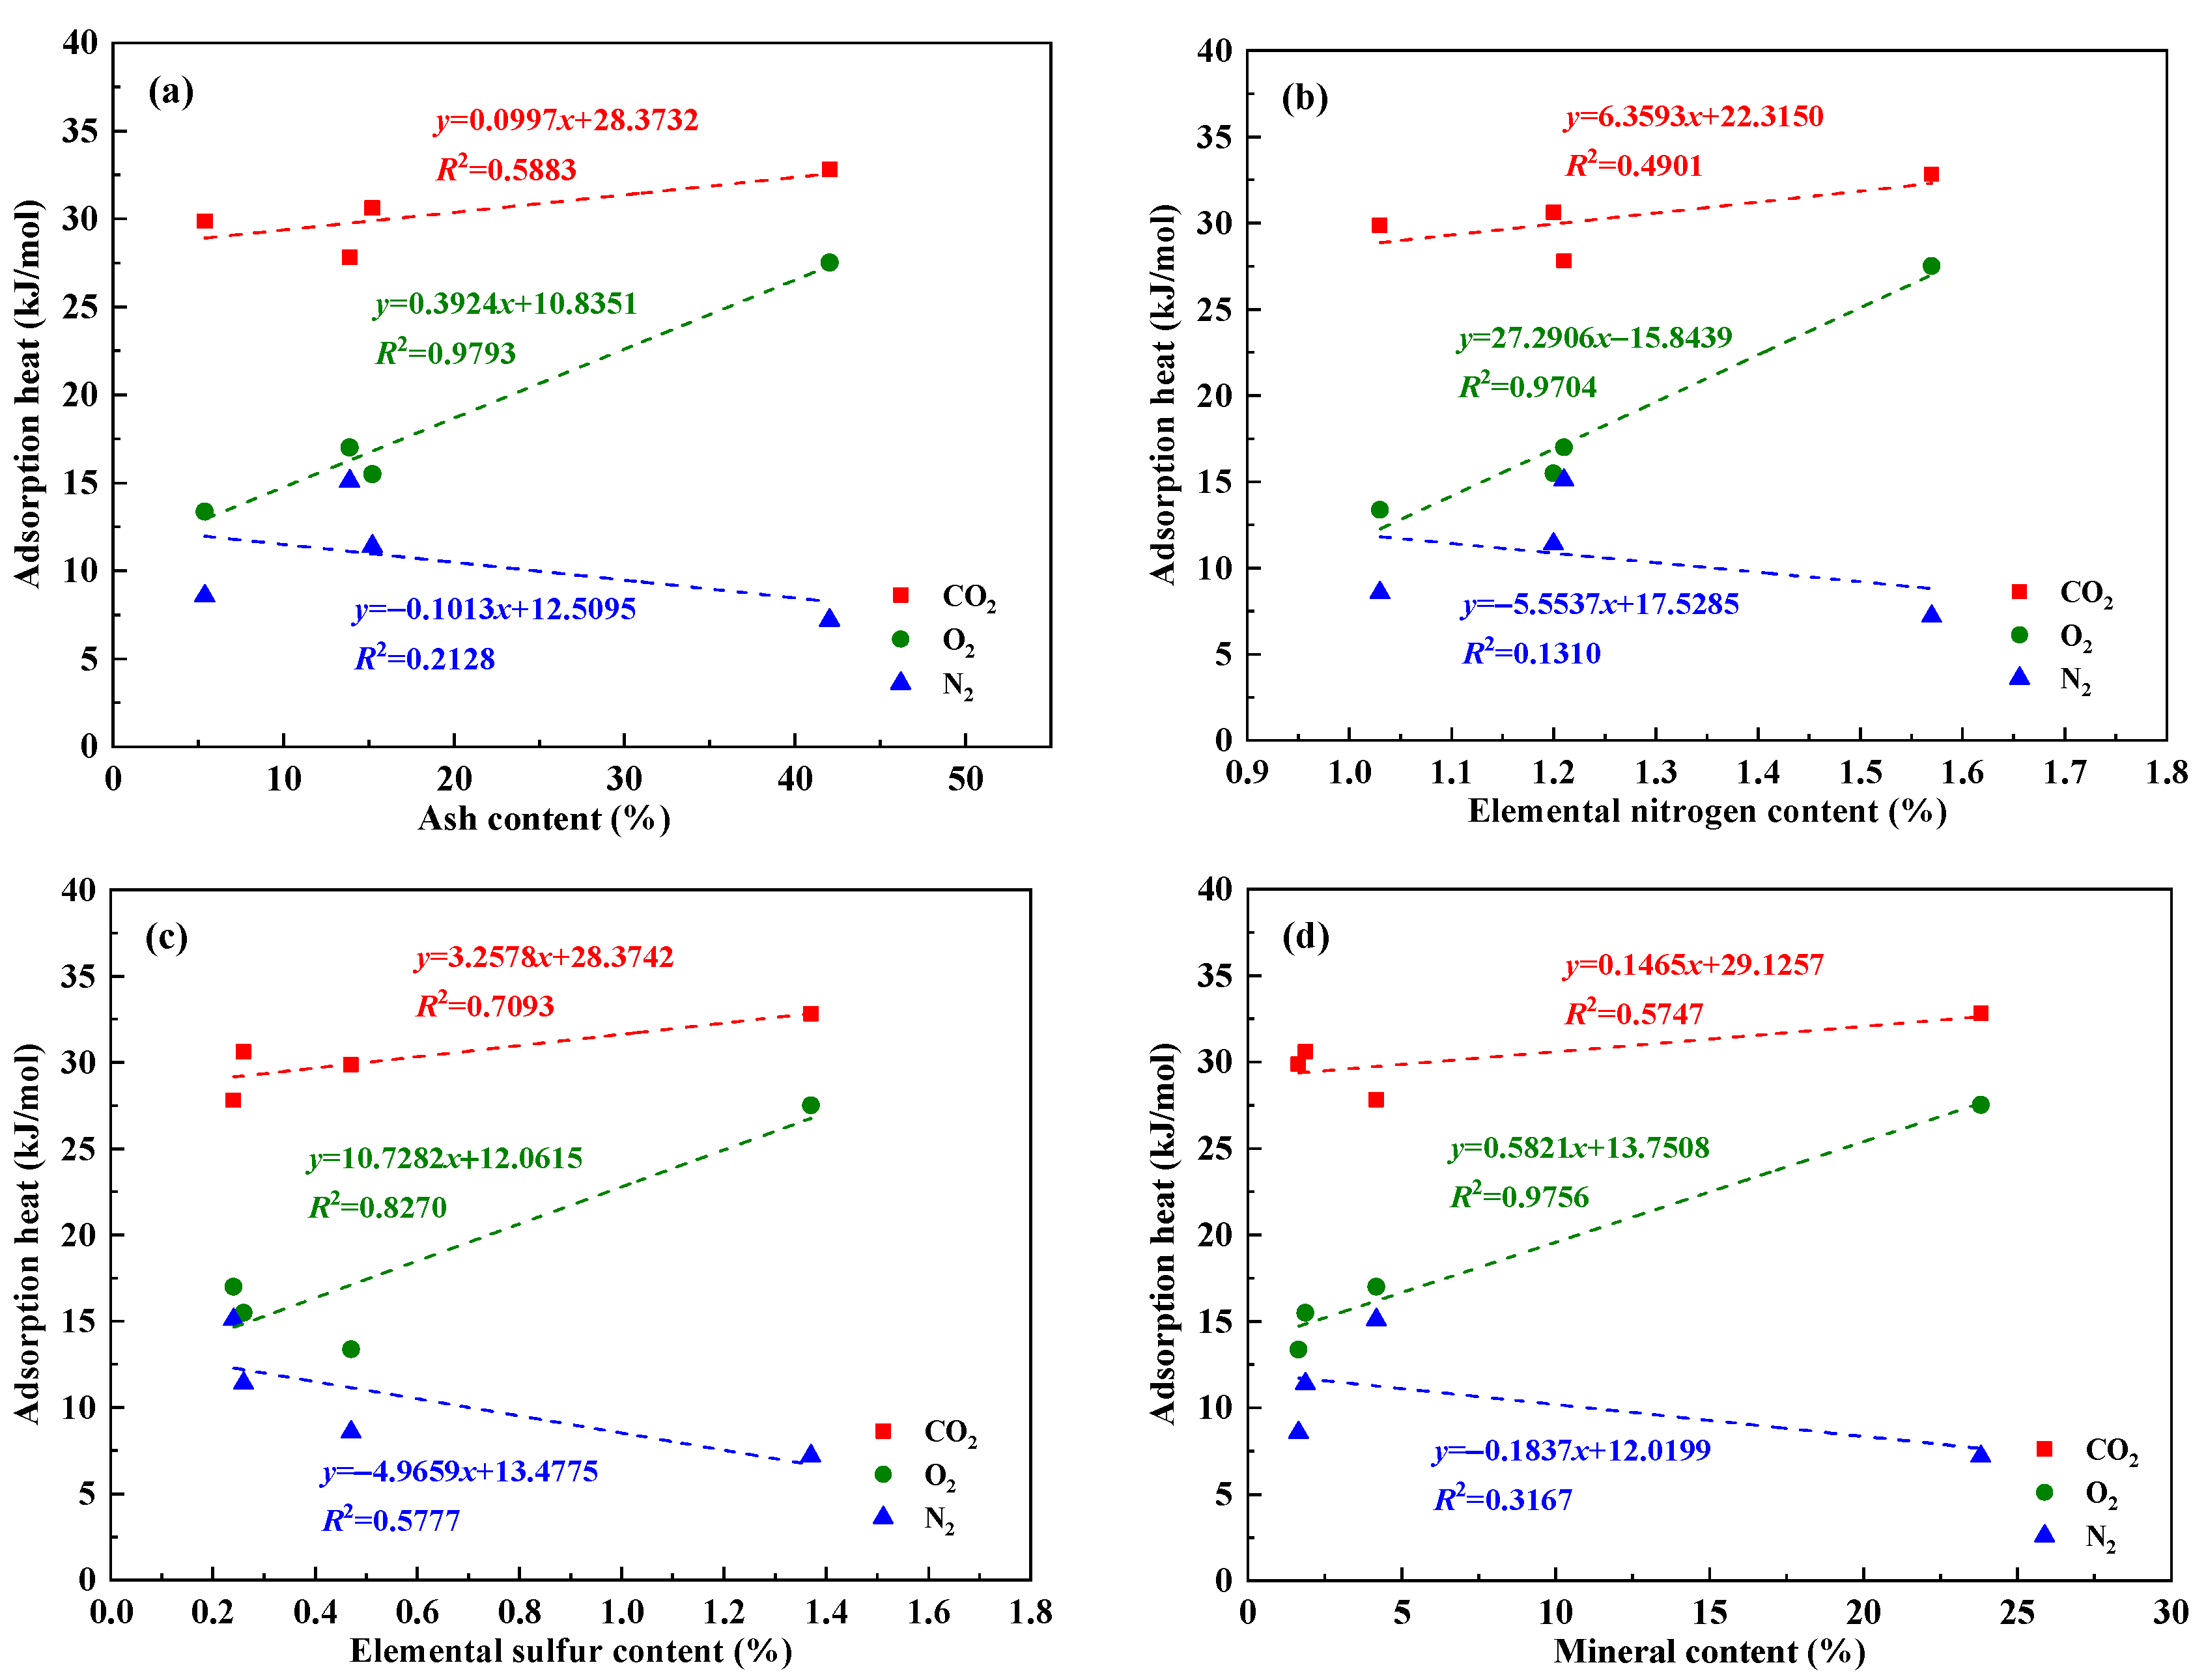
Table 8 shows that the adsorption heats of CO2 and O2 are positively correlated with the ash, elemental nitrogen, elemental sulfur and mineral contents of the coal samples. The relationships between adsorption heats of CO2, O2 and N2 and coal quality parameters are shown in Figure 9. Figure 9 shows that the correlation coefficient, R2, between the O2 adsorption heat and the ash, elemental nitrogen, and mineral contents of the coal samples are greater than 0.9 (high correlation). There is a moderate positive correlation between O2 adsorption heat and elemental sulfur content, and the correlation coefficient is greater than 0.8. The correlation coefficient between the O2 adsorption heat and the ash content of the coal samples is the highest, followed by the mineral content. Ash mainly comes from non-combustible minerals in coal. Pyrite (FeS2) is a typical mineral in coal [66], and it reacts with water and oxygen at room temperature with a large heat release. Some studies [67,68] have shown that pyrite can promote the process of low-temperature oxidation of coal. The existence of minerals can enhance the interaction between coal and O2, and consequently, the mineral content of coal is the main influencing factor of the O2 adsorption heat in this study. The elemental sulfur in coal contains organic and inorganic sulfur [46]. Inorganic sulfur in coal is mainly in the form of sulfur compounds in minerals. The organic sulfur in coal refers to the sulfur combined with the organic molecular of coal. Deng et al. found a strong interaction between sulfur-containing functional groups and O2 in coal [46], and consequently, O2 adsorption heat can also be affected by the elemental sulfur content of coal. The elemental nitrogen in coal is mainly in the form of organic matter [69]. The high correlation between O2 adsorption heat and elemental nitrogen content indicates that the nitrogen-functional groups in the coal molecular structure may have a strong interaction with O2.
Figure 9 also shows that there is a moderate positive correlation between the CO2 adsorption heat and the elemental sulfur content of the coal samples, and the correlation coefficient is greater than 0.7. The correlation coefficients between the CO2 adsorption heat and the ash, elemental nitrogen, and mineral contents of the coal samples are all less than 0.6, showing that CO2 adsorption heat has low correlations with the three factors. Fan et al. found that the presence of sulfur-functional groups in coal improve the adsorption affinity of coal molecules for CO2 [70], and consequently, the elemental sulfur content of coal is the main influencing factor of the CO2 adsorption heat in this study. In addition, Table 8 shows that there is a moderate positive correlation between N2 adsorption heat and the aromaticity, fixed carbon, carbon content of the coal samples, indicating that N2 adsorption heat is also affected by the chemical structure of coal.
The above results show that the adsorption amounts and adsorption heat values of the three gases have different influencing factors. The pore structure of coal, especially the micropores, is the main factor determining the adsorption amounts of the three gases. The adsorption heat of the three gases is affected by the pore structure and chemical composition of coal. For N2, the pore structure is the main factor determining the adsorption heat. For CO2 and O2, the chemical composition of coal is the main factor determining the adsorption heat.

5. Conclusions

In this paper, the properties of four coal samples were tested using a coal quality analysis, LP-N2GA, LP-CO2GA, and FTIR. Then, the adsorption isotherms of CO2, O2 and N2 of the coal samples were measured at three different temperatures, and the adsorption amounts and adsorption heat values of CO2, O2 and N2 were obtained. The effects of the properties of the coal samples on adsorption amount and adsorption heat were analyzed. The following conclusions can be drawn from this research:
(1)
In this study, the relationship between gas adsorption amount and adsorption heat in coal and the influencing factors were further clarified. The greater the gas adsorption heat, the greater the change rate of the gas adsorption amount with temperature in coal. The pore structure of the coal, especially the micropore structure, are the main factors that determine the gas adsorption amounts in coal. Gas adsorption heat is affected by the pore structure and chemical composition of the coal.
(2)
The differences in the main influencing factors of the adsorption characteristics of CO2, O2, and N2 in coal were explored. For the three gases, the pore structure of coal is the main factor that determines the adsorption amount. The main influencing factors of the adsorption heat of the three gases are different. The N2 adsorption heat is mainly affected by the pore structure of coal, and the CO2 and O2 adsorption heats are mainly affected by the chemical composition of coal. Specifically, the elemental sulfur content of coal is the main influencing factor of CO2 adsorption heat, and the mineral content of coal is the main influencing factor of O2 adsorption heat.
(3)
The results of this study are helpful to understand the adsorption mechanism of CO2, O2, and N2 in coal, and the results provide basic gas adsorption data for the fire prevention and control technology of injecting inert gas and the technology of CO2 storage in goaf. The coal properties can be used to predict the gas adsorption parameters and to evaluate the gas adsorption ability of different coals. The gas adsorption parameters can be used to numerically simulate the process of injecting inert gas into a goaf for optimizing the gas injection parameters.
(4)
This study has several limitations. In this study, only four types of coal with single particle size were selected, and only the adsorption behaviors of single gases in coals were studied. There are crushed coals with different particle sizes and bulk coals in the field, and competitive adsorption of multi-component gases exists in the goaf. In the future, more types of coals should be collected to study the adsorption behaviors of single and multi-component gases in crushed coals with different particle sizes and bulk coal. A new experimental device should also be constructed to study the mechanism of O2 replacement in coal by injecting CO2 or N2. In addition, the types of functional groups and mineral in coals and their effects on gas adsorption characteristics should be investigated in further research.

Author Contributions

H.L., G.C. and S.W. performed the experiments; H.L., Q.Z., J.K. and J.C. analyzed the data; H.L. and Q.Z. wrote the paper. All authors have read and agreed to the published version of the manuscript.

Funding

This research was funded by the Natural Science Foundation of Xinjiang Uygur Autonomous Region (2021D01C085), the National Natural Science Foundation of China (51974275, 52204243), the Tianshan Innovation Team of Coal Fire Disaster Prevention (2021D14018), the Key Research and Development Program of Xinjiang Uygur Autonomous Region (2022B03025-4), and the Tianchi Doctor Project (TCBS202004).

Institutional Review Board Statement

Not applicable.

Informed Consent Statement

Not applicable.

Data Availability Statement

The experimental data can be provided upon request to the corresponding author.

Acknowledgments

The authors thank Fubao Zhou’s team at the China University of Mining and Technology for their help. The authors also thank the reviewers and editors for the valuable advice and comments on the articles.

Conflicts of Interest

The author declares no conflict of interest.

References

  1. Yang, F.Q.; Qiu, D.Y. Exploring coal spontaneous combustion by bibliometric analysis. Process Saf. Environ. Prot. 2019, 132, 1–10. [Google Scholar] [CrossRef]
  2. Han, Z.Y.; Li, D.Y.; Li, X.B. Effects of axial pre-force and loading rate on Mode I fracture behavior of granite. Int. J. Rock Mech. Min. 2022, 157, 105172. [Google Scholar] [CrossRef]
  3. Onifade, M.; Genc, B. A review of research on spontaneous combustion of coal. J. Min. Sci. Technol. 2020, 30, 303–311. [Google Scholar] [CrossRef]
  4. Lu, X.; Deng, J.; Xiao, Y.; Zhai, X.W.; Wang, C.P.; Yi, X. Recent progress and perspective on thermal-kinetic, heat and mass transportation of coal spontaneous combustion hazard. Fuel 2022, 308, 121234. [Google Scholar] [CrossRef]
  5. Lu, G.B.; Geng, M. Spontaneous combustion of coal mined-out area and its mechanism of control research. J. Liaoning Tech. Univ. Nat. Sci. 2009, 28, 28–30. [Google Scholar]
  6. Wei, D.Y.; Du, C.F.; Lei, B.A.; Lin, Y.F. Prediction and prevention of spontaneous combustion of coal from goafs in workface: A case study. Case Stud. Therm. Eng. 2020, 21, 100668. [Google Scholar] [CrossRef]
  7. Han, Z.Y.; Li, D.Y.; Li, X.B. Dynamic mechanical properties and wave propagation of composite rock-mortar specimens based on SHPB tests. Int. J. Min. Sci. Technol. 2022, 32, 793–806. [Google Scholar] [CrossRef]
  8. Qin, B.T.; Wang, D.M. Present situation and development of mine fire control technology. China Saf. Sci. J. 2007, 17, 80–85. [Google Scholar]
  9. Liu, S.; Liu, F.Y.; Wang, G.; Wu, D.S.; Xiang, J.W. Development outlook of mine fire control technology by using CO2 in coal mine goaf. Coal Technol. 2014, 33, 7–9. [Google Scholar]
  10. Li, Q.W.; Xiao, Y.; Zhong, K.Q.; Shu, C.M.; Lü, H.F.; Deng, J.; Wu, S.L. Overview of commonly used materials for coal spontaneous combustion prevention. Fuel 2020, 275, 117981. [Google Scholar] [CrossRef]
  11. Liu, Y.; Wen, H.; Guo, J.; Jin, Y.F.; Wei, G.M.; Yang, Z.W. Coal spontaneous combustion and N2 suppression in triple goafs: A numerical simulation and experimental study. Fuel 2020, 271, 117625. [Google Scholar] [CrossRef]
  12. Wu, S.Y.; Jin, Z.X.; Deng, C.B. Molecular simulation of coal-fired plant flue gas competitive adsorption and diffusion on coal. Fuel 2019, 239, 87–96. [Google Scholar] [CrossRef]
  13. Jing, R.; Wang, X.F.; Qiao, L.; Deng, C.B.; Hao, C.Y.; Kang, Y.L. Research status and future prospect of power plant flue gas sealed in goaf. Coal Eng. 2021, 53, 125–130. [Google Scholar]
  14. Tan, B.; Cheng, G.; Zhu, X.M.; Yang, X.B. Experimental study on the physisorption characteristics of O2 in coal powder are effected by coal nanopore structure. Sci. Rep. 2020, 10, 6946. [Google Scholar] [CrossRef]
  15. Wang, X.F.; Qiao, L.; Deng, C.B.; Chu, G.; Li, X.F.; Zhao, Q.; Wang, G.L. Study on the characteristics of nitrogen dioxide adsorption and storage of coal residue in coal fired power plants in goaf. Sci. Rep. 2021, 11, 8822. [Google Scholar] [CrossRef] [PubMed]
  16. Liu, S.M.; Sun, H.T.; Zhang, D.M.; Yang, K.; Wang, D.K.; Li, X.L.; Long, K.; Li, Y.N. Nuclear magnetic resonance study on the influence of liquid nitrogen cold soaking on the pore structure of different coals. Phys. Fluids 2023, 35, 012009. [Google Scholar] [CrossRef]
  17. Lu, W.; Wang, D.M.; Dai, G.L.; Zhong, X.X. Study on oxygen physisorption of coal. J. Hunan Univ. Sci. Technol. Nat. Sci. Ed. 2005, 20, 6–10. [Google Scholar]
  18. Ma, H.P.; Lu, W.; Wang, D.M.; Dai, G.L.; Zhong, X.X. Research on physical adsorbed oxygen in coal spontaneous combustion processing. Coal Sci. Technol. 2006, 34, 26–29. [Google Scholar]
  19. Wu, S.Y.; Deng, C.B.; Dai, F.W.; Gao, F.; Wang, X.F. Differences of ability and competitiveness on coal adsorbing CO2, O2 and N2. Chin. J. Environ. Eng. 2017, 11, 4229–4235. [Google Scholar]
  20. Kang, J.H.; Zhu, J.P.; Wang, Y.P.; Zhou, F.B.; Liu, Y.K. Dynamical modeling of coupled heat and mass transfer process of coalbed methane desorption in porous coal matrix. Int. J. Heat Mass Transf. 2022, 183, 122212. [Google Scholar] [CrossRef]
  21. White, C.M.; Smith, D.H.; Jones, K.L.; Goodman, A.L.; Jikich, S.A.; LaCount, R.B.; DuBose, S.B.; Ozdemir, E.; Morsi, B.I.; Schroeder, K.T. Sequestration of carbon dioxide in coal with enhanced coalbed methane recovery—A review. Energy Fuels 2005, 19, 659–724. [Google Scholar] [CrossRef]
  22. Busch, A.; Gensterblum, Y. CBM and CO2-ECBM related sorption processes in coal: A review. Int. J. Coal Geol. 2011, 87, 49–71. [Google Scholar] [CrossRef]
  23. Chattaraj, S.; Mohanty, D.; Kumar, T.; Halder, G. Thermodynamics, kinetics and modeling of sorption behaviour of coalbed methane-A review. J. Unconv. Oil Gas Resour. 2016, 16, 14–33. [Google Scholar] [CrossRef]
  24. Chen, L.W.; Zhao, M.Z.; Li, X.H.; Liu, Y. Impact research of CH4 replacement with CO2 in hydrous coal under high pressure injection. Min. Miner. Depos. 2022, 16, 121–126. [Google Scholar] [CrossRef]
  25. Yang, H.M.; Liu, Y.; Lyu, B.Y. Study on replacement methane with nitrogen from coal by high pressure injection and equal pressure diffusion. J. Saf. Sci. Technol. 2022, 18, 94–99. [Google Scholar]
  26. Wen, H.; Hao, J.C.; Ma, L.; Zheng, X.Z. Experimental study on replacing coal seam CH4 with CO2 gas. ACS Omega 2022, 7, 1395–1403. [Google Scholar] [CrossRef] [PubMed]
  27. Jessen, K.; Tang, G.Q.; Kovscek, A.R. Laboratory and simulation investigation of enhanced coalbed methane recovery by gas injection. Transp. Porous Media 2008, 73, 141–159. [Google Scholar] [CrossRef]
  28. Feng, Y.Y.; Jiang, C.F.; Liu, D.J.; Chu, W. Microstructure and its influence on CH4 adsorption behavior of deep coal. Chin. Phys. B 2014, 23, 028201. [Google Scholar] [CrossRef]
  29. Fu, Y.S.; Liu, X.F.; Ge, B.Q.; Liu, Z.H. Role of chemical structures in coalbed methane adsorption for anthracites and bituminous coals. Adsorption 2017, 23, 711–721. [Google Scholar] [CrossRef]
  30. Liu, X.F.; He, X.Q. Effect of pore characteristics on coalbed methane adsorption in middle-high rank coals. Adsorption 2017, 23, 3–12. [Google Scholar] [CrossRef]
  31. Mukherjee, M.; Misra, S. A review of experimental research on Enhanced Coal Bed Methane (ECBM) recovery via CO2 sequestration. Earth-Sci. Rev. 2018, 179, 392–410. [Google Scholar] [CrossRef]
  32. Zheng, Y.N.; Li, Q.Z.; Yuan, D.S.; Zhang, G.Y.; Liu, J.F.; Yuan, C.C.; Tao, Q.L. Chemical structure of coal surface and its effects on methane adsorption under different temperature conditions. Adsorption 2018, 24, 613–628. [Google Scholar] [CrossRef]
  33. Fu, X.X.; Zhang, D.F.; Jiang, W.P.; Lun, Z.M.; Zhao, C.P.; Wang, H.T.; Li, Y.H. Influence of physicochemical properties of coals on pore morphology and methane adsorption: A perspective. Chem. Ind. Eng. Prog. 2019, 38, 2714–2725. [Google Scholar]
  34. Han, F.S.; Busch, A.; Krooss, B.M.; Liu, Z.Y.; Yang, J.L. CH4 and CO2 sorption isotherms and kinetics for different size fractions of two coals. Fuel 2013, 108, 137–142. [Google Scholar] [CrossRef]
  35. Zhang, L.; Aziz, N.; Ren, T.; Nemcik, J.; Tu, S.H. Influence of coal particle size on coal adsorption and desorption characteristics. Arch. Min. Sci. 2014, 59, 807–820. [Google Scholar] [CrossRef]
  36. Kelemen, S.R.; Kwiatek, L.M. Physical properties of selected block Argonne Premium bituminous coal related to CO2, CH4, and N2 adsorption. Int. J. Coal Geol. 2009, 77, 2–9. [Google Scholar] [CrossRef]
  37. Song, Y.C.; Xing, W.L.; Zhang, Y.; Jian, W.W.; Liu, Z.Y.; Liu, S.Y. Adsorption isotherms and kinetic characteristics of methane on block anthracite over a wide pressure range. Adsorption 2015, 21, 53–65. [Google Scholar] [CrossRef]
  38. Zhou, F.B.; Liu, S.Q.; Pang, Y.Q.; Li, J.L.; Xin, H.H. Effects of coal functional groups on adsorption microheat of coal bed methane. Energy Fuels 2015, 29, 1550–1557. [Google Scholar] [CrossRef]
  39. Li, H.J.; Kang, J.H.; Zhou, F.B.; Qiang, Z.Y.; Li, G.H. Adsorption heat features of coalbed methane based on microcalorimeter. J. Loss Prev. Process Ind. 2018, 55, 437–449. [Google Scholar] [CrossRef]
  40. Liu, Y.K.; Kang, J.H.; Zhou, F.B.; Fan, Y.M.; Li, H.J. Effects of maceral compositions of coal on methane adsorption heat. Geofluids 2018, 2018, 7596138. [Google Scholar] [CrossRef]
  41. Sakurovs, R.; Day, S.; Weir, S. Relationships between the critical properties of gases and their high pressure sorption behavior on coals. Energy Fuels 2010, 24, 1781–1787. [Google Scholar] [CrossRef]
  42. Sakurovs, R.; Day, S.; Weir, S. Relationships between the sorption behaviour of methane, carbon dioxide, nitrogen and ethane on coals. Fuel 2012, 97, 725–729. [Google Scholar] [CrossRef]
  43. Okolo, G.N.; Everson, R.C.; Neomagus, H.W.J.P.; Sakurovs, R.; Grigore, M.; Bunt, J.R. The carbon dioxide, methane and nitrogen high-pressure sorption properties of South African bituminous coals. Int. J. Coal Geol. 2019, 209, 40–53. [Google Scholar] [CrossRef]
  44. Tan, B.; Cheng, G.; Fu, S.H.; Wang, H.Y.; Li, Z.X.; Zhang, X.D. Molecular simulation for physisorption characteristics of O2 in low-rank coals. Energy 2022, 242, 122538. [Google Scholar] [CrossRef]
  45. Deng, C.B.; Deng, H.Z.; Wang, J.R.; Lin, H. Coal surface containing phosphorus group physical adsorption to oxygen molecules mechanism. Coal Convers. 2008, 31, 1–5. [Google Scholar]
  46. Deng, C.B.; Wang, X.F.; Wang, J.R.; Deng, H.Z.; Ye, B. Physical adsorption mechanism of coal surface containing sulfur group adsorption to more oxygen molecule. J. China Coal Soc. 2008, 33, 556–560. [Google Scholar]
  47. GB/T 5751-2009; Chinese Classification of Coals. The National Standards Compilation Group of Peoples Republic of China. Standards Press of China: Beijing, China, 2009.
  48. GB/T 482-2008; Sampling of Coal Seams. The National Standards Compilation Group of Peoples Republic of China. Standards Press of China: Beijing, China, 2008.
  49. GB/T 6948-2008; Method of Determining Microscopically the Reflectance of Vitrinite in Coal. The National Standards Compilation Group of Peoples Republic of China. Standards Press of China: Beijing, China, 2008.
  50. ICCP. The new vitrinite classification (ICCP System 1994). Fuel 1998, 77, 349–358. [Google Scholar] [CrossRef]
  51. GB/T 212-2008; Proximate Analysis of Coal. The National Standards Compilation Group of Peoples Republic of China. Standards Press of China: Beijing, China, 2008.
  52. GB/T 214-2007; Determination of Total Sulfur in Coal. The National Standards Compilation Group of Peoples Republic of China. Standards Press of China: Beijing, China, 2007.
  53. Everett, D.H. Manual of symbols and terminology for physicochemical quantities and units. Pure Appl. Chem. 1972, 31, 579–638. [Google Scholar] [CrossRef]
  54. Gao, F.; Deng, C.B.; Wang, X.F.; Dai, F.W.; Wu, S.Y. Adsorption of power plant flue gas by abandoned coal at normal temperature and pressure. Chin. J. Environ. Eng. 2016, 10, 1907–1912. [Google Scholar]
  55. Wang, D.C.; Yang, Z.Y.; Liu, J.P.; Liao, H.B.; Li, Z.H. Fitting results comparison of different CH4/N2 adsorption models and its adsorption thermodynamics analysis. Coal Sci. Technol. 2016, 44, 192–198. [Google Scholar]
  56. Tang, X.; Wang, Z.F.; Ripepi, N.; Kang, B.; Yue, G.W. Adsorption affinity of different types of coal: Mean isosteric heat of adsorption. Energy Fuels 2015, 29, 3609–3615. [Google Scholar] [CrossRef]
  57. Tang, X.; Ripepi, N.; Stadie, N.P.; Yu, L.J. Thermodynamic analysis of high pressure methane adsorption in Longmaxi shale. Fuel 2017, 193, 411–418. [Google Scholar] [CrossRef]
  58. Do, D.D. Adsorption Analysis: Equilibria and Kinetics; Imperial College Press: London, UK, 1998. [Google Scholar]
  59. Auroux, A. Calorimetry and Thermal Methods in Catalysis; Springer Science & Business Media: Berlin/Heidelberg, Germany, 2013. [Google Scholar]
  60. Siperstein, F.; Gorte, R.J.; Myers, A.L. A new calorimeter for simultaneous measurements of loading and heats of adsorption from gaseous mixtures. Langmuir 1999, 15, 1570–1576. [Google Scholar] [CrossRef]
  61. Pan, H.H.; Ritter, J.A.; Balbuena, P.B. Examination of the approximations used in determining the isosteric heat of adsorption from the Clausius-Clapeyron equation. Langmuir 1998, 14, 6323–6327. [Google Scholar] [CrossRef]
  62. Lide, D.R. CRC Handbook of Chemistry and Physics, 88th ed.; CRC Press: Boca Raton, FL, USA, 2007. [Google Scholar]
  63. Dou, H.R.; Ni, G.H.; Sun, G.S.; Li, Z.; Yin, X.L.; Huang, Q.M.; Wang, Z.Y. Study on dominant structural factors and laws of combustion performance of acidified coal. Energy 2023, 266, 126413. [Google Scholar] [CrossRef]
  64. Hao, M.; Wei, C.M.; Zhang, H. Adsorption and diffusion of methane in coal slit pores: Insights into the molecular level. Energy Fuels 2022, 36, 880–886. [Google Scholar] [CrossRef]
  65. Xiong, J.; Liu, X.J.; Liang, L.X. Molecular simulation study on the adsorption behaviors of methane in slit-like clay mineral pore. J. China Coal Soc. 2017, 42, 959–968. [Google Scholar]
  66. Wang, F.S.; Zhang, Z.M.; Sun, C.; Dong, X.W.; Wang, C. Study on influence of coal composition and structure on spontaneous combustion tendency. Coal Technol. 2019, 38, 75–77. [Google Scholar]
  67. Deng, J.; Ma, X.F.; Zhang, Y.T.; Li, Y.Q.; Zhu, W.W. Effects of pyrite on the spontaneous combustion of coal. Int. J. Coal Sci. Technol. 2015, 2, 306–311. [Google Scholar] [CrossRef]
  68. Chen, S.H.; Bai, X.F.; Fang, Q.G. Research on positive effect mechanism of pyrite on coal oxidation at low temperature. Clean Coal Technol. 2018, 24, 14–19. [Google Scholar]
  69. Zhang, A.H.; Tao, M.X.; Liu, P.Y.; Chen, X.R.; Li, D.D. Advance of research on the occurrence state and content of nitrogen in coal. Coal Geol. Explor. 2016, 44, 9–13. [Google Scholar]
  70. Fan, C.J.; Li, S.; Luo, M.K.; Zhou, L.J.; Zhang, H.H.; Yang, Z.H. Effects of N and S functionalities on binary gas co-adsorption on a coal macromolecule. Energy Fuels 2019, 33, 3934–3946. [Google Scholar] [CrossRef]
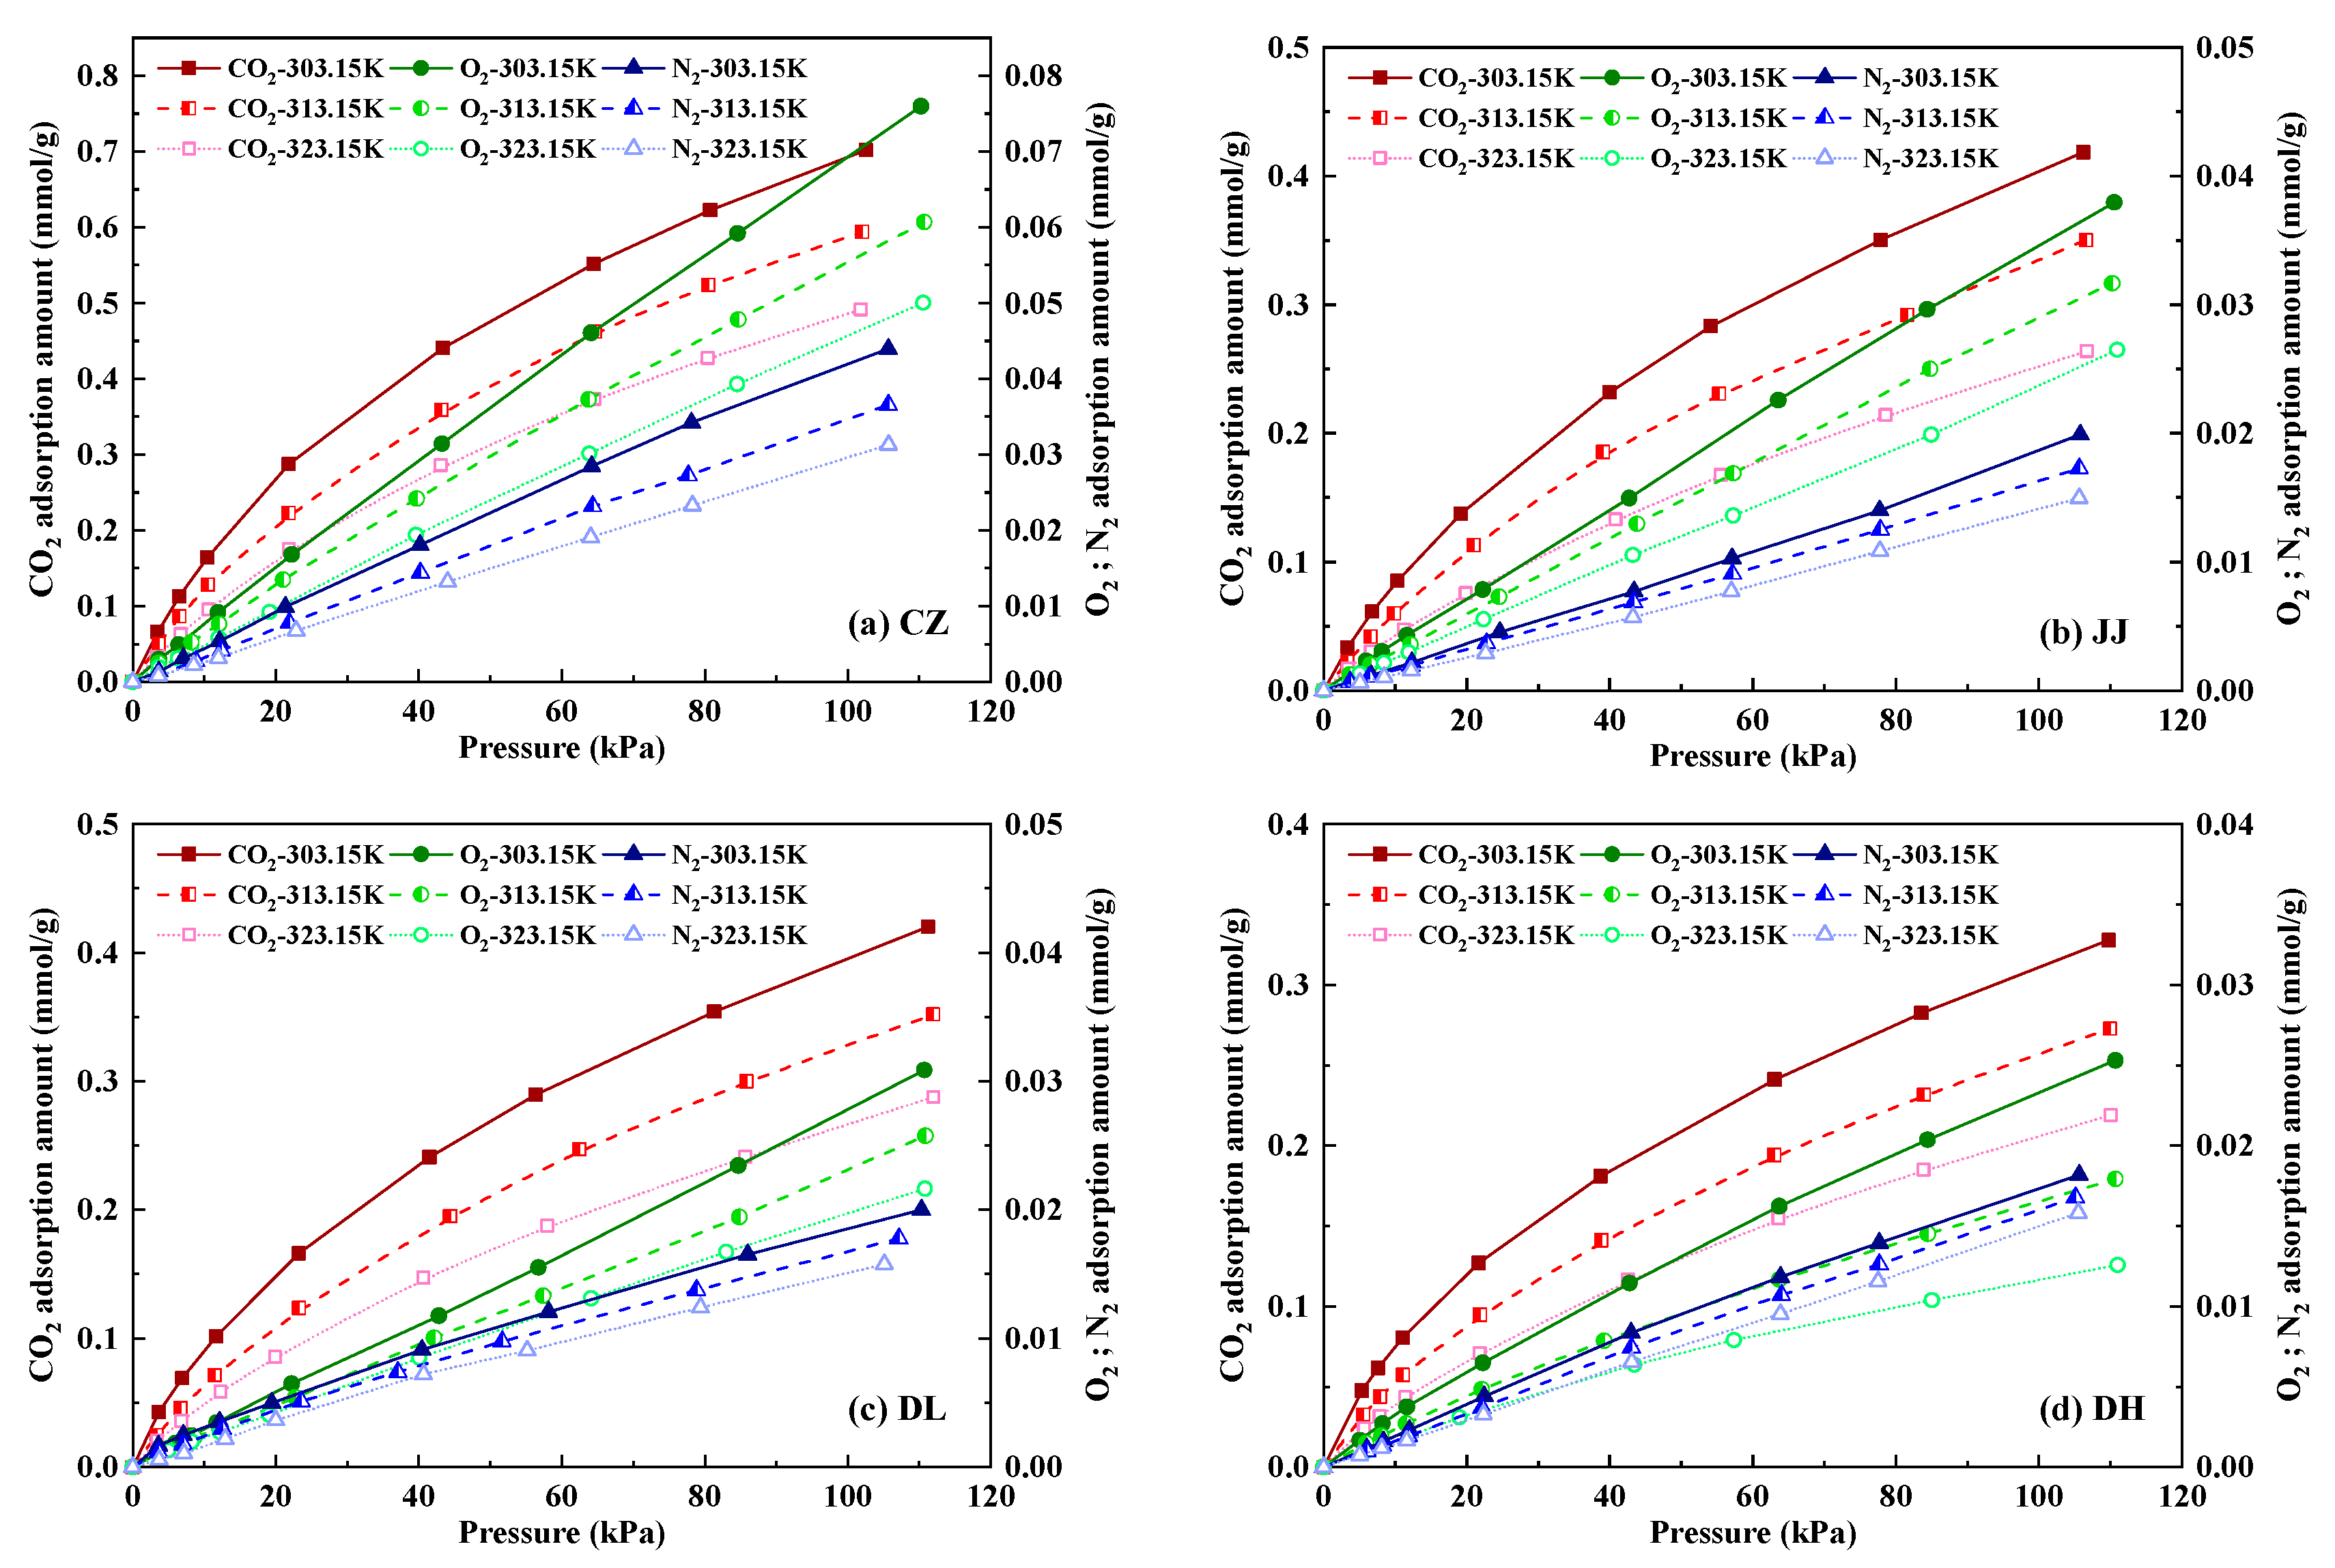
Figure 1. Adsorption isotherms of CO2, O2 and N2 of the coal samples: (a) CZ sample; (b) JJ sample; (c) DL sample; (d) DH sample.
Sustainability 15 08075 g001
Figure 2. Adsorption amounts of CO2, O2 and N2 of the coal samples under atmospheric pressure: (a) CZ sample; (b) JJ sample; (c) DL sample; (d) DH sample.
Sustainability 15 08075 g002
Figure 3. Relationships between lnKH and 1/T for CO2, O2 and N2: (a) CZ sample; (b) JJ sample; (c) DL sample; (d) DH sample.
Sustainability 15 08075 g003
Figure 4. Pore size distribution of the coal samples obtained by LP-N2GA: (a) Pore volume distributions; (b) pore surface area distributions.
Sustainability 15 08075 g004
Figure 5. Pore size distribution of the coal samples obtained by LP-CO2GA: (a) Pore volume distributions; (b) pore surface area distributions.
Sustainability 15 08075 g005
Figure 6. FTIR spectra of the coal samples.
Sustainability 15 08075 g006
Figure 7. Relationships between gas adsorption amount and micropore surface area (a), micropore pore volume (b), mesopore surface area (c), and mesopore pore volume (d).
Sustainability 15 08075 g007
Figure 8. Relationships between gas adsorption heat and micropore surface area (a), micropore pore volume (b), mesopore surface area (c), and mesopore pore volume (d).
Sustainability 15 08075 g008
Figure 9. Relationships between gas adsorption heat and ash content (a), elemental nitrogen content (b), elemental sulfur content (c), and mineral content (d).
Sustainability 15 08075 g009
Table 1. Geological information of the coal samples.
SampleCoal MineCoal SeamCoal FieldGeological Formation
CZChengzhuang3QinshuiShanxi formation of the lower Permian system
JJJinjia18LiupanshuiLongtan formation of the upper Permian system
DLDaliuta5DongshengYan’an formation of the middle Jurassic system
DHDonghuai1BaiseNadu formation of the lower Tertiary system
Table 2. Coal quality parameters of the coal samples.
PropertiesCZJJDLDH
Coal TypeAnthraciteLean coalFat coalLignite
Ro,m (%)2.372.040.760.58
Proximate Analysis (%, air-drying base)
M0.720.543.623.17
A13.8815.205.3842.02
V7.548.8831.8427.96
FC77.5975.3859.1626.85
Ultimate Analysis (%, air-drying base)
C77.5976.6373.3039.33
H2.893.304.483.48
O3.482.8911.729.06
N1.211.201.031.57
S0.240.260.471.37
Maceral Composition (%)
VI67.2668.1249.4572.02
IN28.5630.0047.801.19
EX1.102.98
MI4.181.881.6523.81
Notes: Ro,m, maximum vitrinite reflectance; M, moisture; A, ash; V, volatile; FC, fixed carbon; C, carbon element; H, hydrogen element; O, oxygen element; N, nitrogen element; S, sulfur element; VI, vitrinite; IN, inertinite; EX, exinite, MI, mineral.
Table 3. Fitting results of the adsorption isotherms of the three gases.
SampleTemperature (K)CO2-Langmuir ModelCO2-Virial ModelO2-Henry ModelN2-Henry Model
a (mmol·g−1)b (kPa−1)R2A0A1R2KH (×10−4 mmol
·g−1·kPa−1)
R2KH (×10−4 mmol
·g−1·kPa−1)
R2
CZ303.151.12870.01530.9991−3.8830−1.58160.99957.01270.99904.29640.9978
313.151.06160.01220.9997−4.2133−1.57890.99855.64710.99693.50410.9993
323.150.97690.00970.9997−4.5665−1.56520.99964.61920.99892.96630.9997
JJ303.150.75250.01140.9991−4.5798−2.35370.99343.48160.99951.83730.9988
313.150.70370.00900.9993−4.9591−2.22480.99622.91380.99961.61470.9996
323.150.62490.00670.9994−5.3317−2.69070.98122.37990.99961.38830.9985
DL303.150.67940.01380.9980−4.4371−2.81890.99302.77850.99971.93200.9768
313.150.67670.00940.9992−4.8843−2.58810.99202.32300.99941.75100.9852
323.150.58380.00840.9991−5.1692−2.88900.99192.00200.99801.56460.9935
DH303.150.51020.01520.9966−4.6033−3.86980.98762.40980.98971.78600.9961
313.150.49640.01060.9983−5.0551−3.62920.98751.72040.98441.62830.9987
323.150.44370.00860.9990−5.4084−3.86210.98671.22600.97621.49620.9999
Table 4. Properties of the gases used in this study.
Properties/GasesCO2O2N2
Molecular Mass, m (g/mol)443228
Critical Temperature, Tc (K)304.2154.6126.2
Critical Pressure, Pc (MPa)7.45.03.4
Van der Waals Attractive Constant, a (kJ2/mol2Pa)0.3650.1390.137
Kinetic Diameter, σk (nm)0.3300.3460.364
Table 5. Fitting results of isometric adsorption curves.
SampleGasFitting FormulaR2−ΔH0 (kJ·mol−1)
CZCO2lnKH = 3345.6/T − 14.9120.998627.82
O2lnKH = 2045.1/T − 14.0090.999917.00
N2lnKH = 1815.9/T − 13.7470.998415.10
JJCO2lnKH = 3682.0/T − 16.7230.999830.61
O2lnKH = 1861.5/T − 14.0980.996915.48
N2lnKH = 1370.9/T − 13.1190.996011.40
DLCO2lnKH = 3593.2/T − 16.3120.988229.87
O2lnKH = 1606.5/T − 13.4910.998813.36
N2lnKH = 1032.1/T − 11.9530.99678.58
DHCO2lnKH = 3947.3/T − 17.6360.997332.82
O2lnKH = 3308.9/T − 19.2420.999627.51
N2lnKH = 867.33/T − 11.4920.99997.21
Table 6. Pore structure parameters of the coal samples.
SampleSt (m2/g)Smic (m2/g)Smes (m2/g)Vt (cm3/g)Vmic (cm3/g)Vmes (cm3/g)
CZ179.42144.1435.280.12270.04470.0780
JJ104.3787.6516.720.06630.02900.0373
DL80.1573.546.610.03900.02330.0157
DH62.9456.606.340.04050.01950.0210
Notes: St, total surface area; Vt, total pore volume; Smic, micropore surface area; Vmic, micropore pore volume; Smes, mesopore surface area; Vmes, mesopore pore volume.
Table 7. Chemical structure parameters of the coal samples.
SamplefaHal/HA(CH2)/A(CH3)C
CZ0.97860.08620.74710.3013
JJ0.97030.10360.24680.2458
DL0.69040.75993.64850.4616
DH0.71140.48922.30600.4972
Table 8. Pearson’s correlation coefficients between adsorption parameters and coal properties.
X/YAdsorption AmountAdsorption Heat
CO2O2N2CO2O2N2
Smic0.99010.98990.94780.9022−0.40480.9781
Vmic0.98090.98900.93900.8796−0.38080.9859
Smes0.95580.98470.93090.8071−0.27180.9790
Vmes0.94230.98150.93790.7596−0.18110.9563
fa0.67840.73590.5838−0.5750−0.33220.8859
Hal/H−0.5778−0.6737−0.53710.37400.04780.7888
A(CH2)/A(CH3)−0.4565−0.5570−0.40190.27200.04410.7070
C−0.5544−0.5899−0.40900.54810.50310.8035
M−0.6142−0.6815−0.52240.49940.28150.8420
A−0.4528−0.3324−0.26360.76700.9896−0.4613
V−0.67370.7406−0.59420.54130.26200.8777
FC0.70700.66600.52940.84170.83070.8391
C0.62090.54380.42720.84270.94340.7109
H−0.5558−0.6762−0.60520.2349−0.2882−0.6816
O−0.5594−0.6455−0.49230.39760.14580.7921
N−0.3603−0.2322−0.17010.70010.9851−0.3620
S−0.6498−0.5861−0.45920.84220.90940.7601
VI0.04740.20090.15420.31600.68370.1920
IN0.28930.15390.1050−0.64590.96610.2728
MI−0.4757−0.3811−0.26790.75810.9877−0.5628
Notes: Red numbers represent a high positive correlation (0.9 ≤ r < 1); orange numbers represent a moderate positive correlation (0.7 ≤ r < 0.9); blue numbers represent a high negative correlation (−1 < r ≤ −0.9); green numbers represent a moderate negative correlation (−0.9 < r ≤ −0.7); black numbers represent a low correlation (|r| < 0.7).
Disclaimer/Publisher’s Note: The statements, opinions and data contained in all publications are solely those of the individual author(s) and contributor(s) and not of MDPI and/or the editor(s). MDPI and/or the editor(s) disclaim responsibility for any injury to people or property resulting from any ideas, methods, instructions or products referred to in the content.