Article

Impact of Combined Exposure to Glyphosate and Diquat on Microbial Community Structure and Diversity in Lateritic Paddy Soil

1
National Key Laboratory of Green Pesticide, Key Laboratory of Green Pesticide and Agricultural Bioengineering, Ministry of Education, Center for R&D of Fine Chemicals of Guizhou University, Guiyang 550025, China
2
Environment and Plant Protection Institute, Chinese Academy of Tropical Agricultural Sciences, Haikou 571101, China
3
Danzhou Scientific Observing and Experimental Station of Agro-Environment, Ministry of Agriculture and Rural Affairs, Danzhou 571737, China
4
National Agricultural Experimental Station for Agricultural Environment, Danzhou 571737, China
5
Hainan Engineering Research Center for Non-Point Source and Heavy Metal Pollution Control, Danzhou 571737, China
*
Authors to whom correspondence should be addressed.
Sustainability 2023, 15(11), 8497; https://doi.org/10.3390/su15118497
Submission received: 13 April 2023 / Revised: 8 May 2023 / Accepted: 18 May 2023 / Published: 24 May 2023
(This article belongs to the Section Soil Conservation and Sustainability)

Abstract

:
Microbial communities play crucial roles in the biogeochemical cycling of many important soil elements. Pesticides are known to affect non-targeted soil microorganisms. Glyphosate (GP) and diquat (DQ), two commonly used non-selective herbicides, often co-exist in lateritic paddy soil rich in iron/aluminum oxides. However, there is limited information on their co-impact on microbial community structure and diversity in this type of soil. Here, the short-term effects of combined exposure to GP and DQ on microbial diversity and community structure shifts were investigated in lateritic paddy soil from a tropical agricultural region (Hainan, China). The combined utilization dosages of two herbicides were set in three concentrations: low concentration (1 fold of the recommended dosage), medium concentration (10 fold of the recommended dosage) and high concentration (100 fold of the recommended dosage). The structure and diversity of microbial communities were determined via 16S rRNA and ITS gene high-throughput sequencing. The results revealed that Actinobacteria and Proteobacteria were the most sensitive microbial phyla to the combined exposure of GP and DQ in lateritic paddy soil. The combined exposure to GP and DQ increased the abundance of Actinobacteria but significantly inhibited that of Proteobacteria, especially at low and medium concentrations. Compared with CK, mixed herbicide (GP + DQ) had no adverse effects on the richness of bacteria and fungi communities as well as on the diversity of bacteria communities, but it significantly decreased the diversity of fungi communities at high concentrations within 28 days. However, the effects of combined exposure to GP and DQ on soil microbial richness and diversity were not significantly different from those of separate exposure of the two herbicides. In conclusion, the combined application of GP and DQ had no more adverse effects on soil microorganisms. Therefore, these two herbicides can be used reasonably in actual agricultural production.

1. Introduction

Herbicides are the most widely used class of pesticides in global agriculture [1], with up to 1.2 million tons in 2018 [2]. Among herbicides, glyphosate (GP) and diquat (DQ), as two non-selective herbicides, both rank in the top five most commonly used herbicides in the global market; in particular, GP has the highest use in the global market with 0.86 million tons used in 2016 [3]. At present, GP was recorded to cause heavy pollution in different environmental media [4,5,6], e.g., water (21.2–32.5 μg/L) [7,8,9], soil (1200–1502 μg/kg) [10,11,12] and sediment (1149 μg/kg) [13], especially in tropical soil (690–40,000 μg/kg) [12,14,15,16,17]. So far, however, there have been few studies on the appearance, persistence, and distribution of DQ in the environment; the residue of DQ in sediments is obviously larger than that in soil [18]. Meanwhile, lateritic paddy soil is rich in iron and aluminum, due to its strong binding with clay particles and organic matter, and DQ is easily retained in the lateritic paddy soil; even the adsorption of GP in soils increased with iron and aluminum oxides content [19,20,21]. In practice, two or more mixed herbicides (e.g., GP and DQ) are often applied in varied agricultural scenarios, especially in the tropics [6,16,22]. Undoubtedly, the GP and DQ will inevitably co-occur in lateritic paddy soil. However, there is limited information on the co-occurrence of GP and DQ on microbial diversity and community structure shifts in lateritic paddy soil.
Microbial communities in the soil environment play an important role in the biogeochemistry cycle of many important soil elements [23,24]. It was found that herbicide residues changed the soil microflora and had a potentially long-term effect on the functions of agricultural soils [25,26,27,28]. Most studies have shown that GP has no or transient stress effect on the soil microbial community [29,30,31,32,33,34], but some studies have shown significant adverse effects [35,36,37]. For instance, GP can lead to a decrease in the abundance of Pseudomonas fluorescens, Mn-transforming bacteria, and indoleacetic acid-producing bacteria in soybean rhizosphere soil [38]. The abundance of certain Bacteroidetes, Chloroflexi, Cyanobacteria, Planctomycetes, and alpha-Proteobacteria members are highly negatively correlated with GP concentrations [39]. There is also some other literature on the specific functional or ecological microbial groups in different GP exposure cycles, including the effects of GP on Acidobacteria, ammonia-oxidizing bacteria, Mycorrhiza, etc. [40,41,42]. Due to the strong binding property of DQ with clay particles, it is reasonable to assume that higher levels of DQ occurred in lateritic paddy soil, which might bring more pressure on the structure and function of the microbe. Nevertheless, there are few studies on the effects of combined exposure of GP with other herbicides on microbial populations [43], where the combined toxicology of GP with other chemicals on microorganisms mainly focuses on it with heavy metals or polyethylene microplastics [44,45,46,47,48,49]. GP contains coordination groups such as carboxyl, amino, and phosphate groups, and has a strong complexing ability to heavy metal cations and organic cations [46]. Similar to the charge characteristics of metal ions, DQ has the ability to strongly adsorb on the surface with negative charges and also has a strong oxidation–reduction cycling ability that can be reduced to generate free radicals [19]. These similar characteristics coupled with the observed difference (i.e., strong oxidation–reduction cycling ability) might partly contribute to the combined toxic effects of GP and DQ differing from that of GP and heavy metal.
Are soil microbial communities and community structures significantly affected by the combined use of herbicides in lateritic paddy soil in tropical agricultural areas? We hypothesized that mixed herbicides would have significant adverse effects on the overall community structure and diversity of soil microorganisms; in addition, the effects of mixed herbicides on soil microbiota were significantly different from those of single herbicides, and mixed herbicides can reduce or increase the abundance of certain microbial communities in the soil. In the context, the short-term exposure (28 days) test was conducted, wherein the effects of single GP, DQ, and their mixture on the diversity and community structure of soil bacteria and fungi were investigated in lateritic paddy soil from a tropical agricultural region (Hainan, China) based on 16S rRNA and Internal Transcribed Spacer (ITS) high-throughput sequencing technology. We hope the results of the study will provide a scientific basis for the rational composite application of herbicides in lateritic paddy soil in agricultural areas.

2. Materials and Methods

2.1. Experiment Design and Sample Collection

Lateritic paddy soils (0–15 cm) were collected from a village (19°55′ N, 110°25′ E) in the tropical agricultural region of the Nandu River Basin in Hainan Province, China. The residues of GP and DQ were not found in the soil (the limits of detection were <0.03 mg kg−1) based on the analytical methods by Delhomme et al. [50] and Pizzutti et al. [51]. The texture of the soil is a typical sandy loam identified using a method from USDA [52]. In order to recover soil microorganisms, the soil samples were sieved through a sieve (2 mm). Then, the deionized water was added to keep the soil at 50% of the maximum water holding capacity, lasting 2 weeks for pre-incubation. Analytical grade DQ and GP (active ingredient >98.5%) were purchased from Beijing Tanmo Quality Inspection Technology Co., Ltd. (Beijing, China). The recommended field dose of GP was 0.6 mg kg−1, and meanwhile, the recommended dosage of DQ in the field was 0.4 mg kg−1 [53]. In the experiment, 10 treatments were set up based on the recommended field dose, containing a blank only with deionized water and the 9 different experimental treatments of GP, DQ, and GP + DQ at different concentrations (Table 1). The initial weight of soil in each treatment was 50 g. During the experiment, deionized water was added regularly during the incubation process to compensate for evaporated water. Overall, 3 g samples were collected from each treatment on days 1, 7, 14 and 28 after application; then, the soil samples were stored at −80 °C and taken out for testing within 3 days. All experiments were conducted in triplicates.

2.2. DNA Extraction and Database Construction

Microbial DNA was extracted using the HiPure Soil DNA Kits (or HiPure Stool DNA Kits) (Magen, Guangzhou, China) according to the manufacturer’s protocols. The 16S rDNA target region of the ribosomal RNA gene was amplified via PCR (95 °C for 5 min, followed by 30 cycles at 95 °C for 1 min, 60 °C for 1 min, and 72 °C for 1 min and a final extension at 72 °C for 7 min) using primers listed in Table S1. PCR reactions were performed in triplicate using the 50 μL mixture containing 10 μL of 5 × Q5@ Reaction Buffer, 10 μL of 5 × Q5@ High GC Enhancer, 1.5 μL of 2.5 mM dNTPs, 1.5 μL of each primer (10 μM), 0.2 μL of Q5@ High-Fidelity DNA Polymerase, and 50 ng of template DNA. Related PCR reagents were from New England Biolabs, Ipswich, MA, USA.
For bacteria, after genomic DNA was extracted from the soil samples, the 16S rDNA V3 + V4 region was amplified with barcode-specific primers. The primer sequence was: 341F: CCTACGGGNGGCWGCAG; 806R: GGACTACHVGGGTATCTAAT.
For fungi, the amplified region is the ITS2 region of ITS. The primer sequences were as follows: ITS3: GATGAAGAACGYAGYRAA; ITS4: TCCTCCGCTTATTGATATGC. The purified amplified products were connected to sequencing linkers to construct sequencing libraries and sequenced using Illumina.

2.3. Bioinformatic Analysis of Microbial 16S rRNA and ITS

After the raw data named “Reads” were obtained via sequencing, the low-quality data in Reads were filtered first; then, the two-terminal Reads were spliced into Tag, and the Tag was filtered again. The data obtained were called Clean Tag. Next, based on Clean Tag, Usearch software was used to cluster, remove the chimeric Tag detected during the clustering process, and obtain the representative sequences and abundance of OTU. The representative OTU sequences were classified into organisms via a naive Bayesian model using an RDP classifier [54] (version 2.2) based on SILVA database [55] (version 132) or UNITE database [56] (version 8.0) or ITS2 database [57] (version update 2015), with the confidence threshold value of 0.8. Based on the sequence and abundance data of OTU, species annotation, species composition analysis, indicator species analysis, α diversity analysis and β diversity analysis were carried out. In α diversity analysis, the Chao1 index and the Shannon’s evenness index were calculated in QIIME [58] (version 1.9.1). The alpha index comparison between groups was calculated using the Welch’s t-test and Wilcoxon rank test in the R project Vegan package [59] (version 2.5.3). The alpha index comparison among groups was computed using the Tukey’s HSD test and Kruskal–Wallis H test in the R project Vegan package [60] (version 2.5.3). If there was effective grouping, the differences between groups were compared and tested statistically.

2.4. Data Analysis and Statistical Analysis

Gene abundance data were analyzed using One-way Analysis of Variance (ANOVA) by using the SPSS Statistical Package (version 19.0, IBM, Armonk, NY, USA). The Duncan’s multi-range test and Spearman’s rank statistical analysis were used to calculate the correlation between samples, bacteria and fungi and BDGs/PDGs. All data are mean ± standard error (SE) of three replicates. The data were considered to be significant when p < 0.05.

3. Results

3.1. Effects of Combined Exposure of GP and DQ on the Composition and Diversity of Soil Bacterial Community

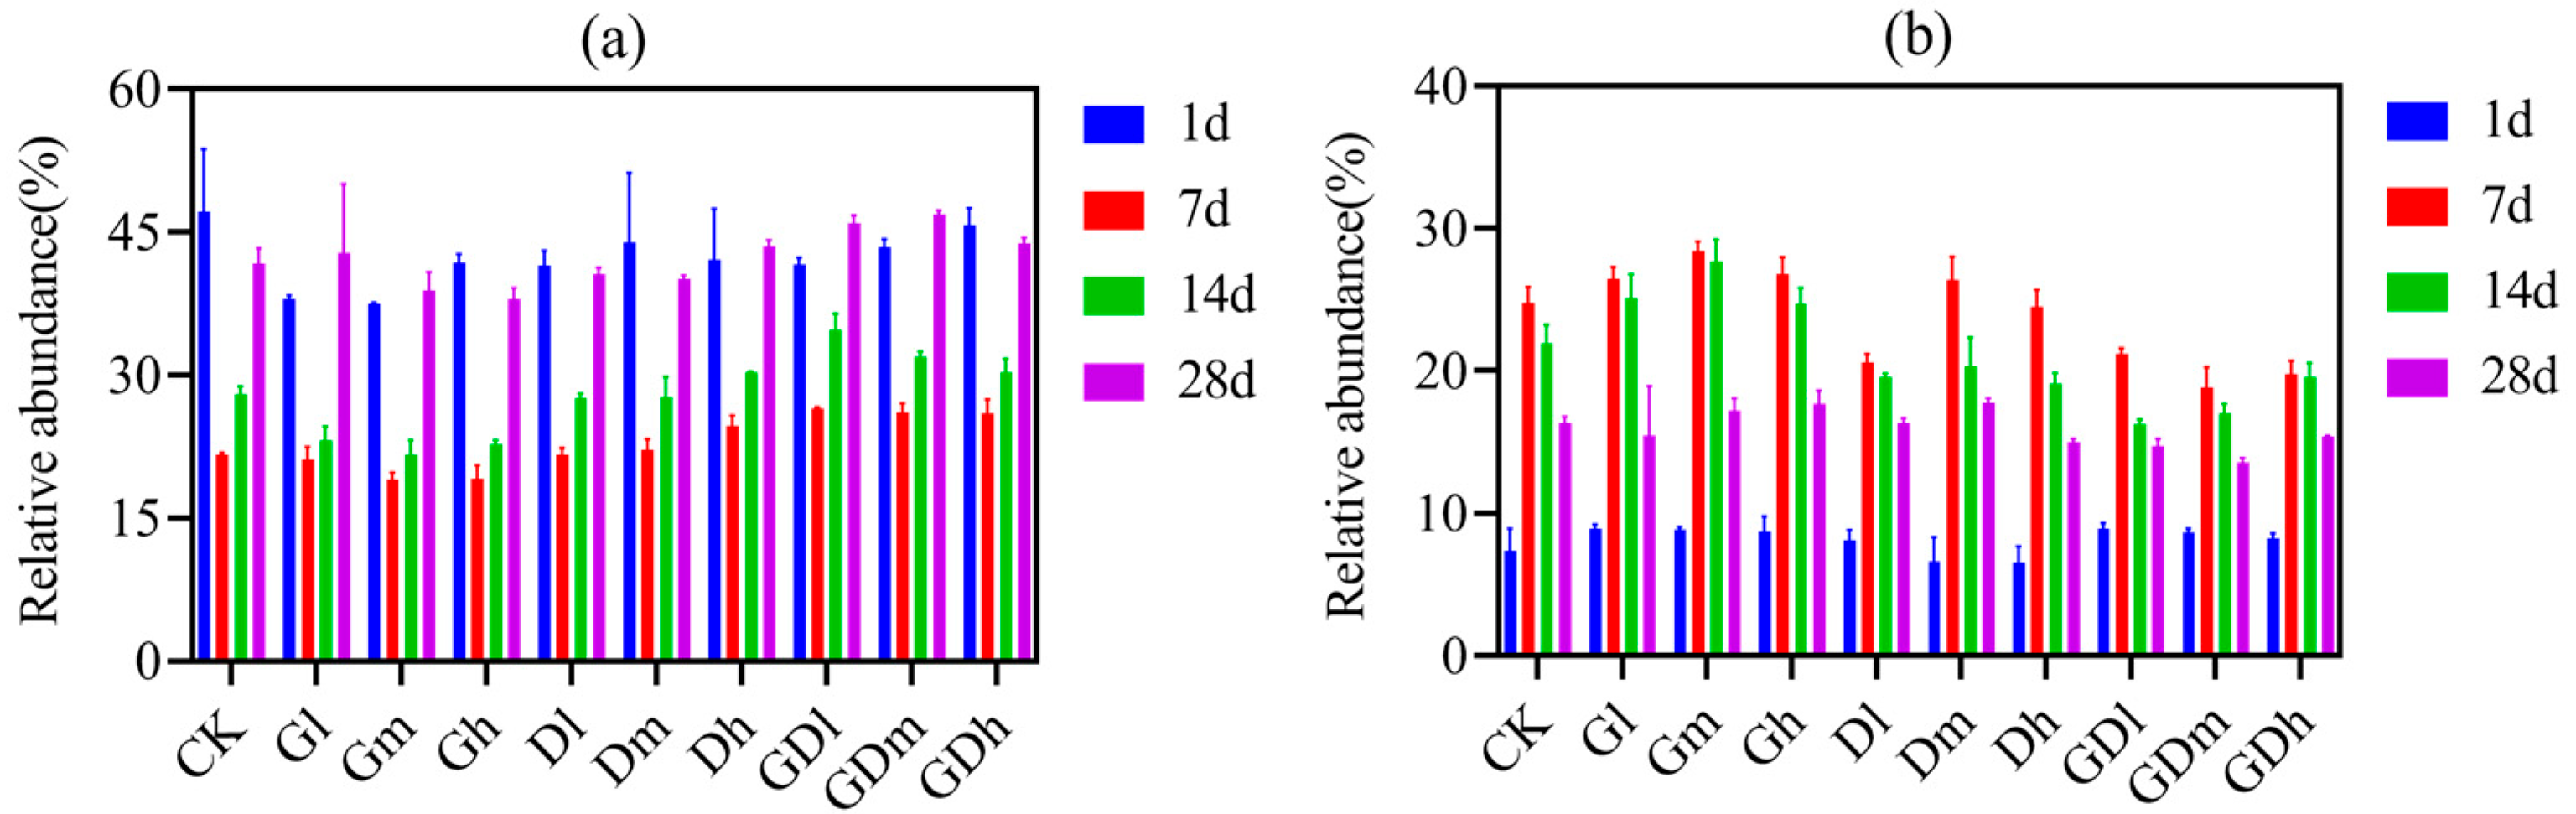
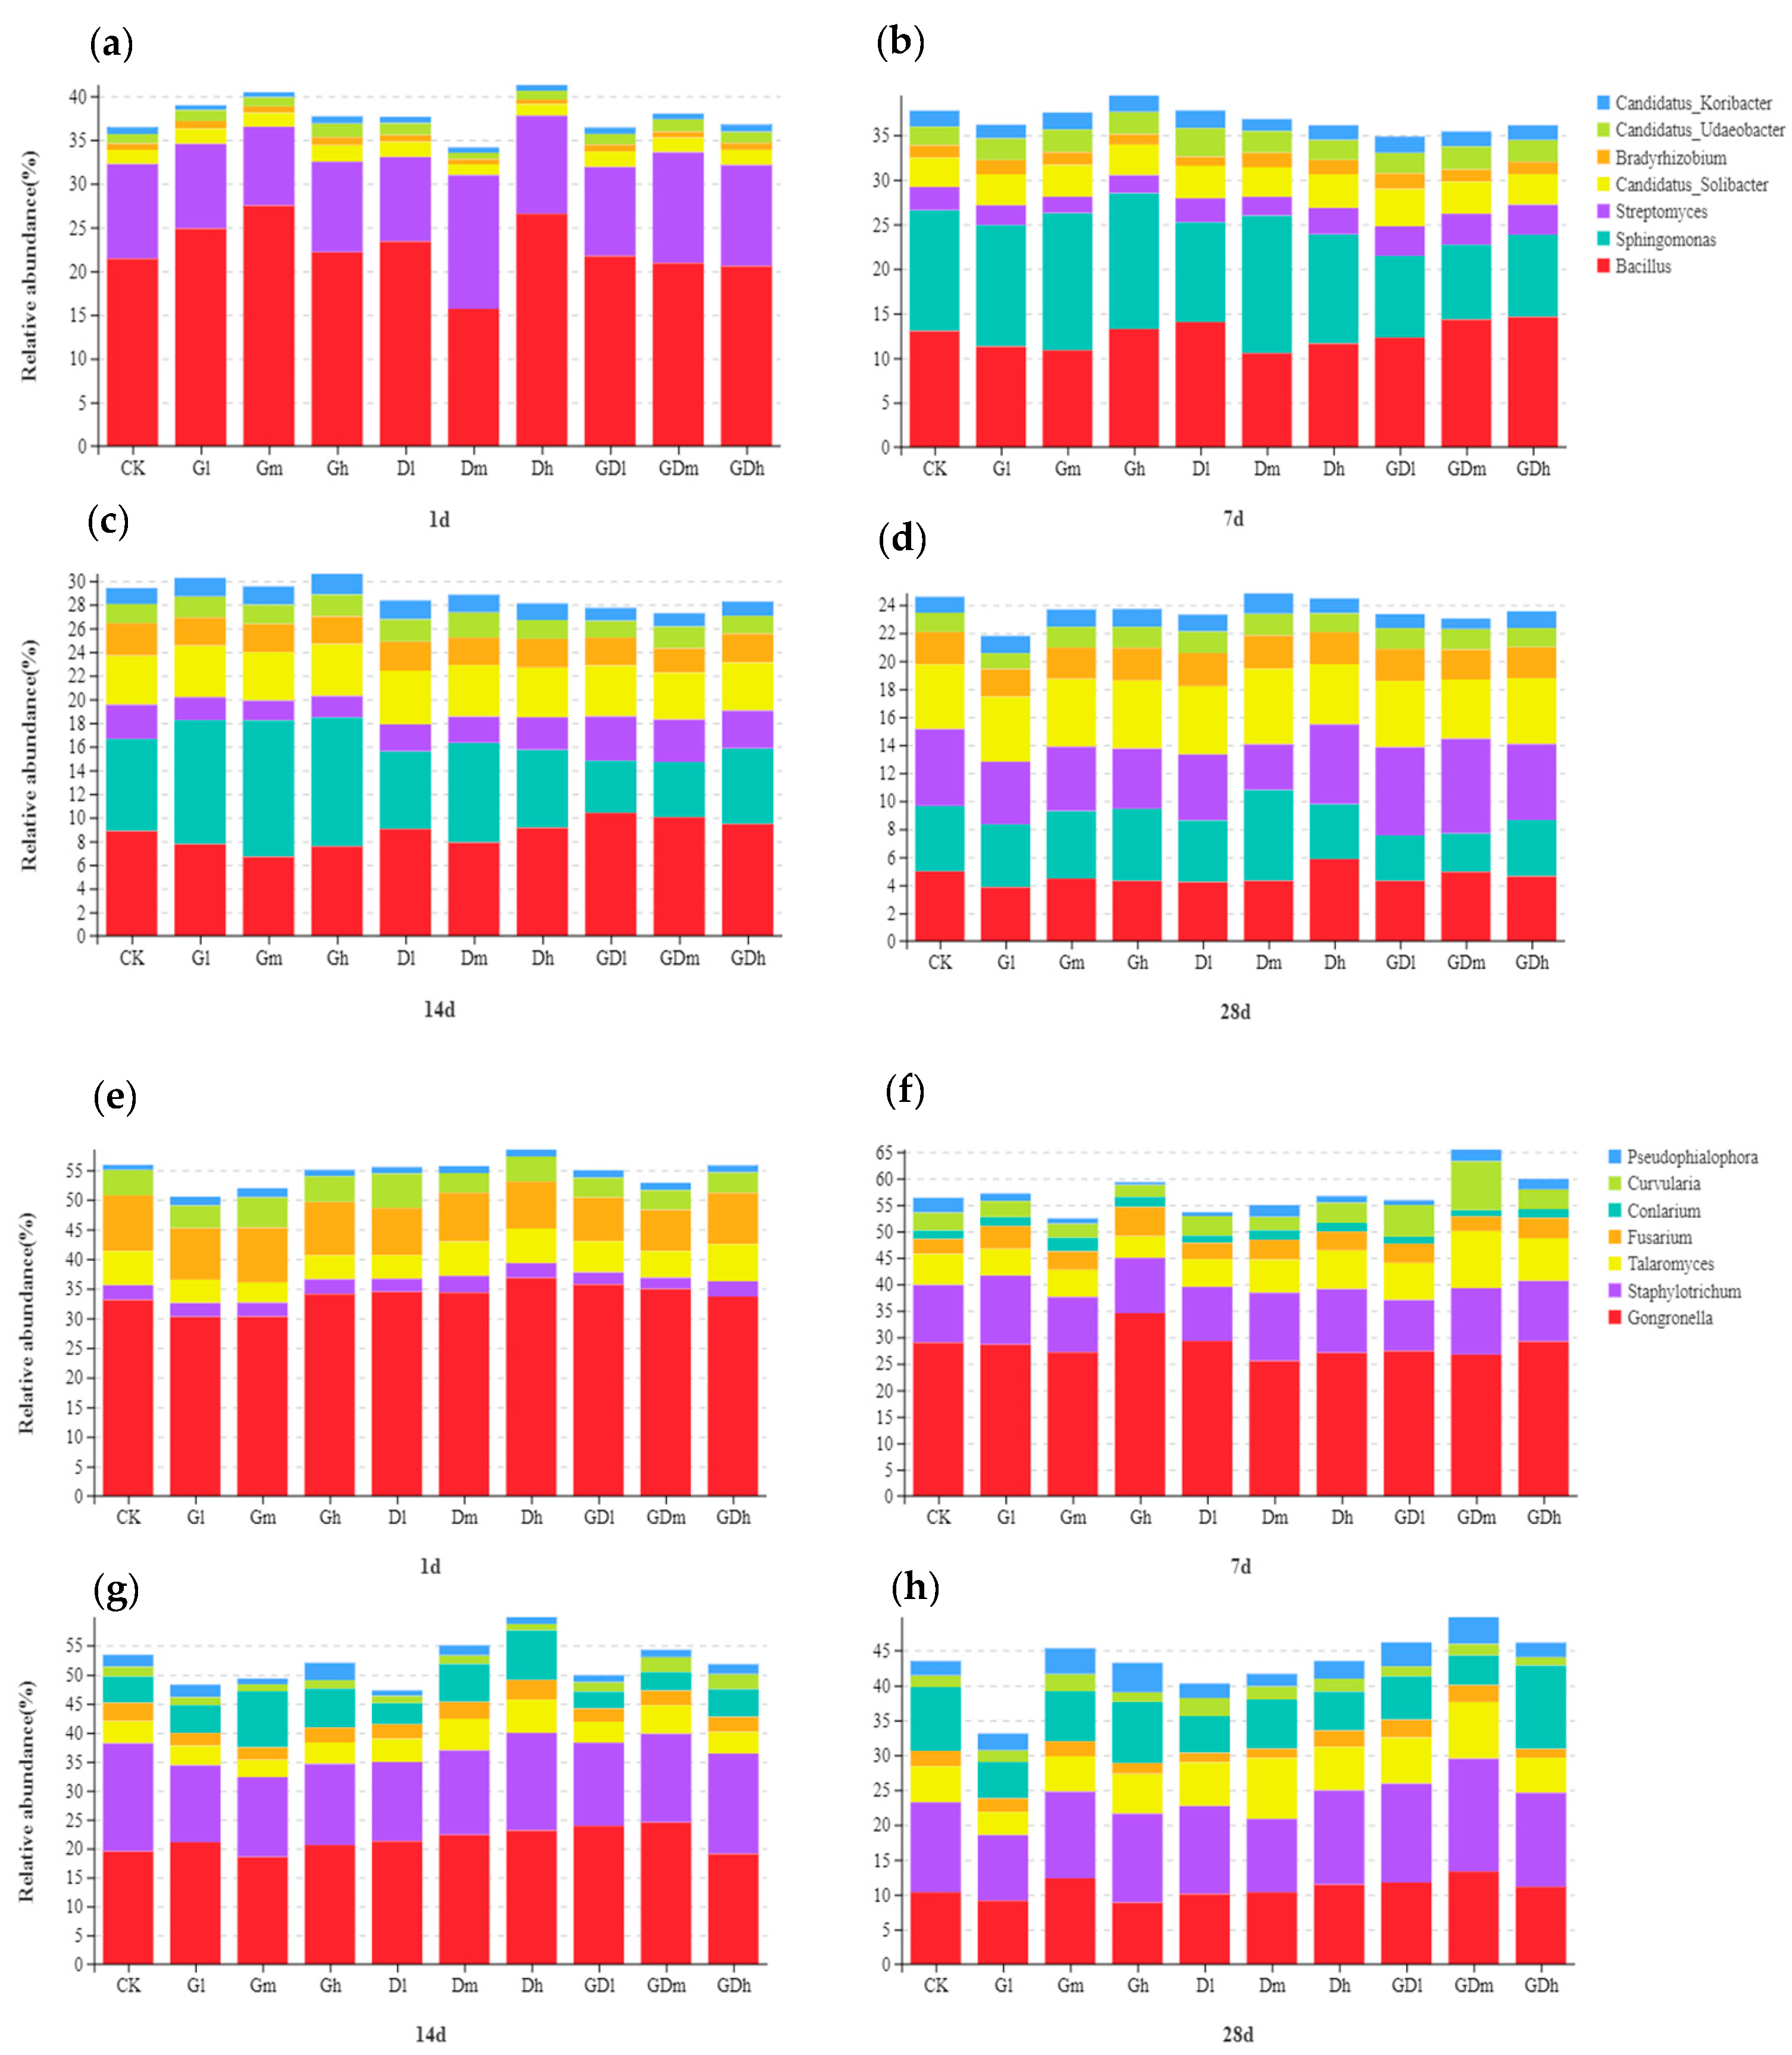
3.1.1. Bacterial Community Composition

In general, it was observed that GP decreased the relative abundance of Actinobacteria; nevertheless, DQ had no significant effect on Actinobacteria. Particularly, the combined pollution of GP and DQ increased the relative abundance of Actinobacteria, as shown in Figure 1a. Specifically, a low concentration of mixed herbicides caused the relative abundance of Actinobacteria to increase by 4.91%, 6.78% and 4.25% on the 7th, 14th and 28th day, respectively; a medium concentration of mixed herbicides caused the relative abundance of Actinobacteria to increase by 3.98% and 5.21% on the 14th and 28th day, respectively; and a high concentration of mixed herbicides caused the relative abundance of Actinobacteria to increase by 4.38% and 2.37% on the 7th and 14th day, respectively. Notably, the mixed herbicides enhanced the inhibitory effect of DQ on Proteobacteria, although the GP increased the abundance of Proteobacteria and the DQ decreased the abundance of Proteobacteria, as shown in Figure 1b. Specifically, a low concentration of mixed herbicides caused the relative abundance of Proteobacteria to decrease by 3.58% and 5.70% on the 7th and 14th day, respectively; a medium concentration of mixed herbicides caused the relative abundance of Proteobacteria to decrease by 4.93% and 2.76% on the 14th and 28th day, respectively; and a high concentration of mixed herbicides caused the relative abundance of Proteobacteria to decrease by 4.97%, 2.49% and 0.92% on the 7th, 14th and 28th day, respectively. Taken together, the results indicated that combined pollution of GP and DQ could increase the relative abundance of Actinobacteria and decrease the relative abundance of Proteobacteria compared with a single herbicide.
The stacking chart of the distribution of bacterial community composition at the genus level is shown in Figure 2a–d. Overall, it could be observed that GP increased the relative abundance of Sphingomonas while DQ decreased the abundance of Sphingomonas, whereas the inhibition of mixed herbicides on Sphingomonas was stronger than that of DQ, but the inhibitory effect weakened over time. Specifically, a low concentration of mixed herbicides caused the relative abundance of Sphingomonas to decrease by 4.36%, 3.39% and 1.40% on the 7th, 14th and 28th day, respectively; a medium concentration of mixed herbicides caused the relative abundance of Sphingomonas to decrease by 5.13%, 3.11% and 1.92% on the 7th, 14th and 28th day, respectively; while the high concentration of mixed herbicides caused the relative abundance of Sphingomonas to decrease by 4.30%, 1.41% and 0.64% on the 7th, 14th and 28th day, respectively. Remarkably, the mixed herbicides increased the relative abundance of Streptomyces, although an inhibiting effect on the Streptomyces by GP and DQ was observed. Specifically, a low concentration of mixed herbicides caused the relative abundance of Streptomyces to increase by 0.69%, 0.86% and 0.81% on the 7th, 14th and 28th day, respectively; while the medium concentration of mixed herbicides caused the relative abundance of Streptomyces to increase by 0.85%, 0.69% and 1.29% on the 7th, 14th and 28th day, respectively. In addition, it was observed that GP increased the relative abundance of Phenylobacterium; nevertheless, DQ had little effect on Phenylobacterium. Particularly, the mixed herbicides decreased the relative abundance of Phenylobacterium to some extent. On the 7th day, a low concentration of mixed herbicides caused the abundance of Phenylobacterium to decrease by 0.59%. However, the medium concentration of mixed herbicide reduced the Phenylobacterium abundance by 0.74% on day 7. The results showed that the mixed herbicides inhibited the growth of Sphingomonas and Phenylobacterium, and promoted the growth of Streptomyces at low and high concentrations as compared with a single herbicide.

3.1.2. Alpha Diversity of the Bacterial Community

The results of bacterial richness and diversity analysis are shown in Table 2. Generally, the Chao1 index was used to evaluate microbial richness, while the Shannon index was used to evaluate microbial diversity. The larger the Chao1 index is, the higher the microbial richness will be. In addition, the larger the Shannon index is, the higher the microbial diversity will be. On day 1 and day 28, it was observed that the medium concentration of GP increased bacterial richness (increased by 413.413/146.912) while the same concentration of DQ inhibited bacterial richness (reduced by 195.023/48.648). Particularly, the medium concentration of mixed herbicides promoted bacterial richness (increased by 300.247/63.717). It is noteworthy that medium concentrations of GP and DQ promoted bacterial diversity on days 7 and 14, but by day 28, the impact of single and mixed herbicides on soil bacterial diversity was not significantly different. In general, the effects of mixed herbicides on soil bacterial richness and diversity were not significantly different from those of a single herbicide.

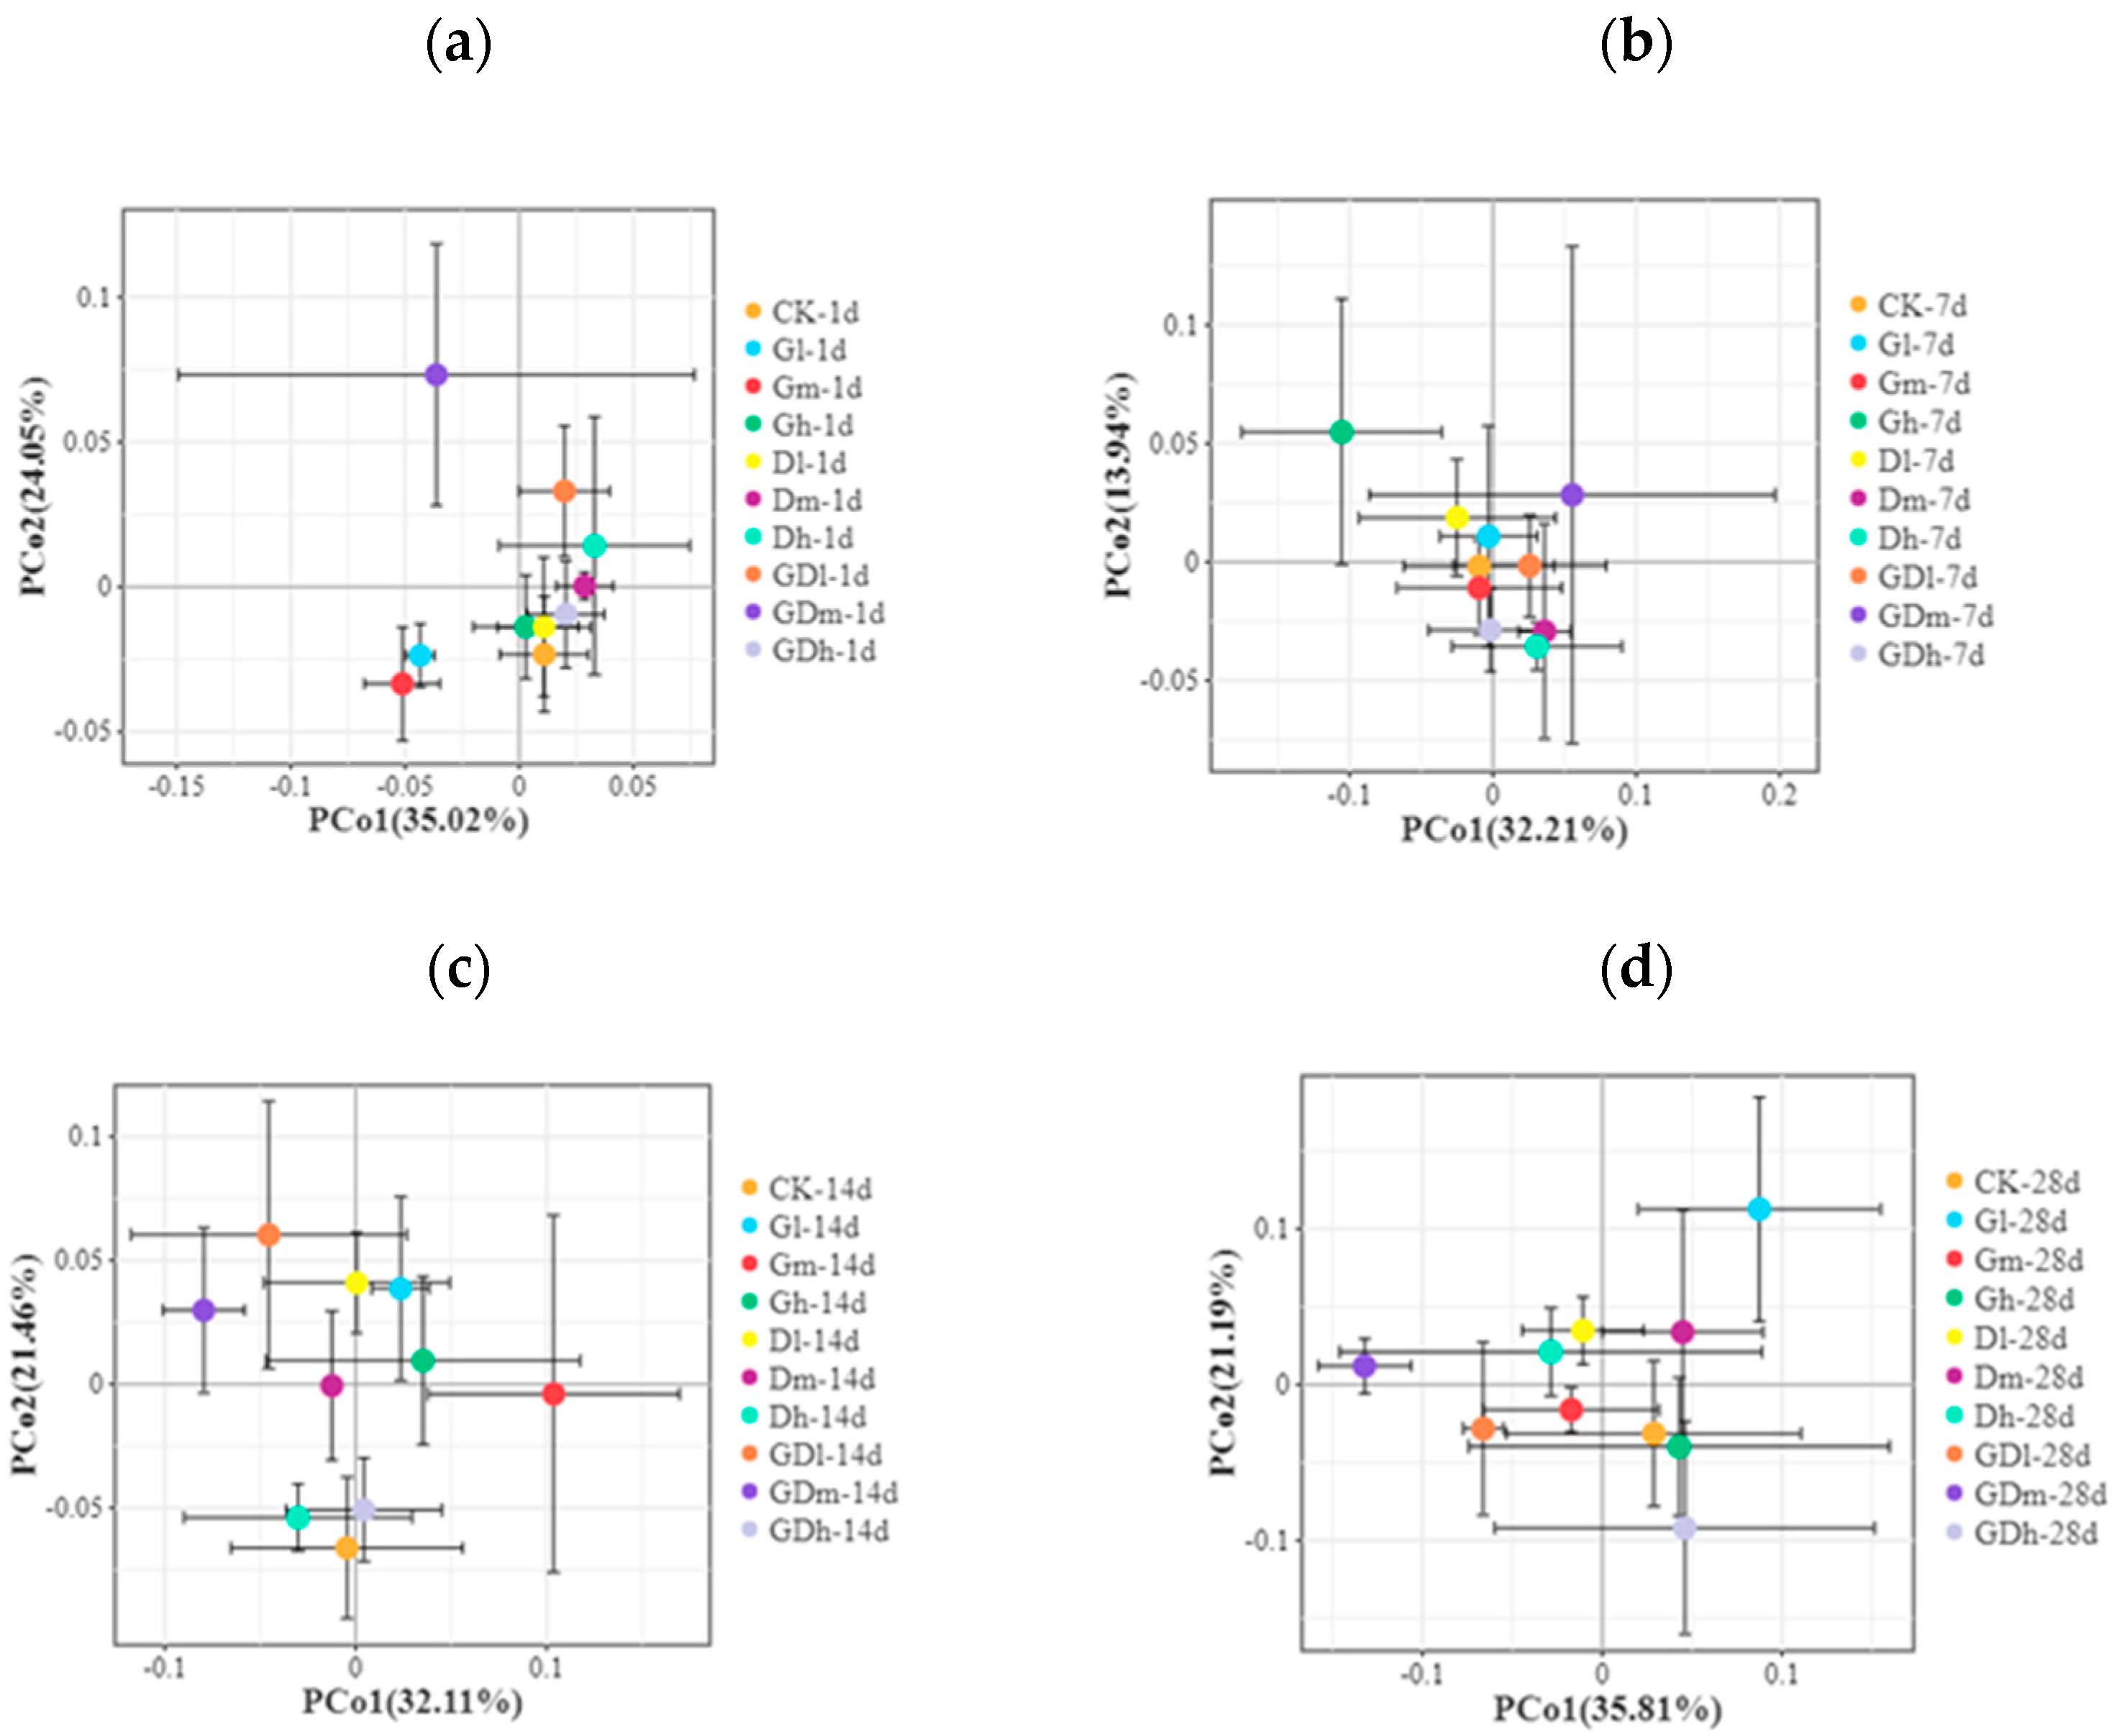
3.1.3. Beta Diversity of the Bacterial Community

The principal coordinate analyses based on the Bray–Curtis distance for the bacterial communities at the phylum level and genus level are shown in Figure 3a,b and Figure S1. The results showed that the difference in community structure between the control and the composite herbicide was less than that between the control and the single herbicide (Figure S1). In addition, on day 1 (Figure 3a) and day 14 (Figure 3b), the difference in community structure between the mixed herbicide treatment and the control treatment was less than that between the single herbicide treatment and the control treatment (R2 = 0.723, p = 0.001; R2 = 0.405, p = 0.044). From the above analysis, it can be concluded that the effect of mixed herbicides on the soil bacterial community structure was less than that of single herbicides at low concentrations, although there was no significant difference in the effects between mixed herbicides and single herbicides on the soil bacterial community structure at medium or high concentrations.

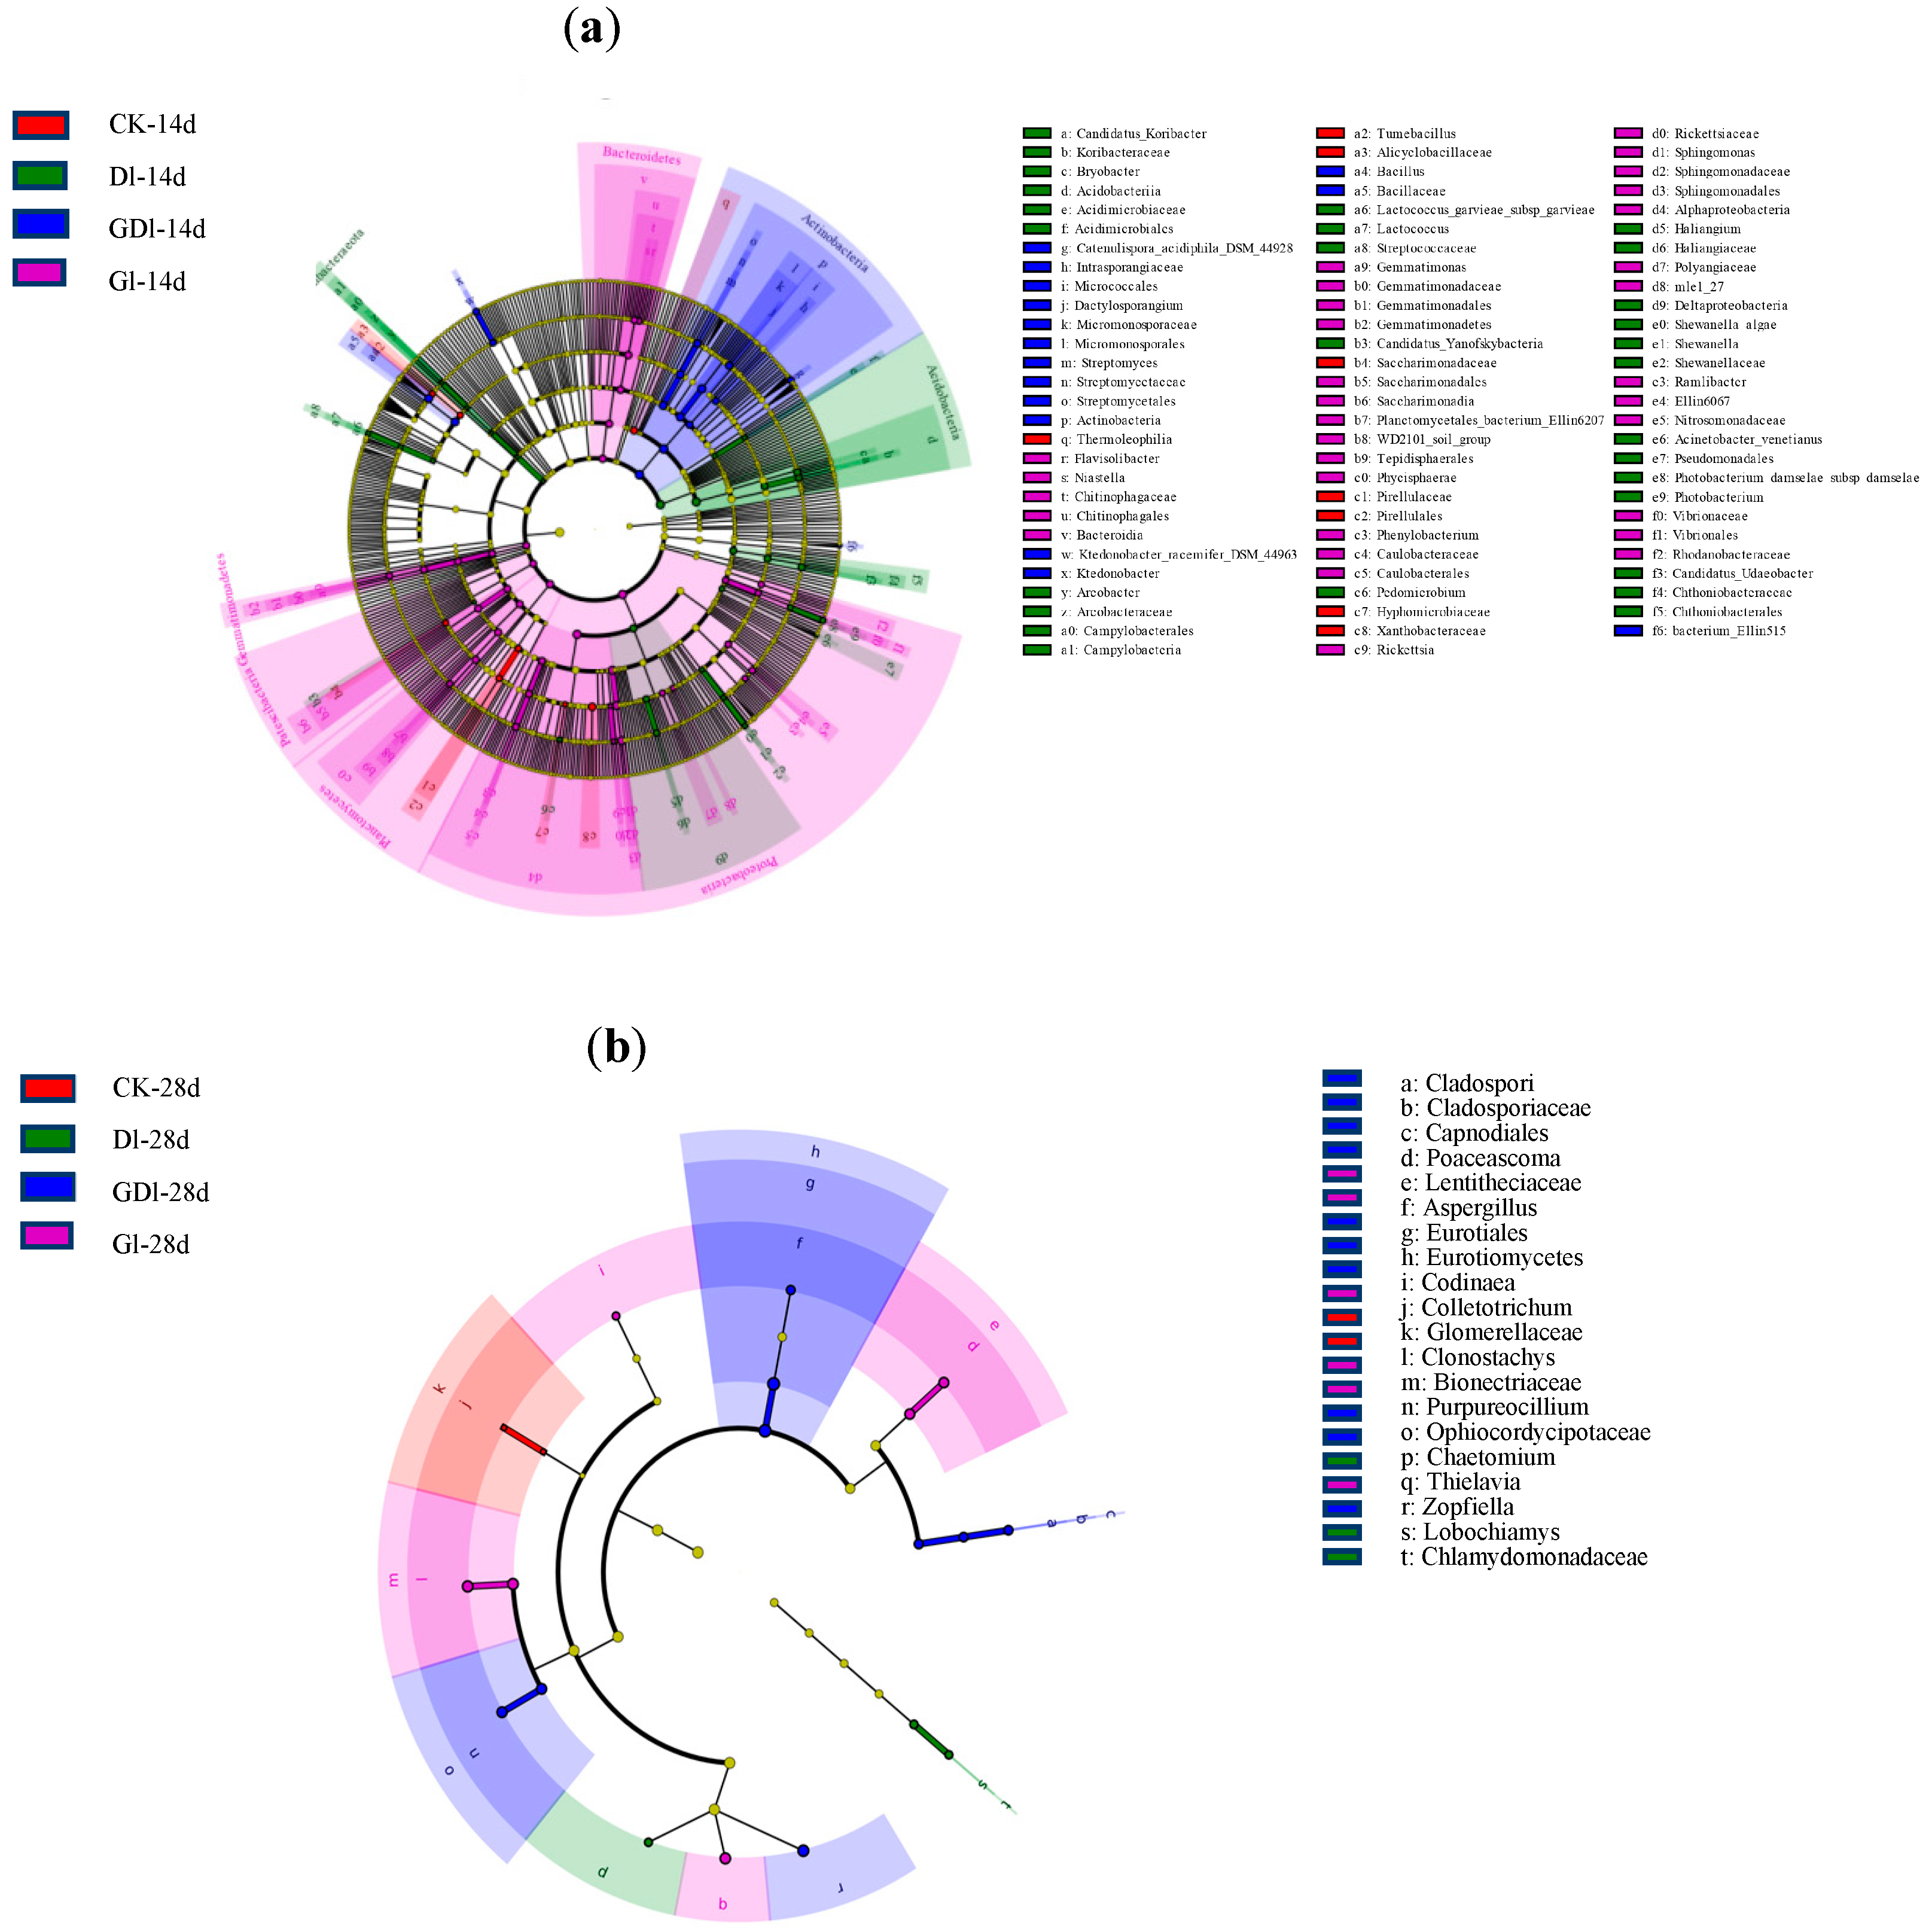
3.1.4. LEfSe Analysis of the Bacterial Community

Linear discriminant analysis (LDA ≥ 2) of the bacterial community is shown in Figure 4a and Figure S2a–h. It can be observed that at the phylum level, Cyanobacteria were the significantly different biomarker taxa between GP treatment and other herbicide treatments on day 1 (p ≤ 0.038). On the 14th day, the significantly different biomarker taxa between GP treatment and other herbicide treatments became Bacteroides (p ≤ 0.040) instead of Cyanobacteria. It is important to note that Chloroflexi is sensitive to various herbicides treatments on day 14. Meanwhile, at the genus level, Streptomyces showed a significant difference between mixed herbicide treatments and other herbicides treatments on day 14 (p ≤ 0.034). However, on day 28, the significantly different biomarker taxa between GP treatment and other herbicide treatments became Rickettsia (p ≤ 0.013) rather than Streptomyces. In particular, Streptomyces was sensitive to mixed herbicide responses on day 14, while Rickettsia was sensitive to GP responses on days 14 and 28. From the above analysis, it can be concluded that the relative abundance of Cyanobacteria, Bacteroides, and Rickettsia is suppressed after adding DQ to the GP. In particular, compared to a single herbicide, mixed herbicides significantly increased the abundance of Streptomyces (p < 0.05).

3.2. Effects of Combined Exposure of GP and DQ on the Composition and Diversity of the Soil Fungal Community

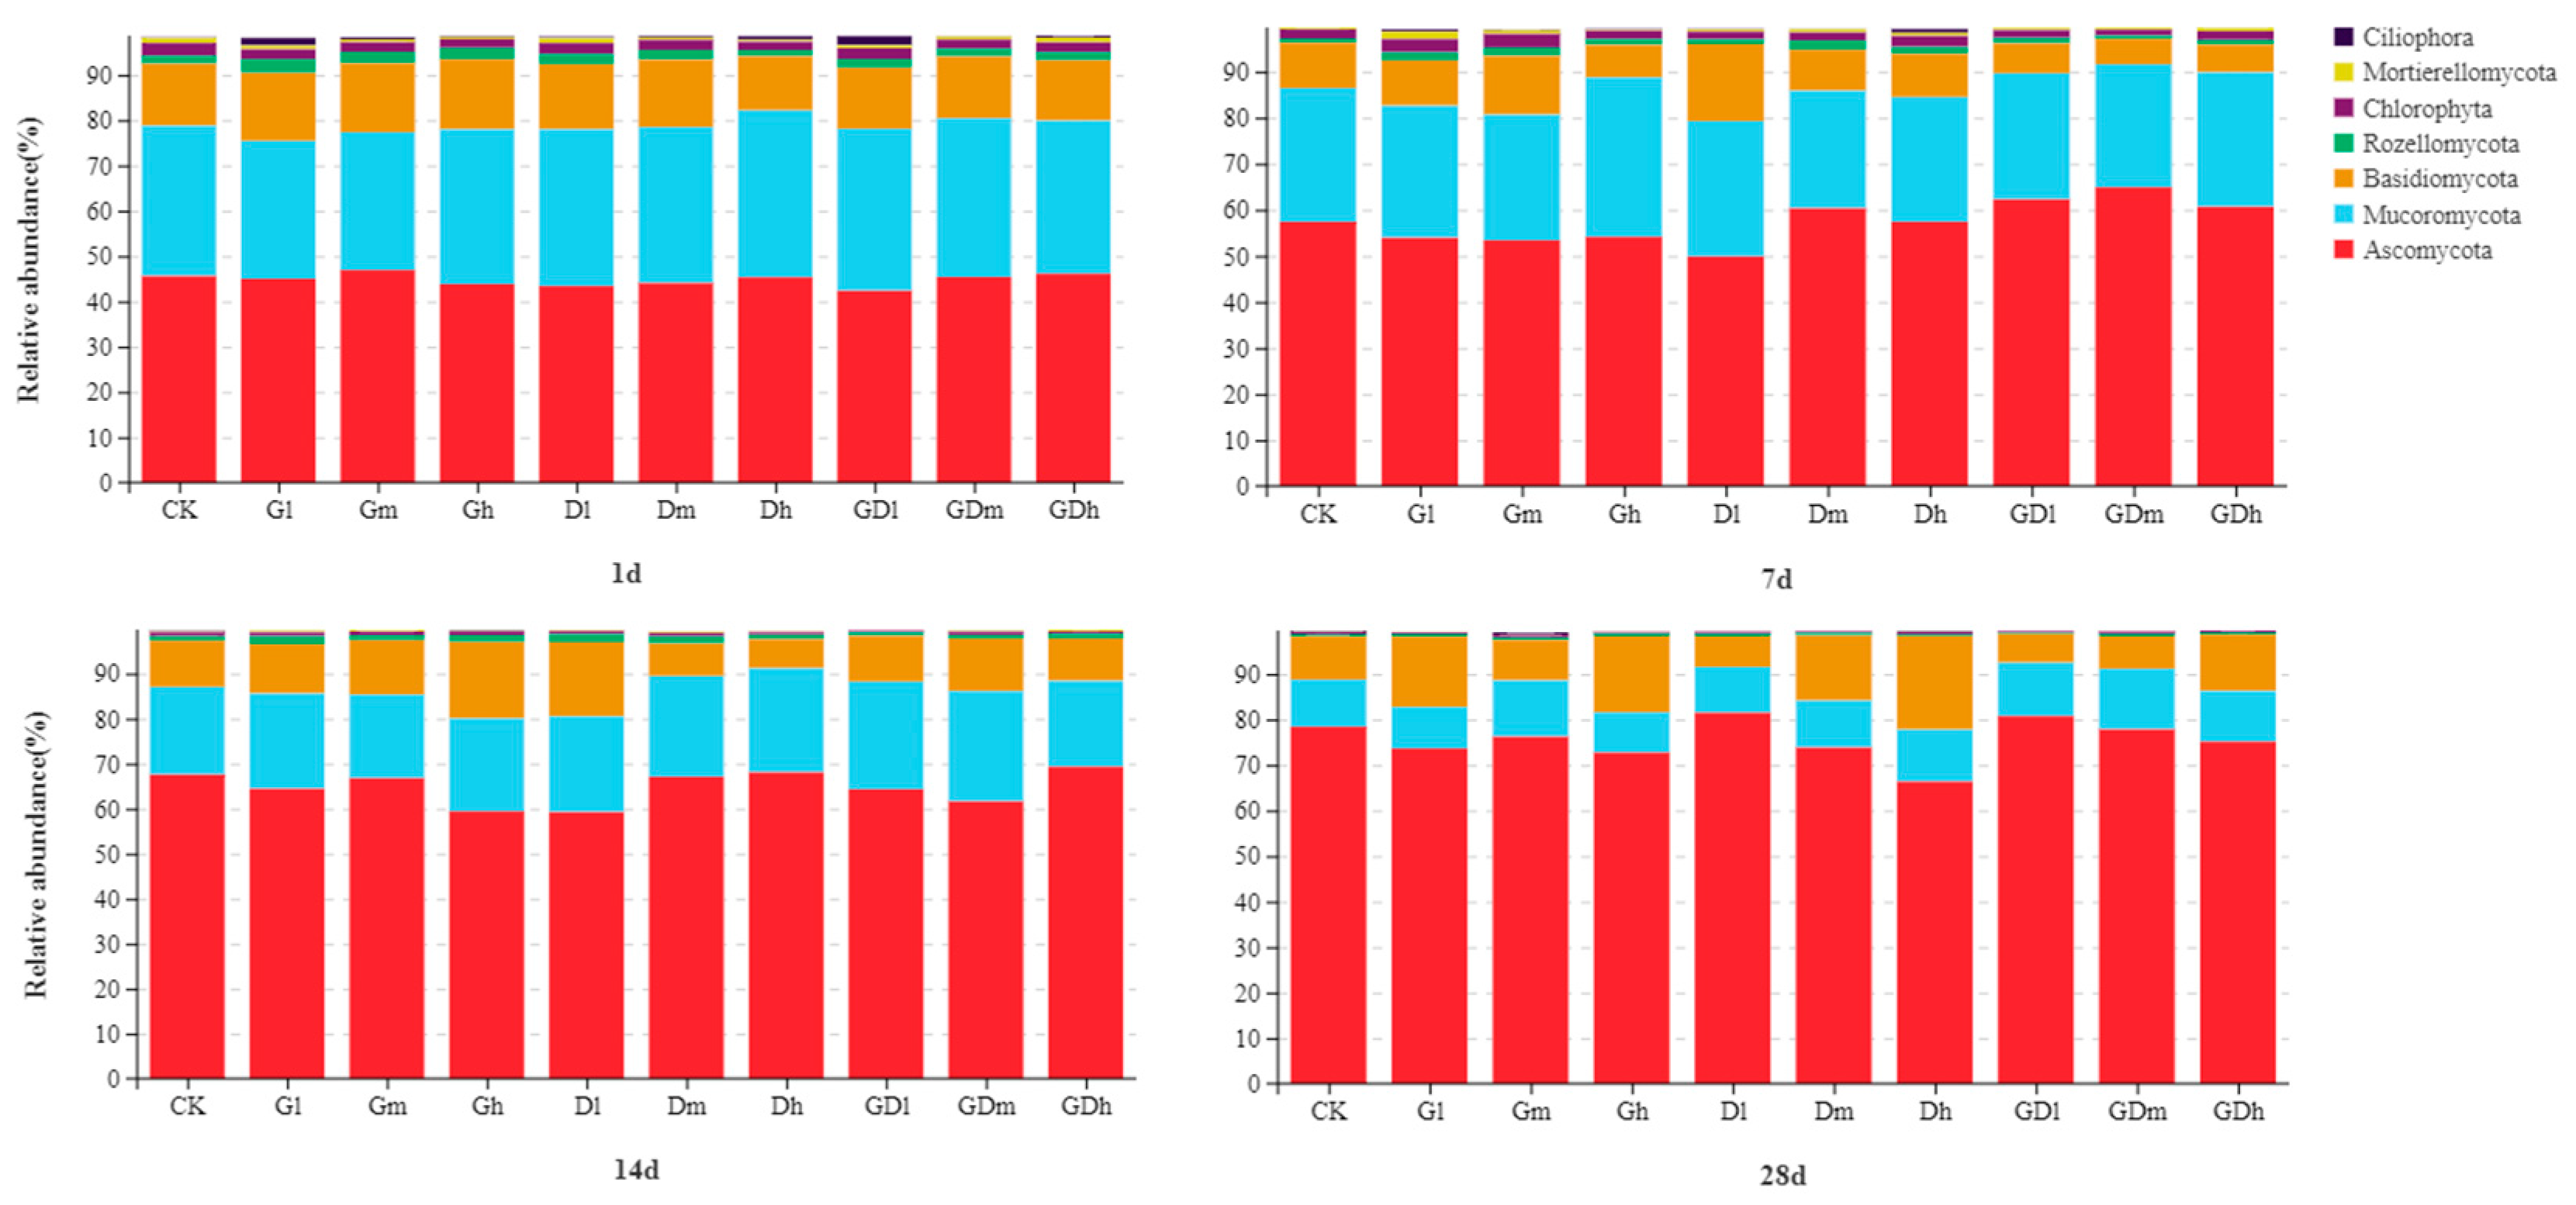
3.2.1. Fungal Community Composition

The stacking chart of the species distribution of fungi at the phylum level is shown in Figure 5. Notably, at the phylum level, the low concentration of mixed herbicides inhibited the abundance of Basidomycota but promoted the abundance of Ascomycota on the 7th and 28th day compared with a single herbicide. Specifically, on day 7, a low concentration of mixed herbicide reduced the abundance of Basidomycota by 3.3%, while increased the Ascomycota abundance by 4.86%; in addition, the abundance of Basidomycota decreased by 3.21% and that of Ascomycota increased by 2.33% on day 14. Taken together, the results showed that Basidomycota and Ascomycota were sensitive to exposure to mixed herbicides at certain exposure times, especially on days 7 and 14.
Figure 2e–h shows a stacked distribution of fungi at the genus level. In general, it was observed that GP inhibited the abundance of Talaromyces at low and middle concentrations on the 7th and 28th day; nevertheless the same concentrations of DQ promoted the abundance of Talaromyces at the same time. Notably, the addition of GP enhanced the effect of DQ on the abundance of Talaromyces. Specifically, a low concentration of mixed herbicides increased the abundance of Talaromyces by 1.16% and 1.43%, respectively, on the 7th and 28th day; while the medium concentration of mixed herbicides increased the abundance of Talaromyces by 4.91% and 2.95%, respectively, on the 7th and 28th day. However, on the 7th and 14th day, the mixed herbicides promoted the abundance of Curvularia, although the single herbicide inhibited the abundance of Curvularia. Specifically, the low concentration of mixed herbicides increased the abundance of Curvularia by 2.60% on the 7th and 14th day; the medium concentration of mixed herbicides increased the abundance of Curvularia by 5.85% and 0.86% on the 7th and 14th day, respectively; while the medium concentration of mixed herbicides increased the abundance of Curvularia by 0.30% and 0.97% on the 7th and 14th day, respectively. Particularly, on the 7th, 14th and 28th days, the mixed herbicides inhibited the abundance of Conlarium significantly compared with single herbicides at low and medium concentrations, and the inhibitory effect became more significant over time. Specifically, the low concentration of mixed herbicides, respectively, reduced the abundance of Conlarium by 0.42%, 1.32% and 5.01% on the 7th, 14th and 28th day, while the medium concentration of mixed herbicides reduced the abundance of Conlarium by 1.26%, 1.60% and 2.97% on the 7th, 14th and 28th day, respectively. The results showed that, compared with single herbicides, the mixed herbicides promoted the abundance of Talaromyces and Curvularia at low and medium concentrations, but inhibited the abundance of Conlarium.

3.2.2. Alpha Diversity of Fungal Community

The fungal richness and diversity data are presented in Table 3. It is observed that the diversity of fungal communities increased with time, but the richness decreased over time. On the first day, the fungal diversity of low and medium concentration GP treatments was significantly higher than that of mixed herbicide treatments at the same concentration (p < 0.05). Particularly, on the 14th day, low concentrations of single herbicides had little impact on fungal diversity, while low concentrations of mixed herbicides significantly inhibited fungal diversity (p < 0.05). The high concentration of mixed herbicides has little impact on fungal diversity; nevertheless, at the same concentration, the fungal diversity of GP treatment is significantly lower than that of the control treatment (p < 0.05), while the fungal diversity of DQ treatment is significantly higher than that of control treatment (p < 0.05). It is noteworthy that on day 28, high concentrations of mixed herbicides significantly inhibited fungal diversity (p < 0.05), while single herbicides at the same concentration had no significant impact on fungal diversity. It can be observed that compared to the single herbicides, mixed herbicides inhibit the diversity of fungal communities in soil, but have no significant impacts on the richness of fungal.

3.2.3. Beta Diversity of the Fungal Community

The principal coordinate analysis based on the Bray–Curtis distance for the fungal communities at the genus level is shown in Figure 6a–d. It can be observed that the differences in fungal community structure among different treatments increase over time (R2 ≥ 0.847, p = 0.001). It is worth noting that under low and high concentrations, the difference in community structure between the control treatment and the mixed herbicide treatment is smaller than the difference between the single herbicide treatment and the control (R2 ≥ 0.534, p = 0.001). From the above analysis, it can be concluded that the impact of mixed herbicides on the structure of soil fungal communities is less than that of single herbicides.

3.2.4. LEfSe Analysis of the Fungal Community

Linear discriminant analysis (LDA ≥ 2) of the fungi is shown in Figure 4b and Figure S3. In particular, at the phylum level, Ascomycota was extremely sensitive to the response of each herbicide treatment on day 28. It is worth noting that at the genus level, Thielavia had a sensitive response to GP on day 28, which was a significantly different species between GP treatment and other herbicides treatments. It can be concluded that GP significantly promoted the abundance of Thielavia, while there was no definite significant difference in species from mixed herbicide treatments when compared with the single herbicide treatments.

4. Discussion

Pesticide use has a harmful impact on soil biological activity, such as microbial abundance, diversity, and activities, all of which influence nutrient transformation and therefore, the health and quality of the soil [61]. This study found that the effect of combined pollution of GP and DQ on bacterial community structure at low concentrations was less than that of single herbicides. However, that was no difference at medium and high concentrations between mixed herbicides and single herbicides. In addition, the effect of mixed herbicides on the fungal community structure was less than that of single herbicide treatment. Most studies showed that herbicides have little or no short-term effect on the microbial community structure [29,30,31]. Previous studies have revealed that the continuous application of GP allows soil microorganisms to adapt to GP and that GP can select microbial populations capable of using it as a nutrient source, and the microbial community in the soil with long-term application of GP revealed a higher diversity index than that without the application of GP [62]. Studies on corn and soybean roots showed no effect of GP on the relative abundance of microbial organisms [63]. There is also literature that the microbial communities were negatively affected by GP [64] and the activity of total microbial community was also affected by GP [65]. In contrast, the ester-linked fatty acid methyl ester extraction (EL-FAME) analysis of agricultural soil exposed to repetitive application of GP displayed no significant changes in the structure of the soil microbial community [66]. In this study, the short-term effect of combined pollution of GP and DQ on microbial community structure was less than that of a single herbicide. Further research will be needed on the long-term effects of combined pollution of GP and DQ on soil microbial community structure.
The present study found that, compared with a single herbicide, the combined pollution of GP and DQ has a certain promoting effect on Actinobacteria and a certain inhibiting effect on Proteobacteria at the phylum level. Microbiological tests and cell metabolic response studies by Mara Grube et al. [66] showed that molasses can be used as a substrate to promote the growth of Actinobacteria in the presence of elevated concentrations of Gly; Actinobacteria was therefore considered resistant to elevated concentrations of Gly in the growth environment and exhibited the potential for Gly degradation [62]. This may account for the increased abundance of Actinobacteria. It is well known that Actinobacteria and Proteobacteria are common bacteria taxa in soil [67], which may be sensitive to herbicide contamination; these taxa can have a variety of effects on soil and vegetation health, including beneficial and pathogenic effects [68,69]. At the genus level, the single herbicide decreased the relative abundance of Streptomyces. However, the combined pollution of GP and DQ has a certain promoting effect on Streptomyces. It was found that the combination of GP and Cu could reduce the toxicity of heavy metals to photoluminescent bacteria [46]; it may be that DQ and Cu combine with GP in a similar way to reduce the stress of some bacteria. Although GP promoted the abundance of Sphingomonas, the addition of GP enhanced the inhibitory effect of DQ on the abundance of Sphingomonas. In addition, single herbicides promoted or had no effect on the abundance of Phenylobacterium, while mixed herbicides had an inhibitory effect on the abundance of Phenylobacterium. Some researchers have suggested that the combined use of GP and Cd may aggravate the effects on E. coli [44]; perhaps, Phenylobacterium is as sensitive as E. coli to the stress of GP combined contamination. For fungi, although GP inhibited the abundance of Talaromyces at low and medium concentrations, the addition of GP enhanced the promotion of DQ on the abundance of Talaromyces. The single herbicide inhibited the abundance of Curvularia, while the mixed herbicides promoted the abundance of Curvularia. In addition, the abundance of Conlarium was significantly inhibited by mixed herbicides compared with single herbicides. Some studies have shown that fungal diversity and abundance respond strongly to high concentrations of GP, and herbicide combined pollution may make the stress response of different fungi more obvious.
The effects of combined pollution of GP and DQ on bacterial community richness and diversity were not significantly different from those of single herbicides. It was found that a single herbicide had a transient promoting or inhibiting effect on bacterial population abundance and community diversity in soil. Previous studies had also found that GP has an adverse effect on the interactions of manganese redox bacteria, Pseudomonas fluorescens, acetogenic rhizosphere bacteria and Fusarium in the rhizosphere soil of soybean, resulting in an increase in the number of Fusarium species, while the abundance of Pseudomonas fluorescens, manganese redox bacteria and acetogenic rhizosphere bacteria decreased [38]. However, the combined application of the two herbicides did not affect the richness and diversity of soil bacteria. This may be because some bacteria produce free radical scavenging molecules when they coexist with GP, and eliminate the free radicals produced by DQ, which makes the stress response of bacteria to GP and DQ reduced or unchanged [70]. Compared with single herbicides, mixed herbicides had no significant effect on the richness of soil fungal communities, but could inhibit the diversity of the fungal community. Some scholars had shown that GP can stimulate the soil fungal biomass in the early and short-term, and it has an adverse effect on both fungal community diversity and species richness after long-term application of GP [71]. In fact, the impact of GP on soil microbial communities and microbiota are highly variable and dependent upon specific experimental parameters such as the dose of GP applied, the time of incubation, and soil characteristics. In addition, the soil pH appears to regulate the balance between GP-induced toxicity and GP-induced microbial growth, with a lower pH favoring stimulation over suppression. In addition, there is a sensitivity spectrum in microbial population, such that less resilient species are inhibited by increasing GP concentrations, whilst a resistant degrader population compensates at higher concentrations [26]. Thus, mixed herbicides aggravated the adverse effects on soil fungal community diversity, but owing to the short period of this study, the effects of various herbicides on fungal population abundance were not significant.
Along with the persistence, concentration, toxicity, and bioavailability of the sprayed pesticide, a variety of environmental factors influence the toxic impact of pesticides on microbial diversity [72,73]. Here, we focused on the relative abundances and diversity of soil microbial community diversity only considering the concentration of herbicides. Future studies should focus on the effects of combined pollution of GP and DQ in different soil environments considering the microbial community composition and diversity

5. Conclusions

This study examined the effects of the combined exposure of GP and DQ on the structure and diversity of microbial communities in lateritic paddy soil at the relative field application doses. Actinobacteria and Proteobacteria were the most sensitive microbial phyla with the application of mixed herbicides, which increased the abundance of Actinobacteria but significantly inhibited that of Proteobacteria, especially at low and medium concentrations. Compared with single herbicides, the mixed herbicide (GP + DQ) had no significant impacts on the richness and diversity of bacterial and fungal communities in the lateritic paddy soil. In general, the combined application of GP and DQ had no more adverse effects on soil microorganisms. Therefore, these two herbicides can be used reasonably in actual agricultural production.

Supplementary Materials

The following supporting information can be downloaded at: https://www.mdpi.com/article/10.3390/su15118497/s1, Figure S1: Principal coordinate analysis for the bacterial communities at the phylum level; Figure S2: Cladograms of line discriminant analysis effect size (LEfSe) analyses of bacteria; Figure S3: Cladograms of line discriminant analysis effect size (LEfSe) analyses of fungus; Table S1: Primer information. References [74,75,76,77,78,79,80,81] are cited in the supplementary materials.

Author Contributions

Conceptualization, methodology, writing—original draft preparation, X.H.; investigation, funding acquisition, C.W.; writing—review and editing, funding acquisition, H.T.; writing—review and editing, funding acquisition, X.D.; resources, Y.L. All authors have read and agreed to the published version of the manuscript.

Funding

This research was funded by the National Natural Science Foundation of China, grant number “42177402”, the Natural Science Foundation of Hainan Province, grant number “420QN316” and the Hainan Province Science and Technology Special Fund of China “ZDYF2021XDNY137”.

Informed Consent Statement

Not applicable.

Data Availability Statement

Not applicable.

Conflicts of Interest

The authors declare no conflict of interest.

References

  1. Grube, A.; Donaldson, D.; Kiely, T.; Wu, L. Pesticides Industry Sales and Usage; US EPA: Washington, DC, USA, 2011. [Google Scholar]
  2. FAO. Pesticide Use Data; FAO: Rome, Italy, 2018. [Google Scholar]
  3. Benbrook, C.M. Trends in glyphosate herbicide use in the United States and globally. Environ. Sci. Eur. 2016, 28, 3. [Google Scholar] [CrossRef] [PubMed]
  4. Duke, S.O. The history and current status of glyphosate. Pest Manag. Sci. 2018, 74, 1027–1034. [Google Scholar] [CrossRef] [PubMed]
  5. Sørensen, M.T.; Poulsen, H.D.; Katholm, C.L.; Højberg, O. Review: Feed residues of glyphosate—Potential consequences for livestock health and productivity. Animal 2021, 15, 100026. [Google Scholar] [CrossRef] [PubMed]
  6. Bhandari, G.; Atreya, K.; Scheepers, P.T.J.; Geissen, V. Concentration and distribution of pesticide residues in soil: Non-dietary human health risk assessment. Chemosphere 2020, 253, 126594. [Google Scholar] [CrossRef] [PubMed]
  7. Horth, H.; Blackmore, K. Survey of glyphosate and AMPA in groundwaters and surface waters in Europe. In WRC Report; WRC: Washington, DC, USA, 2009; p. UC8073,2. [Google Scholar]
  8. Demonte, L.D.; Michlg, N.; Gaggiotti, M. Determination of glyphosate, AMPA and glufosinate in dairy farm water from Argentina using a simplified UHPLC-MS/MS method. Sci. Total Environ. 2018, 645, 34–43. [Google Scholar] [CrossRef]
  9. Geng, Y.; Jiang, L.; Zhang, D. Glyphosate, aminomethyl-phosphonic acid, and glufosinate ammonium in agricultural groundwater and surface water in China from 2017 to 2018: Occurrence, main drivers, and environmental risk assessment. Sci. Total Environ. 2021, 769, 144396. [Google Scholar] [CrossRef]
  10. Aparicio, V.C.; De Gerónimo, E.; Marino, D.; Primost, J.; Carriquiriborde, P.; Costa, J.L. Environmental fate of glyphosate and aminomethylphosphonic acid in surface waters and soil of agricultural basins. Chemosphere 2013, 93, 1866–1873. [Google Scholar] [CrossRef]
  11. Jing, X.; Zhang, W.; Xie, J. Monitoring and risk assessment of pesticide residue in plant soil-groundwater system about medlar planting in Golmud. Environ. Sci. Pollut. Res. Int. 2021, 28, 26413–26426. [Google Scholar] [CrossRef]
  12. Zhang, P.; Rosee, M.; Van Zwieten, L. Direct determination of glyphosate and its metabolite AMPA in soil using mixed-mode solid-phase purification and LC-MS/MS determination on a hypercarb column. J AOAC Int. 2019, 102, 952–965. [Google Scholar] [CrossRef]
  13. Shen, L.Y.; Peng, Z.R.; He, W.H.; Feng, M.J.; Dai, X.L. Assessment of glyphosate residues and ecological risk in P. rosii cultured ponds. J. Shanghai Ocean Univ. 2021, 5, 821–827. [Google Scholar]
  14. Botero-coy, A.M.; Ibáñez, M.; Sancho, J.V.; Hernandez, F. Improvements in the analytical methodology for the residue determination of the herbicide glyphosate in soils by liquid chromatography coupled to mass spectrometry. J. Chromatogr. A 2013, 1292, 132–141. [Google Scholar] [CrossRef] [PubMed]
  15. Primost, J.E.; Marino, D.J.; Aparicio, V.C.; Costa, J.L.; Carriquiriborde, P. Glyphosate and AMPA, “pseudo-persistent” pollutants under real-world agricultural management practices in the mesopotamic pampas agroecosystem, Argentina. Environ. Pollut. 2017, 229, 771–779. [Google Scholar] [CrossRef]
  16. Gunarathna, S.; Gunawardana, B.; Jayaweera, M. Glyphosate and AMPA of agricultural soil, surface water, groundwater and sediments in areas prevalent with chronic kidney disease of unknown etiology, Sri Lanka. J. Environ. Sci. Health B 2018, 53, 729–737. [Google Scholar] [CrossRef] [PubMed]
  17. Karasali, H.; Pavlidis, G.; Marousopoulou, A. Investigation of the presence of glyphosate and its major metabolite AMPA in Greek soils. Environ. Sci. Pollut. Res. 2019, 26, 36308–36321. [Google Scholar] [CrossRef]
  18. Pateiro, M.M.; Arias-Estévez, M.; Simal-Gándara, J. Critical Review on the Environmental Fate of Quaternary Ammonium Herbicides in Soils Devoted to Vineyards. Environ. Sci. Technol. 2013, 47, 4984–4998. [Google Scholar] [CrossRef] [PubMed]
  19. Roede, J.R.; Miller, G.W. Diquat. In Encyclopedia of Toxicology, 3rd ed.; Elsevier: Amsterdam, The Netherlands, 2014; pp. 202–204. [Google Scholar] [CrossRef]
  20. Gimsing, A.L.; Borggaard, O.K.; Bang, M. Influence of soil composition on adsorption of glyphosate and phosphate by contrasting Danish surface soils. Eur. J. Soil Sci. 2004, 55, 183–191. [Google Scholar] [CrossRef]
  21. Mamy, L.; Barriuso, E. Glyphosate adsorption in soils compared to herbicides replaced with the introduction of glyphosate resistant crops. Chemosphere 2005, 61, 844–855. [Google Scholar] [CrossRef]
  22. Silva, V.; Mol, H.G.J.; Zomer, P.; Tienstra, M.; Ritsema, C.J.; Geissen, V. Pesticide residues in European agricultural soils—A hidden reality unfolded. Sci. Total Environ. 2018, 653, 1532–1545. [Google Scholar] [CrossRef]
  23. Van Der Heijden, M.G.; Bardgett, R.D.; Van Straalen, N.M. The unseen majority: Soil microbes as drivers of plant diversity and productivity in terrestrial ecosystems. Ecol. Lett. 2008, 11, 296–310. [Google Scholar] [CrossRef]
  24. Wagg, C.; Bender, S.F.; Widmer, F.; van der Heijden, M.G. Soil biodiversity and soil community composition determine ecosystem multifunctionality. Proc. Natl. Acad. Sci. USA 2014, 111, 5266–5270. [Google Scholar] [CrossRef]
  25. Duke, S.O.; Lydon, J.; Koskinen, W.C.; Moorman, T.B.; Chaney, R.L.; Hammerschmidt, R. Glyphosate effects on plant mineral nutrition, crop rhizosphere microbiota, and plant disease in glyphosate-resistant crops. J. Agric. Food Chem. 2012, 60, 10375–10397. [Google Scholar] [CrossRef] [PubMed]
  26. Nguyen, D.B.; Rose, M.T.; Rose, T.J.; Morris, S.G.; Zwieten, L.V. Impact of glyphosate on soil microbial biomass and respiration: A meta-analysis. Soil Biol. Biochem. 2016, 92, 50–57. [Google Scholar] [CrossRef]
  27. Padilla, J.T.; Selim, H.M. Environmental behavior of Glyphosate in soils. Adv. Agron. 2020, 159, 1–34. [Google Scholar]
  28. Van Bruggen, A.H.C.; Finckh, M.R.; He, M.; Ritsema, C.J.; Harkes, P.; Knuth, D.; Geissen, V. Indirect effects of the herbicide glyphosate on plant, animal and human health through its effects on microbial communities. Front. Environ. Sci. 2021, 9, 763917. [Google Scholar] [CrossRef]
  29. Weaver, M.A.; Krutz, L.J.; Zablotowicz, R.M.; Reddy, K.N. Effects of glyphosate on soil microbial communities and its mineralization in a Mississippi soil. Pest Manag. Sci. 2007, 63, 388–393. [Google Scholar] [CrossRef] [PubMed]
  30. Kepler, R.M.; Schmidt, D.J.E.; Yarwood, S.A.; Cavigelli, M.A.; Reddy, K.N.; Duke, S.O.; Bradley, C.A.; Williams, M.M., Jr.; Buyer, J.S.; Maul, J.E. Soil v to the herbicide glyphosate. Appl. Environ. Microbiol. 2020, 86, e01744-19. [Google Scholar]
  31. Lupwayi, N.Z.; Fernandez, M.R.; Kanashiro, D.A.; Petri, R.M. Profiles of wheat rhizobacterial communities in response to repeated glyphosate applications, crop rotation, and tillage. Can. J. Soil Sci. 2021, 101, 157–167. [Google Scholar] [CrossRef]
  32. Accinelli, C.; Koskinen, W.C.; Seebinger, J.D.; Vicari, A.; Sadowsky, M.J. Effects of incorporated corn residues on Glyphosate mineralization and sorption in soil. J. Agric. Food Chem. 2005, 53, 4110–4117. [Google Scholar] [CrossRef]
  33. Gomez, E.; Ferreras, L.; Lovotti, L.; Fernández, E. Impact of Glyphosate application on microbial biomass and metabolic activity in a Vertic Argiudoll from Argentina. Eur. J. Soil Biol. 2009, 45, 163–167. [Google Scholar] [CrossRef]
  34. Accinelli, C.; Koskinen, W.C.; Becker, J.M.; Sadowsky, M.J. Environmental fate of two sulfonamide antimicrobial agents in soil. J. Agric. Food Chem. 2007, 55, 2677–2682. [Google Scholar] [CrossRef]
  35. Lancaster, S.H.; Hollister, E.B.; Senseman, S.A.; Gentry, T.J. Effects of repeated glyphosate applications on soil microbial community composition and the mineralization of glyphosate. Pest Manag. Sci. 2010, 66, 59–64. [Google Scholar] [CrossRef] [PubMed]
  36. Wilkes, T.I.; Warner, D.J.; Davies, K.G.; Edmonds-Brown, V. Tillage, glyphosate and beneficial arbuscular mycorrhizal fungi: Optimising crop management for plantfungal symbiosis. Agric. For. 2020, 10, 520. [Google Scholar] [CrossRef]
  37. Ch’avez-Ortiz, P.; Tapia-Torres, Y.; Larsen, J.; García-Oliva, F. Glyphosate-based herbicides alter soil carbon and phosphorus dynamics and microbial activity. Appl. Soil Ecol. 2022, 169, 104256. [Google Scholar] [CrossRef]
  38. Zobiole, L.; Kremer, R.; Oliveira, R.; Constantin, J. Glyphosate affects microorganisms in rhizospheres of glyphosate-resistant soybeans. J. Appl. Microbiol. 2011, 110, 118–127. [Google Scholar] [CrossRef]
  39. Carles, L.; Artigas, J. Interaction between glyphosate and dissolved phosphorus on bacterial and eukaryotic communities from river biofilms. Sci. Total Environ. 2020, 719, 137463. [Google Scholar] [CrossRef] [PubMed]
  40. Newman, M.M.; Hoilett, N.; Lorenz, N.; Dick, R.P.; Liles, M.R.; Ramsier, C.; Kloepper, J.W. Glyphosate effects on soil rhizosphere-associated bacterial communities. Sci. Total Environ. 2016, 543, 155–160. [Google Scholar] [CrossRef]
  41. Allegrini, M.; Gomez, E.; Zabaloy, M.C. Repeated glyphosate exposure induces shifts in nitrifying communities and metabolism of phenylpropanoids. Soil Biol. Biochem. 2017, 105, 206–215. [Google Scholar] [CrossRef]
  42. Druille, M.; Omacini, M.; Golluscio, R.A.; Cabello, M.N. Arbuscular mycorrhizal fungi are directly and indirectly affected by glyphosate application. Appl. Soil Ecol. 2013, 72, 143–149. [Google Scholar] [CrossRef]
  43. Soares, C.; Fernandes, B.; Paiva, C.; Nogueira, V.; Cachada, A.; Fidalgo, F.; Pereira, R. Ecotoxicological relevance of glyphosate and flazasulfuron to soil habitat and retention functions—Single vs combined exposures. J. Hazard. Mater. 2023, 442, 130128. [Google Scholar] [CrossRef]
  44. Zhu, C.H. The Toxic Effects of Glyphosate and Cadmium on E. coli. Master’s Thesis, Hunan University of Science and Technology, Xiangtan, China, 16 December 2019. [Google Scholar]
  45. Deng, M.C. Response of Lead, Cadmium and Glyphosate to Pollution Stress and HSPs in C. elegans. Master’s Thesis, Northeast Normal University, Changchun, China, 16 January 2015. [Google Scholar]
  46. Zhou, C.F. Ecological Toxicicology of Heavy Metals and Glyphosate. Ph.D. Thesis, Nanjing Forestry University, Nanjing, China, 16 February 2014. [Google Scholar]
  47. Han, B.; Gao, M.; Wang, Z.F.; Luo, Y.J.; Wang, L.; Tian, M. Microbial ecological effects of soil contaminated with Zn, Pb and glyphosate. J. Southwest Univ. (Nat. Sci. Ed.) 2010, 32, 83–87. [Google Scholar]
  48. Wang, Y.B.; Li, R.Q.; Deng, M.C.; Li, Z.H.; Xu, J.B. Combined toxicity of arsenic with the pesticide glyphosate, and dichlorvos against C. elegans. J. Ecol. Toxicol. 2013, 8, 262–267. [Google Scholar]
  49. Chen, J.J.; Rao, C.Y.; Yuan, R.J.; Sun, D.D.; Guo, S.Q.; Li, L.L.; Yang, S.; Qian, D.D.; Lu, R.H.; Cao, X.L. Long-term exposure to polyethylene microplastics and glyphosate interferes with the behavior, intestinal microbial homeostasis, and metabolites of the common carp (Cyprinus carpio L.). Sci. Total Environ. 2022, 814, 152681. [Google Scholar] [CrossRef] [PubMed]
  50. Millet, M. A method to assess glyphosate, glufosinate and aminomethylphosphonic acid in soil and earthworms. J. Chromatogr. A 2021, 1651, 462339. [Google Scholar]
  51. Pizzutti, I.R.; Vela, G.M.E.; De Kok, A.; Scholten, J.M.; Dias, J.V.; Cardoso, C.D.; Vivian, R. Determination of paraquat and diquat: LC-MS method optimization and validation. Food Chem. 2016, 209, 248–255. [Google Scholar] [CrossRef]
  52. USDA. Soil survey manual. In Soil Survey Division Staff; Soil Conservation Service Volume Handbook 18; U.S. Department of Agriculture: Washington, DC, USA, 2017; Chapter 3. [Google Scholar]
  53. China Pesticide Information Network. Available online: http://www.chinapesticide.org.cn/ (accessed on 28 March 2023).
  54. Wang, Q. Naive Bayesian classifier for rapid assignment of rRNAsequences into the new bacterial taxonomy. Appl. Environ. Microbiol. 2007, 73, 5261–5267. [Google Scholar] [CrossRef]
  55. Pruesse, E. SILVA: A comprehensive online resource for quality checked andaligned ribosomal RNA sequence data compatible with ARB. Nucleic Acids Res. 2007, 35, 7188–7196. [Google Scholar] [CrossRef]
  56. Nilsson, R.H.; Larsson, K.H.; TaylorAF, S. The UNITE database for molecular identification of fungi: Handling dark taxa and parallel taxonomic classifications. Nucleic Acids Res. 2018, 47, D259–D264. [Google Scholar] [CrossRef]
  57. Ankenbrand, M.J.; Keller, A.; Wolf, M. ITS2 database V: Twice as much. Mol. Biol. Evol. 2015, 32, 3030–3032. [Google Scholar] [CrossRef]
  58. Caporaso, J.G.; Kuczynski, J.; Stombaugh, J.; Bittinger, K.; Bushman, F.D.; Costello, E.K.; Fierer, N.; Peña, A.G.; Goodrich, J.K.; Gordon, J.I.; et al. QIIME allows analysis of high-throughput community sequencing data. Nat. Methods 2010, 7, 335–336. [Google Scholar] [CrossRef]
  59. Oksanen, J.; Blanchet, F.G.; Kindt, R. Vegan: Community ecology package. R Proj. Stat. Comput. 2010, 23, 2010. Available online: http://cran.r-project.org (accessed on 21 April 2023).
  60. Wołejko, E.; Jabłonska-Trypuc, A.; Wydro, U.; Butarewicz, A.; Łozowicka, B. Soil biological activity as an indicator of soil pollution with pesticides—A review. Appl. Soil Ecol. 2020, 147, 103356. [Google Scholar] [CrossRef]
  61. Widenfalk, A.; Bertilsson, S.; Sundh, I.; Goedkoop, W. Effects of pesticides on community composition and activity of sediment microbes–responses at various levels of microbial community organization. Environ. Pollut. 2008, 152, 576–584. [Google Scholar] [CrossRef] [PubMed]
  62. Pizarro, H.; Vera, M.S.; Vinocur, A.; P’erez, G.; Ferraro, M.; Helman, R.M.; Dos Santos Afonso, M. Glyphosate input modifies microbial community structure in clear and turbid freshwater systems. Environ. Sci. Pollut. Res. 2016, 23, 5143–5153. [Google Scholar] [CrossRef] [PubMed]
  63. Lane, M.; Lorenz, N.; Saxena, J.; Ramsier, C.; Dick, R.P. The effect of glyphosate on soil microbial activity, microbial community structure, and soil potassium. Pedobiologia 2012, 55, 335–342. [Google Scholar] [CrossRef]
  64. Grube, M.; Kalnenieks, U.; Muter, O. Metabolic response of bacteria to elevated concentrations of glyphosate-based herbicide. Ecotoxicol. Environ. Saf. 2019, 173, 373–380. [Google Scholar] [CrossRef]
  65. Berendsen, R.L.; Pieterse, C.M.; Bakker, P.A. The rhizosphere microbiome and plant health. Trends Plant Sci. 2012, 17, 478–486. [Google Scholar] [CrossRef]
  66. Lee, S.H.; Ka, J.O.; Cho, J.C. Members of the phylum Acidobacteria are dominant and metabolically active in rhizosphere soil. FEMS Microbiol. Lett. 2008, 285, 263–269. [Google Scholar] [CrossRef]
  67. Philippot, L.; Raaijmakers, J.M.; Lemanceau, P.; van der Putten, W.H. Going back to the roots: The microbial ecology of the rhizosphere. Nat. Rev. Microbiol. 2013, 11, 789–799. [Google Scholar] [CrossRef]
  68. Liu, Y.B.; Long, M.X.; Yin, Y.J.; Si, M.R.; Zhang, L.; Lu, Z.Q.; Shen, X.H. Physiological roles of mycothiol in detoxification and tolerance to multiple poisonous chemicals in Corynebacterium glutamicum. Arch. Microbiol. 2013, 195, 419–429. [Google Scholar] [CrossRef]
  69. Vázquez, M.B.; Moreno, M.V.; Amodeo, M.R.; Bianchinotti, M.V. Effects of Glyphosate on soil fungal communities: A field study. Rev. Argent. De Microbiol. 2021, 53, 349–358. [Google Scholar] [CrossRef]
  70. Romdhane, S.; Devers-Lamrani, M.; Beguet, J.; Bertrand, C.; Calvayrac, C.; Salvia, M.V.; Jrad, A.B.; Dayan, F.E.; Spor, A.; Barthelmebs, L.; et al. Assessment of the ecotoxicological impact of natural and synthetic β-triketone herbicides on the diversity and activity of the soil bacterial community using omic approaches. Sci. Total Environ. 2019, 651, 241–249. [Google Scholar] [CrossRef] [PubMed]
  71. Prashar, P.; Shah, S. Impact of fertilizers and pesticides on soil microflora in agriculture. In Sustainable Agriculture Reviews; Springer: Cham, Switzerland, 2016; pp. 331–361. [Google Scholar]
  72. Singer, E.; Bushnell, B.; Coleman-Derr, D.; Bowman, B.; Bowers, R.M.; Levy, A.; Gies, E.A.; Cheng, J.F.; Copeland, A.; Klenk, H.P.; et al. High-resolution phylogenetic microbial community profiling. ISME J. 2016, 10, 2020–2032. [Google Scholar] [CrossRef] [PubMed]
  73. Parada, A.E.; Needham, D.M.; Fuhrman, J.A. Every base matters: Assessing small subunit rRNA primers for marine microbiomes with mock communities, time series and global field samples. Environ. Microbiol. 2016, 18, 1403–1414. [Google Scholar] [CrossRef] [PubMed]
  74. Apprill, A.; McNally, S.; Parsons, R.; Weber, L. Minor revision to V4 region SSU rRNA 806R gene primer greatly increases detection of SAR11 bacterioplankton. Aquat. Microb. Ecol. 2015, 75, 129–137. [Google Scholar] [CrossRef]
  75. Guo, M.; Wu, F.; Hao, G.; Qi, Q.; Li, R.; Li, N.; Wei, L.M.; Chai, T.J. Bacillus subtilis improves immunity and disease resistance in rabbits. Front. Immunol. 2017, 8, 354. [Google Scholar] [CrossRef]
  76. Fazzini, R.A.B.; Levican, G.; Parada, P. Acidithiobacillus thiooxidans secretome containing a newly described lipoprotein Licanantase enhances chalcopyrite bioleaching rate. Appl. Microbiol. Biot. 2011, 89, 771–780. [Google Scholar] [CrossRef]
  77. Beckers, B.; Op De Beeck, M.; Thijs, S.; Truyens, S.; Weyens, N.; Boerjan, W.; Vangronsveld, J. Performance of 16s rDNA Primer Pairs in the Study of Rhizosphere and Endosphere Bacterial Microbiomes in Metabarcoding Studies. Front. Microbiol. 2016, 7, 650. [Google Scholar] [CrossRef]
  78. Teske, A.; Sørensen, K.B. Uncultured archaea in deep marine subsurface sediments: Have we caught them all? ISME J. 2008, 2, 3. [Google Scholar] [CrossRef]
  79. Cheung, M.K.; Au, C.H.; Chu, K.H.; Kwan, H.S.; Wong, C.K. Composition and genetic diversity of picoeukaryotes in subtropical coastal waters as revealed by 454 pyrosequencing. ISME J. 2010, 4, 1053. [Google Scholar] [CrossRef]
  80. Scibetta, S.; Schena, L.; Abdelfattah, A.; Pangallo, S.; Cacciola, S.O. Selection and experimental evaluation of universal primers to study the fungal microbiome of higher plants. Phytobiomes J. 2018, 2, 225–236. [Google Scholar] [CrossRef]
  81. Toju, H.; Tanabe, A.S.; Yamamoto, S.; Sato, H. High-coverage ITS primers for the DNA-based identification of ascomycetes and basidiomycetes in environmental samples. PLoS ONE 2012, 7, e40863. [Google Scholar] [CrossRef] [PubMed]
Figure 1. The abundance distribution of Actinobacteria (a) and Proteobacteria (b). CK—control, Gl—low concentration of glyphosate, Gm—medium concentration of glyphosate, Gh—high concentration of glyphosate, Dl—low concentration of diquat, Dm—medium concentration of diquat, Dh—high concentration of diquat, GDl—low concentration of mixed herbicides, GDm—medium concentration of mixed herbicides, and GDh—high concentration of mixed herbicides.
Sustainability 15 08497 g001
Figure 2. Community composition of bacteria (ad) and fungi (eh) at the genus level from different exposure time (1, 7, 14 and 28 d).
Sustainability 15 08497 g002
Figure 3. Principal coordinate analysis for the bacterial communities at the phylum level at the 1—day (a) and 14—day (b) exposure.
Sustainability 15 08497 g003
Figure 4. Cladograms of line discriminant analysis effect size (LEfSe) analyses based on microbial community composition in different treats (The line discriminant analysis (LDA) scores above the preset value of 2.0 were considered to be significant. From the center outward, the circles represent the different taxonomic levels of the bacteria and fungi from the phylum to the genus levels. The yellow circles denote the taxa without significant differences among the different soil layers). (a) bacteria, (b) fungi.
Sustainability 15 08497 g004
Figure 5. Community composition of fungi at the phylum level from different exposure times (1, 7, 14 and 28 d).
Sustainability 15 08497 g005
Figure 6. Principal coordinate analysis (ad) for fungus communities at the genus level on 1-, 7-, 14- and 28-day exposure.
Sustainability 15 08497 g006
Table 1. Trial treatment setting. The low concentration (L) was 1 time the recommended dosage, the medium concentration (M) was 10 times the recommended dosage, and the high concentration (H) was 100 times the recommended dosage. The recommended dosages were set as 0.6 and 0.4 mg kg−1 for glyphosate (GP) and diquat (DQ), respectively.
TreatmentConcentration (mg kg−1)
Low (l)Middle (m)High (h)
Blank (CK)0
Glyphosate (G)0.6 (Gl)6 (Gm)60 (Gh)
Diquat (D)0.4 (Dl)4 (Dm)40 (Dh)
Glyphosate + diquat (GD)0.6 + 0.4 (GDl)6 + 4 (GDm)60 + 40 (GDh)
Table 2. Alpha diversity of bacterial communities under different treatments. Different letters indicate significant differences at the p < 0.05 level between different treatments at the same time. Mean values (n = 3) ± S.E.
IndexTreatmentDays after Application
171428
ShannonCK5.918 ± 0.311 ab7.264 ± 0.027 bc7.556 ± 0.023 cd7.315 ± 0.093 abc
Gl6.390 ± 0.071 a7.458 ± 0.009 a7.650 ± 0.017 abc7.254 ± 0.320 bc
Gm6.249 ± 0.063 a7.405 ± 0.032 ab7.736 ± 0.022 a7.497 ± 0.090 ab
Gh6.266 ± 0.161 a7.145 ± 0.051 c7.671 ± 0.018 ab7.453 ± 0.067 abc
Dl6.131 ± 0.140 a7.407 ± 0.033 ab7.583 ± 0.015 bcd7.416 ± 0.027 abc
Dm5.382 ± 0.379 b7.485 ± 0.044 a7.669 ± 0.030 ab7.629 ± 0.006 a
Dh5.770 ± 0.256 ab7.416 ± 0.038 ab7.404 ± 0.011 e7.152 ± 0.014 bc
GDl6.298 ± 0.046 a7.381 ± 0.029 ab7.284 ± 0.078 f7.100 ± 0.034 c
GDm6.409 ± 0.001 a7.414 ± 0.090 ab7.505 ± 0.015 d7.090 ± 0.023 c
GDh6.092 ± 0.104 a7.370 ± 0.106 ab7.499 ± 0.038 de7.238 ± 0.039 bc
Chao1CK2188.649 ± 150.191 bcd2263.584 ± 36.558 ab2369.947 ± 39.031 a2303.254 ± 45.996 ab
Gl2536.324 ± 75.475 ab2377.208 ± 3.108 a2352.648 ± 36.608 a2219.027 ± 135.281 b
Gm2602.062 ± 60.436 a2338.966 ± 56.674 a2386.601 ± 49.563 a2450.166 ± 44.036 aA
Gh2508.073 ± 91.128 abc2184.617 ± 30.267 b2417.438 ± 28.661 a2285.848 ± 30.396 ab
Dl2229.911 ± 153.341 bcd2406.547 ± 28.774 a2334.005 ± 44.040 a2352.122 ± 40.203 ab
Dm1993.626 ± 203.891 d2417.230 ± 8.741 a2351.966 ± 34.642 a2254.606 ± 47.180 b
Dh2154.460 ± 98.706 cd2329.326 ± 48.987 ab2249.354 ± 70.180 a2297.709 ± 26.360 ab
GDl2372.901 ± 44.448 abc2332.078 ± 103.682 ab2305.535 ± 69.564 a2309.014 ± 8.035 ab
GDm2488.896 ± 9.119 abc2363.224 ± 52.350 a2358.002 ± 63.922 a2366.971 ± 23.944 ab
GDh2250.869 ± 64.077 abcd2380.824 ± 14.352 a2332.714 ± 39.074 a2250.471 ± 9.346 b
Table 3. Alpha diversity of fungal communities under different treatments. Different letters indicate significant differences at the p < 0.05 level between different treatments at the same time. Mean values (n = 3) ± S.E.
IndexTreatmentDays after Application
171428
ShannonCK4.780 ± 0.083 abc4.368 ± 0.046 cd4.614 ± 0.015 a4.727 ± 0.044 abc
Gl4.882 ± 0.054 a4.634 ± 0.023 ab4.363 ± 0.029 ab4.783 ± 0.039 ab
Gm4.765 ± 0.011 ab4.635 ± 0.086 bc4.259 ± 0.135 ab4.980 ± 0.057 a
Gh4.544 ± 0.129 d4.231 ± 0.043 d4.388 ± 0.121 ab4.684 ± 0.023 cd
Dl4.686 ± 0.072 bcd4.371 ± 0.020 cd4.259 ± 0.076 ab4.708 ± 0.007 bcd
Dm4.683 ± 0.018 abc4.652 ± 0.044 ab4.516 ± 0.052 ab4.661 ± 0.028 bcd
Dh4.509 ± 0.014 cd4.800 ± 0.053 a4.488 ± 0.043 ab4.598 ± 0.053 cd
GDl4.688 ± 0.033 abc4.405 ± 0.049 cd4.128 ± 0.111 b4.867 ± 0.076 bcd
GDm4.452 ± 0.014 d4.325 ± 0.028 cd4.376 ± 0.097 ab4.821 ± 0.134 abcd
GDh4.763 ± 0.060 abc4.490 ± 0.069 cd4.369 ± 0.010 ab4.547 ± 0.053 d
Chao1CK673.214 ± 21.296 ab543.470 ± 18.721 bc462.809 ± 3.810 b455.377 ± 60.937 a
Gl773.434 ± 39.275 ab579.153 ± 19.726 abc464.205 ± 2.574 b479.181 ± 56.792 a
Gm772.912 ± 28.255 a626.580 ± 29.634 a465.700 ± 4.486 b469.934 ± 53.990 a
Gh717.335 ± 44.500 ab510.983 ± 12.810 c452.857 ± 1.069 b438.914 ± 55.892 a
Dl733.530 ± 38.877 ab546.209 ± 15.359 bc461.212 ± 6.469 b438.962 ± 53.068 a
Dm706.838 ± 26.245 ab595.042 ± 19.484 ab477.764 ± 9.637 b425.494 ± 44.871 a
Dh641.645 ± 17.447 b578.217 ± 19.415 ab468.624 ± 8.868 b437.094 ± 48.999 a
GDl697.382 ± 28.165 ab540.641 ± 15.796 bc452.803 ± 0.858 b455.715 ± 39.099 a
GDm666.482 ± 30.530 b500.521 ± 2.086 bc496.728 ± 3.212 a491.149 ± 35.763 a
GDh679.040 ± 27.961 ab541.952 ± 8.107 abc499.915 ± 16.673 b426.687 ± 6.304 a
Disclaimer/Publisher’s Note: The statements, opinions and data contained in all publications are solely those of the individual author(s) and contributor(s) and not of MDPI and/or the editor(s). MDPI and/or the editor(s) disclaim responsibility for any injury to people or property resulting from any ideas, methods, instructions or products referred to in the content.

