
A New Decision Framework for Hybrid Solar and Wind Power Plant Site Selection Using Linear Regression Modeling Based on GIS-AHP

 ,
,  ,
,  ,
,  and
and 
Abstract
1. Introduction
2. Literature Review
2.1. Overview of Common Method in Site Selection
2.2. The Innovation of This Article
- Since this model does not need to fill in the judgement matrix, it is straightforward to evaluate any site location.
- The scores assigned to each site candidate are based on a global scale.
- This model is robust; for example, the number of candidate locations does not affect the score of any candidate, and therefore the scores gained from this model are comparable.
- The scores gained from the proposed model are meaningful, meaning that they can be used as an indicator to measure the quality of sites’ desirability.
- MCDM-based methods try to identify the best option by comparing the options, while these methods are inefficient in evaluating one site. The proposed method can determine the quality of only one site.
- The difference in the scores of two or more candidate sites can be interpreted. Using the model’s scores, it is possible to determine how much precedence each site has over the other.
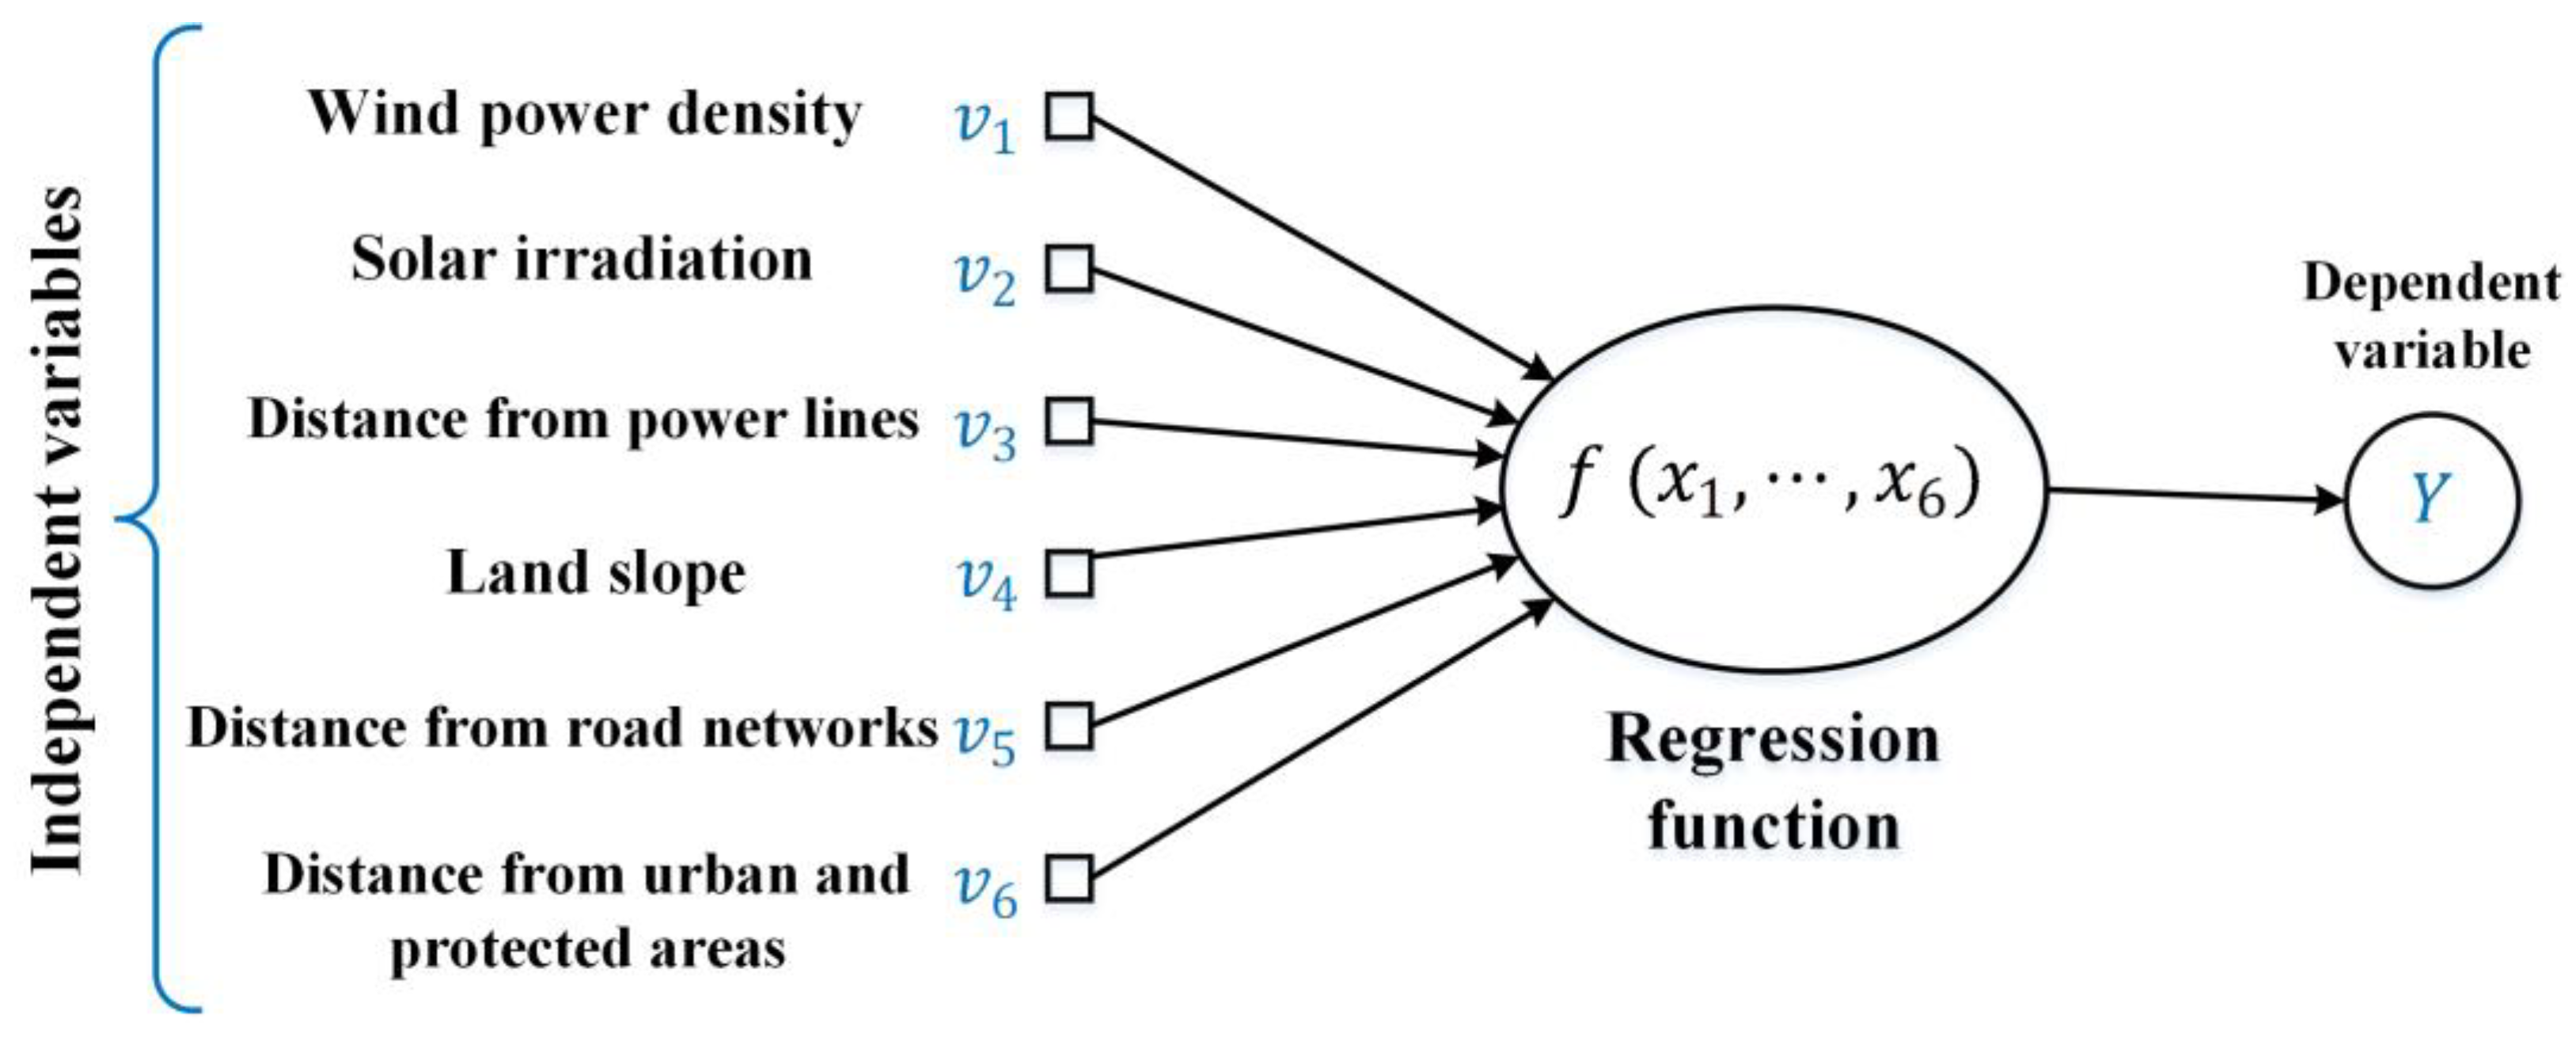
3. Linear Regression
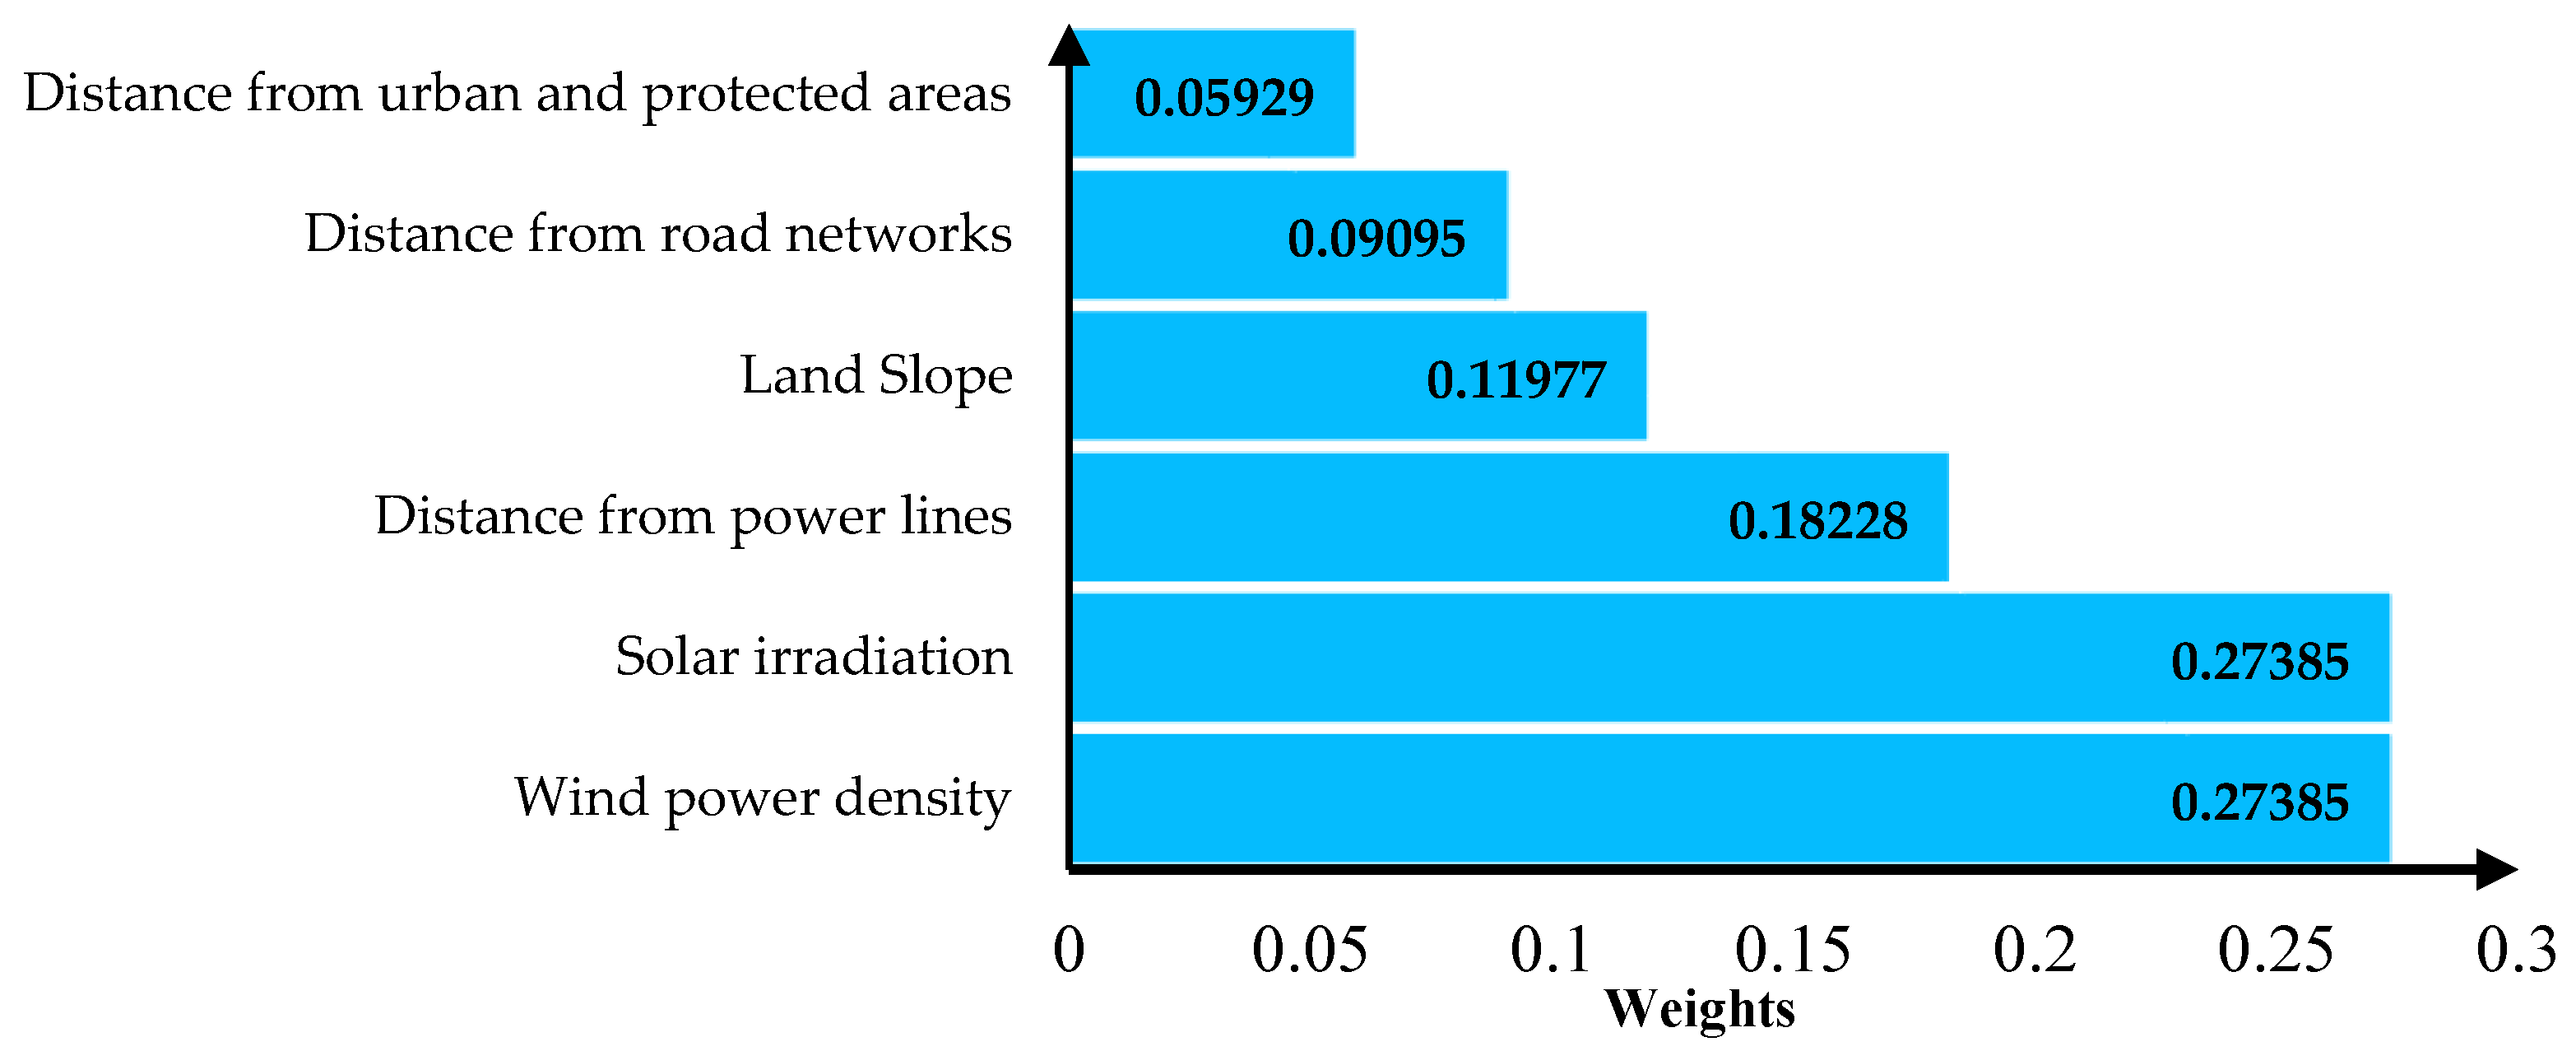
4. Site-Selection Criteria
- Technical: wind-power density (WPD) and solar irradiation.
- Economic: land slope, distance from power lines, and distance from road networks.
- Social/environmental: distance from urban areas and distance from protected areas.
5. Designing the Regression Model
6. Results and Discussion
7. Conclusions
- A total of 3.6% of the study area, with an area of 640 km2, was identified as a suitable location for the construction of wind farms, with 9 km2 considered as an ideal area. These areas scored an average of 0.6 in the proposed model, and were generally located north of the study area with an average wind-power density capacity of 2400 W/m2.
- A total of 3.8% of the study area, with an area of 620 km2, was identified as a suitable location for the construction of solar farms, with 7 km2 considered an ideal area. These areas scored an average of 0.83 in the proposed model, and were generally located southeast of the study area with an average solar irradiation of 1526 kWh/m2.
- Mohammed bin Rashid Al Maktoum’s solar power plant scored 0.92 using the proposed model, which was the highest score compared to other power plants, indicating that this is almost as close to an ideal solar power plant as possible from the model’s perspective.
- Among the wind power plants, Dabancheng wind power plants achieved the highest score of 0.82 among other power plants using the proposed model, and showed that power plants within this score range are of high quality.
Author Contributions
Funding
Institutional Review Board Statement
Informed Consent Statement
Data Availability Statement
Conflicts of Interest
Abbreviations
| Acronyms | |
| MODR | Multi-objective decision rules |
| GIS | Geographic information system |
| AHP | Analytic hierarchy process |
| ANP | Analytic network process |
| ELECTRE | ELimination Et Choix Traduisant la REalité |
| TOPSIS | Technique for Order of Preference by Similarity to Ideal Solution |
| VICORE | Viekriterijumsko kompromisno rangiranje |
| SAW | Simple additive weighting |
| RMSE | Root mean square error |
| D.F. | Degrees of freedom |
| ANOVA | Analysis of variance |
| MCDM | Multi-criteria decision making |
| TSS | Total sum of squares |
| PCA | Principal component analysis |
| RES | Renewable energy sources |
| SSE | Sum of squared errors |
| Nomenclature | |
| Dependent variable | |
| Predicted value | |
| Number of variables | |
| Regression coefficients | |
| Prediction error | |
| Rated speed of wind turbine (m/s) | |
| Independent variables | |
| Wind speed (m/s) | |
| Heigh (m) | |
| Number of observations | |
| WPD coefficient | |
| Subscript | |
| Wind-power density (W/m2) | |
| Solar irradiation (KWh/m2) | |
| Land slope (%) | |
| Distance from power lines (m) | |
| Distance from the road networks (m) | |
| Distance from urban and protected areas (m) |
Appendix A

| v1 | v2 | v3 | v4 | v5 | v6 | |
|---|---|---|---|---|---|---|
| v1 | 1 | 1 | 2 | 3 | 3 | 3 |
| v2 | 1 | 2 | 3 | 3 | 3 | |
| v3 | 1 | 2 | 3 | 3 | ||
| v4 | 1 | 3 | 3 | |||
| v5 | 1 | 3 | ||||
| v6 | 1 |
| j | Input Data | Target | |||||
|---|---|---|---|---|---|---|---|
| WPD 50 M | GHI | D.F.Powerline | Slope | D.F.Roads | D.F.Cities | ||
| 1 | 0 | 0 | 10,500 | 35 | 3500 | 2000 | 0.0000 |
| 2 | 0 | 0 | 10,500 | 35 | 3500 | 3000 | 0.0132 |
| 3 | 0 | 0 | 10,500 | 35 | 3500 | 4000 | 0.0198 |
| 4 | 0 | 0 | 10,500 | 35 | 3500 | 5000 | 0.0264 |
| 5 | 0 | 0 | 10,500 | 35 | 3500 | 6000 | 0.0329 |
| 6 | 0 | 0 | 10,500 | 35 | 3500 | 7000 | 0.0395 |
| 7 | 0 | 0 | 10,500 | 35 | 3500 | 8000 | 0.0461 |
| 8 | 0 | 0 | 10,500 | 35 | 3500 | 9000 | 0.0593 |
| 262,137 | 1000 | 2700 | 0 | 0 | 0 | 2000 | 0.9407 |
| 262,138 | 1000 | 2700 | 0 | 0 | 0 | 3000 | 0.9539 |
| 262,139 | 1000 | 2700 | 0 | 0 | 0 | 4000 | 0.9605 |
| 262,140 | 1000 | 2700 | 0 | 0 | 0 | 5000 | 0.9671 |
| 262,141 | 1000 | 2700 | 0 | 0 | 0 | 6000 | 0.9736 |
| 262,142 | 1000 | 2700 | 0 | 0 | 0 | 7000 | 0.9802 |
| 262,143 | 1000 | 2700 | 0 | 0 | 0 | 8000 | 0.9868 |
| 262,144 | 1000 | 2700 | 0 | 0 | 0 | 9000 | 1.0000 |
| Sample Number | v1 (W/m2) | v2 (kWh/m2) | v3 (m) | v4 (%) | v5 (m) | v6 (m) |
|---|---|---|---|---|---|---|
| 1 | 198.057 | 1169 | 10,500 | 35 | 3500 | 9000 |
| 2 | 198.990 | 9548 | 10,500 | 35 | 3500 | 9000 |
| 3 | 199.048 | 1242 | 10,500 | 35 | 3500 | 9000 |
| 4 | 198.600 | 1581 | 10,500 | 22.53 | 3500 | 9000 |
| ⋮ | ⋮ | ⋮ | ⋮ | ⋮ | ⋮ | ⋮ |
| 121,500 | 187.988 | 1096 | 10,500 | 35 | 3500 | 9000 |
| 121,501 | 187.845 | 995 | 10,500 | 35 | 3500 | 9000 |
| 121,502 | 187.809 | 887 | 10,500 | 35 | 3500 | 9000 |
| ⋮ | ⋮ | ⋮ | ⋮ | ⋮ | ⋮ | ⋮ |
| 234,862 | 358.131 | 915 | 1033 | 35 | 153 | 7176 |
| 234,863 | 356.878 | 900 | 1119 | 35 | 227 | 7229 |
| 234,864 | 290.036 | 995 | 1218 | 35 | 302 | 7280 |
References
- Jamshidi, S.; Pourhossein, K.; Asadi, M. Size Estimation of Wind/Solar Hybrid Renewable Energy Systems without Detailed Wind and Irradiation Data: A Feasibility Study. Energy Convers. Manag. 2021, 234, 113905. [Google Scholar] [CrossRef]
- Asadi, M.; Pourhossein, K. Wind Farm Site Selection Considering Turbulence Intensity. Energy 2021, 236, 121480. [Google Scholar] [CrossRef]
- Kannan, D.; Moazzeni, S.; Darmian, S.M.; Afrasiabi, A. A Hybrid Approach Based on MCDM Methods and Monte Carlo Simulation for Sustainable Evaluation of Potential Solar Sites in East of Iran. J. Clean. Prod. 2021, 279, 122368. [Google Scholar] [CrossRef]
- Abd El Aziz, Y. Renewables 2022 Global Status Report Germany Factsheet. 2022. Available online: https://www.ren21.net/wp-content/uploads/2019/05/GSR2022_Full_Report.pdf (accessed on 4 May 2023).
- Asadi, M.; Pourhossein, K.; Mohammadi-Ivatloo, B. GIS-Assisted Modeling of Wind Farm Site Selection Based on Support Vector Regression. J. Clean. Prod. 2023, 390, 135993. [Google Scholar] [CrossRef]
- Li, Z.; Tian, G.; El-Shafay, A.S. Statistical-Analytical Study on World Development Trend in Offshore Wind Energy Production Capacity Focusing on Great Britain with the Aim of MCDA Based Offshore Wind Farm Siting. J. Clean. Prod. 2022, 363, 132326. [Google Scholar] [CrossRef]
- Famoso, F.; Brusca, S.; D’Urso, D.; Galvagno, A.; Chiacchio, F. A Novel Hybrid Model for the Estimation of Energy Conversion in a Wind Farm Combining Wake Effects and Stochastic Dependability. Appl. Energy 2020, 280, 115967. [Google Scholar] [CrossRef]
- Deveci, M.; Cali, U.; Pamucar, D. Evaluation of Criteria for Site Selection of Solar Photovoltaic (PV) Projects Using Fuzzy Logarithmic Additive Estimation of Weight Coefficients. Energy Rep. 2021, 7, 8805–8824. [Google Scholar] [CrossRef]
- Tahri, M.; Hakdaoui, M.; Maanan, M. The Evaluation of Solar Farm Locations Applying Geographic Information System and Multi-Criteria Decision-Making Methods: Case Study in Southern Morocco. Renew. Sustain. Energy Rev. 2015, 51, 1354–1362. [Google Scholar] [CrossRef]
- Asadi, M.; Pourhossein, K. Neural Network-Based Modelling of Wind/Solar Farm Siting: A Case Study of East-Azerbaijan. Int. J. Sustain. Energy 2021, 40, 616–637. [Google Scholar] [CrossRef]
- Lo, H.W.; Hsu, C.C.; Chen, B.C.; Liou, J.J.H. Building a Grey-Based Multi-Criteria Decision-Making Model for Offshore Wind Farm Site Selection. Sustain. Energy Technol. Assess. 2021, 43, 100935. [Google Scholar] [CrossRef]
- Pennell, W.T.; Barchet, W.R.; Elliott, D.L.; Wendell, L.L.; Hiester, T.R. Meteorological Aspects of Wind Energy: Assessing the Resource and Selecting the Sites. J. Wind Eng. Ind. Aerodyn. 1980, 5, 223–246. [Google Scholar] [CrossRef]
- Calzonetti, F.J.; Eckert, M.S. Finding a Place for Energy: Siting Coal Conversion Facilities; Resource Publications in Geography: Washington, DC, USA, 1981. [Google Scholar]
- Cirillo, R.R.; Wolsko, T.D.; Mueller, R.O.; Dauzvardis, P.A.; Senew, M.J.; Gamauf, K.; Seymour, D.A. Evaluation of Regional Trends in Power Plant Siting and Energy Transport; Argonne National Lab.: Argonne, IL, USA, 1977. [Google Scholar]
- Solomon, B.D.; Haynes, K.E. A Survey and Critique of Multiobjective Power Plant Siting Decision Rules. Socioecon Plan. Sci. 1984, 18, 71–79. [Google Scholar] [CrossRef]
- Bowen, W.M. Subjective Judgements and Data Envelopment Analysis in Site Selection. Comput. Env. Urban Syst 1990, 14, 133–144. [Google Scholar] [CrossRef]
- Church, R.L.; Bell, T.L.; Weaver, J. Multiobjective Power Plant Siting Models: Optimization, Heuristic Approaches and Generating Alternative Configurations. Part I. Chapter I–V. Draft Final Report; Tennessee University: Knoxville, TN, USA, 1983. [Google Scholar]
- Baban, S.M.J.; Parry, T. Developing and Applying a GIS-Assisted Approach to Locating Wind Farms in the UK. Renew. Energy 2001, 24, 59–71. [Google Scholar] [CrossRef]
- Chen, F.; Yang, Q.; Zheng, N.; Wang, Y.; Huang, J.; Xing, L.; Li, J.; Feng, S.; Chen, G.; Kleissl, J. Assessment of Concentrated Solar Power Generation Potential in China Based on Geographic Information System (GIS). Appl. Energy 2022, 315, 119045. [Google Scholar] [CrossRef]
- Gao, J.; Wang, Y.; Huang, N.; Wei, L.; Zhang, Z. Optimal Site Selection Study of Wind-Photovoltaic-Shared Energy Storage Power Stations Based on GIS and Multi-Criteria Decision Making: A Two-Stage Framework. Renew. Energy 2022, 201, 1139–1162. [Google Scholar] [CrossRef]
- Van Haaren, R.; Fthenakis, V. GIS-based wind farm site selection using spatial multi-criteria analysis (SMCA): Evaluating the case for New York State. Renew. Sustain. Energy Rev. 2011, 15, 3332–3340. [Google Scholar] [CrossRef]
- Cheng, C.; Gutierrez, N.P.; Blakers, A.; Stocks, M. GIS-Based Solar and Wind Resource Assessment and Least-Cost 100 % Renewable Electricity Modelling for Bolivia. Energy Sustain. Dev. 2022, 69, 134–149. [Google Scholar] [CrossRef]
- Bennui, A.; Rattanamanee, P.; Puetpaiboon, U.; Phukpattaranont, P.; Chetpattananondh, K. Site Selection for Large Wnd Turbine Using Gis. In Proceedings of the International Conference on Engineering and Environment-ICEE-2007, Coimbra, Portugal, 3–7 September 2007; pp. 90–112. [Google Scholar]
- Wang, C.N.; Dang, T.T.; Nguyen, N.A.T.; Wang, J.W. A Combined Data Envelopment Analysis (DEA) and Grey Based Multiple Criteria Decision Making (G-MCDM) for Solar PV Power Plants Site Selection: A Case Study in Vietnam. Energy Rep. 2022, 8, 1124–1142. [Google Scholar] [CrossRef]
- Loughney, S.; Wang, J.; Bashir, M.; Armin, M.; Yang, Y. Development and Application of a Multiple-Attribute Decision-Analysis Methodology for Site Selection of Floating Offshore Wind Farms on the UK Continental Shelf. Sustain. Energy Technol. Assess. 2021, 47, 101440. [Google Scholar] [CrossRef]
- Ayough, A.; Boshruei, S.; Khorshidvand, B. A New Interactive Method Based on Multi-Criteria Preference Degree Functions for Solar Power Plant Site Selection. Renew. Energy 2022, 195, 1165–1173. [Google Scholar] [CrossRef]
- Abdel-Basset, M.; Gamal, A.; Chakrabortty, R.K.; Ryan, M. A New Hybrid Multi-Criteria Decision-Making Approach for Location Selection of Sustainable Offshore Wind Energy Stations: A Case Study. J. Clean. Prod. 2021, 280, 124462. [Google Scholar] [CrossRef]
- Asadi, M.; Pourhossein, K. Wind and Solar Farms Site Selection Using Geographical Information System (GIS), Based on Multi Criteria Decision Making (MCDM) Methods: A Case-Study for East-Azerbaijan. In Proceedings of the 2019 Iranian Conference on Renewable Energy and Distributed Generation, ICREDG 2019, Tehran, Iran, 11–12 June 2019. [Google Scholar] [CrossRef]
- da Ponte, G.P.; Calili, R.F.; Souza, R.C. Energy Generation in Brazilian Isolated Systems: Challenges and Proposals for Increasing the Share of Renewables Based on a Multicriteria Analysis. Energy Sustain. Dev. 2021, 61, 74–88. [Google Scholar] [CrossRef]
- Genç, M.S.; Karipo˘ glu, F.; Koca, K.; Azgın, ¸S.T. Suitable site selection for offshore wind farms in Turkey’s seas: GIS-MCDM based approach. Earth Sci. Inform. 2022, 14, 1213–1225. [Google Scholar] [CrossRef]
- Janke, J.R. Multicriteria GIS Modeling of Wind and Solar Farms in Colorado. Renew. Energy 2010, 35, 2228–2234. [Google Scholar] [CrossRef]
- Tegou, L.I.; Polatidis, H.; Haralambopoulos, D.A. Environmental Management Framework for Wind Farm Siting: Methodology and Case Study. J. Env. Manag. 2010, 91, 2134–2147. [Google Scholar] [CrossRef]
- Alami Merrouni, A.; Elwali Elalaoui, F.; Ghennioui, A.; Mezrhab, A.; Mezrhab, A. A GIS-AHP Combination for the Sites Assessment of Large-Scale CSP Plants with Dry and Wet Cooling Systems. Case Study: Eastern Morocco. Sol. Energy 2018, 166, 2–12. [Google Scholar] [CrossRef]
- Nagababu, G.; Puppala, H.; Pritam, K.; Kantipudi, M.P. Two-Stage GIS-MCDM Based Algorithm to Identify Plausible Regions at Micro Level to Install Wind Farms: A Case Study of India. Energy 2022, 248, 123594. [Google Scholar] [CrossRef]
- Wu, Y.; He, F.; Zhou, J.; Wu, C.; Liu, F.; Tao, Y.; Xu, C. Optimal Site Selection for Distributed Wind Power Coupled Hydrogen Storage Project Using a Geographical Information System Based Multi-Criteria Decision-Making Approach: A Case in China. J. Clean. Prod. 2021, 299, 126905. [Google Scholar] [CrossRef]
- Seyed Alavi, S.M.; Maleki, A.; Khaleghi, A. Optimal Site Selection for Wind Power Plant Using Multi-Criteria Decision-Making Methods: A Case Study in Eastern Iran. Int. J. Low-Carbon Technol. 2022, 17, 1319–1337. [Google Scholar] [CrossRef]
- Jbaihi, O.; Ouchani, F.Z.; Alami Merrouni, A.; Cherkaoui, M.; Ghennioui, A.; Maaroufi, M. An AHP-GIS Based Site Suitability Analysis for Integrating Large-Scale Hybrid CSP+PV Plants in Morocco: An Approach to Address the Intermittency of Solar Energy. J. Clean. Prod. 2022, 369, 133250. [Google Scholar] [CrossRef]
- Günen, M.A. A Comprehensive Framework Based on GIS-AHP for the Installation of Solar PV Farms in Kahramanmaraş, Turkey. Renew. Energy 2021, 178, 212–225. [Google Scholar] [CrossRef]
- Jun, D.; Tian-Tian, F.; Yi-Sheng, Y.; Yu, M. Macro-Site Selection of Wind/Solar Hybrid Power Station Based on ELECTRE-II. Renew. Sustain. Energy Rev. 2014, 35, 194–204. [Google Scholar] [CrossRef]
- de Araújo Costa, I.P.; de Araújo Costa, A.P.; Sanseverino, A.M.; Gomes, C.F.S.; Dos Santos, M. Bibliometric Studies on Multi-Criteria Decision Analysis (MCDA) Methods Applied in Military Problems. Pesqui. Oper. 2022, 42, 249414. [Google Scholar] [CrossRef]
- Moreira, M.Â.L.; Gomes, C.F.S.; dos Santos, M.; da Silva Júnior, A.C.; de Araújo Costa, I.P. Sensitivity Analysis by the PROMETHEE-GAIA Method: Algorithms Evaluation for COVID-19 Prediction. Procedia Comput. Sci. 2021, 199, 431–438. [Google Scholar] [CrossRef] [PubMed]
- Shaheen, M.; Khan, M.Z. A Method of Data Mining for Selection of Site for Wind Turbines. Renew. Sustain. Energy Rev. 2016, 55, 1225–1233. [Google Scholar] [CrossRef]
- Asadi, M.; Pourhossein, K. Locating Renewable Energy Generators Using K-Nearest Neighbors (KNN) Algorithm. In Proceedings of the 2019 Iranian Conference on Renewable Energy & Distributed Generation (ICREDG), Tehran, Iran, 11–12 June 2019; pp. 1–6. [Google Scholar]
- Asadi, M. Robust Site Selection of Solar/Wind Farms Using Neural Networks and Analytic Hierarchy Process. In Proceedings of the 7th Iran Wind Energy Conference, IWEC 2021, Shahrood, Iran, 17–18 May 2021. [Google Scholar] [CrossRef]
- Asadi, M.; Pourhossein, K. Modeling and Siting of Wind Farms Using Support Vector Regression (SVR). In Proceedings of the 2019 International Aegean Conference on Electrical Machines and Power Electronics, ACEMP 2019 and 2019 International Conference on Optimization of Electrical and Electronic Equipment, OPTIM 2019, Istanbul, Turkey, 27–29 August 2019; pp. 511–516. [Google Scholar] [CrossRef]
- Fan, B. A Hybrid Spatial Data Clustering Method for Site Selection: The Data Driven Approach of GIS Mining. Expert Syst. Appl. 2009, 36, 3923–3936. [Google Scholar] [CrossRef]
- Liu, F.; Wang, X.; Sun, F.; Wang, H. Correct and Remap Solar Radiation and Photovoltaic Power in China Based on Machine Learning Models. Appl. Energy 2022, 312, 118775. [Google Scholar] [CrossRef]
- Yousefi, H.; Motlagh, S.G.; Montazeri, M. Multi-Criteria Decision-Making System for Wind Farm Site-Selection Using Geographic Information System (GIS): Case Study of Semnan Province, Iran. Sustainability 2022, 14, 7640. [Google Scholar] [CrossRef]
- Ayodele, T.R.; Ogunjuyigbe, A.S.O.; Odigie, O.; Munda, J.L. A Multi-Criteria GIS Based Model for Wind Farm Site Selection Using Interval Type-2 Fuzzy Analytic Hierarchy Process: The Case Study of Nigeria. Appl. Energy 2018, 228, 1853–1869. [Google Scholar] [CrossRef]
- Heo, J.; Moon, H.; Chang, S.; Han, S.; Lee, D.E. Case Study of Solar Photovoltaic Power-Plant Site Selection for Infrastructure Planning Using a BIM-GIS-Based Approach. Appl. Sci. 2021, 11, 8785. [Google Scholar] [CrossRef]
- Zahid, F.; Tahir, A.; Khan, H.U.; Naeem, M.A. Wind Farms Selection Using Geospatial Technologies and Energy Generation Capacity in Gwadar. Energy Rep. 2021, 7, 5857–5870. [Google Scholar] [CrossRef]
- Bandira, P.N.A.; Tan, M.L.; Teh, S.Y.; Samat, N.; Shaharudin, S.M.; Mahamud, M.A.; Tangang, F.; Juneng, L.; Chung, J.X.; Samsudin, M.S. Optimal Solar Farm Site Selection in the George Town Conurbation Using GIS-Based Multi-Criteria Decision Making (MCDM) and NASA POWER Data. Atmosphere 2022, 13, 2105. [Google Scholar] [CrossRef]
- Loukogeorgaki, E.; Vagiona, D.G.; Vasileiou, M. Site Selection of Hybrid Offshore Wind and Wave Energy Systems in Greece Incorporating Environmental Impact Assessment. Energies 2018, 11, 2095. [Google Scholar] [CrossRef]
- Tan, Q.; Wei, T.; Peng, W.; Yu, Z.; Wu, C. Comprehensive Evaluation Model of Wind Farm Site Selection Based on Ideal Matter Element and Grey Clustering. J. Clean. Prod. 2020, 272, 122658. [Google Scholar] [CrossRef]
- Li, M.; Xu, Y.; Guo, J.; Li, Y.; Li, W. Application of a GIS-Based Fuzzy Multi-Criteria Evaluation Approach for Wind Farm Site Selection in China. Energies 2020, 13, 2426. [Google Scholar] [CrossRef]
- Sotiropoulou, K.F.; Vavatsikos, A.P. Onshore Wind Farms GIS-Assisted Suitability Analysis Using PROMETHEE II. Energy Policy 2021, 158, 112531. [Google Scholar] [CrossRef]
- Wang, C.N.; Viet, V.T.H.; Ho, T.P.; Nguyen, V.T.; Husain, S.T. Optimal Site Selection for a Solar Power Plant in the Mekong Delta Region of Vietnam. Energies 2020, 13, 4066. [Google Scholar] [CrossRef]
- Wu, Y.; Chu, H.; Dong, H.; Xu, C.; Chen, W.; Wu, G. Optimal Site Selection of Rural Wind–Photovoltaic-Storage Station from a Sustainable Development Perspective. Energy Rep. 2022, 8, 8381–8395. [Google Scholar] [CrossRef]
- Abdelmassih, G.; Al-Numay, M.; Aroudi, A. El Map Optimization Fuzzy Logic Framework in Wind Turbine Site Selection with Application to the USA Wind Farms. Energies 2021, 14, 6127. [Google Scholar] [CrossRef]
- Shorabeh, S.N.; Firozjaei, H.K.; Firozjaei, M.K.; Jelokhani-Niaraki, M.; Homaee, M.; Nematollahi, O. The Site Selection of Wind Energy Power Plant Using GIS-Multi-Criteria Evaluation from Economic Perspectives. Renew. Sustain. Energy Rev. 2022, 168, 112778. [Google Scholar] [CrossRef]
- Shafiee, M. Wind Energy Development Site Selection Using an Integrated Fuzzy ANP-TOPSIS Decision Model. Energies 2022, 15, 4289. [Google Scholar] [CrossRef]
- Mohammadzadeh Bina, S.; Jalilinasrabady, S.; Fujii, H.; Farabi-Asl, H. A Comprehensive Approach for Wind Power Plant Potential Assessment, Application to Northwestern Iran. Energy 2018, 164, 344–358. [Google Scholar] [CrossRef]
- Tafula, J.E.; Justo, C.D.; Moura, P.; Mendes, J.; Soares, A. Multicriteria Decision-Making Approach for Optimum Site Selection for Off-Grid Solar Photovoltaic Microgrids in Mozambique. Energies 2023, 16, 2894. [Google Scholar] [CrossRef]
- Sánchez-Lozano, J.M.; García-Cascales, M.S.; Lamata, M.T. GIS-Based Onshore Wind Farm Site Selection Using Fuzzy Multi-Criteria Decision Making Methods. Evaluating the Case of Southeastern Spain. Appl. Energy 2016, 171, 86–102. [Google Scholar] [CrossRef]
- Vagiona, D.G.; Tzekakis, G.; Loukogeorgaki, E.; Karanikolas, N. Site Selection of Offshore Solar Farm Deployment in the Aegean Sea, Greece. J. Mar. Sci. Eng. 2022, 10, 224. [Google Scholar] [CrossRef]
- Ali, F.; Bennui, A.; Chowdhury, S.; Techato, K. Suitable Site Selection for Solar-Based Green Hydrogen in Southern Thailand Using GIS-MCDM Approach. Sustainability 2022, 14, 6597. [Google Scholar] [CrossRef]
- Huang, X.; Hayashi, K.; Fujii, M. Resources Time Footprint Analysis of Onshore Wind Turbines Combined with GIS-Based Site Selection: A Case Study in Fujian Province, China. Energy Sustain. Dev. 2023, 74, 102–114. [Google Scholar] [CrossRef]
- Aghaloo, K.; Ali, T.; Chiu, Y.R.; Sharifi, A. Optimal Site Selection for the Solar-Wind Hybrid Renewable Energy Systems in Bangladesh Using an Integrated GIS-Based BWM-Fuzzy Logic Method. Energy Convers. Manag. 2023, 283, 116899. [Google Scholar] [CrossRef]
- Rekik, S.; El Alimi, S. Optimal Wind-Solar Site Selection Using a GIS-AHP Based Approach: A Case of Tunisia. Energy Convers. Manag. X 2023, 18, 100355. [Google Scholar] [CrossRef]
- Di Grazia, S.; Tina, G.M. Optimal Site Selection for Floating Photovoltaic Systems Based on Geographic Information Systems (GIS) and Multi-Criteria Decision Analysis (MCDA): A Case Study. Int. J. Sustain. Energy 2023, 1–23. [Google Scholar] [CrossRef]
- Ramezanzade, M.; Saebi, J.; Karimi, H.; Mostafaeipour, A. A New Hybrid Decision-Making Framework to Rank Power Supply Systems for Government Organizations: A Real Case Study. Sustain. Energy Technol. Assess. 2020, 41, 100779. [Google Scholar] [CrossRef]
- Rediske, G.; Burin, H.P.; Rigo, P.D.; Rosa, C.B.; Michels, L.; Siluk, J.C.M. Wind Power Plant Site Selection: A Systematic Review. Renew. Sustain. Energy Rev. 2021, 148, 111293. [Google Scholar] [CrossRef]
- Mentis, D.; Welsch, M.; Fuso Nerini, F.; Broad, O.; Howells, M.; Bazilian, M.; Rogner, H. A GIS-Based Approach for Electrification Planning-A Case Study on Nigeria. Energy Sustain. Dev. 2015, 29, 142–150. [Google Scholar] [CrossRef]
- Asadi, M.; Ramezanzade, M.; Pourhossein, K. A Global Evaluation Model Applied to Wind Power Plant Site Selection. Appl. Energy 2023, 336, 120840. [Google Scholar] [CrossRef]
- Fumo, N.; Rafe Biswas, M.A. Regression Analysis for Prediction of Residential Energy Consumption. Renew. Sustain. Energy Rev. 2015, 47, 332–343. [Google Scholar] [CrossRef]
- Raillani, B.; Mezrhab, A.; Amraqui, S.; Moussaoui, M.A.; Mezrhab, A. Regression-Based Spatial GIS Analysis for an Accurate Assessment of Renewable Energy Potential. Energy Sustain. Dev. 2022, 69, 118–133. [Google Scholar] [CrossRef]
- Gunturu, U.B.; Schlosser, C.A. Characterization of Wind Power Resource in the United States. Atmos. Chem. Phys. 2012, 12, 9687–9702. [Google Scholar] [CrossRef]
- Saxena, B.K.; Rao, K.V.S. Estimation of Wind Power Density at a Wind Farm Site Located in Western Rajasthan Region of India. Procedia Technol. 2016, 24, 492–498. [Google Scholar] [CrossRef]
- Höfer, T.; Sunak, Y.; Siddique, H.; Madlener, R. Wind Farm Siting Using a Spatial Analytic Hierarchy Process Approach: A Case Study of the Städteregion Aachen. Appl. Energy 2016, 163, 222–243. [Google Scholar] [CrossRef]
- Moradi, S.; Yousefi, H.; Noorollahi, Y.; Rosso, D. Multi-Criteria Decision Support System for Wind Farm Site Selection and Sensitivity Analysis: Case Study of Alborz Province, Iran. Energy Strategy Rev. 2020, 29, 100478. [Google Scholar] [CrossRef]
- Canul-Reyes, D.A.; Rodríguez-Hernández, O.; Jarquin-Laguna, A. Potential Zones for Offshore Wind Power Development in the Gulf of Mexico Using Reanalyses Data and Capacity Factor Seasonal Analysis. Energy Sustain. Dev. 2022, 68, 211–219. [Google Scholar] [CrossRef]
- Amer, M.; Daim, T.U. Selection of Renewable Energy Technologies for a Developing County: A Case of Pakistan. Energy Sustain. Dev. 2011, 15, 420–435. [Google Scholar] [CrossRef]
- Saaty, T.L. Decision Making with Dependence and Feedback: The Analytic Network Process; RWS Publisher: London, UK, 1996; Volume 4922. [Google Scholar]
- Myers, R.H.; Montgomery, D.C.; Anderson-Cook, C.M. Response Surface Methodology: Process and Product Optimization Using Designed Experiments; John Wiley & Sons: Hoboken, NJ, USA, 2016; ISBN 1118916034. [Google Scholar]
- Hosseini, S.; Taghizadeh, M.; Eliassi, A. Optimization of Hydrothermal Synthesis of H-ZSM-5 Zeolite for Dehydration of Methanol to Dimethyl Ether Using Full Factorial Design. J. Nat. Gas Chem. 2012, 21, 344–351. [Google Scholar] [CrossRef]


| Study | Case Study | Method | Technical Criteria | Economic Criteria | Environmental Criteria | |||
|---|---|---|---|---|---|---|---|---|
| A1 | A2 | A3 | A4 | A5 | A6 | |||
| Yousefi et al. [48] | Iran | AHP, GIS | ✓ | ✓ | ✓ | ✓ | ✓ | |
| Ayodele et al. [49] | Nigeria | Interval type-2 fuzzy AHP, GIS | ✓ | ✓ | ✓ | ✓ | ||
| Heo et al. [50] | South Korea | BIM, GIS | ✓ | ✓ | ✓ | |||
| Zahid et al. [51] | Pakistan | GIS, SDSS | ✓ | ✓ | ✓ | |||
| Bandira et al. [52] | Malaysia | AHP, GIS | ✓ | ✓ | ✓ | ✓ | ✓ | ✓ |
| Loukogeorgaki et al. [53] | Greece | AHP | ✓ | |||||
| Tan et al. [54] | China | Ideal matter element, grey clustering | ✓ | ✓ | ✓ | |||
| Li et al. [55] | China | FAHP, FVICORE, GIS | ✓ | ✓ | ✓ | ✓ | ||
| Sotiropoulou et al. [56] | Greece | GIS, PROMETHEE II | ✓ | ✓ | ✓ | ✓ | ✓ | |
| Wang et al. [57] | Vietnam | DEA, FANP | ✓ | ✓ | ||||
| Wu et al. [58] | China | TODIM, TOPSIS | ✓ | ✓ | ||||
| Abdelmassih et al. [59] | USA | Fuzzy logic | ✓ | |||||
| Shorabeh et al. [60] | Iran | GIS-OWA | ✓ | ✓ | ✓ | ✓ | ||
| M. Shafiee. [61] | - | AHP, ANP, TOPSIS, GIS | ✓ | ✓ | ✓ | ✓ | ||
| Mohammadzadeh Bina et al. [62] | Iran | GIS, MCDM | ✓ | ✓ | ✓ | ✓ | ✓ | |
| Tafula et al. [63] | Mozambique | GIS, FMCDM | ✓ | ✓ | ✓ | ✓ | ✓ | |
| Sánchez-Lozano et al. [64] | Spain | Fuzzy-TOPSIS | ✓ | ✓ | ✓ | ✓ | ✓ | |
| Vagiona et al. [65] | Greece | AHP, TOPSIS, GIS | ✓ | |||||
| Ali et al. [66] | Thailand | AHP, GIS | ✓ | ✓ | ✓ | ✓ | ||
| Huang et al. [67] | China | GIS, RTF | ✓ | ✓ | ✓ | ✓ | ✓ | ✓ |
| Aghaloo et al. [68] | Bangladesh | GIS, BWM | ✓ | ✓ | ✓ | ✓ | ✓ | |
| Rekik et al. [69] | Tunisia | GIS, AHP | ✓ | ✓ | ✓ | ✓ | ✓ | ✓ |
| Grazia et al. [70] | Italy | AHP, TOPSIS | ✓ | ✓ | ||||
| Ramezanzade et al. [71] | Iran | VIKOR-EDAS-MOORA-ARAS | ✓ | ✓ | ✓ | ✓ | ✓ | ✓ |
| Asadi et al. [43] | East-Azarbaijan | KNN, AHP | ✓ | ✓ | ✓ | ✓ | ✓ | |
| Asadi et al. [28] | East-Azarbaijan | MCDM, GIS | ✓ | ✓ | ✓ | ✓ | ✓ | |
| Asadi et al. [45] | Iran | SVR, AHP | ✓ | ✓ | ✓ | ✓ | ✓ | |
| Asadi. [44] | Iran | MLP, GIS | ✓ | ✓ | ✓ | ✓ | ✓ | |
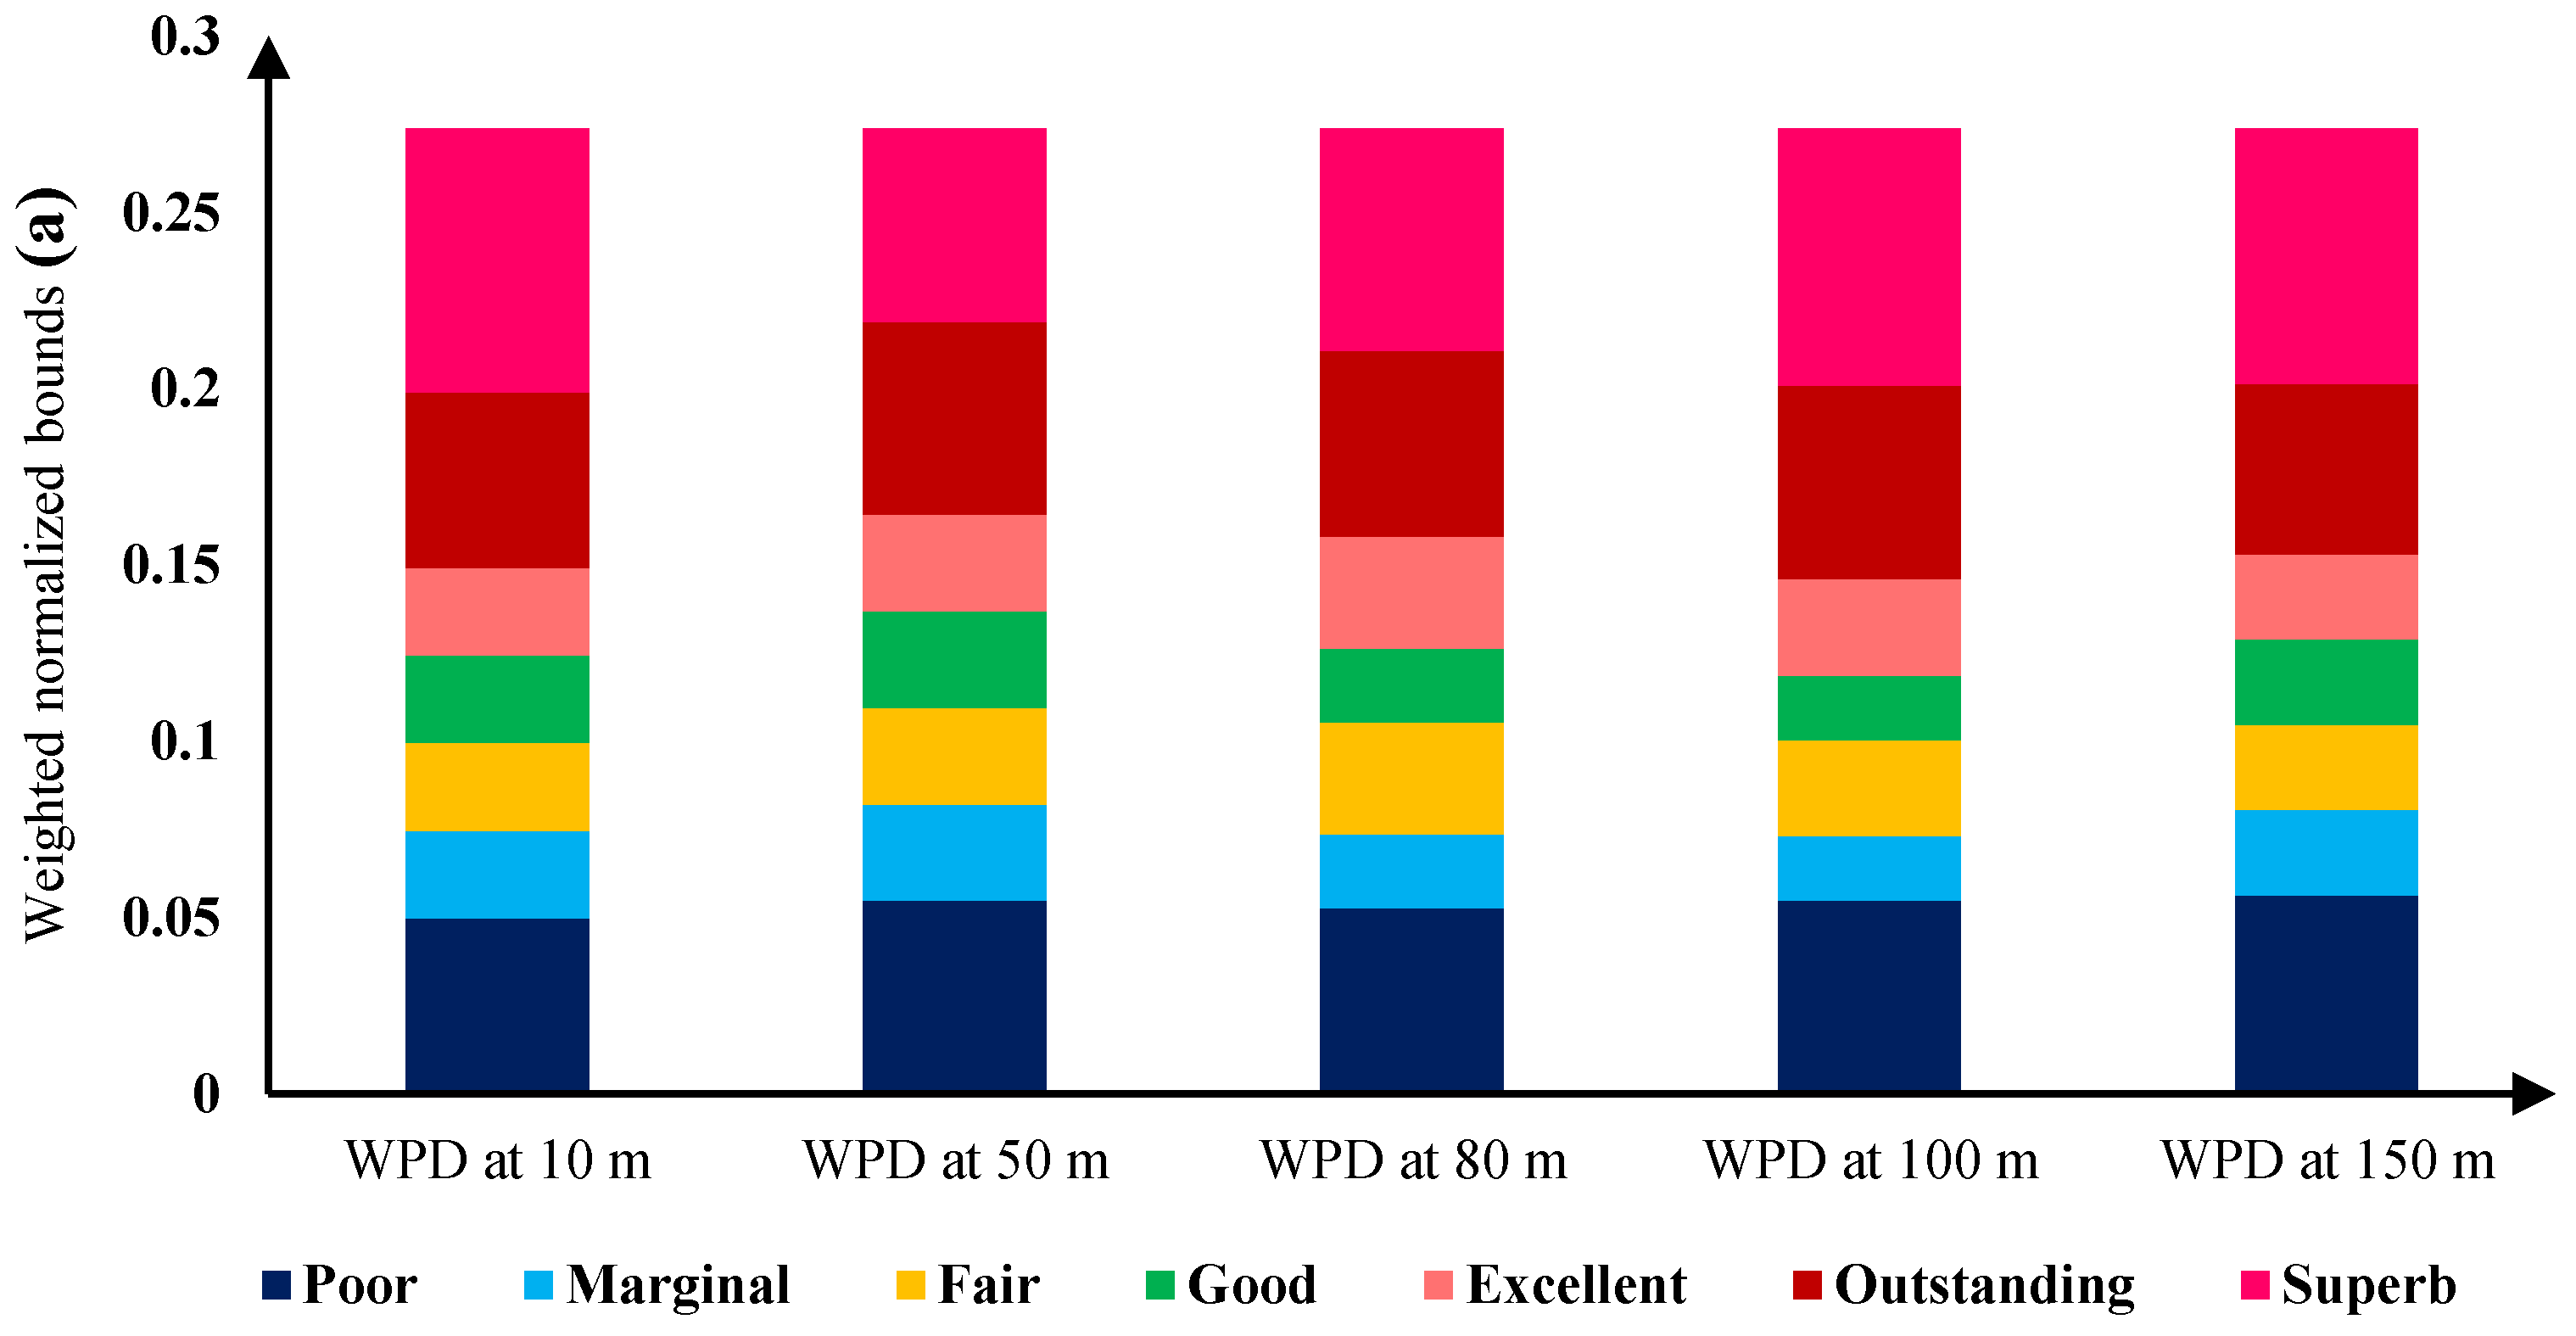
| Class No | Wind Class | WPD (W/m2) at Different Anemometers Height | ||||
|---|---|---|---|---|---|---|
| 10 m | 50 m | 80 m | 100 m | 150 m | ||
| 1 | Poor | 0–100 | 0–200 | 0–250 | 0–300 | 0–350 |
| 2 | Marginal | 100–150 | 200–300 | 250–350 | 300–400 | 350–500 |
| 3 | Fair | 150–200 | 300–400 | 350–500 | 400–550 | 500–650 |
| 4 | Good | 200–250 | 400–500 | 500–600 | 550–650 | 350–800 |
| 5 | Excellent | 250–300 | 500–600 | 600–750 | 650–800 | 800–950 |
| 6 | Outstanding | 300–400 | 600–800 | 750–1000 | 800–1100 | 950–1250 |
| 7 | Superb | 400–1000 | 800–2000 | 1000–2300 | 1100–2500 | 1250–3200 |
| Class No | Wind Class | v2 (kWh/m2) | v3 (m) | v4 (%) | v5 (m) | v6 (m) |
|---|---|---|---|---|---|---|
| 1 | Poor | 0.0–1000 | 10,500–9000 | 35–30 | 3500–3000 | 0–2000 |
| 2 | Marginal | 1000–1200 | 9000–7500 | 30–25 | 3000–2500 | 2000–3000 |
| 3 | Fair | 1200–1500 | 7500–6000 | 25–20 | 2500–2000 | 3000–4000 |
| 4 | Good | 1500–1700 | 6000–4500 | 20–15 | 2000–1500 | 4000–5000 |
| 5 | Excellent | 1700–1900 | 4500–3000 | 15–10 | 1500–1000 | 5000–6000 |
| 6 | Outstanding | 1900–2100 | 3000–1500 | 10–5 | 1000–500 | 6000–7000 |
| 7 | Superb | 2100–2700 | 1500–0 | 5–0 | 500–0 | 7000–9000 |
| Source | DF | Adj SS | Adj MS | p-Value |
|---|---|---|---|---|
| Regression model | 6 | 5003.97 | 834.00 | 0.0 |
| Wind-power density (WPD) | 1 | 1806.19 | 1806.19 | 0.0 |
| Solar irradiation | 1 | 1546.83 | 1546.83 | 0.0 |
| D.F. power lines | 1 | 933.21 | 933.21 | 0.0 |
| Land slope | 1 | 402.90 | 402.90 | 0.0 |
| D.F. road network | 1 | 232.33 | 232.33 | 0.0 |
| D.F. urban and protected areas | 1 | 82.51 | 82.51 | 0.0 |
| Power Plant Type | v1 (W/m2) | v2 (kWh/m2) | v3 (m) | v4 (%) | v5 (m) | v6 (m) | Site Score |
|---|---|---|---|---|---|---|---|
| Wind | 224 | 1389 | 1297 | 1 | 0 | 14,162 | 0.6483 |
| Solar | 63 | 1526 | 30 | 0.5 | 0 | 10,442 | 0.8379 |
| Wind/Solar | 218 | 1455 | 853 | 0 | 500 | 16,128 | 0.6153 |
| Site No | Power Plant Name | Type | Current Capacity (MW) | Country | v1 (W/m2) | v2 (kWh/m2) | v3 (m) | v4 (%) | v5 (m) | v6 (m) |
|---|---|---|---|---|---|---|---|---|---|---|
| 1 | Alta Energy Center | Wind/solar | 1548 | USA | 690 | 2152 | 264 | 6 | 350 | 14,750 |
| 2 | Dabancheng | Wind | 500 | China | 900 | 1457 | 300 | 4 | 250 | 22,890 |
| 3 | Zafarana | Wind | 545 | Egypt | 641 | 2277 | 80 | 1.5 | 500 | 2982 |
| 4 | Muppandal | Wind | 1500 | India | 856 | 2068 | 1000 | 3 | 100 | 100 |
| 5 | Mohammed bin Rashid Al Maktoum | Solar | 613 | UAE | 209 | 2365 | 400 | 0 | 116 | 22,600 |
| 6 | Bradley | Solar | 1515 | India | 228 | 2117 | 200 | 0.8 | 10 | 7861 |
| 7 | Hallett | Wind | 298 | Australia | 700 | 1929 | 331 | 25 | 400 | 18,327 |
| 8 | Gansu Wind Farm | Wind | 7965 | China | 408 | 1718 | 800 | 1 | 500 | 146,408 |
| 9 | Villanueva | Solar | 828 | Mexico | 157 | 2309 | 2100 | 0 | 480 | 11,148 |
| 10 | Copper Mountain | Solar | 552 | USA | 172 | 2054 | 450 | 1 | 639 | 20,998 |
| 11 | Tengger Desert | Solar | 1547 | China | 204 | 1617 | 50 | 2 | 10 | 9942 |
| 12 | Mount Storm | Wind | 284 | USA | 868 | 1514 | 498 | 66 | 410 | 24,471 |
| 13 | Pavagada | Solar | 1400 | India | 247 | 2113 | 400 | 1 | 800 | 100 |
| 14 | Whitelee | Wind | 539 | UK | 670 | 850 | 242 | 6 | 100 | 5147 |
| Site No. | Installed Type of Power Plant | The Recommended Type of Power Plant |
|---|---|---|
| 1 | Wind/Solar | 1-Solar, 2-Wind/solar, 3-wind |
| 2 | Wind | 1-Wind, 2-Solar, 3-Wind/solar |
| 3 | Wind | 1-Solar, 2-Wind/Solar, 3-Wind |
| 4 | Wind | 1-Solar, 2-Wind/Solar, 3-Wind |
| 5 | Solar | Solar |
| 6 | Solar | Solar |
| 7 | Wind | 1-Solar, 2-Wind/Solar, 3-Wind |
| 8 | Wind | 1-Solar, 2-Wind, 3-Wind/Solar |
| 9 | Solar | Solar |
| 10 | Solar | Solar |
| 11 | Solar | Solar |
| 12 | Wind | 1-Wind, 2-Solar, 3-Wind/Solar |
| 13 | Solar | Solar |
| 14 | Wind | 1-Wind, 2-Solar, 3-Wind/Solar |
Disclaimer/Publisher’s Note: The statements, opinions and data contained in all publications are solely those of the individual author(s) and contributor(s) and not of MDPI and/or the editor(s). MDPI and/or the editor(s) disclaim responsibility for any injury to people or property resulting from any ideas, methods, instructions or products referred to in the content. |
© 2023 by the authors. Licensee MDPI, Basel, Switzerland. This article is an open access article distributed under the terms and conditions of the Creative Commons Attribution (CC BY) license (https://creativecommons.org/licenses/by/4.0/).
Share and Cite
Asadi, M.; Pourhossein, K.; Noorollahi, Y.; Marzband, M.; Iglesias, G. A New Decision Framework for Hybrid Solar and Wind Power Plant Site Selection Using Linear Regression Modeling Based on GIS-AHP. Sustainability 2023, 15, 8359. https://doi.org/10.3390/su15108359
Asadi M, Pourhossein K, Noorollahi Y, Marzband M, Iglesias G. A New Decision Framework for Hybrid Solar and Wind Power Plant Site Selection Using Linear Regression Modeling Based on GIS-AHP. Sustainability. 2023; 15(10):8359. https://doi.org/10.3390/su15108359
Chicago/Turabian StyleAsadi, Meysam, Kazem Pourhossein, Younes Noorollahi, Mousa Marzband, and Gregorio Iglesias. 2023. "A New Decision Framework for Hybrid Solar and Wind Power Plant Site Selection Using Linear Regression Modeling Based on GIS-AHP" Sustainability 15, no. 10: 8359. https://doi.org/10.3390/su15108359
APA StyleAsadi, M., Pourhossein, K., Noorollahi, Y., Marzband, M., & Iglesias, G. (2023). A New Decision Framework for Hybrid Solar and Wind Power Plant Site Selection Using Linear Regression Modeling Based on GIS-AHP. Sustainability, 15(10), 8359. https://doi.org/10.3390/su15108359