Article

Energy and Exergy Analyses of a PWR-Type Nuclear Power Plant Coupled with an ME-TVC-MED Desalination System

1
Laboratory of Biomaterials and Transport Phenomena, University of Medea, Medea 26000, Algeria
2
Laboratoire de Génie des Procédés Chimiques, Department of Process Engineering, University of Ferhat Abbas, Setif 19000, Algeria
3
Research Unit on Analysis and Technological Development in Environment (URADTE-CRAPC), BP 384, Bou-Ismail Tipaza 42004, Algeria
4
Ecole Nationale Supérieure de Chimie de Rennes, Centre National de la Recherche Scientifique (CNRS), ISCR-UMR 6226, Université de Rennes, F-35000 Rennes, France
5
School of Engineering, Merz Court, Newcastle University, Newcastle upon Tyne NE1 7RU, UK
6
Laboratory of Management and Valorization of Natural Resources and Quality Assurance, SNVST Faculty, Akli Mohand Oulhadj University, Bouira 10000, Algeria
*
Authors to whom correspondence should be addressed.
Sustainability 2023, 15(10), 8358; https://doi.org/10.3390/su15108358
Submission received: 30 January 2023 / Revised: 18 May 2023 / Accepted: 18 May 2023 / Published: 21 May 2023
(This article belongs to the Special Issue Sustainable Advanced Water Treatment Technologies)

Abstract

:
Electricity–water cogeneration power plants are an important tool for advancing sustainable water treatment technologies because they provide a cost-effective and environmentally friendly solution for meeting the energy and water needs of communities. By integrating power and water production, these technologies can reduce carbon emissions and help mitigate the impact of climate change. This work deals with the energy and exergy analysis of a cogeneration plant for electrical power generation and water desalination using real operational data. The power side is a pressurized water reactor (PWR) nuclear power plant (NPP), while the desalination side is a multi-effect distillation (MED) system with a thermo-vapor compressor (TVC) plant coupled with a conventional multi-effect plant (ME-TVC-MED). A mathematical model was implemented in MATLAB software and validated through a comparison with previously published research. The exergy analysis was carried out based on the second law of thermodynamics to evaluate the irreversibility of the plant and the subsystems. In this study, the components of the sub-systems were analyzed separately to identify and quantify the component that has a high loss of energy and exergy. According to the energy and exergy analyses, the highest source of irreversibility occurs in the reactor core with 50% of the total exergy destruction. However, turbines, steam generators, and condensers also contribute to energy loss. Further, the thermodynamic efficiency of the cogeneration plant was obtained as 35.38%, which is more effective than other systems. In the ME-TVC-MED desalination unit, the main sources of energy losses are located in the evaporators and the thermo-compressor (about 50% and 36%, respectively). Moreover, the exergetic efficiency of the ME-TVC-MED unit was found to be low at 6.43%, indicating a high degree of technical inefficiency in the desalination process. Therefore, many opportunities exist to improve the performance of the cogeneration system.

1. Introduction

Many cogeneration plants for the simultaneous production of electrical and thermal energy for desalination plants still mainly use conventional fuels, such as natural gas and coal. However, the increasing environmental pollution caused by conventional fuels and the ineffectiveness and exhaustion of available fuel reserves has prompted many researchers to explore other sustainable and environmentally friendly sources of energy, such as renewable and nuclear energy. They are the most suitable and reliable candidates for industrial processes, such as desalination. Thus, nuclear energy, which avoids many of the problems associated with fossil fuels, is an efficient and advantageous option for the main desalination plants [1,2].
Among other clean and renewable resources, nuclear desalination is a sustainable source of energy and potable water that could assist in addressing the present issues with access to electricity and potable water. As such, it should be considered in public policy to protect the environment. However, the multiple subsystems of nuclear power plants (NPP) result in some irreversibilities and corresponding energy losses. Therefore, reducing the irreversibilities becomes a crucial duty in order to increase the amount of energy that is available in the plant. Undoubtedly, defining the irreversibility quantities in various components requires significant effort [2,3].
Exergy analysis is an essential diagnostic tool for energy conversion systems since it pinpoints where and how much energy is lost throughout a process. Additionally, the origins of the energy losses will be revealed. The minimum effort of separation is a crucial consideration during the design stage of thermal desalination processes in order to reduce entropy generation, which lowers freshwater costs, pollution, and greenhouse gas emissions. In addition, by reducing the entropy, the system can operate more efficiently, leading to a reduction in the amount of brine discharge into the sea [4,5].
Despite the significance of the electricity–water cogeneration principle, very few studies on the energetic analysis of such systems have been published. Additionally, despite having a high-performance ratio, several desalination technologies have not yet been researched. Kambiz Ansari et al. [6,7] performed an exergetic and exergo-economic analysis supplemented with multi-objective optimization of the coupling of a desalination plant by multi-effect thermal vapor compression distillation (MED-TVC) with a nuclear power plant with a pressurized nuclear reactor (PWR). A genetic algorithm (GA) was used to minimize the cost of system operation (cost of producing electricity and freshwater) and maximize the energy efficiency of the system. The results showed that the costs of thermodynamic inefficiencies (the cost of exergetic destruction) for the optimized system components have been reduced compared to the corresponding cost of exergetic destruction in the base scenario plant. In addition, it has been confirmed that their optimization improved the thermodynamic and economic characteristics of the system.
Khoshgoftar Manesh et al. [8,9] carried out a multi-objective optimization of a PWR nuclear power plant coupled to a multi-flash distillation (MSF) desalination system through GA and mixed-integer non-linear mathematical programming methods. In addition, a computer program has been developed in the MATLAB environment for a thermoeconomic analysis. The results demonstrated that the evolutionary algorithm (NSGA-II) could be systemically and elegantly applied to the PWR-MSF dual-purpose plant.
In addition, Khalid et al. [10] described a comparative evaluation of two nuclear desalination systems. The reverse osmosis (RO) system used for desalination is coupled to a CANDU6 nuclear reactor and a fast reactor cooled with SFR sodium. Exergetic analysis was used to evaluate the cogeneration systems’ performance. The results showed that the exergetic efficiencies of the CANDU-6 and SFR systems are respectively 32.8% and 36.8%. In addition, the exergetic efficiencies of the RO process for the CANDU 6 and SFR systems are 49.2% and 36.3%, respectively. In addition, Khalid et al. [11] presented a parametric study of the coupling of a modular helium gas turbine reactor (GT-MHR) with the RO process performed to reveal the effect of certain parameters on energy efficiency. The analysis showed that the exergy efficiency of cogeneration processes increases by 10.3% if the waste heat from the reactor is used.
Priego et al. [12] presented a study on nuclear desalination using the SMART reactor coupled with two thermal desalination processes, multi-effect (MED) and multi-flash (MSF) distillation. The study was carried out using exergetic and thermo-economic analyses. In either case, the analyses were carried out for gain output ratios (GORs) of 5, 10, and 15. The results indicated that economic competitiveness and the feasibility of nuclear desalination using the main stream line of the reactor. In addition, the greatest quantity of water for every extraction position in the MED and MSF processes as well is produced by the gain ratio of 15.
The number of reported studies concerned with nuclear desalination in the literature is increasing. A comprehensive overview of the most recent studies on the various aspects of nuclear desalination is provided by Al-Othman et al. [13]. The review highlighted the main advantages of this coupled technology and the principal challenges facing its development and extensive industrial use. However, despite the importance of the electricity–water cogeneration principle, until recently, few studies have been published on using exergetic analysis for such systems. In addition, some desalination technologies that exhibit high-performance ratios have not been explored yet. Hence, it is valuable to delve into this field to gain a more comprehensive understanding of current facilities and future undertakings.
In this paper, energy and exergy analysis was conducted on a multi-effect thermal vapor compression plant (ME-TVC-MED) combined with a PWR nuclear power plant based on real operational data for the simultaneous production of electricity and freshwater. A mathematical model of the PWR-ME-TVC-MED cogeneration plant was developed using the most recent and accurate correlations and developed values of the properties of seawater, including chemical exergy, which provide more novel approaches for the design and operation of the plant, leading to improved efficiency, performance, and sustainability. The model takes into account the behavior of the nuclear reactor, the thermo-vapor compression system, and the multi-effect distillation system, as well as their interactions with each other and with the environment. This approach allows for maximum efficiency and energy savings while reducing greenhouse gas emissions and water consumption compared to traditional power plants.

2. Cogeneration Plant Description

In this study, a cogeneration system based on a combined NPP and desalination plant is considered. The overall system is shown in Figure 1 with a schematic process flow shown in Figure 2. The energy side is the Angra (II) nuclear power plant in Brazil, while the water desalination side is based at the Al-Jubail desalination plant (ME-TVC-MED), which is located in the Kingdom of Saudi Arabia (KSA). The proposed NPP is equipped with a pressurized light-water reactor (PWR). A 3855 MW thermal reactor is used to generate the nominal power of 1300 MWe, operating under local climate conditions. The technical data of the PWR power plant are summarized in Appendix A. The Al-Jubail desalination plant’s ME-TVC-MED consists of two Multi-Effect Distillation (MED) units equipped with thermo-vapor compressors (TVCs) integrated with a conventional MED unit to form a single entity.
Referring to 
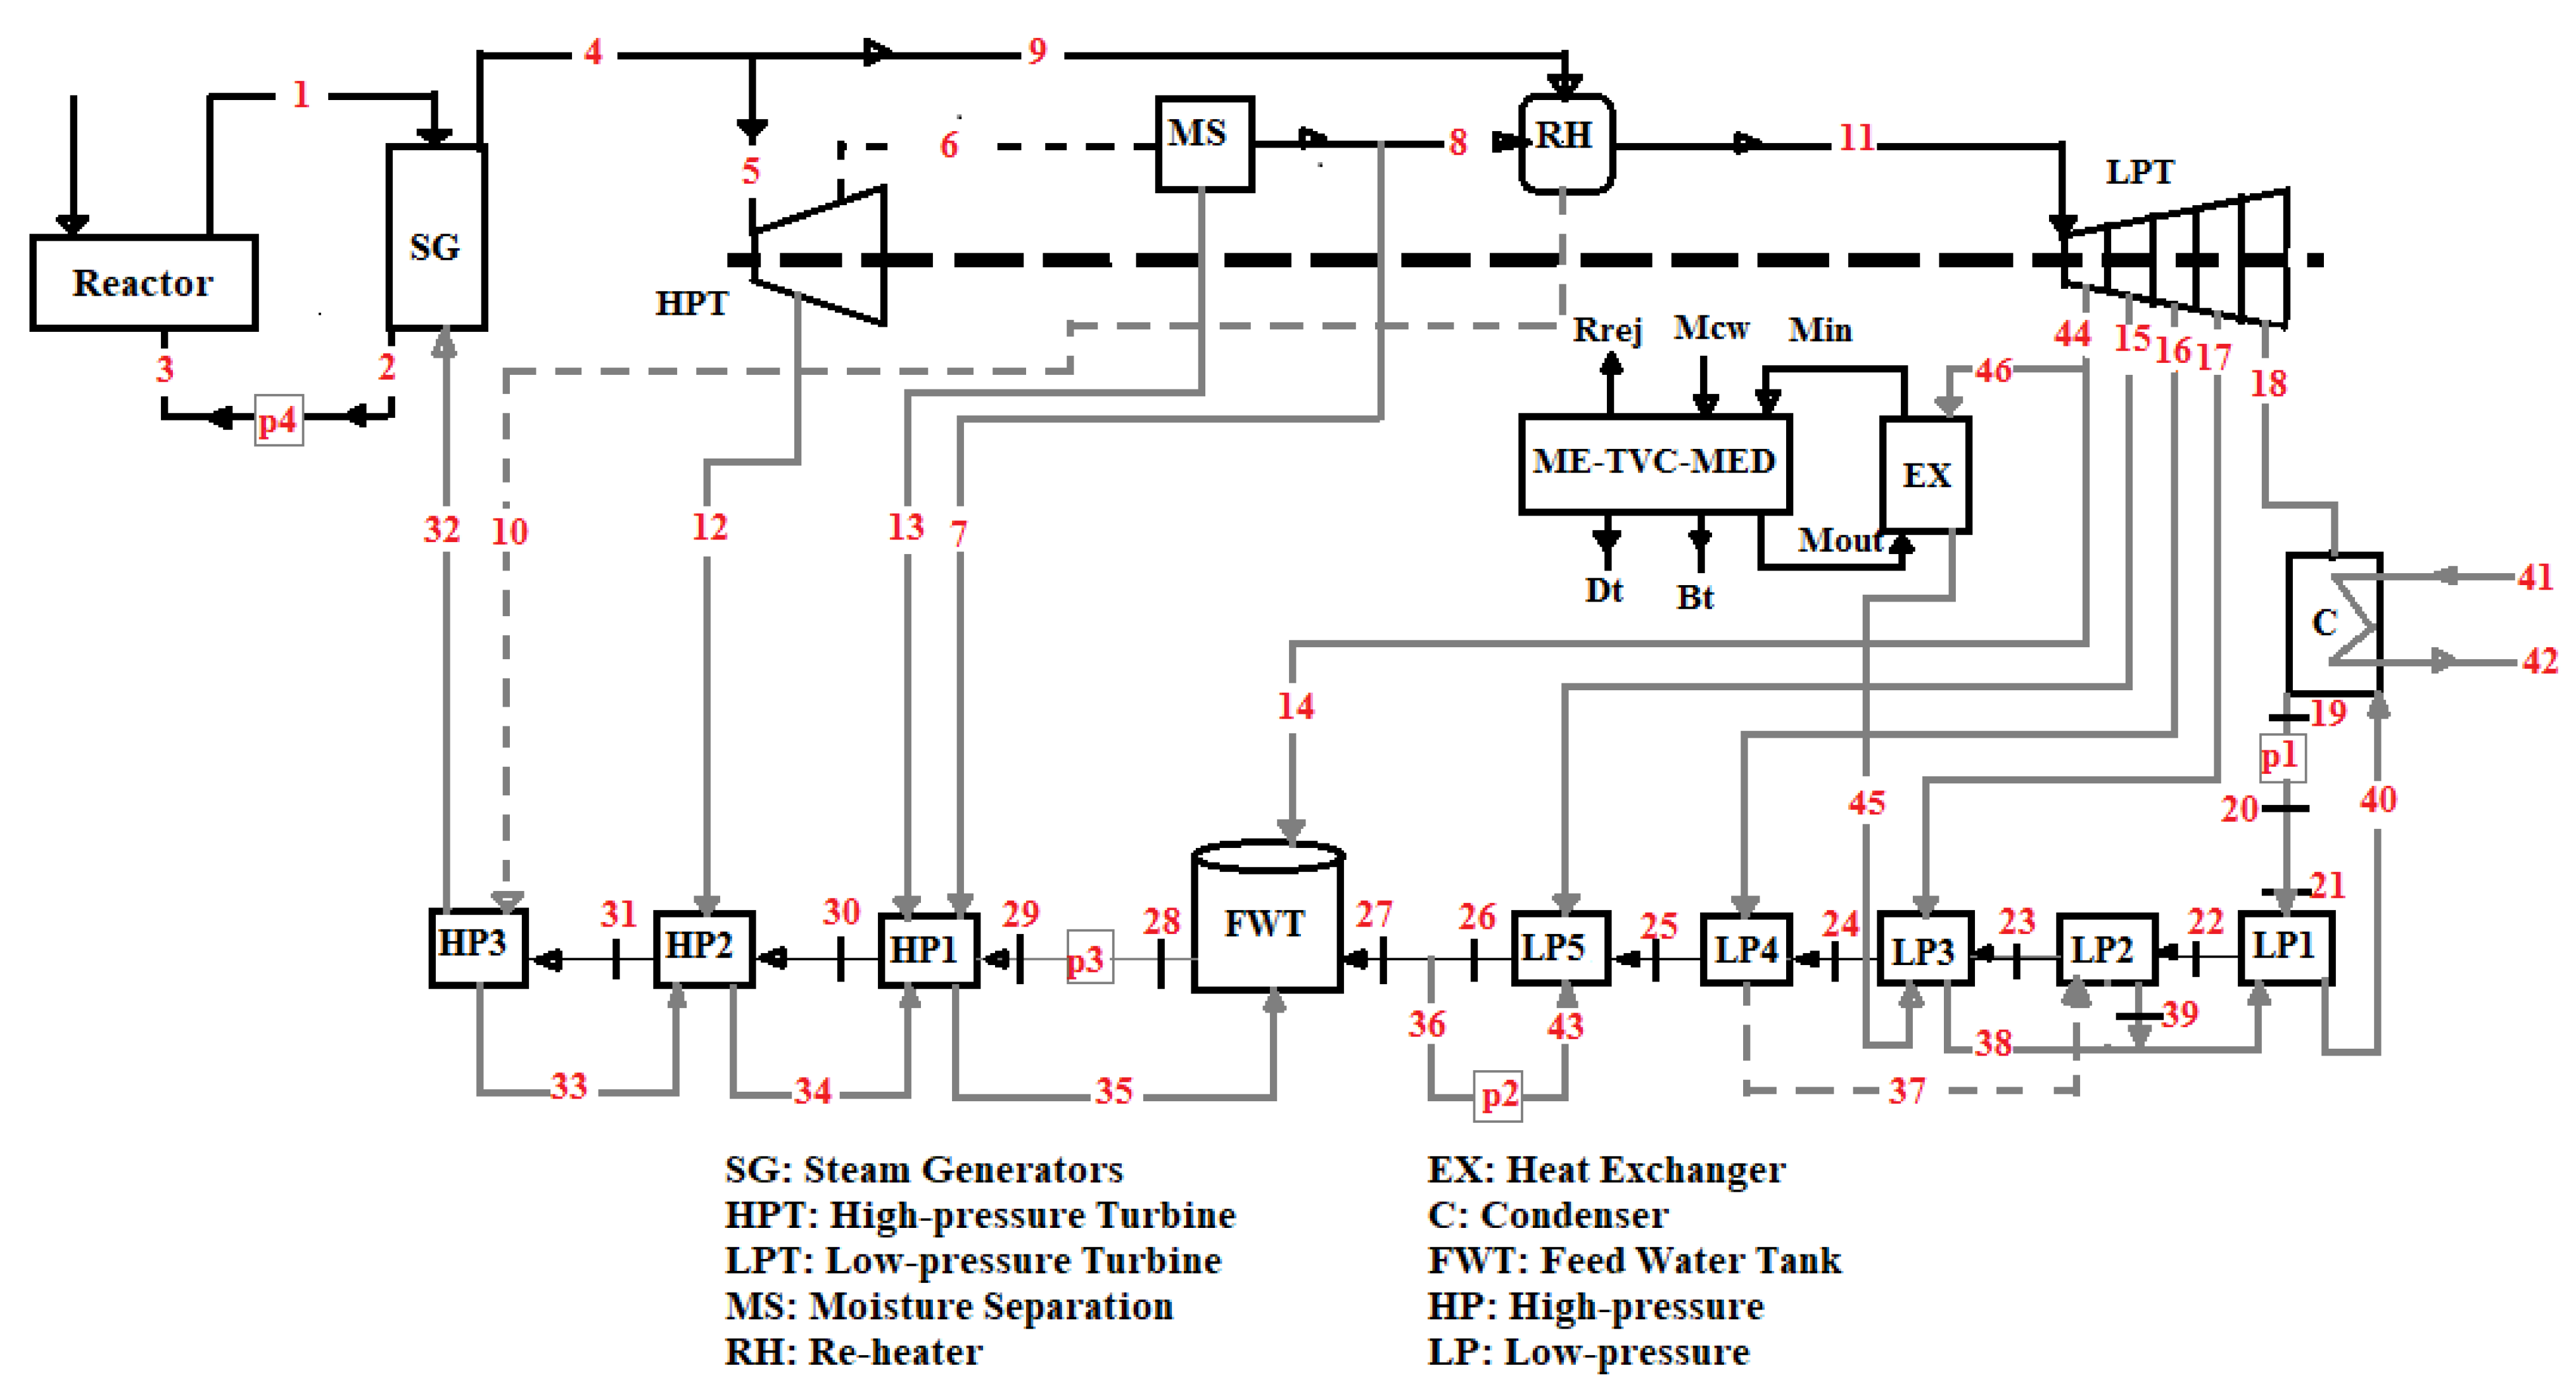
Figure 1, the NPP plant consists of three main cycles, including the primary, secondary and tertiary cycles. In the primary cycle, the four similar cooling cycles (a reactor and four steam generators, four pumps, and four pressurizers) use water as the heat transfer fluid. This circuit is always kept under pressure to prevent vaporization of the heat transfer fluid at the reactor’s operating temperature. The pressurizer is a component of the loop that maintains the pressure of the coolant loop. In the primary cycle, thermal energy is dissipated by the fission reaction of nuclear fuel at the heart of the reactor.
The cycle also includes several additional components, such as low-pressure (LP) heaters, high-pressure (HP) heaters, a feedwater tank (FWT), a water or moisture separator (MS), and a reheater (RH). The LP and HP heaters preheat water by recovering heat to increase its temperature before it enters the steam generator. The FWT stores and supplies water to the steam generator, while the MS removes any moisture from the steam to ensure its purity. The RH superheats steam before it enters the low-pressure turbine, resulting in improved overall system performance. Figure 1 provides an overview of the position of these devices in the nuclear power plant, as well as the thermodynamic cycle for the system.
The heat generated by the fission reaction is transferred to the coolant (water). The coolant is recirculated in the steam generators and evaporates the working fluid (steam) from the second cycle. The secondary circuit is based on a Rankine cycle similar to that of most steam power plants. The steam that comes out of the steam generator is divided into two streams; one part of the outlet steam is directed to the HPT turbine, and the rest is used to heat the flows extracted from the humidity separator. The superheated steam from the pre-heater is directed to the BPT turbine. Finally, in the third circuit, the seawater cools the vapor in the condenser after it leaves the low-pressure turbine. This cooling process is necessary to guarantee all the thermodynamic processes of the installation, including the cooling of the reactor, the production of steam, and the production of electricity.
The outlet flow to the first extraction line from the BPT turbine designated by flow number 44 is divided into two flows, numbered as 46 and 14. Flow 46 is directed to an intermediate insulation loop heat exchanger (designated as EX in Figure 1). The latent heat from flow 46 is transferred to the circulating water stream, increasing its temperature by about 5 °C. Some of the heated water then enters the expansion chamber, forming the vapor designated as Min. This vapor (Min) is utilized as the driving vapor in the first stage of the MED-TVC process. The heat exchanger (EX) is implemented to prevent direct contact between the steam from the PWR power plant and the water from the desalination plant, avoiding the risk of radioactive contamination in the freshwater. Flow 46 used to generate the driving steam for the ME-MED-TVC system is condensed in the EX and then returned to the second cycle of the PWR as flow 45.
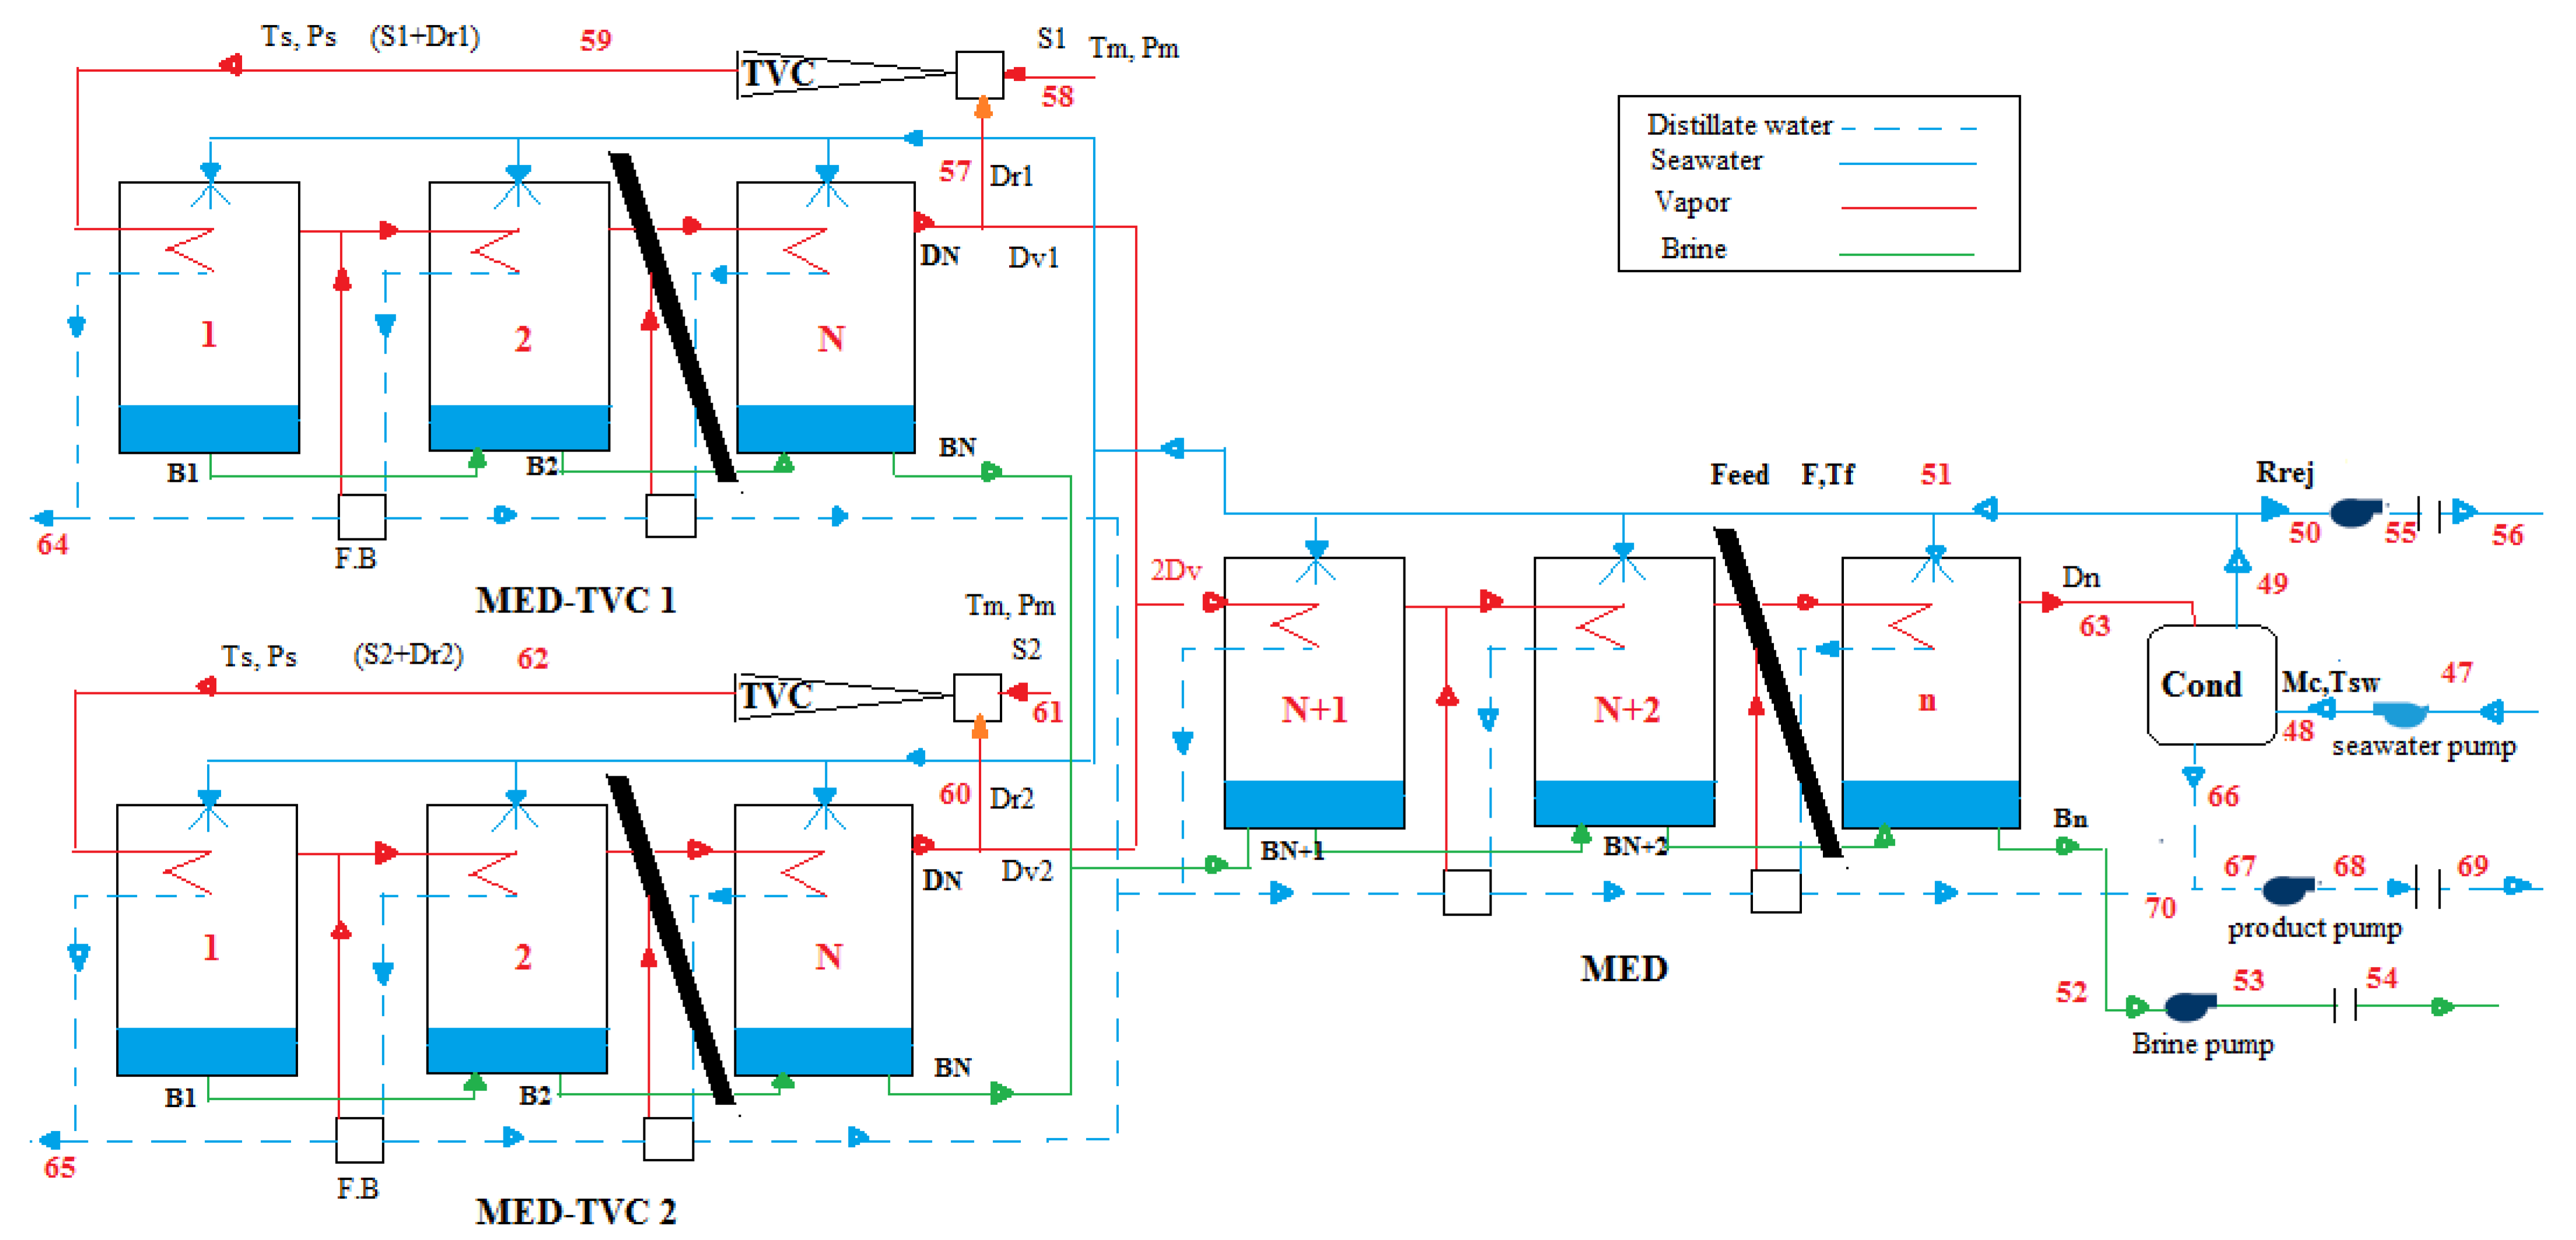
Figure 2 illustrates a process flow diagram of the ME-TVC-MED, with the relevant operational data presented in Appendix B. The condensates of the first effects in the two MED-TVC units are divided into two flows (S and Dr); the first returns to its source, while the second pass is to the product of desalinated water. The vapor generated (D) in the first effect of each MED-TVC unit is directed to the second effect as side effect and acts as source of heat in the next effect at lower pressure and temperature. The hot brine leaving the first effect in each MED-TVC unit passes into the second effect through the brine (B1). This iterative process is repeated through all the effects up to the final effect (N) of each MED-TVC unit.
The second flow (Dv) is combined with the flow from the other MED-TVC unit and directed to the first effect of the MED unit to start the desalination process at a low temperature. This process is the same in the MED-TVC unit and repeated until the last effect (n) in the MED unit. The steam produced by the final effect is ultimately sent to the condenser, where it transfers its latent heat to the cooling water Mc, raising its temperature from Tsw to Tf. The remainder of this cooling water is returned to the sea, while some of it is used as feed for the various effects (Rrej).

3. Modeling and System Analysis

3.1. Mathematical Laws and Assumptions

The mathematical model representing the thermodynamic and exergy analysis of PWR-ME-TVC-MED cogeneration includes three main equations: mass balance, energy balance, and exergy balance according to the first and second laws of thermodynamics [7,16,17]. These equations are as follows:
  • The law of mass balance for each component of the power plant:
    i ( m ˙ i n m ˙ o u t ) = 0
  • The first law of thermodynamics applies to each component of the power plant:
    i m ˙ i h i e m ˙ e h e W ˙ + Q ˙ = 0
  • Exergy flow equation for each part of the power plant:
    Q ˙ ( 1 T 0 T ) W ˙ + i m ˙ i e i e m ˙ e e e = S ˙ g
To simplify the analysis, some assumptions are made as follows:
  • The hybrid system model is operating at a steady state.
  • The potential and kinetic exergies are negligible.
  • The pressure losses in all pipelines and heat exchangers are negligible.
  • Heat losses in turbines and pumps are considered.
  • The temperature difference between the effects is constant.
  • The feed-flow rate in the effects is the same.
  • Calculations have been made for the boiling point elevation (BPE), specific heat capacity, and other variables.
  • The distillate is salt-free.
  • Thermodynamic losses have been studied.

3.2. Mass and Energy Balance Model

For the evaluation of mass and energy conservation, they should be determined with some unknown parameters, such as the heat transfer coefficient and physical properties of water. These unknown variables are defined in the following section. Mass and salinity balance equations for all the effects, the condenser, and the distillate tank are given by Equations (4)–(18), as shown in Table 1.
The temperature profile equations to determine the temperature difference across the effects, saturated vapor temperature, vapor condensation temperature, brine temperature, boiling point elevation, and non-equilibrium allowance are given by Equations (19)–(26), as shown in Table 2. The heat transfer area for each effect, the pre-heaters, the condenser, the total heat transfer area, the overall heat transfer coefficients, and the logarithmic mean temperature differences for the effects, pre-heaters, condenser, and the latent heat of the steam and distillate vapor can be obtained by using Equations (27)–(35), as shown in Table 3. The pressure equations to determine the compressed and entrained vapors can be obtained by using Equations (36) and (37), as shown in Table 4. In addition, the expansion ratio, compression, ratio, entrainment ratio, and heat capacity of water are presented in this table.

3.3. Exergy Analysis

Exergy is the maximum theoretical useful work that can be obtained from a given form of energy in a system using the environmental parameters as the reference state. In order to arrive at Equation (3), a control volume undergoing a steady-flow process may have multiple inlets and outlets and may exchange heat with the environment, which acts as a reservoir at a constant pressure P0 and a constant temperature T0 [19]. The second law of thermodynamics for this process can be expressed as follows:
S ˙ g = e m ˙ e e e i m ˙ i e i + Q ˙ J T 0
where S ˙ g represents the entropy generation rate for the process due to the irreversibilities. Two terms, namely, e m ˙ e e e and i m ˙ i e i , are considered as the entropy transfer. Q ˙ J = Q ˙ denotes the heat transfer rate for the instantaneous temperature T 0 . The last term, Q ˙ J T 0 , stands for the entropy transfer rate.
By neglecting the heat transfer as well as the kinetic and potential energies of the stream, the following expression is obtained:
W ˙ c v = W ˙ u = i m ˙ i e i e m ˙ e e e T 0 S ˙ g
This equation calculates the actual work accomplished during the process. This also defines the useful work, as steady-flow components have fixed boundaries and do not provide work performed by or against the environment. The reversible work can be determined by making the entropy generation term S ˙ g = 0 . Hence, Equation (43) can be expressed as follows:
W ˙ r e v = W ˙ u , m a x = m ˙ ( e i e e )  
The general exergy balance of a system can be written as follows:
E x ˙ = E ˙ p h + E ˙ c h + E ˙ k e + E ˙ p e
where E ˙ p h , E ˙ c h , E ˙ k e , and E ˙ p e are the physical, chemical, kinetic, and potential exergies, respectively. As for the selected reference of this study, the kinetic and potential exergy can be neglected from the exergy balance.
Given that the chemical composition of the flows in the PWR plant remains constant, the chemical exergy is disregarded in the energy balance equations applied to the PWR system. However, it is important to keep in mind that in the ME-TVC-MED desalination system, the salinity of the seawater changes during the process, making it necessary to consider the significance of the chemical exergy.
The physical and chemical exergies can be respectively provided as follows:
E ˙ p h = m ˙ e p h = m ˙ [ ( h h 0 ) T 0 ( S S 0 ) ]
E ˙ c h , w = m ˙ e c h = m ˙     w k ( μ k s μ k o )
where the subscript s refers to the initial state and o to the corresponding environmental or reference state, respectively. The terms μ and w refer to the chemical potential and mass fraction respectively. The terms e p h and e c h refer to the specific physical exergy and specific chemical exergy respectively.
The reversible (maximum) work can be expressed as follows:
W ˙ u , m a x = i E x ˙ i e E x ˙ e
The paper uses the term exergy flow rate instead of physical exergy and chemical exergy for simplicity. The rate of irreversibility ( I ˙ ) is equal to exergy loss:
I ˙ = W ˙ u , m a x W ˙ u = T 0 S ˙ g
The energy and exergy balance for each component of the NPP is based on reference [1], and the mathematical model is presented in the supplementary material.
The ME-TVC-MED desalination unit has three streams: pure water, saline water, and steam. The thermodynamic properties of pure water and steam can be obtained either from thermodynamic tables or through the use of a specific equation [16]. In this study, the properties of seawater were calculated using empirical relationships that depend on temperature and concentration, under constant atmospheric pressure, as suggested by Sharqawy et al. [20]. These correlations can be adjusted for different pressures with equations developed by the same authors. These correlations have been corroborated by Sharqawy et al. [21].

3.4. System Performance

The system performance of the PWR-ME-TVC-MED model can be evaluated in terms of the following [15]:
  • Total distillate (Dt)
The total distillate output of all effects is equal to the following:
D t = 2 i = 1 N D i + i = N + 1 n D i
  • Gain Output Ratio (GOR)
Gain output ratio is one of the parameters used to evaluate the performance of thermal desalination processes. It is defined as the ratio of the total distilled water produced ( D t ) and the motive steam supplied (S).
GOR = D t 2 S
  • Specific heat consumption (Q)
This stands as one of the most paramount characteristics of the systems of thermal desalination. It is defined as the thermal energy to be consumed by the system to produce 1 kg of distilled water, where λ m is the motive steam latent heat in kJ/kg.
Q = 2 S λ m D t
  • Specific heat transfer area (Ad)
The specific total heat transfer area is equal to the sum of the heat transfer areas of the effects ( A e ) and the condenser ( A c ) per total distillate product (m2/kg/s).
A d = A e + A c D t
  • Exergetic efficiency ME-TVC-MED
The exergetic efficiency represents the ratio of the minimum work of separation to fuel exergy supplied to the system and can be expressed as follows:
ε M E D = W ˙ m i n E ˙ f
The minimum work of separation ( W ˙ m i n ) refers to the product exergy in the desalination process, while the heat input represents the fuel exergy ( E ˙ f ) .
  • Exergy efficiency of the cogeneration plant [7]:
ε P W R + M E D = ( W ˙ u , m a x ) f i s P W R + M E D I ˙ ( W ˙ u , m a x ) f i s

4. Results and Discussion

The ME-TVC-MED desalination unit performance results are shown in Table 5. The results have been validated based on a comparison with three units available in the literature [15,22], as illustrated in Table 6. In this study, the thermal balance diagram of the combined PWR-ME-TVC-MED system is shown in Figure 3 and Figure 4. The diagram includes a total of 70 states, with the first three states located on the primary circuit of the PWR unit. The states from 4 to 60 are located along the flow stream on the secondary side piping unit of the PWR unit, while states 47 to 70 are found along the flow stream of the desalination unit at the inlet and outlet of its components. Streams 41 and 42 are located along the flow stream of the closed-loop cooling system piping unit at the inlet and outlet of the condenser. The properties of seawater are calculated using empirical correlations based on temperature and concentration at a constant atmospheric pressure.
For all the state numbers shown in Figure 1 and Figure 2, the reference state for the nuclear power plant is chosen as a sub-cooled liquid at an ambient pressure of p = 1.01 bar and a temperature of 25 °C for the water/steam, and for the environmental and dead state desalination unit, these were T = 298 K, p = 1.01 bar and X f = 39,000 ppm, which represents the intake conditions for the seawater for this analysis. Therefore, h = 104.8374 kJ/kg and s = 0.3661 kJ/kg.K. The results of the energy and exergy flow rates for the combined PWR and ME-TVC-MED plant are presented in Appendix C. Table 7 shows that the reversible (maximum) work that can be extracted from the system is 3854.7 MWth. The total thermodynamic efficiency of the PWR-ME-TVC-MED cogeneration plant was found to be 35.38%. According to the literature, the thermodynamic efficiency value of a PWR-ME-TVC-MED cogeneration plant of 1000 MWe was estimated as 33.83% [7]. In addition, the thermal efficiencies of CANDU6-RO and SFR-RO hybrid systems are 32.8% and 36.8%, respectively [10]. In addition, the thermodynamic efficiency of the GT-MHR-RO cogeneration plant was found to be 41% [11]. Therefore, the cogeneration plant presented in this study has an average efficiency value among those.
In addition, the total thermodynamic efficiency of the PWR-ME-TVC-MED cogeneration was found to be 35.38%. Comparatively, a previous study of a 1000 MWe PWR-ME-TVC-MED cogeneration plant found a thermodynamic efficiency of 33.83% [7]. Moreover, the thermal efficiencies of the CANDU6-RO and SFR-RO hybrid systems are 32.8% and 36.8% [10], respectively. The thermodynamic efficiency of the GT-MHR-RO cogeneration plant was found to be 41% [11]. Thus, the cogeneration plant presented in the present study has an average efficiency value among those.
The total amount of energy that is lost as a result of inefficiencies in the cogeneration system is estimated to be 64%. The overall thermodynamic efficiency of the PWR-ME-TVC-MED system is 35.38%, as reported in Table 7. The difference between the total exergy rate produced and the total rate of exergy destruction is 0.046% for the entire system.
To address the component irreversibility in the PWR-ME-TVC-MED cogeneration system, the following measures can be taken:
  • Improve the efficiency of the PWR: The PWR operates by generating high-pressure steam, which is used to drive a turbine and generate electricity. The efficiency of the PWR can be improved by using advanced materials for the reactor core, optimizing the fuel assembly design, and improving the heat transfer in the steam generators.
  • Reduce heat losses: Heat losses occur in various components of the cogeneration plant, including the PWR, the ME unit, the TVC, and the MED unit. These losses can be minimized by improving the insulation of the components, reducing the surface area of the heat exchangers, and using advanced heat transfer fluids.
  • Optimize the operation of the system: The operation of the cogeneration plant can be optimized by adjusting the operating parameters of the various components to ensure that they operate at their maximum efficiency. This includes optimizing the flow rates of the fluids, adjusting the temperature and pressure of the steam and water, and minimizing the pressure drops across the components.
In addition, there are several ways to reduce heat losses in the PWR-ME-TVC-MED cogeneration plant, including:
  • Insulation: Insulating the plant’s pipes, tanks, and other equipment can reduce heat loss and improve energy efficiency.
  • Heat recovery: Implementing heat recovery systems can capture waste heat generated by the plant and use it for other processes, such as heating water or generating electricity. This can help reduce heat losses and improve the overall efficiency of the plant.
  • Improved maintenance: Regular maintenance and cleaning of the plant’s equipment can help ensure that it operates efficiently and reduces heat loss due to leaks, blockages, or other issues.
  • Upgraded equipment: Upgrading older or inefficient equipment with newer, more energy-efficient models can reduce heat losses and improve the overall efficiency of the plant.
The results estimated by the current study are presented briefly in 
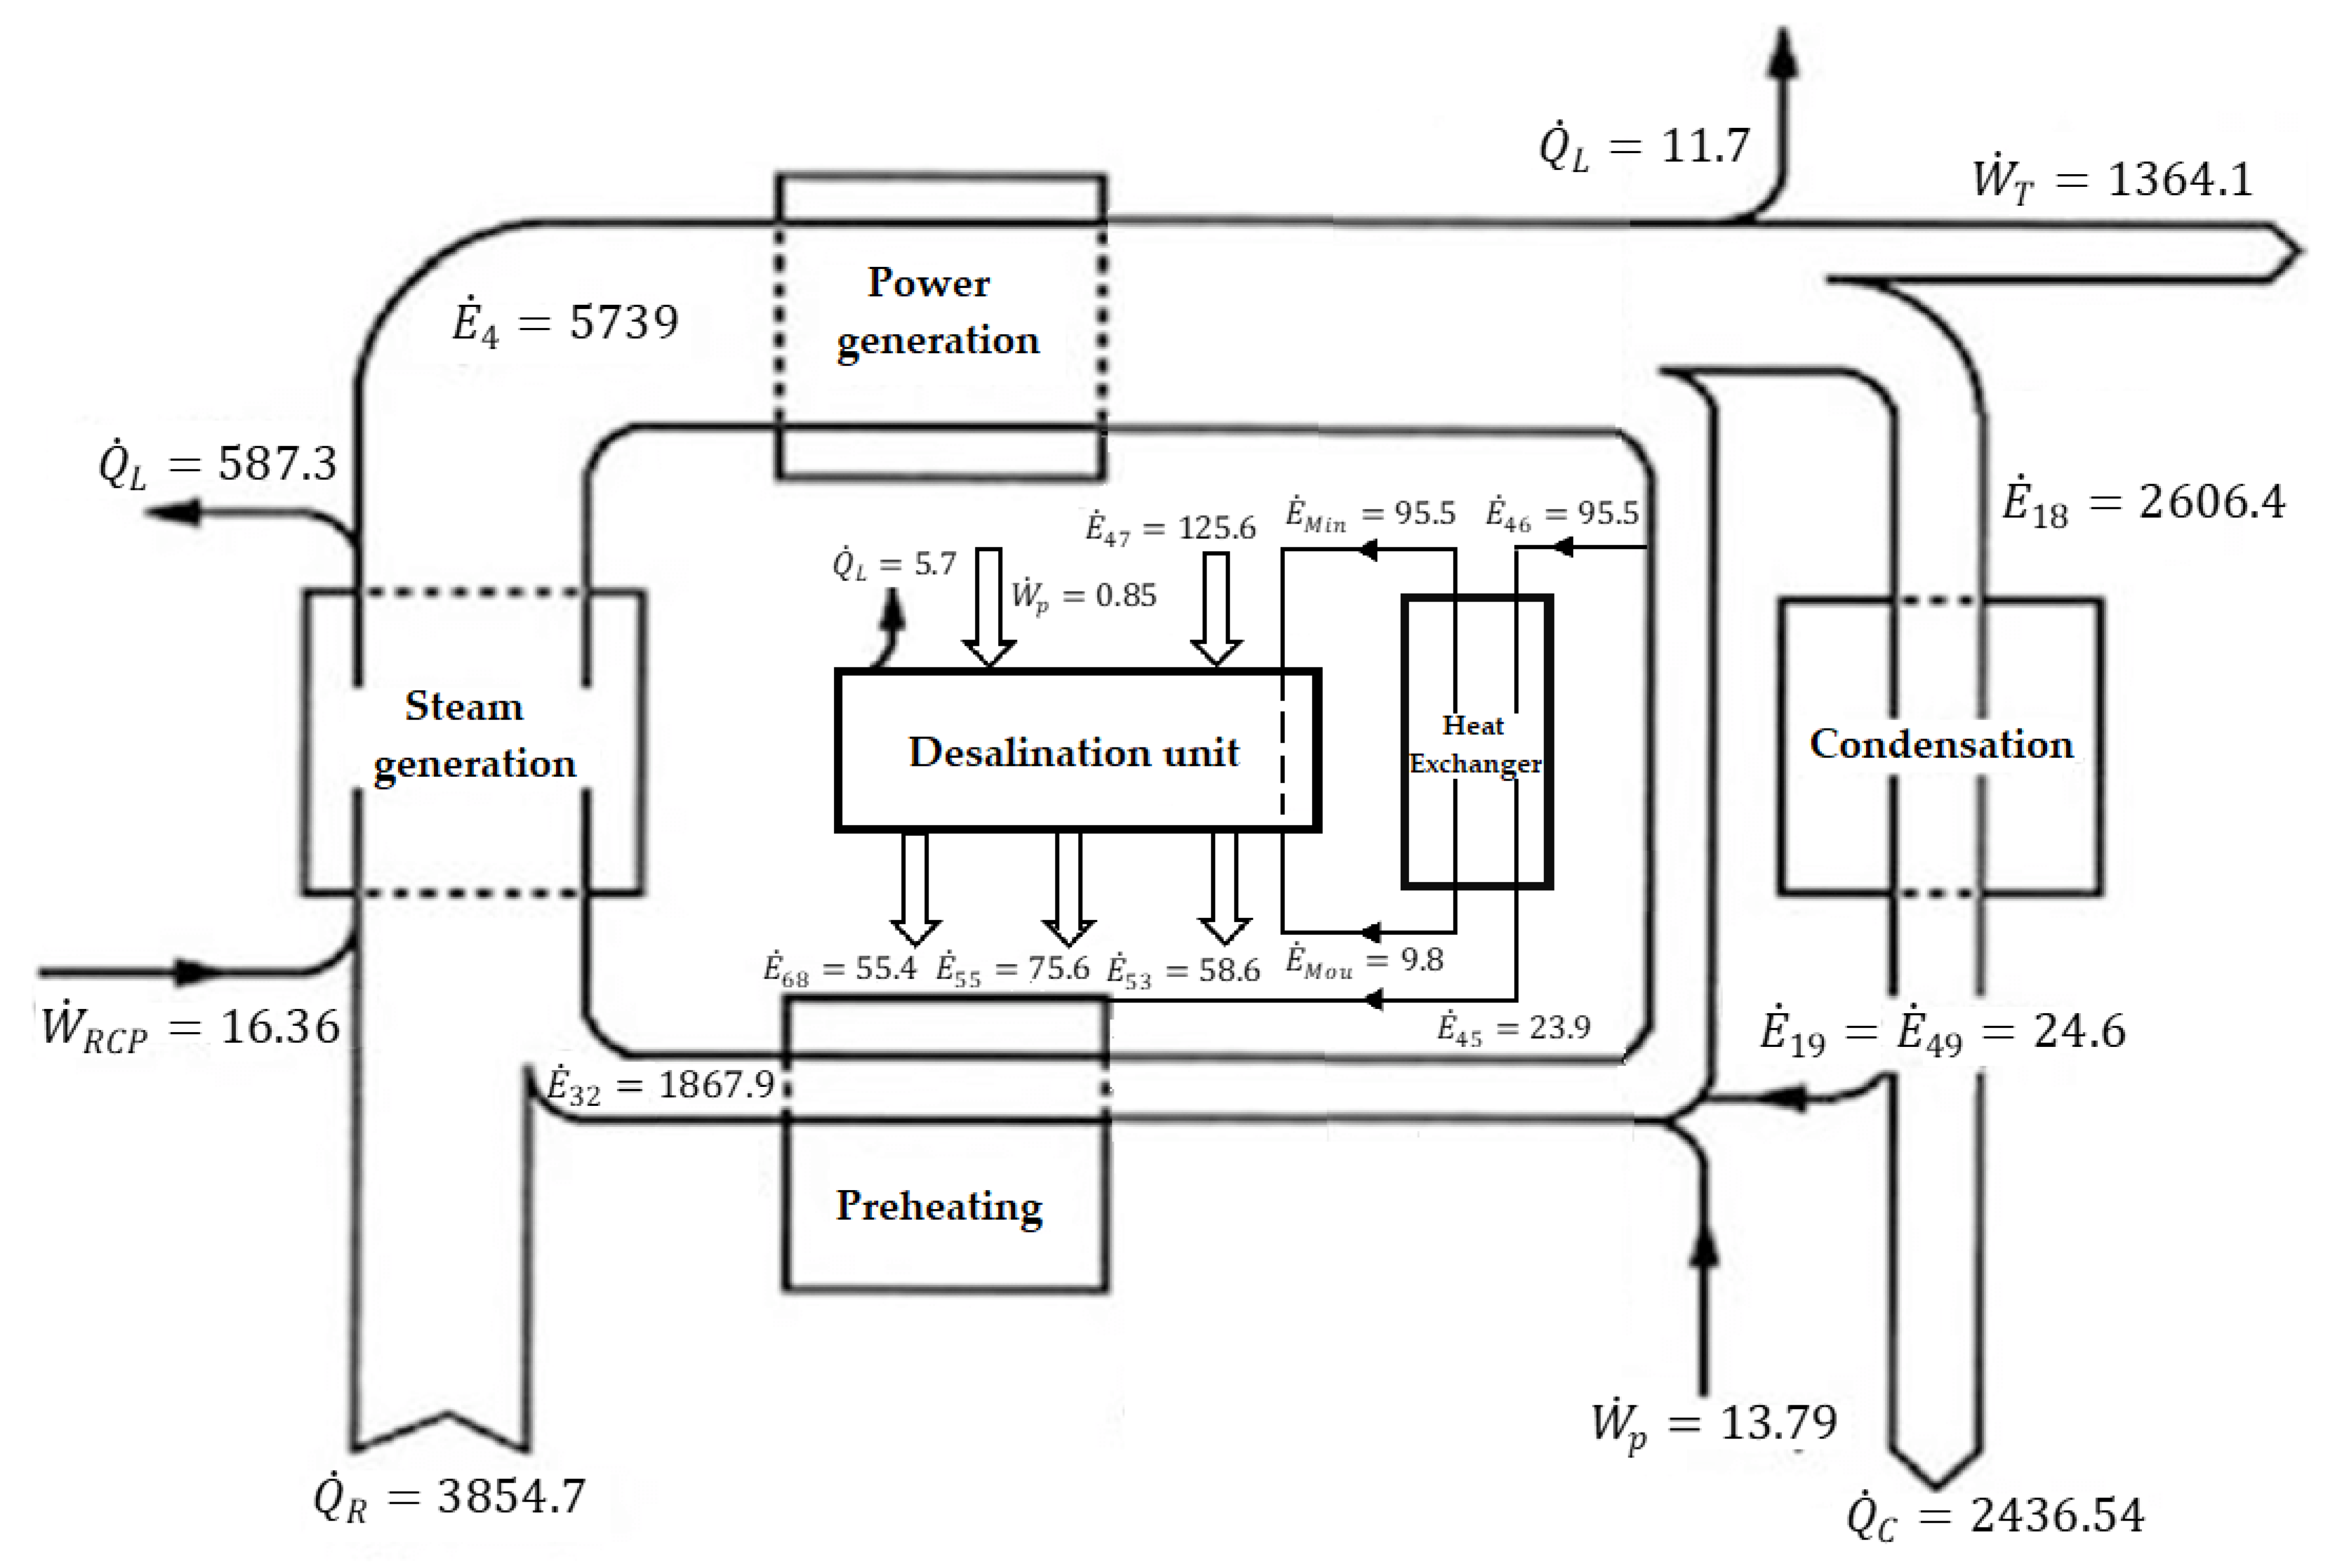
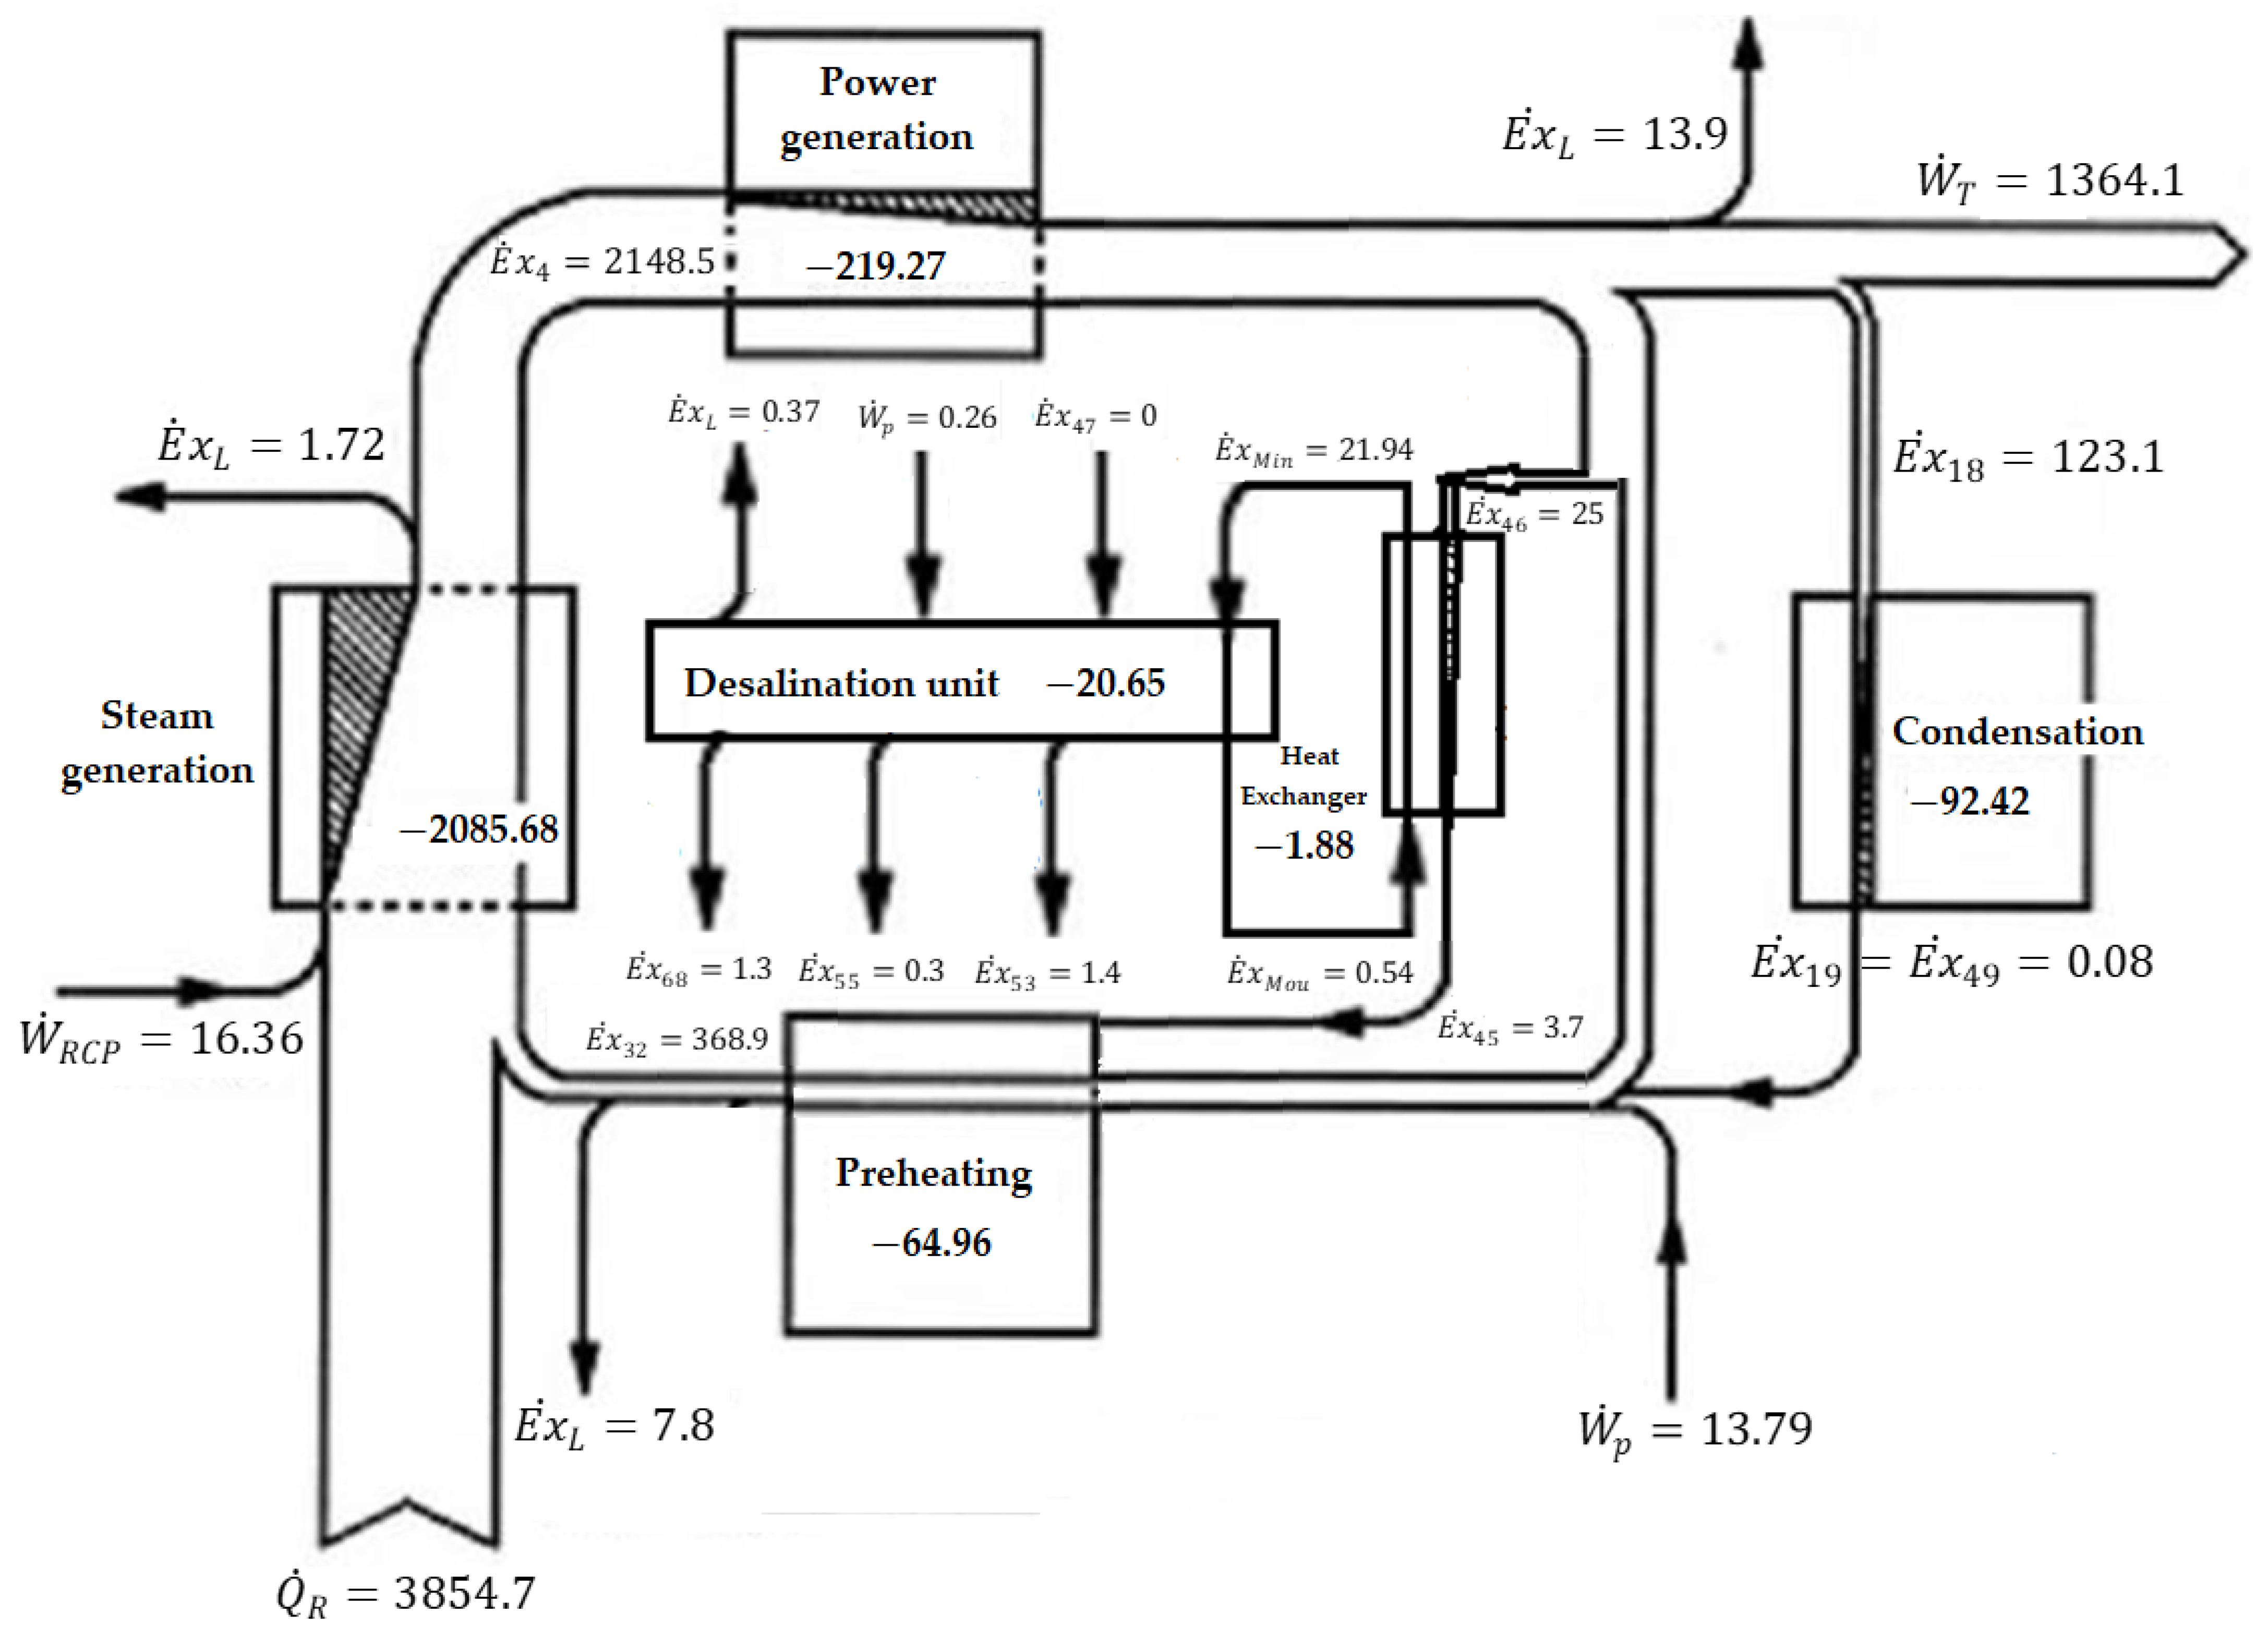
Table 8. Isentropic efficiencies for low- and high-pressure turbines, pumps for reactor coolant, feed water, main condensate, seawater, distillate, brine, and reject are estimated as 87.68%, 86.9%, 64.24%, 76.68%, 55.33%, 69.56%, 68.75%, 86%, and 62.35%, respectively. The simplified energy and exergy balance diagrams of the PWR-ME-TVC-MED cogeneration plant are illustrated in Figure 3 and Figure 4, respectively. From Figure 3, it is obvious that the core energy makes a cycle of the steam generator, preheating unit, power generation unit, and energy flow through condensation. In addition, there is a desalination unit. In the case of the exergy balance diagram in Figure 4, power generation, steam generation, condensation, preheating, and desalination units should be the key components.
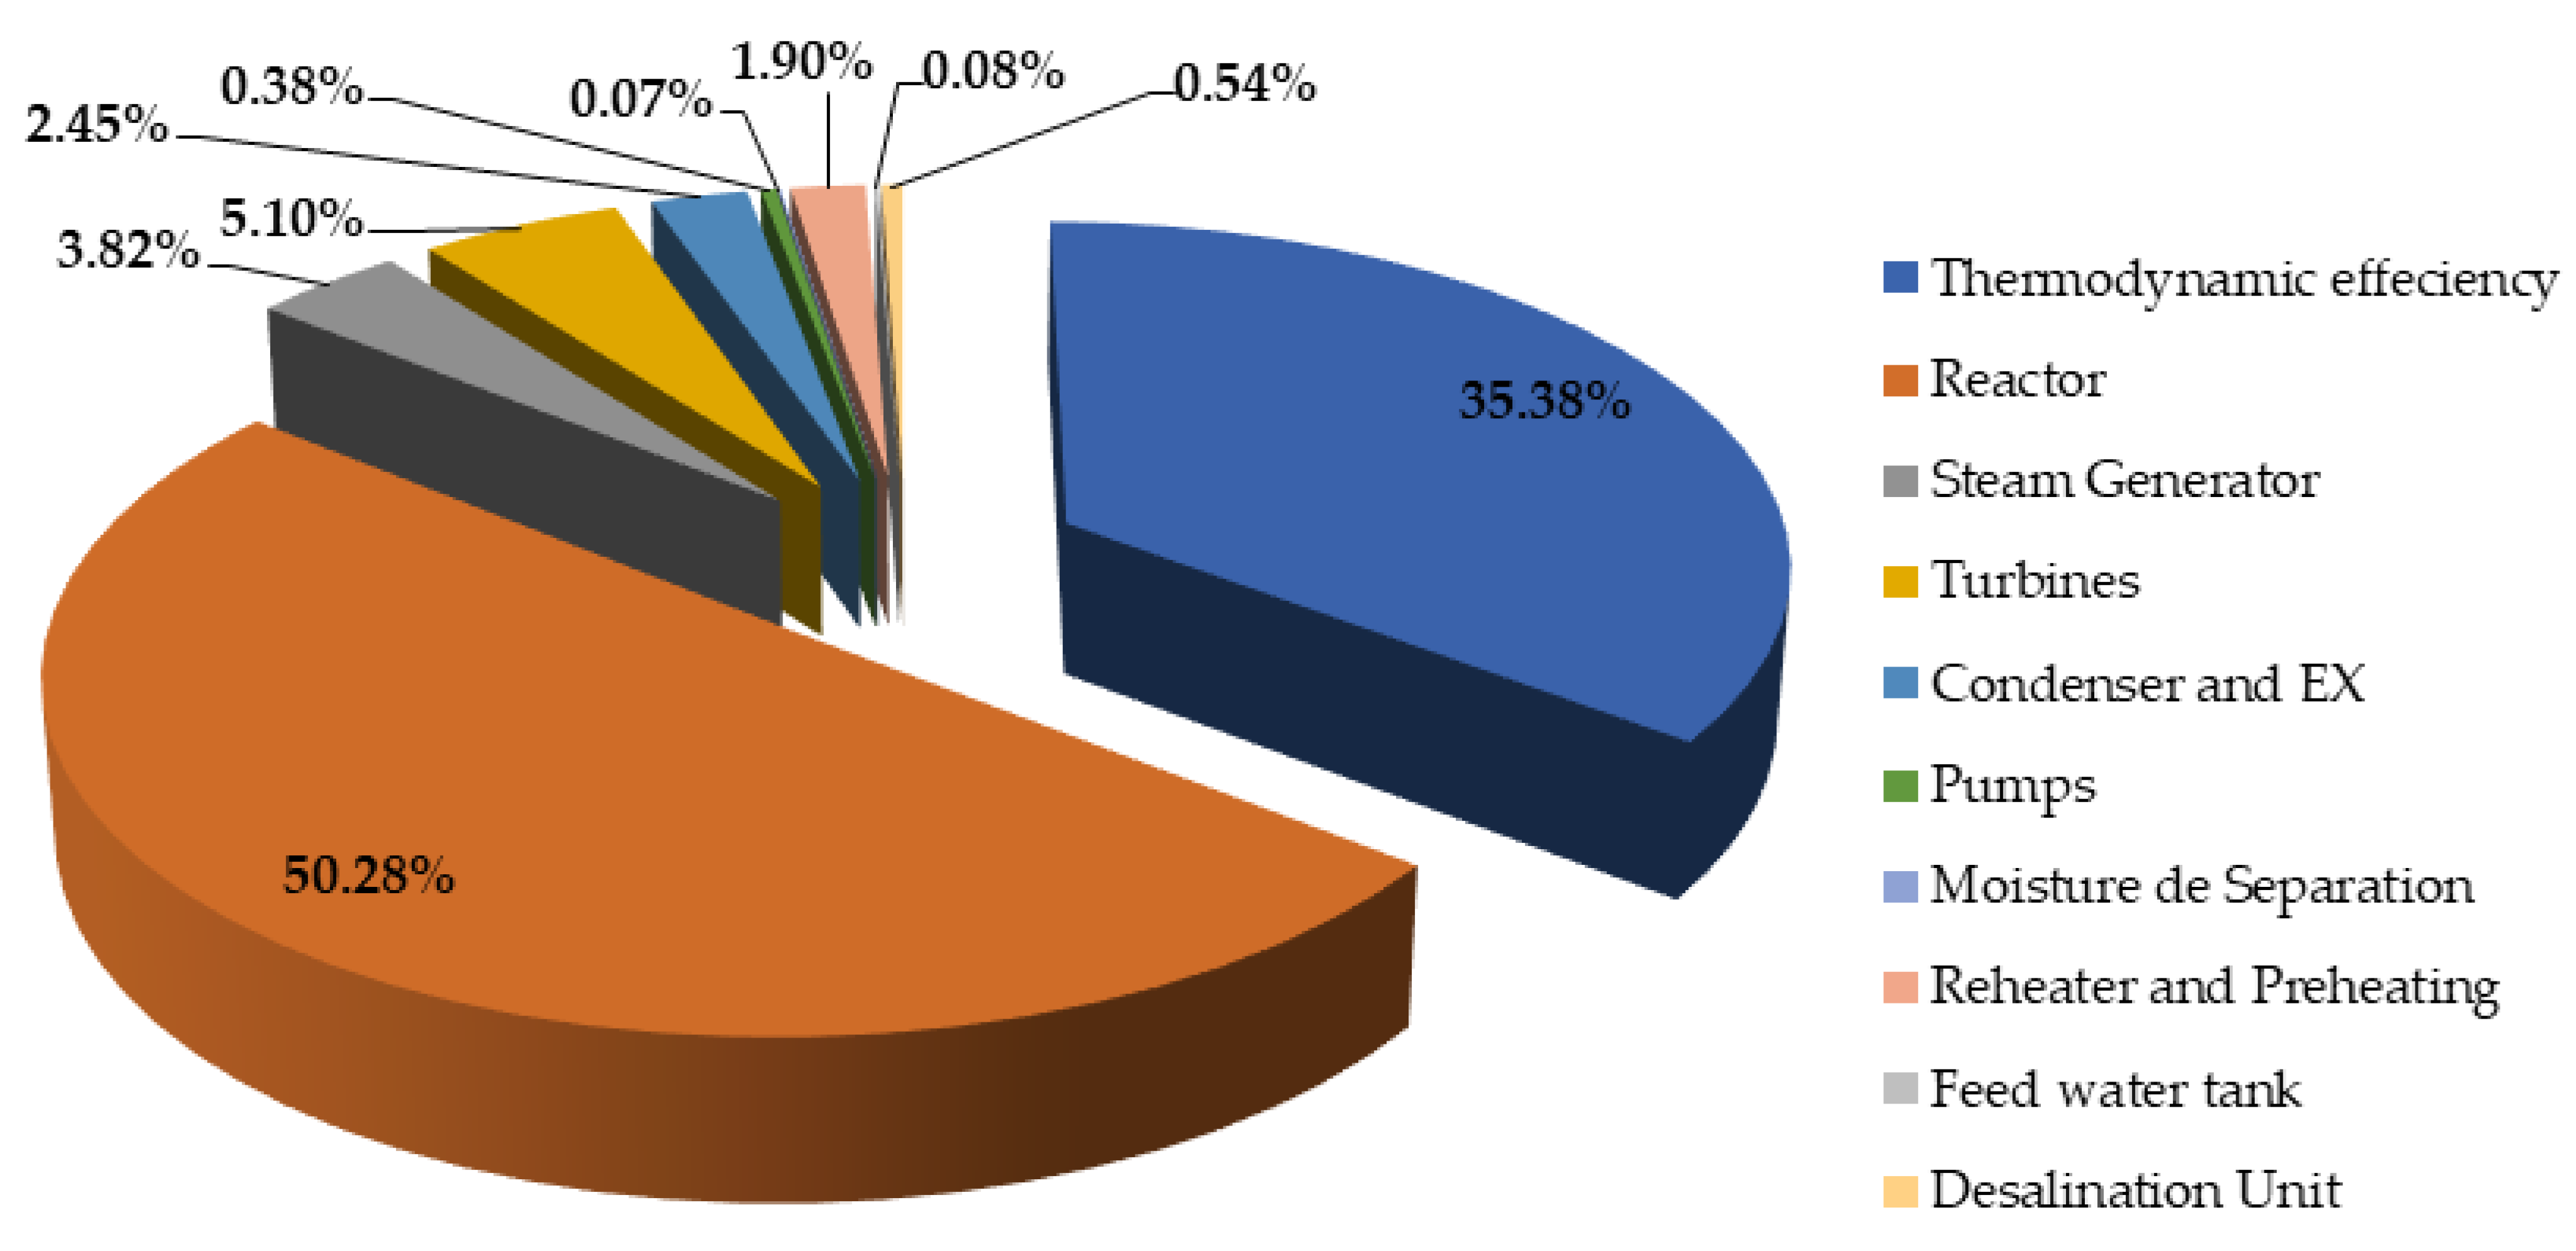
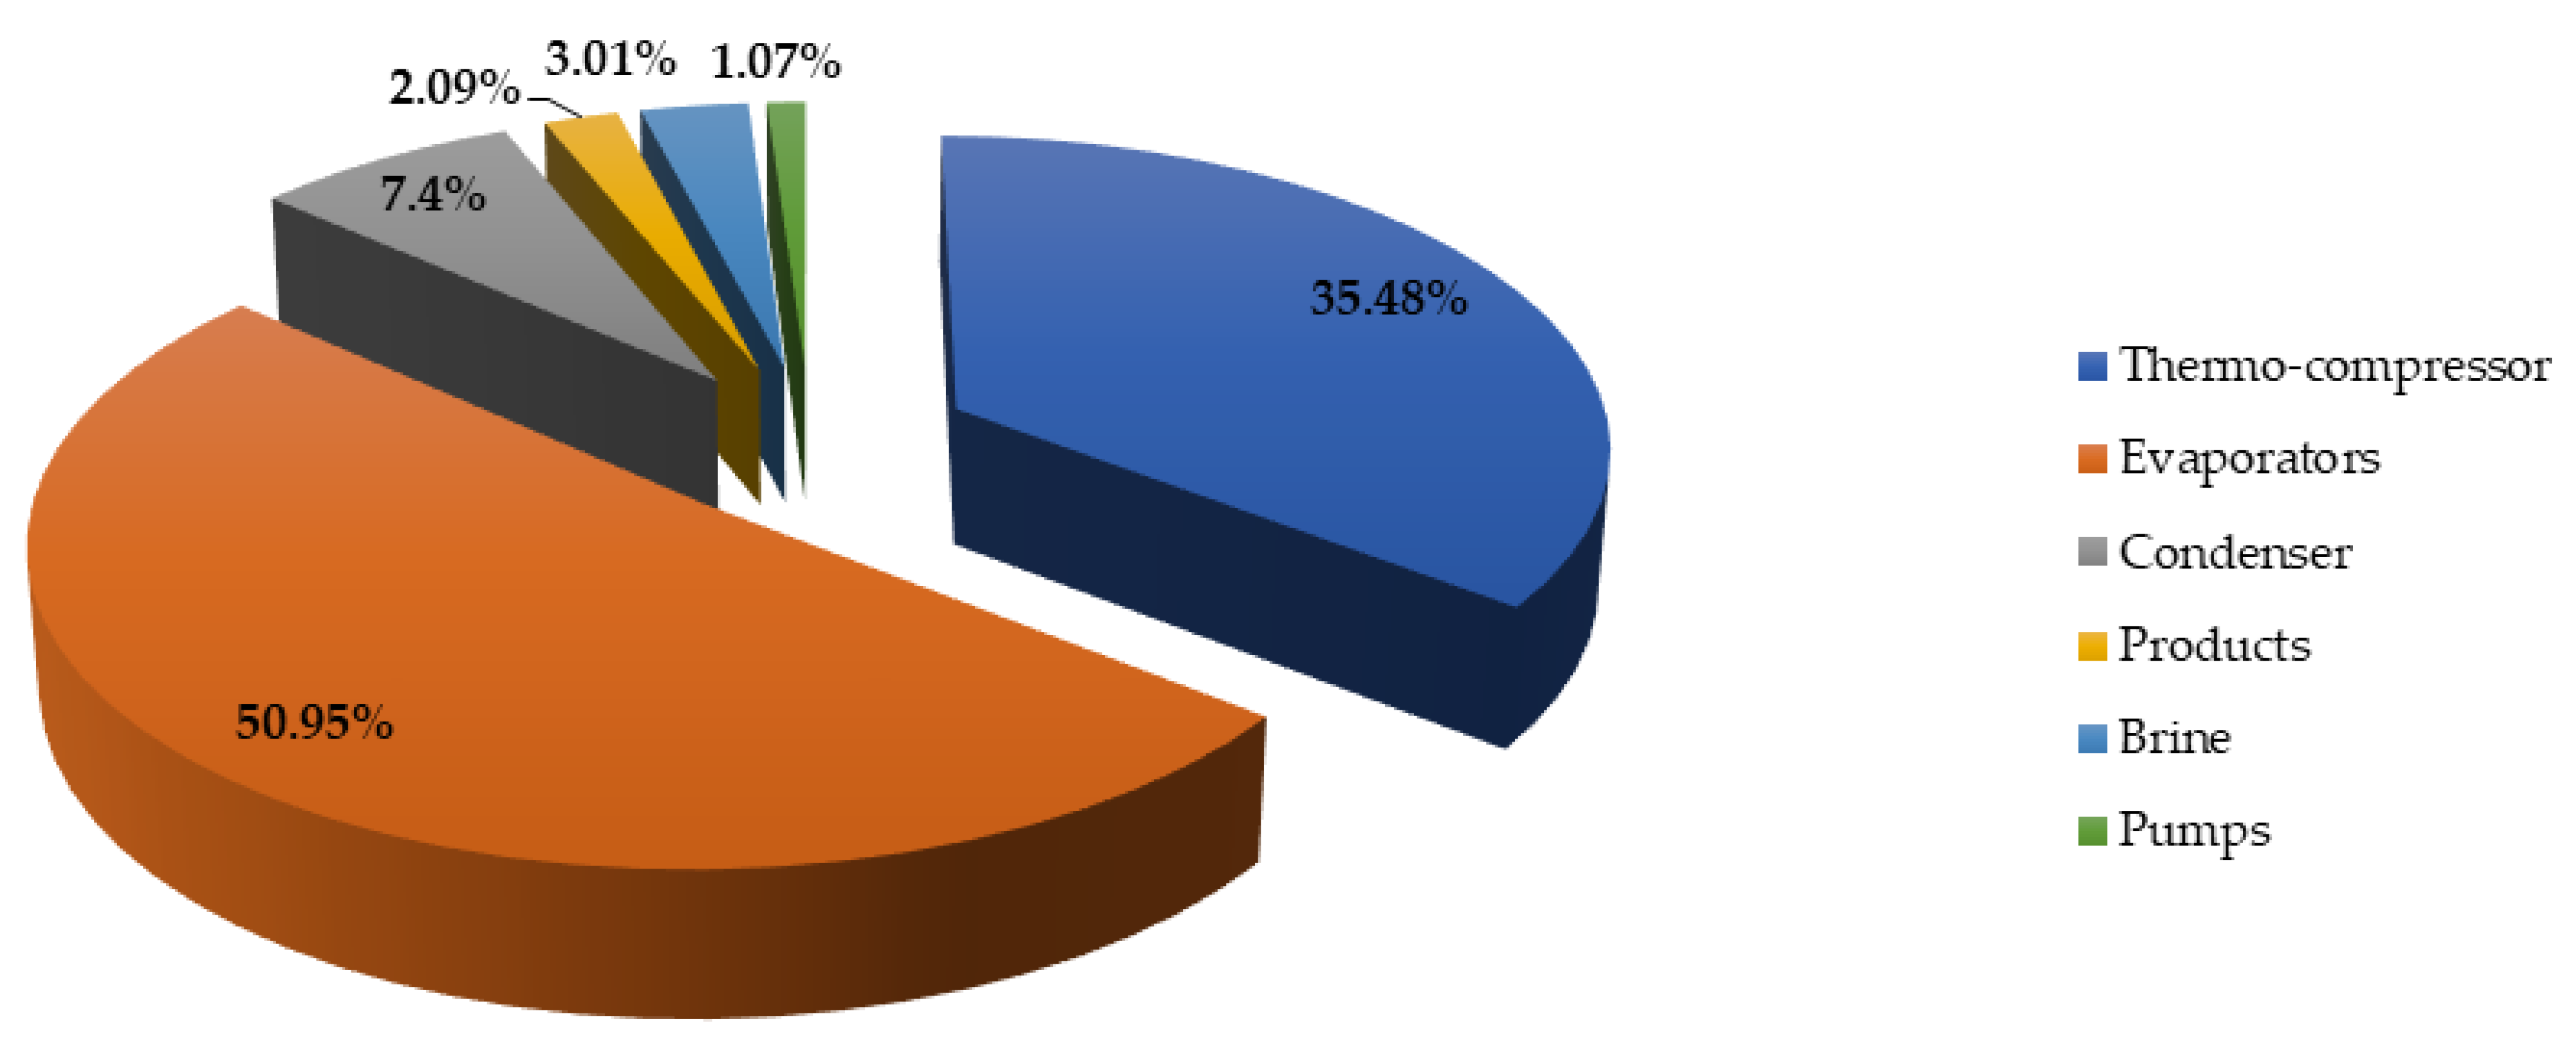
The efficiency of the cogeneration plant and the rates of exergy destruction of the components are illustrated in Figure 5 and Figure 6, respectively, for the components of the desalination unit, which are more detailed than the thermodynamic calculations. It was found that the reactor core exhibited an irreversible rate of 50.28% in the installation. In addition, there are evaporators at an irreversible rate of 51% in the desalination unit.
Figure 5 displays the exergy destruction and efficiency for all components as a proportion of total exergy destruction. The main exergy destruction occurs in the reactor core due to the fission process. The transfer between the fuel rods and coolant, heat loss, and pressure drop also contribute. The high-pressure turbine has a relatively high exergy destruction rate compared to other components, due to the high fuel exergy. The steam generator, which has many components and experiences heat transfer loss, temperature differences, and pressure differences, is considered the third largest source of irreversibilities and inefficiencies in the cycle. However, the exergy destruction of other components is minor and there is a difference in the level of exergy destruction between PWR and ME-TVC-MED, due to differences in heat capacity, the inlet temperature, and the type of working fluid. Approximately 64% of the total exergy generated from the fission power in a cogeneration plant is lost. Around 54% of this loss occurs in the primary loop (core and steam generators) of the PWR due to heat losses and pressure drops in the primary circuit, while the secondary circuit components (turbines, condensers, heaters) have a loss of approximately 10%. Moreover, other components, such as desalination and EX, have a loss of 0.5%, while 66.2% of the exergy is lost in the cogeneration (PWR-MED-TVC) [7]. In addition, 62% of the exergy is lost in the VVER NPP [1], and 53.7% of the exergy of the fuel is diminished in the PWR NPP [17].
The exergetic efficiency of the desalination unit was found to be 6.43%. According to the literature, the exergetic efficiency value of the desalination unit was found to be 7.58% [24]. The results indicate that in a cogeneration plant, about 64% of the total exergy produced from fission power is lost, with about 54% of this exergy loss occurring in the primary loop (core and steam generators) of the PWR plant due to heat losses and pressure drops in the primary circuit. The secondary circuit components (turbines, condenser, heaters) have a loss of approximately 10%. Furthermore, the distillation process is extremely energy-intensive, occurring at low pressure, which increases the amount of latent heat of vaporization and the percent of exergy destruction of the component desalination unit, as shown in Figure 6.
The results show that the highest source of irreversibilities within a desalination unit is found in the evaporators and that the thermo-compressor has a relatively high rate of exergy destruction compared to the remaining components in the system. The exergy destruction of other components is rather small. Increasing energy efficiency and reducing waste could be achieved by designing optimal heat recovery systems through various methods, such as heat exchangers or preheaters to extract the waste energy from the production line [25,26]. Significant efficiency improvements could also be obtained by using nanofluids, as they have been found to exhibit enhanced thermal conductivity compared to traditional fluids [27,28,29,30].

5. Conclusions

In this paper, the energy and exergy efficiency of a PWR-ME-TVC-MED cogeneration plant for the simultaneous production of electrical energy and freshwater has been analyzed. The second law was used in defining exergy to reveal contributions of the components. The most recent validated data in the literature were used to determine the thermodynamic characteristics of seawater. A mathematical model was implemented in MATLAB software and validated based on a comparison with previously published research. The following are the key findings of this investigation:
It has been shown that the nuclear reactor core is the main source of exergy loss in the cogeneration plant. Indeed, it is the worse component in the whole cogeneration system due to the irreversibility of the energy transformation. Therefore, a substantial improvement can be attained in the performance of the cogeneration plant by considering the core of the reactor components. While the thermodynamic efficiency of the PWR-ME-TVC-MED is found to be 35.38%, the irreversibilities of the core of the reactor and turbines have been calculated as 50.28% and 5.8% respectively. Low irreversibilities also exist in the components of steam generators, condensers, moisture separators, and desalination units. Additionally, in the ME-TVC-MED desalination unit, the main exergy losses occur in effects and in the thermos-compressor, which represents 85% of the total value of exergy destruction.
One way to address component irreversibility is through the use of heat exchangers, which are devices designed to transfer heat between two fluids at different temperatures. In the PWR-ME-TVC-MED cogeneration plant, heat exchangers can be used to capture the waste heat from the power generation process and use it to generate steam for the thermal desalination process. This can significantly increase the overall efficiency of the plant, as the waste heat that would otherwise be lost is put to productive use. In addition, the cogeneration plant can incorporate other technologies and strategies to improve efficiency and reduce component irreversibility. For example, the plant can use advanced materials and designs to reduce heat loss and improve the performance of key components. The plant can also use advanced control systems to optimize the operation of the various components and minimize waste.
Taking all of these conclusions into consideration, optimizing the operating conditions of the existing designs leads to the introduction of various possibilities to improve the design and performance of the cogeneration plant, based on the analysis conducted. In general, any improvement in thermodynamic performance has an economic and environmental impact. This will be published soon as the second part of the current study, using exergo-economic and exergo-environmental methodologies.

Supplementary Materials

The following supporting information can be downloaded at: https://www.mdpi.com/article/10.3390/su15108358/s1.

Author Contributions

Conceptualization, Z.T., R.M., M.N.B., H.T., M.K., A.A., J.Z. and L.M.; Methodology, Z.T., R.M., M.N.B., H.T., M.K., A.A., J.Z. and L.M.; Software, Z.T., R.M., M.N.B., H.T., M.K., J.Z. and L.M.; Validation, Z.T., R.M., M.N.B., H.T., M.K., A.A., J.Z. and L.M.; Formal analysis, Z.T., R.M., M.N.B., H.T., M.K., A.A., J.Z. and L.M.; Investigation, Z.T., R.M., M.N.B., H.T., M.K., A.A., J.Z. and L.M.; Resources, Z.T., R.M., M.N.B., M.K., A.A., J.Z. and L.M.; Data curation, Z.T., R.M., M.K., A.A., J.Z. and L.M.; Writing—original draft, Z.T.; Writing—review & editing, M.N.B., H.T., A.A., J.Z. and L.M.; Visualization, Z.T., H.T., M.K., A.A., J.Z. and L.M.; Supervision, M.N.B., A.A. and J.Z.; Project administration, Z.T., A.A., J.Z. and L.M. All authors have read and agreed to the published version of the manuscript.

Funding

This work was supported in entire part by the Biomaterials and Transport Phenomena Laboratory agreement N° 303 03-12-2003, at the University of Medea. The authors acknowledge and gratefully thank the financial support provided by DG-RSDT of Algeria.

Institutional Review Board Statement

Not applicable.

Informed Consent Statement

All subjects gave their informed consent for inclusion before they participated in the study.

Data Availability Statement

The authors confirm that the data supporting the findings of this study are available within the article and its supplementary materials.

Conflicts of Interest

The authors declare no conflict of interest.

Nomenclature

A: heat transfer area, m2c: coolant
B: brine water flow rate, kg.s−1cv: control volume
BPE: boiling point elevation, °Ce: exit, outflow
Cp: specific heat, kJ.kg−1.K−1f: feed water
CR: compression ratiofis: fission
D: distillate, kg.s−1g: generation
e: exergy, kJ.kg−1i: inlet, inflow, number of effects
E ˙ : total energy flow rate, kWke: kinetic energy
E x ˙ : total exergy flow rate, kWm: motive steam
ER: expansion ratiomax: maximum
F: feed seawater flow rate, kg.s−1p: pump
GOR: gain output ratiope: potential
h: specific enthalpy, kJ.kg−1ph: physical
I ˙ : rate of irreversibility, kWR: reactor
i: number of effectsRCP: coolant pump of reactor
LMTD: logarithmic mean temperature difference, °CRej: rejection
m ˙ : mass flow rate, kg.s−1Rev: reversible
Mc: total seawater inlet flow rate, kg.s−1s: steam
P: pressure, Pa, bart: turbine
Q: specific heat consumption, kJ.kg−1
Q ˙ : net rate of heat transferred, kWAbbreviations
Ra: entrainment ratioCANDU: Canadian deuterium uranium
S: specific entropy, kJ.kg−1.K−1cond: condenser
S ˙ g : entropy generation rateEX: heat exchanger
T: temperature, °CFWT: feed water tank
TBT: top brine temperature, °CGA: genetic algorithm
U: heat transfer coefficient, kW/m2 KGT-MHR: gas turbine-modular helium reactor
V: velocity, m/sH.P: high-pressure
W ˙ : net rate of work, kWH.P.T: high-pressure turbine
w: work per unit mass, kJ.kg−1L.P: low-pressure
X : salinity balanceL.P.T: low-pressure turbine
Z: height, mM.S: moisture separator
n, N: number of effects
Greek lettersNPP: nuclear power plant
ε : exergetic efficiencyP: pump
λ : latent heat, kJ.kg−1ppm: parts per million
η : isentropic efficiencyPWR: pressurized water reactor
μ: chemical potentialR.H: re-heater
Δ : differenceRO: reverse osmosis
SubscriptsS.G: steam generators
0: reference state SFR: sodium-cooled fast reactor
a: property that corresponds to the fission fragments’ kinetic energyTVC: thermo-vapor compressor

Appendix A

Table A1. Technical data of the nuclear power plant.
ItemValue
Coolant inlet temperature to the reactor, °C291.7
Coolant outlet temperature from the reactor, °C324.9
Coolant H2O
Coolant flow rate, kg/s19,643.8
Average reactor pressure, bar157
Number of coolant cycles4
Inlet water temperature in the steam generator, °C211.13
Outlet water temperature in the steam generator, °C282.3
Inlet pressure at steam generator, bar66.07
Outlet pressure at steam generator, bar66.41
Steam flow rate in the generator, kg/s2069.35
Number of coolant steam generators4
Cooling temperature at condenser inlet, °C25
Cooling temperature at condenser outlet, °C35
Cooling water flow rate at the condenser, kg/s61,728.34

Appendix B

Table A2. Technical data of the desalination unit.
DescriptionValueUnit
Cooling water temperature, T c w 25°C
Feed sea water temperature, T f 35°C
Number of effects, n 8-
Motive steam flow rate, S17.5kg/s
Maximum brine temperature, T 1 65°C
Minimum brine temperature, T n 40°C
Motive pressure, P m 101.31kPa
Feed water salinity, X f 39,000Ppm

Appendix C

Table A3. Total energy and exergy flow rates for the cogeneration plant.
State No.Total Energy Flow Rate (MW)Total Exergy Flow Rate (MW)State No.Total Energy Flow Rate (MW)Total Exergy Flow Rate (MW)
129,118.78868.33644.15
225,247.66941.737473.6
325,2646952.23816.14
457392148.53922.60.3
55383.52014.440330.3
64489.113314130,509.60
718232.44232,944.237.5
84045.21217.143444.9
9350.3129.64418648.7
10151.4394523.93.7
1142391287.64695.525
12420.3137.947125.60
13261.778.948125.70.06
1490.423.749176.10.922
15221.349.75075.60.386
16265.345.951100.50.526
1770.15.45258.61.374
182606.4123.15358.61.446
19200.2015436.20.832
20202.52.15575.60.41
21201.92.75675.50.37
22208.41.75756.34.723
23233.43.35847.610.977
24288759102.812.239
25505.236.26056.34.723
26682.575.26147.610.977
27726.680.262102.812.239
281228157.96351.12.367
291239.5161.2644.90.252
301522.4248.6654.90.252
311839.7358.7663.20.08
321867.9368.96755.51.405
33123.2266855.41.398
34226.239.569350.959
3538753.670521.321

References

  1. Terzi, R.; Turkenmez, I.; Kurt, E. Energy and Exergy Analyses of a VVER Type Nuclear Power Plant. Hydrog. Energy 2016, 41, 12465–12476. [Google Scholar] [CrossRef]
  2. Sahin, S.; Sahin, H.M.; Al-Kusayer, T.A.; Sefidvash, F. An Innovative Nuclear Reactor for Electricity and Desalination. Energy Res. 2011, 35, 96–102. [Google Scholar] [CrossRef]
  3. Alonso, G.; Del Valle, E.; Ramirez, J.R. Desalination in Nuclear Power Plants; Woodhead Publishing: Sawston, UK, 2020. [Google Scholar] [CrossRef]
  4. Terzi, R. Application of Exergy Analysis to Energy Systems. In Application of Exergy; IntechOpen: London, UK, 2018. [Google Scholar] [CrossRef]
  5. Eshun, R.B. Energy and Exergy Based Performance Analysis of Westinghouse AP1000 Nuclear Power Plant. Adv. Appl. Sci. 2019, 4, 1–10. [Google Scholar] [CrossRef]
  6. Khoshgoftar Manesh, M.H.; Amidpour, M. Multi-Objective Thermoeconomic Optimization of Coupling MSF Desalination with PWR Nuclear Power Plant Through Evolutionary Algorithms. Desalination 2009, 249, 1332–1344. [Google Scholar] [CrossRef]
  7. Khoshgoftar Manesh, M.H.; Amidpour, M.; Hamedi, M.H. Optimization of the Coupling of Pressurized Water Nuclear Reactors and Multistage Flash Desalination Plant by Evolutionary Algorithms and Thermoeconomic Method. Energy Res. 2009, 33, 77–99. [Google Scholar] [CrossRef]
  8. Ansari, K.; Sayyaadi, H.; Amidpour, M. A Comprehensive Approach in Optimization of a Dual Nuclear Power and Desalination System. Desalination 2011, 269, 25–34. [Google Scholar] [CrossRef]
  9. Ansari, K.; Sayyaadi, H.; Amidpour, M. Thermoeconomic Optimization of a Hybrid Pressurized Water Reactor (PWR) Power Plant Coupled to a Multi Effect Distillation Desalination System with Thermo-Vapor Compressor (MED-TVC). Energy 2010, 35, 1981–1996. [Google Scholar] [CrossRef]
  10. Khalid, F.; Dincer, I.; Rosen, M.A. Comparative Assessment of CANDU 6 and Sodium-Cooled Fast Reactors for Nuclear Desalination. Desalination 2016, 379, 182–192. [Google Scholar] [CrossRef]
  11. Khalid, F.; Dincer, I.; Rosen, M.A. Analysis and Assessment of a Gas Turbine-Modular Helium Reactor for Nuclear Desalination. Nucl. Eng. Radiat. Sci. 2016, 2, 031014. [Google Scholar] [CrossRef]
  12. Priego, E.; Alonso, G.; Valle, E.D.; Ramirez, R. Alternatives of steam extraction for desalination purposes using SMART reactor. Desalination 2017, 413, 199–216. [Google Scholar] [CrossRef]
  13. Al-Othman, A.; Darwish, N.N.; Qasim, M.; Tawalbeh, M.; Darwish, N.A.; Hilal, N. Nuclear desalination: A state-of-the-art review. Desalination 2019, 457, 39–61. [Google Scholar] [CrossRef]
  14. Marques, J.G.O.; Costa, A.L.; Pereira, C.; Fortini, Â. Energy and Exergy Analyses of Angra 2 Nuclear Power Plant. Radiat. Sci. 2019, 7, 1–18. [Google Scholar] [CrossRef]
  15. Binamer, A. Second law and sensitivity analysis of large ME-TVC desalination units. Desalination Water Treat. 2016, 53, 1234–1245. [Google Scholar] [CrossRef]
  16. Sayyadi, H.; Sabzaligol, T. Exergoeconomic optimization of a 1000 MW light water reactor power generation system. Energy Res. 2009, 33, 378–395. [Google Scholar] [CrossRef]
  17. Sayyaadi, H.; Sabzaligol, T. Various approaches in optimization of a typical pressurized water reactor power plant. Appl. Energy 2009, 86, 1301–1310. [Google Scholar] [CrossRef]
  18. El-Dessouky, H.T.; Ettouney, H.M. Fundamental of Salt-Water Desalination; Elsevier Science: Amsterdam, The Netherlands, 2002; ISBN 0444508104. [Google Scholar]
  19. Durmayaz, A.; Yavuz, H. Exergy analysis of a pressurized-water reactor nuclear power plant. Appl. Energy 2001, 69, 39–57. [Google Scholar] [CrossRef]
  20. Sharqawy, M.H.; Lienhard, J.H.; Zubair, S.M. Thermophysical properties of seawater: A review of existing correlations and data. Desalination Water Treat. 2010, 16, 354–380. [Google Scholar] [CrossRef]
  21. Sharqawy, M.H.; Lienhard, J.H.; Zubair, S.M. On exergy calculations of seawater with applications in desalination systems. Therm. Sci. 2011, 50, 187–196. [Google Scholar] [CrossRef]
  22. Darwish, M.A.; Al-juwayhel, F.; Abdulraheim, H.K. Multi-effect boiling systems from an energy viewpoint. Desalination 2006, 194, 22–39. [Google Scholar] [CrossRef]
  23. AL-Habshi, S. Simulation and Economic Study of the MED-TVC Units at Umm Al-Nar Desalination Plant. Master’s Thesis, UAE. 2002. Available online: https://scholarworks.uaeu.ac.ae/all_theses (accessed on 17 May 2023).
  24. Almutairi, A.; Pilidis, P.; Al-mutawa, N.; Al-weshahi, M. Energetic and exergetic analysis of cogeneration power combined cycle and ME-TVC-MED water desalination plant: Part-1 operation and performance. Appl. Therm. Eng. 2016, 103, 77–91. [Google Scholar] [CrossRef]
  25. Eshoul, N.; Almutairi, A.; Lamidi, R.; Alhajeri, H.; Alenezi, A. Energetic, Exergetic, and Economic Analysis of MED-TVC Water Desalination Plant with and without Preheating. Water 2018, 10, 305. [Google Scholar] [CrossRef]
  26. Menasri, R.; Triki, Z.; Bouaziz, M.N.; Hamrouni, B. Energy and exergy analyses of a novel multi-effect distillation system with thermal vapour compression for seawater desalination. Desalin. Water Treat. 2022, 246, 54–67. [Google Scholar] [CrossRef]
  27. AbdElhafez, S.E.; El-Shazly, A.H.; El-Maghraby, A. Improving the rate of solar heat recovery from nanofluids by using micro heat exchanger. Desalin. Water Treat. 2016, 57, 48–49. [Google Scholar] [CrossRef]
  28. Ali, A.Y.M.; El-Shazly, A.H.; Elkady, M.F.; AbdElhafez, S.E. Evaluation of Surfactants on Thermo-Physical Properties of Magnesia-Oil Nanofluid. Mater. Sci. Forum 2018, 928, 106–112. [Google Scholar] [CrossRef]
  29. AbdElhafez, S.E.; Abo-Zahhad, E.M.; El-Shazly, M.; El-Shazly, A.H.; El-Kady, M.F. Experimental Investigate of Heat Transfer for Graphene/Water Nanofluid in Micro Heat Exchanger. AIP Conf. Proc. 2017, 1814, 020014. [Google Scholar] [CrossRef]
  30. Singh, T.; Atieh, M.A.; Al-Ansari, T.; Mohammad, A.W.; McKay, G. The Role of Nanofluids and Renewable Energy in the Development of Sustainable Desalination Systems: A Review. Water 2020, 12, 2002. [Google Scholar] [CrossRef]
Figure 1. Schematic flow diagram of the hybrid PWR-ME-TVC-MED system (adapted from [14]).
Sustainability 15 08358 g001
Figure 2. Schematic flow diagram of the ME-TVC-MED desalination system (adapted from [15]).
Sustainability 15 08358 g002
Figure 3. The simplified energy balance of the PWR-ME-TVC-MED (in the units of MWth).
Sustainability 15 08358 g003
Figure 4. The simplified exergy balance of the PWR-ME-TVC-MED (in the units of MWth).
Sustainability 15 08358 g004
Figure 5. Thermodynamic efficiency and irreversibility rate for the cogeneration plant.
Sustainability 15 08358 g005
Figure 6. Rates of exergy destruction in the cogeneration plant components.
Sustainability 15 08358 g006
Table 1. Mass and energy balance equations.
EquationDescriptionEq.
B 1 = F 1 D 1 Mass balance of effect 1(4)
B i = F i + B i 1 + D i Mass balance of effects 2 to N(5)
B i = F i + 2 B i 1 + D i Mass balance of effect N + 1(6)
B i = F i + B i 1 + D i Mass balance of effects N + 2 to n(7)
X 1 = F i B i × X f Salinity balance of effect 1(8)
X i = F i B i × X f + B i 1 B i × X i 1 ,Salinity balance of effects 2 to N (9)
X i = F i B i × X f + 2 B i 1 B i × X i 1 Salinity balance of effect N + 1(10)
X i = F i B i × X f + B i 1 B i × X i 1 Salinity balance of effects N + 2 to n(11)
D 1 = 1 λ 1 [ ( S + D r ) λ s F 1 × C p ( T 1 T f ) ] The vapor generated in the first effect(12)
D i = 1 λ i [ ( D i 1 + d i 1 ) λ i 1 F i C p ( T i T f ) B i 1 C p ( T i 1 T i ) ] The amount of steam released by the second up to the Nth effects(13)
D N + 1 = 1 λ n + 1 [ ( 2 D v ) λ N F N + 1 i C p ( T N + 1 T f )
2 B N C p ( T N T N + 1 ) ]
The vapor formed in the effect N + 1(14)
D i = 1 λ i [ ( D i 1 + d i 1 ) λ i 1 F i C p ( T i T f ) B i 1 C p ( T i 1 T i ) The vapor formed in the effects (N + 2) to n(15)
d i = D i 1 C p T v , i 1 T i , λ i The amount of vapor removed from the flash boxes(16)
M c w = D n λ n C p ( T f T f w ) Cooling seawater flow rate(17)
D e v = S R a The amount of entrained steam(18)
Table 2. Temperature profiles.
EquationDescriptionEq.
Δ T = T 1 T n n 1 Temperature difference across the effects(19)
T s = T 1 + Δ T Temperature of compressed steam(20)
T v n = T n B P E Vapor temperature in the last effect(21)
T c i = T i B P E Δ T p + Δ T t Δ T c Vapor condensation temperature of effects(22)
T i + 1 = T i Δ T ,Saturated vapor temperature of effects(23)
T i = T v , i 1 N E A i Temperature of the vapor formed by flashing(24)
B P E = X b [ B + C X b ] × 10 3
  B = [ 6.71 + ( 6.34 × 10 2 × T n ) + ( 9.74 × 10 5 T n 2 ) ] 10 3
  C = [ 22.238 + ( ( 9.59 × 10 3 × T n ) + ( 9.42 × 10 5 T n 2 ) ] 10 8
Boiling point elevation (BPE)(25)
N E A i = 33 ( T i 1 T i ) 0.55 T v , i Non-equilibrium tolerance (NEAi)(26)
Table 3. Heat transfer area, heat transfer coefficient, logarithmic mean temperature difference, and latent heat steam equations.
EquationDescriptionEq.
A 1 = ( S + D r ) λ s U 1 ( T s T 1 ) The heat transfer area of the 1st effect(27)
A i = D i λ i U i ( T c , i T i ) The heat transfer area of the 1st effect(28)
A e = 2 i = 1 N A i + i = N + 1 n A i The total heat transfer area(29)
A c = D n λ n U c ( L M T D ) c The heat transfer area of the condenser(30)
U c = 1.7194 + 3.2063 × 10 2 T v , n 1.5971 × 10 5 T v , n 2                                                       + 1.9918 × 10 7 T v , n 3 The overall heat transfer coefficient of the condenser(31)
U i = 1939.4 + 1.40562 T i 0.020752 T i 2 + 0.0023186 T i 3 1000 The overall heat transfer coefficient(32)
( L M T D ) c = ( T f T s w ) ln   [ T v , n T c w T c , n T f   ] The logarithmic mean temperature difference(33)
λ s = 2501.897149 2.407064037 × T s                                                       + 1.192217 × 10 3 × T s 2                                                       1.5863 × 10 5 × T s 3 Latent heat of steam(34)
λ i = 2501.897149 2.407064037 × T i                                                       + 1.192217 × 10 3 × T i 2                                                       1.5863 × 10 5 × T i 3 Latent heat of distillate vapor(35)
Table 4. Pressure and heat capacity of water equations [18].
EquationDescriptionEq.
P s = 1000 × exp ( 3892.7 T s + 273.15 42.6776 + 9.5 ) Pressure of the compressed vapor(36)
P e v = 1000 × exp ( 3892.7 T v n + 273.15 42.6776 + 9.5 ) Pressure of the entrained vapor(37)
E R = P m P e v Expansion ratio (ER)(38)
C R = P s P e v Compression ratio (CR)(39)
R a = 0.235 P s 1.19 P e v 1.04 E R 0.015 Entrainment ratio (Ra)(40)
C p = [ a + b × T 1 + c × T 1 2 + d × T 1 3 ] × 10 3
a = 4206.8 ( 6.6197 × S ) + ( 1.2288 × 10 2 × S 2 )
b = 1.1262 + ( 5.4178 × 10 2 × S ) ( 2.2719 × 10 4 × S 2 )
c = ( 1.2026 × 10 2 ) ( 5.3566 × 10 4 × S ) + ( 1.8906 × 10 6 × S 2 )
d = ( 6.8777 × 10 7 ) + ( 1.517 × 10 6 × S ) ( 4.4268 × 10 9 × S 2 )
Heat capacity of water(41)
Table 5. Performance data of the desalination unit.
DescriptionValueUnit
Temperature difference, Δ𝑇3.57°C
Entrainment ratio, 𝑅𝑎0.806-
Expansion ratio, 𝐸𝑅6.667-
Compression ratio, 𝐶𝑅 1.953-
Distillate production, D t 334.66kg/s
GOR9.56-
Cooling water flow rate, M c w 1266.8kg/s
Specific heat consumption, q 197.83kJ/kg
Specific heat transfer area, A d 302.23m2/kg/s
Table 6. Mathematical model validation.
Desalination PlantsModelRef. [15]ModelRef. [22]ModelRef. [23]
Operating and design conditions
Number of effects n886644
Motive pressure Pm, kPa270027002800280021,00021,000
Top brine temperature T(1), °C636363636363
Minimum brine temperature T(n), °C424244444848
Temperature drop per effect, °C333.83.855
Feed seawater temperature Tf, °C373740404343
Motive steam flow rate Dm, kg/s17.5 × 217.5 × 211 × 211 × 28.5 × 28.5 × 2
TVC design
Entrainment ratio Ra0.670.980.65NA0.63NA
Expansion ratio ER17.618.717.1NA11.5NA
Compression ratio CR0.181.750.17NA1.59NA
System performance
Distillate production Dt, kg/s378.94349188.03184.38114.8127
Gain output ratio GOR10.82108.548.66.757.5
Specific heat consumption Q, kJ/kg174.71223288.3287.5280.12NA
Specific heat transfer area Ad, m2/kg/s360.09452.2221.32310217.90NA
Abbreviation: NA, not available.
Table 7. Results of the second-law analysis for the PWR-ME-TVC-MED cogeneration plant.
Actual Work (MWth)Reversible Work
(MWth)
Rate of Irreversibility (MWth)Irreversibility
Percentage
(%)
Exergy Efficiency
(%)
Steam generation section
Reactor1916.33854.71938.650.2849.98
Steam generators (SG)0147.08147.083.8192.98
Reactor coolant pumps−16.36−10.515.850.1564.18
Total 2091.5354.25
Power production section
High-pressure turbine (HPT)474.14545.6171.471.8586.91
Low-pressure turbine (LPT)889.961014.8124.843.2387.69
Re-heater (RH)020.2120.210.5277.81
Moisture separation (MS)02.752.750.0691.44
Total 219.275.64
Condensation section
Condenser (C)092.4292.422.3930.71
Total 92.422.39
Preheating section00.69106910.01727.02
LP feed water heater-101.631.630.04248.48
LP feed water heater-205.025.020.1372.54
LP feed water heater-3013.0813.080.33970.44
LP feed water heater-405.785.780.14986.66
LP feed water heater-509.899.890.25678.46
HP feed water heater-1014.2214.220.36866.27
HP feed water heater-202.712.710.0765.54
HP feed water heater-303.153.150.08234.48
Feed water tank (FWT)−9.56−5.298.270.21434.51
Feed water pumps−2.23−1.710.520.01350
Main condensate pumps 64.961.685
Intermediate insulation loop01.881.880.04896.1
Heat exchanger (EX) 1.880.048
Desalination unit
Thermo-compressor06.926.920.179
Evaporators09.999.990.25917.56
Condenser01.421.420.03621.66
Seawater Pump −0.23−0.160.1700.00455.12
Distillate pump−0.16−0.110.1330.00330
Brine pump−0.10−0.0860.0140.000362.3
Reject pump−0.085−0.0530.0620.00170
Total 18.990.4937.5
Net work output 1364.135.38
Imbalance 3.380.046
Total 3855100
Table 8. Results of the first- and second-law analysis of the cogeneration plant.
Estimated Powers from the Current StudyValueUnit
Reactor thermal power3854.7MW
Turbine work1364.1MW
Reactor coolant pump work−16.36MW
Pump work on the secondary side−13.79MW
Heat transfer by the condenser2436.54MW
Steam generator thermal power3871.1MW
Net work of the secondary side1350.31MW
Heating steam of ME-TVC-MED22.07MW
Minimum work of separation1.42MW
Total rate of the irreversibility of ME-TVC-MED 20.65MW
Total rate of irreversibility2492.17MW
Net heat input to the feed water1363MW
Total rate of irreversibility and net work of the work side3840.91MW
Rates obtained in this study
Total irreversibility rate64.51%
Thermodynamic efficiency of PWR-ME-TVC-MED35.38%
Total error rate0.046%
Exergetic efficiency of ME-TVC-MED6.43%
Disclaimer/Publisher’s Note: The statements, opinions and data contained in all publications are solely those of the individual author(s) and contributor(s) and not of MDPI and/or the editor(s). MDPI and/or the editor(s) disclaim responsibility for any injury to people or property resulting from any ideas, methods, instructions or products referred to in the content.

