Article

Experimental Study on the Seismic Behavior of a Modified Adobe-Brick-Masonry Composite Wall with a Wooden-Construction Center Column

1
College of Water Conservancy & Architectural Engineering, Shihezi University, Shihezi 832003, China
2
Xinjiang Production & Construction Groups Engineering Laboratory for Seismic and Energy-Saving Building in High Earthquake Intensity and Cold Zone, Shihezi 832003, China
*
Author to whom correspondence should be addressed.
Sustainability 2023, 15(10), 8360; https://doi.org/10.3390/su15108360
Submission received: 12 April 2023 / Revised: 14 May 2023 / Accepted: 17 May 2023 / Published: 21 May 2023
(This article belongs to the Section Green Building)

Abstract

:
Damage to adobe constructions might occur due to a long wall and a lack of effective restraint in the middle of the wall, causing it to collapse under an earthquake. Aiming at these problems, a technology for improving the seismic performance of a modified adobe-brick-masonry composite wall with a wooden-construction center column is proposed. It uses modified mud, a wooden center column, steel-wire mesh, and nylon ropes to reinforce the wall. On this basis, four specimens of composite wall and one specimen of modified adobe wall were subjected to proposed quasistatic, cyclic in-plane loading tests to study their failure modes and seismic performance indicators. The results show that the failure modes of all walls were shear failure. The difference is that the modified adobe wall had horizontal cracks in the middle, whereas the composite walls were largely intact. Moreover, the composite walls relied on the modified mud to improve the seismic bearing capacity of each wall. They relied on the center column and the tie materials to form a second line of defense that would increase the wall ductility and collapse residual area. As a result, the phenomenon that caused wall damage and stiffness degradation was lessened.

1. Introduction

In the context of global sustainable development, adobe materials are green building materials and low-energy-consuming construction materials with recyclable properties that are conducive to environmental protection and ecological balance [1,2,3]. The adobe structure composed of adobe materials is an ancient structural form and one of the important structural forms of rural buildings [4]; it is widely distributed in developing countries and also involved in developed countries [5]. However, in previous instances of earthquake damage, adobe constructions have been seriously damaged due to their low material strength and poor structural integrity, seriously threatening the safety of the lives and property of rural residents [6,7,8]. Therefore, technology for improving seismic performance levels of structures built of adobe materials has received widespread attention.
An adobe wall is the main lateral force-resistance component of adobe constructions. Improving material properties and structural measures is an effective method for enhancing seismic performance. Scholars in various countries have carried out much research on this topic. First, in exploring material modification, some scholars have studied the mechanical properties of pine needles [9], palm [10], and seagrass [11] by adding them to adobe materials for their compressive and tensile properties. Those studies showed that all three plant fibers can improve the compressive- and tensile-strength and ductility values of adobe blocks, and seagrass can improve the thermal insulation of adobe blocks. To modify adobe materials, some scholars have added recycled polyethylene fibers [12], waste paper [13], waste rubber [14,15], and other waste materials. Those researchers then obtained change patterns for the properties of the modified adobe blocks under various admixtures. Second, in terms of investigating methods for strengthening structures, some scholars have enhanced the strengths of walls by covering the exterior of the adobe wall with steel-wire mesh [16,17], steel plates [18], nylon-rope mesh [19], and other structural measures. Previous tests have shown that these strengthening materials can improve the collapse resistance of buildings. The seismic performance of adobe walls is improved using ribbed steel bars, sand-coated FRP, and sand-coated reeds through the NSM technique [20]. All three reinforcement schemes improve the seismic performance of adobe walls in terms of strength, displacement capacity, ductility, and energy dissipation, although the use of steel reinforcement is preferable. Some scholars have restrained lateral deformation of walls by setting planks [21,22]; cold-formed, thin-walled sections [23]; concrete core columns [24]; and other edge construction measures. The results of this study show that all three strengthening schemes can improve the seismic bearing capacity, ductility, and energy-dissipation capacities of walls, thus improving their seismic performance levels. In addition, some scholars have investigated the compressive properties of adobe materials by means of experiments [25] and numerical simulations [26] to establish a compressive principal model of adobe materials and a compressive damage model of adobe masonry, respectively.
To date, many scholars have focused on modification of adobe materials or improvement in structural measures; however, there are fewer studies on the effectiveness of improving seismic performance using both techniques. In addition, the research focus on improving structural measures is concentrated on wall-dressing-reinforcement technology and setting edge-restraint frames, which can improve the seismic performance of a wall to a certain extent by relying on the restraint effect on the wall. However, the restraint effect is limited when the wall is long, and this cannot effectively solve the problem of block collapse in the middle of the adobe wall under earthquake action.
Therefore, based on the starting point of improving the seismic bearing capacity of a wall with modified mud and improving the collapse resistance of a long wall with a wooden-structure column in the middle of the wall, the comprehensive performance-enhancement technology of a modified adobe-brick-masonry composite wall with a wooden-construction center column was proposed and seismic-test research with a quasistatic, cyclic in-plane loading test was carried out.
In this study, a total of four specimens of adobe-brick-masonry composite wall with different construction measures and one specimen of modified adobe-brick-masonry wall were designed. The failure characteristics of each specimen and the seismic performance indicators, such as the hysteresis curve, the skeleton curve, stiffness degradation, bearing capacity, and ductility, are compared and analyzed. The seismic working mechanism of the modified adobe-brick-masonry composite wall with a wooden-construction center column was revealed. The seismic-performance-enhancement effects of various construction measures are verified, providing a basis for new rural housing in the future.

2. Experimental Section

2.1. Test Specimens

In this study, the applications of modified mud, poplar wood, steel-wire mesh, nylon rope, and other readily available and affordable materials were suggested as technological methods for rural construction based on the practical seismic principles of localization, local resources, simplicity, and economy. According to the research of this group, these materials are widely used in actual construction of houses in rural areas. In this experiment, a total of four specimens of adobe-brick-masonry composite wall (composite wall) with various construction measures and one specimen of modified adobe-brick-masonry wall (adobe wall) were designed to examine the effects of modified mud, a wooden-construction center column, and various tying methods (steel-wire mesh or nylon rope) between the construction column and the wall on the seismic performance of the adobe-brick-masonry wall. These specimens included an eco-modified adobe-wall specimen with a middle wooden-construction column and steel-wire mesh (EAW-MS), an unmodified adobe-wall specimen with a middle wooden-construction column and steel-wire mesh (UAW-MS), an eco-modified adobe-wall specimen with a middle wooden-construction column and nylon cord (EAW-MN), an unmodified adobe-wall specimen with a middle wooden-construction column and nylon cord (UAW-MN), and an eco-modified adobe-wall specimen (EAW).
The specimens EAW-MS, UAW-MS, EAW-MN, and UAW-MN were equipped with wooden structural columns in the middle of the wall, and the wooden columns were inserted into the reserved holes of the floor beams when the specimens were made. The wood required for the test was taken from the natural poplar wood of the Zhongzhi Wood Processing Plant in Shihezi City. The width of each wood column was 240 mm and the thickness was 90 mm, according to the requirements of the Chinese code for seismic design of buildings (GB 50011-2010) [27].
The synergistic effects of the wooden-construction center column and of the walls on both sides depended on the tie measures, to a certain extent. For this reason, different details were designed for the steel-wire mesh and nylon-rope ties in this study. For the specimens EAW-MS and UAW-MS, predetermined combed joints were made in the walls on either side of the wooden columns. Then, mud was poured into the space between the walls and the columns, as shown in Figure 1b. Steel-wire mesh with a diameter of 4 mm and a spacing of 50 mm was set to tie the walls on both sides of each of the two layers of blocks along the height direction (a horizontal tie length of 500 mm). In addition, after welding of the steel-wire mesh to the reinforcement hoop, it was installed on the wooden column, as shown in Figure 1d. For the specimens EAW-MS and UAW-MS, predetermined opposite joints were made in the walls on either side of the wooden columns. Then, mud was poured in the space between the walls and the columns, as shown in Figure 1c. Nylon ropes with diameters of 3 mm were set to tie the walls of every two layers of blocks on both sides along the height direction (horizontal tie length of 500 mm). The nylon ropes were tied by winding the wooden column twice, as shown in Figure 1e. The EAW specimen was an unconstrained-structural-measurement wall. The walls of all specimens were made of adobe bricks with dimensions of 240 mm × 115 mm × 90 mm, masoned with 10 mm-thick modified mud and unmodified mud.
According to the conditions at the test site, the scale-reduction ratio of the specimens was determined to be 1/2.5, considering that the masonry structure in the wall would usually exhibit shear deformation and the aspect ratio of the specimen was designed to be 0.65. The test-specimen-specific working conditions and the specimen sizes are shown in Table 1 and Figure 1.

2.2. Material Properties

Both the adobe blocks and the unmodified mud used in this test were made with adobe materials as the main raw materials, in the suburbs of Shihezi, Xinjiang. The main components of the adobe materials are shown in Table 2. The basic physical properties, such as Atterberg limits, granulometry, and dry density, of the adobe materials were determined according to the Chinese standards for geotechnical testing methods (GB/T50123-2019) [28], as shown in Table 3. The unmodified mud was mixed with 0.3% wheat straw, according to farmers’ traditional custom. The modified mud was mixed with 10% of the total mass of modified materials (glutinous rice glue, 7%; acrylic emulsion, 0.2%; instant glue powder, 1.0%; and cellulose, 1.25%), based on the original soil, using this group’s previous research results [29]. The modified materials used were all non-polluting, enabling the adobe building to be used for crop cultivation at the end of its service life.
Compressive-strength tests (Figure 2) were performed on modified and unmodified mud according to the Chinese standards for test methods of performance on building mortar (JGJ\/T70-2009) [30]. The size of the mud test blocks was 70.7 mm × 70.7 mm × 70.7 mm, and two groups of six specimens were made. Six groups of adobe blocks with dimensions of 240 mm × 115 mm × 90 mm were selected for the compressive-strength tests (Figure 3), according to Chinese test methods for wall bricks (GB/T 2542-2012) [31]. The results of the compressive tests on mud and adobe blocks are shown in Table 4.
For the masonry shear-strength test (Figure 4), shear-test specimens were made using unmodified mud and modified mud in accordance with the Chinese standards for test methods for basic mechanical properties of masonry (GB/T 50129-2011) [32]. Each specimen was made of nine adobe blocks. A total of eight modified-masonry shear specimens and eight unmodified-masonry shear specimens were designed. The test results are shown in Table 5.

2.3. Loading Protocol and Testing Procedure
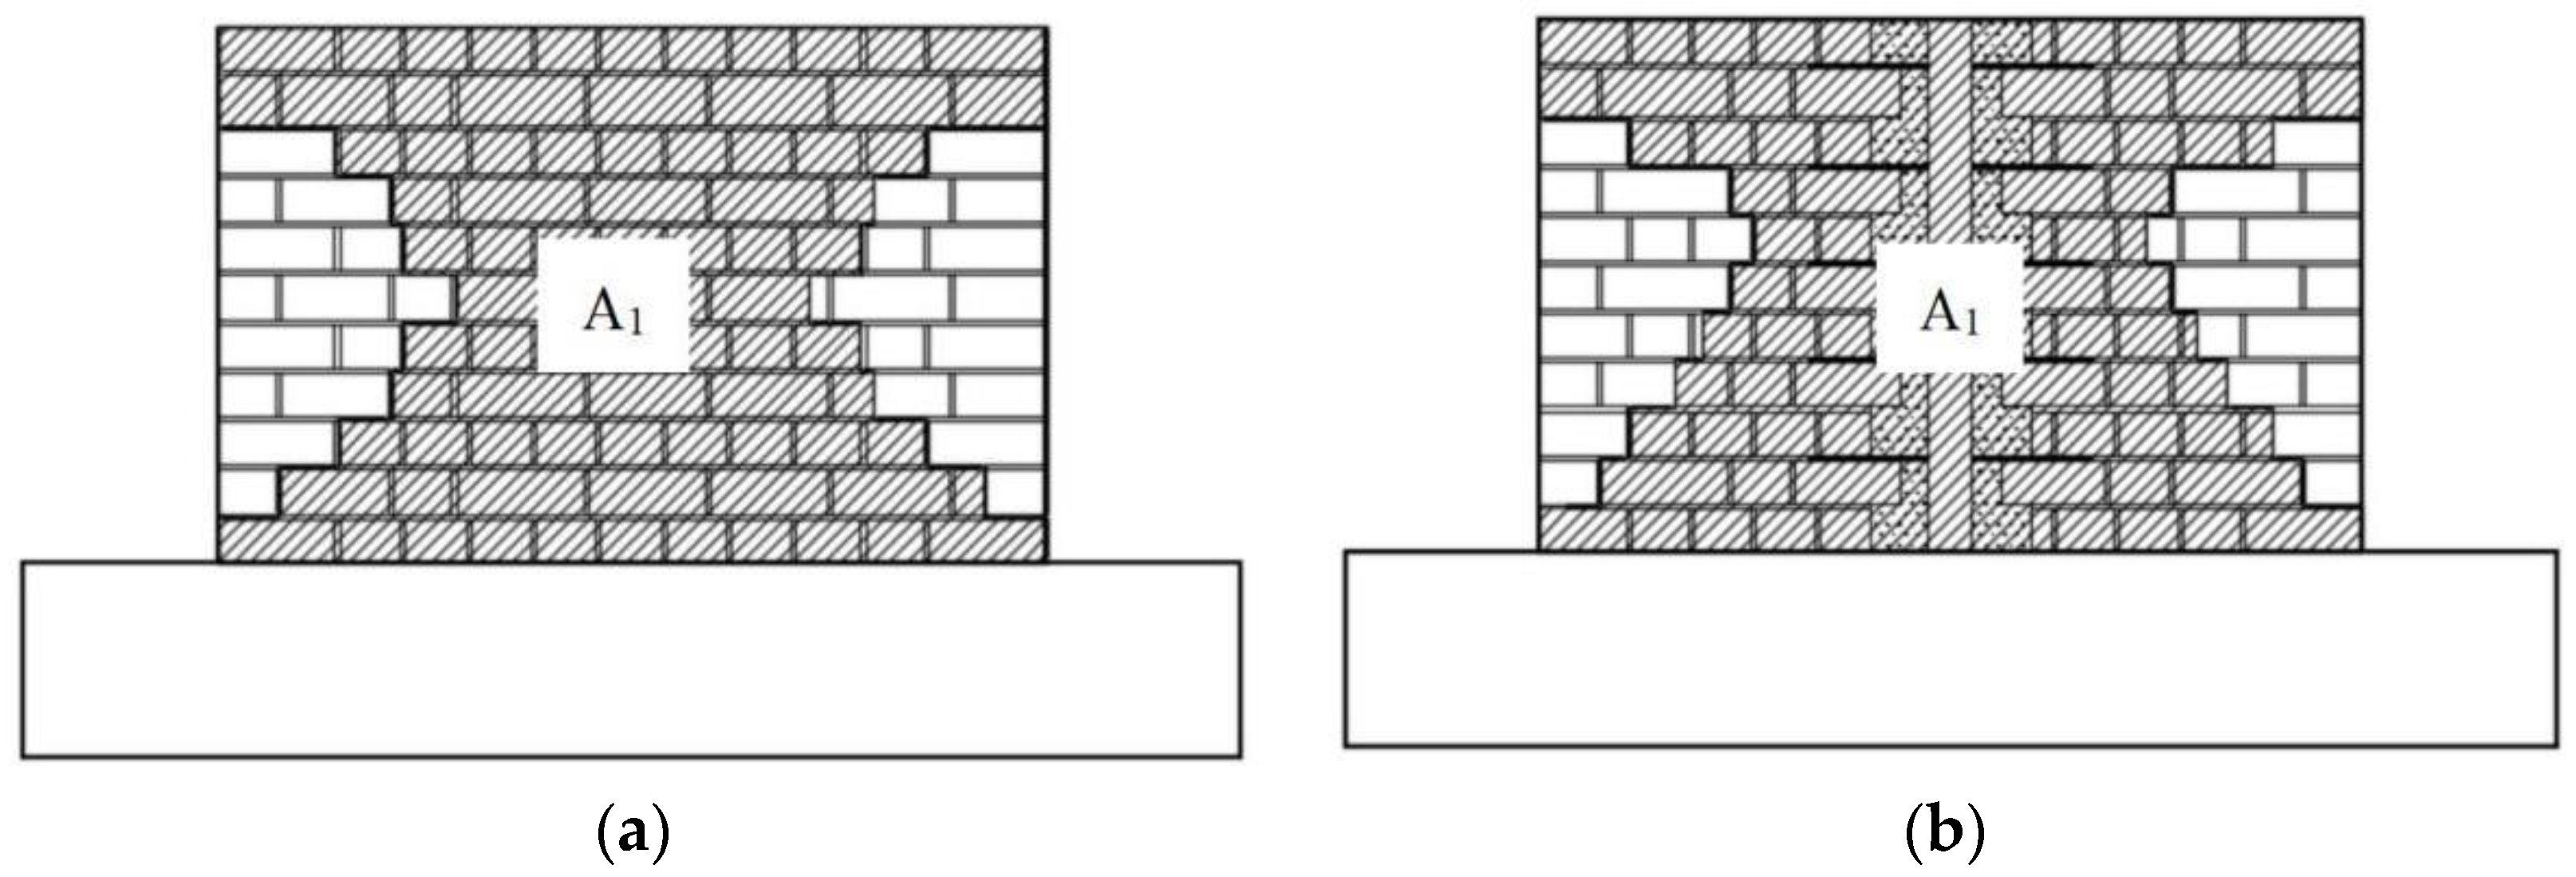
The quasistatic, cyclic in-plane loading test in this paper was carried out in the structural laboratory of Shihezi University. The loading device consisted of a horizontal loading system and a vertical loading system, as shown in Figure 5. The horizontal loading system adopted a hydraulic servo loading device (thrust of +1000 kN, tension of −600 kN) from the American MTS company to perform horizontal reciprocating loading on the specimens, and the loading point was at the center of the end of the U-type loading beam. The vertical loading system used hydraulic jacks with a range of 1000 kN, and the vertical loading point was at the center of the top rigid distribution beam, simulating the upper homogeneous wiring load.
Horizontal loading was performed using displacement-controlled loading, and the cyclic loading scheme was based on the Chinese specifications for seismic tests of buildings (JGJ/T 101-2015) [33]. Before formal loading, the specimens were preloaded to ensure that the test apparatus and the data collection system were in good working order. In the early stages of the test loading, the displacement increments were 0.5, 1, and 2 mm, and in the later stages, they were 4 and 8 mm until the wall collapsed due to stress. Figure 6 displays the particular loading technique. Because most adobe farmhouses are one-story structures, the vertical load was empirically estimated to be 0.1 MPa and the vertical load applied to the wall specimen was determined to be 36.2 kN.
The data for the five specimens were collected in the same way: mainly, collecting the lateral deformation and horizontal force of the wall. The horizontal displacements of the upper, middle, and lower portions of the wall were measured with displacement gauges 1, 2, and 3, respectively. Displacement gauge 4 measured the horizontal slip of the floor beam. The pressure sensor was installed on the vertical hydraulic jack. The measurement data from the displacement gauges and the pressure sensors was collected with the TDS-530 data-acquisition system. The specific measurement-point layout is shown in Figure 7.

3. Failure Mode

The overall collapse failure modes of the five wall specimens were relatively similar, as shown in Figure 8. In the early stages of horizontal loading, cracks first appeared at both ends of the wall. With the increase in loading, the cracks at both ends developed from the upper and lower parts of the wall along the mud joints, in a stepped manner, toward the middle to form oblique main cracks. The width of the main cracks gradually increased with the loading process. After reaching the peak load, the outer side of the oblique main crack formed a triangular area that gradually separated from the core area in the middle of the wall. From loading to the collapse stage, shear damage occurred in the composite wall specimens (EAW-MS, UAW-MS, EAW-MN, and UAW-MN), with masonry collapse in the triangular area at both ends of each wall and masonry remaining near the middle column. Shear damage occurred in the specimen of adobe wall (EAW), with masonry collapse in the triangular area at both ends and horizontal penetration cracks in the middle of the wall.
For the unconfined adobe-wall specimen EAW, at a loading displacement of 1.00 mm (θ = 1/1100), oblique cracks appeared at the upper and lower ends of the wall. A triangular area with a tendency of detachment at both ends formed at a loading displacement of 6.00 mm (θ = 1/183). As the loading displacement increased, the specimen reached the peak bearing capacity, at 15.45 mm (θ = 1/71), corresponding to a peak value of 38.40 kN. The specimen’s bearing capacity started to decline once it reached its peak value. The triangular area at both ends of the specimen separated from the main wall when the loading displacement reached 24.00 mm (θ = 1/46). At this point, a horizontal through-crack along the mud joints formed in the center of the wall, and the specimen bearing capacity fell below 85% of its peak. When the loading displacement was 32.00 mm (θ = 1/34), the bearing capacity of the specimen dropped to 50%, the wall blocks collapsed in the triangular area at both ends, and the wall was declared to have collapsed, as shown in Figure 8a. θ is the story drift ratio, i.e., the ratio of the horizontal lateral displacement value of the wall to the height of the wall.
For the composite-wall specimens EAW-MS, UAW-MS, EAW-MN, and UAW-MN, there were similar crack-development and failure processes. When the loading displacement was 1.50 mm (θ = 1/733), cracks began to appear at both ends of each of the four specimens. With the increase in loading displacement, the cracks at both ends of each of the four specimens developed obliquely and widened to form a triangular area with a tendency to detach. The four specimens showed vertical cracks along the mud joints, at the connection between the center column and the masonry, at loading displacements of 4.02 mm (θ = 1/274), 2.00 mm (θ = 1/550), 4.01 mm (θ = 1/274), and 3.00 mm (θ = 1/367). The four specimens reached their peak bearing capacities at loading displacements of 16.12 mm (θ = 1/68), 15.60 mm (θ = 1/71), 16.10 mm (θ = 1/68), and 15.80 mm (θ = 1/70), corresponding to peak loads of 41.69 kN, 33.59 kN, 37.12 kN, and 33.11 kN, respectively. When the loading displacement was 31.70 mm (θ = 1/35), 31.99 mm (θ = 1/34), 31.40 mm (θ = 1/35), and 32.07 mm (θ = 1/34), both ends of the triangular-area wall were separated from the middle-area wall. This point was at which the bearing capacities of the four specimens started to fall after reaching their peaks. At this time, the bearing capacities of all specimens were reduced to less than 85% of their peak values. When the loading displacement was 39.98 mm (θ = 1/28), 40.00 mm (θ = 1/28), 39.98 mm (θ = 1/28), and 40.12 mm (θ = 1/27), the bearing capacities of all four specimens decreased to 50%. The wall blocks collapsed in the triangular area at both ends, and each specimen collapsed, as shown in Figure 8b–e.
In general, horizontal through-cracks appeared in the central region when the adobe wall was finally damaged. The central region of each composite wall was relatively well-preserved due to the tie effect of the central column on both sides of the wall. Modified-mud-masonry walls had less crack development than unmodified-mud-masonry walls. The composite walls of the two types of different tie material had vertical through-cracks at the connection between the central column and the masonry. However, in the final failure, the steel-wire-mesh tied walls were less damaged than the central regions of the nylon-rope-tied walls.

4. Experimental Results and Discussion

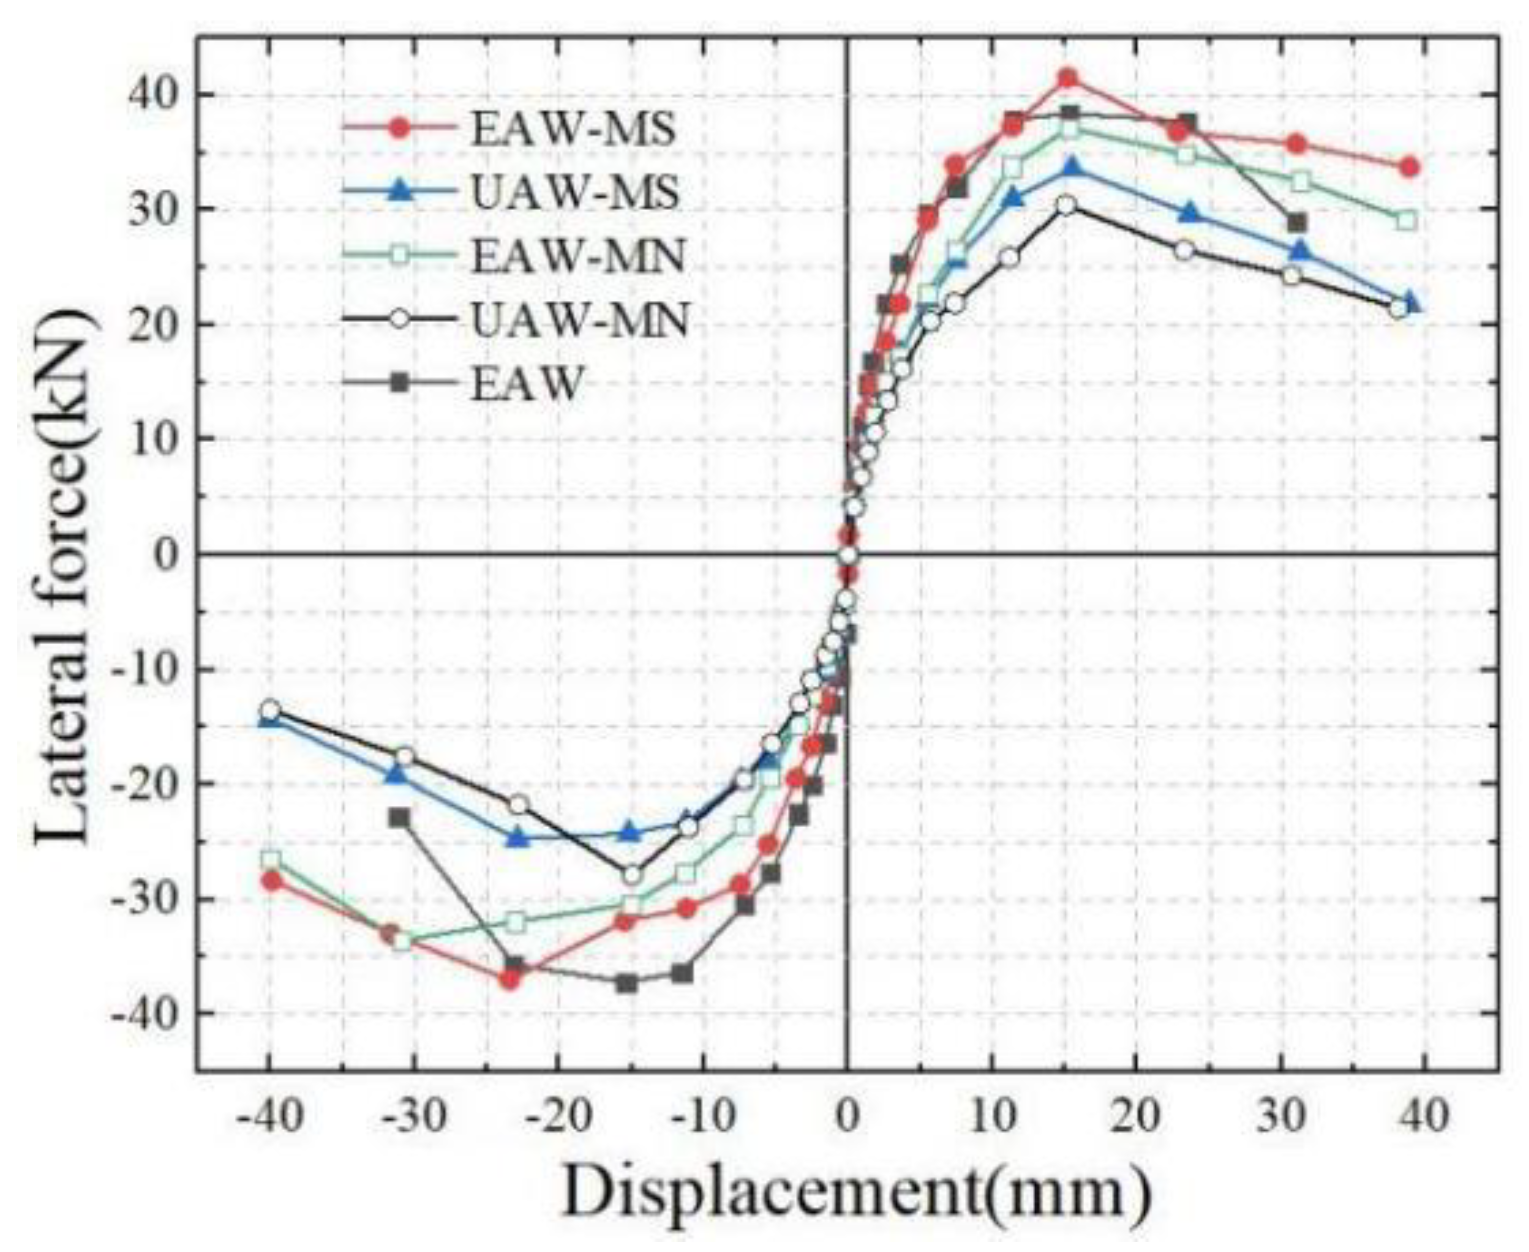
4.1. Hysteretic Performance

The hysteresis curves of the five wall specimens are shown in Figure 9. The shape of each curve was an inverse S-shape. In the early stage of loading, the hysteresis curves were all approximately straight lines. Each specimen’s ability to dissipate energy increased as the loading displacement increased. Additionally, the hysteresis loop area increased, and the bearing capacity eventually reached its peak. With a further increase in loading displacement, when the bearing capacity fell below 85% of the peak value, its fullness gradually decreased, and the energy-dissipation capacity weakened.
Due to the restraint effect of the central column, which delayed the degradation of the composite-wall bearing capacities and increased specimen ductility, the displacement of the composite-wall specimen at the characteristic points of damage and collapse was greater than that of the adobe-wall specimen. The hysteresis loop of the specimen EAW-MS was fuller than that of the specimen UAW-MS, which indicated that the modified-mud specimen had better energy-dissipation capability. By comparing the specimens EAW-MS and EAW-MN with the test phenomenon, the crack-development rate of the specimen EAW-MS was slower, indicating that the steel-wire-mesh ties were more effective in restraining the walls on both sides of the wood center column.

4.2. Skeleton Curve

The skeleton curve of each specimen could be obtained by connecting the extreme points of each load in the same direction on the hysteresis curve, as shown in Figure 10. The skeleton curves of the five specimens were roughly divided into the elastic stage, the yield stage, the failure stage, and the collapse stage. In the elastic stage, there was little difference in the stiffness of each specimen, and the curves were similar to oblique lines. After entering the yielding stage, the slope of each curve began to decrease, and the stiffness difference between each specimen increased; however, the curves were still rising. After entering the failure and collapse stage, each curve began to drop to a different degree. The yield point was found with the energy equivalence method. The failure point was defined as when the load dropped to 85% of the peak. The collapse point was defined as when the triangular area on both sides was disconnected from the central main wall. Table 6 displays the load levels for each specimen’s characteristic spots.
The slope of the initial curve of the composite-wall specimen EAW-MS was slightly lower than that of the adobe-wall specimen EAW, which was caused by the differences in properties between the central structural column and the masonry material. The slopes of the curves of the two specimens were basically the same after entering the yielding stage, and the peak load capacity of the specimen EAW-MS was increased by 9% relative to that of the specimen EAW. After entering the failure stage, the curve of the specimen EAW-MS decreased more smoothly than that of EAW. Combined with the experimental phenomenon, the restraining effect of the middle column on the wall slowed the degradation of the wall’s bearing capacity. When the wall collapsed in the triangular area at both ends, the middle column tied the wall as the second line of defense to continue to bear the earthquake’s shear force. The initial curve slope of the specimen EAW-MS was larger than that of the specimen EAW-MN, and the peak bearing capacity increased by 12.3%, indicating that the steel-wire-mesh tied walls had high bearing capacities. The bearing capacity of specimen EAW-MS was increased by 24.1% relative to that of the specimen UAW-MS, indicating that modified mud could effectively improve the seismic bearing capacities of walls by increasing block-bond strength.

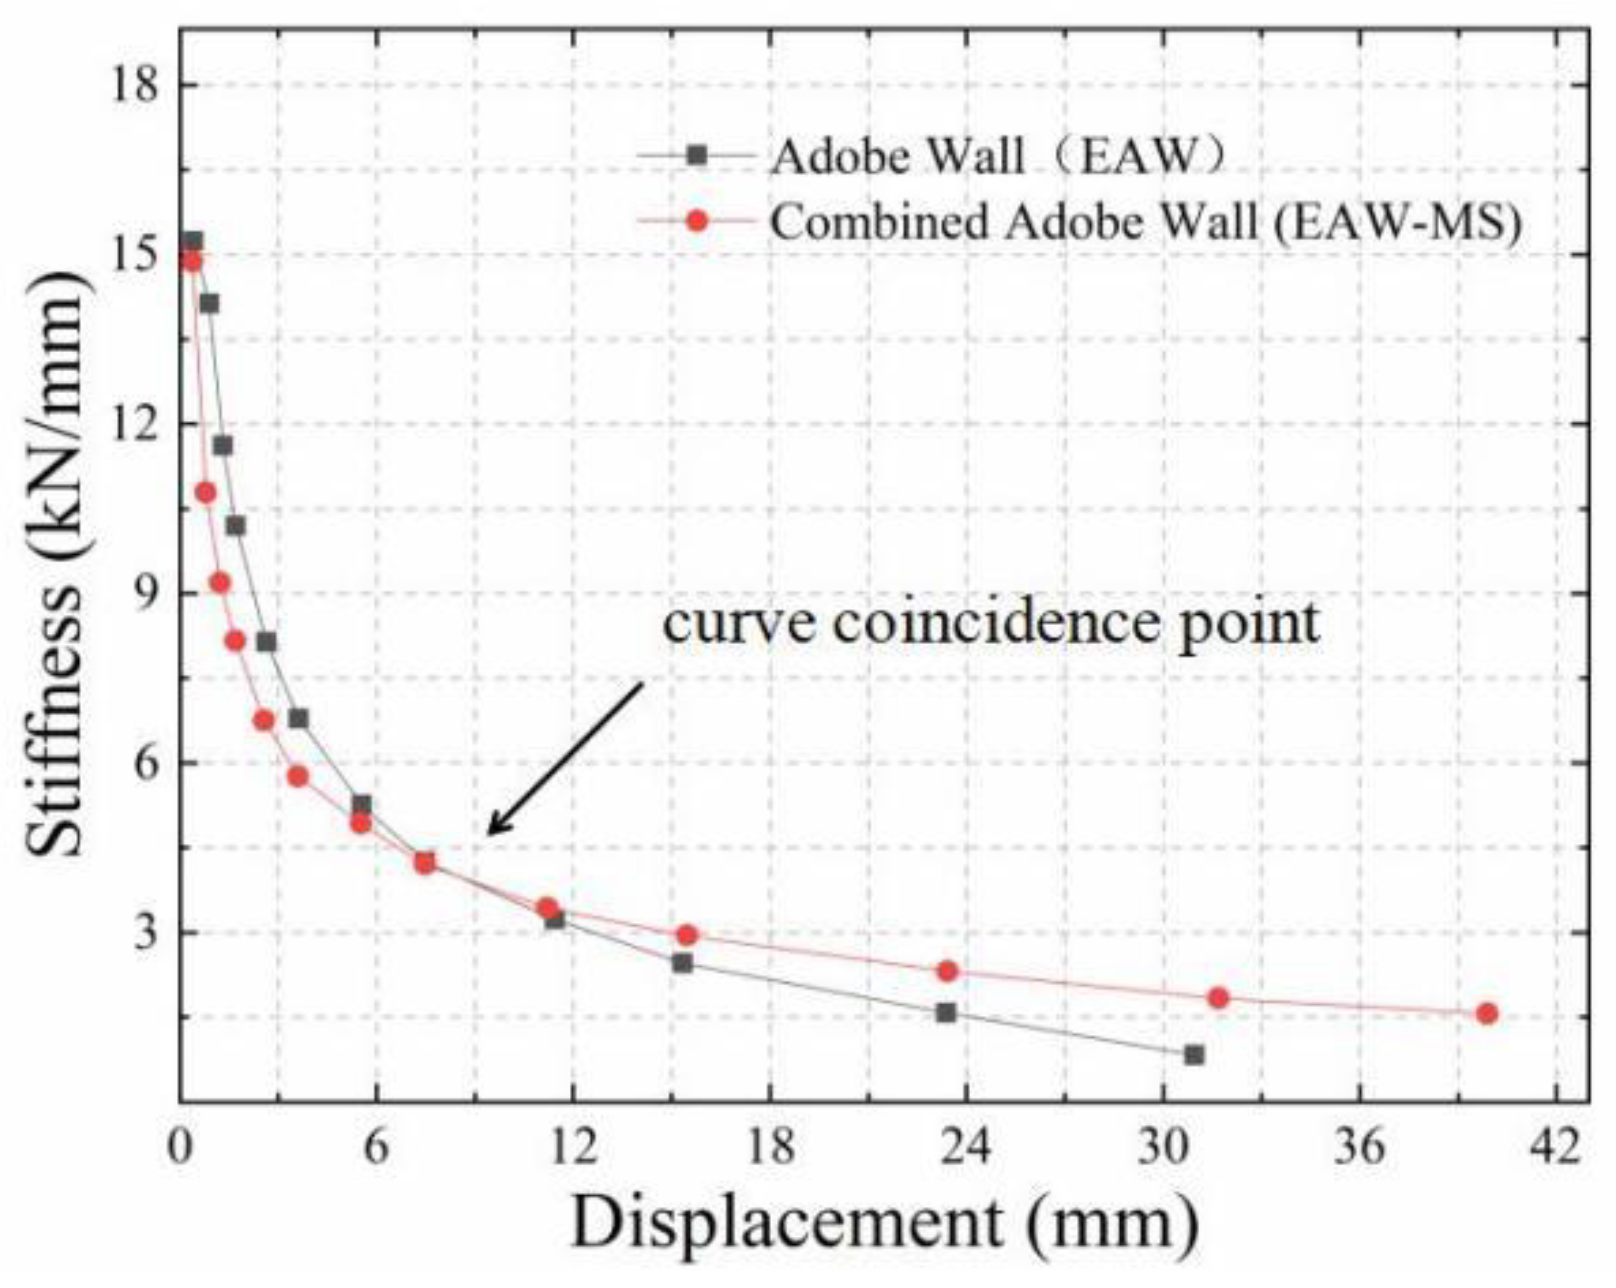
4.3. Stiffness Degradation Curve

The stiffness degradation curves of the five specimens are shown in Figure 11. The initial stiffness of the adobe-wall specimen EAW was slightly higher than that of the composite-wall specimen EAW-MS because the composite wall was divided into two independent parts by the wooden column in the middle of the wall. In the elastic and yielding stages, the stiffness degradation rates of the two specimens were essentially the same; however, the stiffness degradation rate of the composite-wall specimen EAW-MS was much slower once it entered the failure stage. This finding suggests that the wooden middle column tied the walls on both sides to slow the stiffness degradation of the composite wall. In the elastic and yielding stages, the stiffness degradation rates of the composite-wall specimens were slightly higher than those of the adobe-wall specimen; however, after entering the yield and failure stages, the stiffness degradation rate of the composite-wall specimen EAW-MS was slower than that of the adobe-wall specimen EAW. This finding suggests that the wooden middle column tied the walls on both sides to slow the stiffness degradation of the composite wall. The modified mud could increase initial stiffness and slow stiffness deterioration of adobe walls, as shown by specimen EAW-MS, which had a higher initial stiffness and a slower rate of stiffness degradation than the UAW-MS specimen. The stiffness degradation rate of the specimen EAW-MS was slower than that of the specimen EAW-MN, which indicates that the steel-wire mesh had a stronger tensile effect and slowed the stiffness degradation of the specimen more.

4.4. Displacement and Ductility

To further analyze the deformation capacities of the walls, the displacement values and ductility coefficients at the characteristic points of each specimen are summarized in Table 6 and Table 7, where yield displacement was found with the energy equivalent method. The ductility coefficient of each specimen was calculated with Equation (1):
μ = Δ u Δ y
where μ refers to the displacement-ductility coefficient of the specimen, Δu refers to the failure displacement of the specimen (mm), and Δy refers to the yield displacement of the specimen (mm).
As seen from Table 7 and Table 8, the story-drift-ratio and displacement values of the composite-wall specimens were slightly larger than those of the adobe-wall specimens in the early stage of loading; however, the difference was not large. The story drift ratio of all the composite wall specimens increased significantly after entering the damage stage: approximately 24% higher than that of the adobe-wall specimen. The composite-wall specimens EAW-MS, EAW-MN, UAW-MS, and UAW-MN had low ductility coefficients that decreased in that order; however, they were all larger than that of the adobe-wall specimen EAW. The steel-wire mesh tied the wood center column–modified adobe-wall specimen EAW-MS with a ductility coefficient of 3.81, which was 35.1% higher than that of the specimen EAW. This mesh had the most significant improvement in wall deformation ability. This finding suggests that the composite walls had good deformation capacities.

4.5. Wall-Collapse Residual Area and Energy-Dissipation Capacity

4.5.1. Wall-Collapse Residual Facade Area

Due to the low shear strengths of adobe-brick-masonry walls, they are prone to block-scattering damage in earthquakes. Especially when walls are long and unrestrained, they are more likely to collapse over a large area. Therefore, it is important to assess the collapse of a wall after an earthquake [34]. The previous test phenomenon and analysis of seismic performance indicators show that the wooden structural column proposed in this paper could effectively improve this situation. To evaluate the improvement effects of different restraint measures, the collapse residual facade area (the facade area of the residual wall in the central region after the collapse of the wall in the triangular region on both sides) was used in this paper for evaluation, as shown in the shaded parts in Figure 12. The residual facade area facilitated visual observation of the residual part of the wall after it entered the collapse stage. A larger residual area indicated a stronger restraint capacity of the central structural measures and a higher collapse resistance of the structure under seismic effects.
The collapse residual areas of the five specimens are listed in Table 9. Each wall had a residual area at the point of collapse that was less than half of its initial size; however, the collapse residual areas of the four composite-wall specimens were larger than that of the adobe-wall specimen. The collapse residual areas of the specimens EAW-MS and UAW-MS comprised a maximum value of approximately 40%, which was an improvement of approximately 20% over the specimen EAW; however, the collapse residual areas of the specimens EAW-MN and UAW-MN were only slightly better than that of the specimen EAW, at approximately 8.5%. When compared to the unmodified-mud-masonry walls, the collapse residual areas of the modified-mud-masonry walls only improved by approximately 3%. This finding shows that composite walls could display improved collapse resistance under a strong earthquake, the steel-wire-mesh ties were slightly better than the nylon-rope ties, and the modified mud contributed less to collapse resistance, which mainly depended on the strengths of the ties between the central structural column and the wall.

4.5.2. Energy-Dissipation Capacity

In this paper, the energy-consumption coefficient, E, and the equivalent viscous-damping coefficient, ζ, were used to compare the energy consumption of each wall.
E = S ( ABC + C D A ) S ( Δ OBE + Δ O D F )
ζ = 1 2 π · S ( ABC + C D A ) S ( Δ OBE + Δ O D F )
where S(ABC + CDA) is the area of the hysteresis curve and S(ΔOBE + ΔODF) is the sum of the areas of ΔOBE and ΔODF, as shown in Figure 13.
The curves of the energy-dissipation and damping coefficients for each specimen, as seen in Table 10 and Figure 14, typically showed upward and then downward tendencies. However, the curve for the adobe-wall specimen had a smooth development trend in the later stage of loading. It is evident that at each force stage, the composite-wall specimens’ energy-dissipation coefficients and corresponding viscous-damping coefficients were, on average, lower than those of the adobe-wall specimen that was unconfined. The difference between the energy-dissipation capacities of the two types of wall at the yield and peak points was small, but it increased at the failure point. At that time, the energy-dissipation capacity of the composite-wall specimen was about 75% of that of the adobe-wall specimen. The reason for this phenomenon was that the energy-dissipation capacities of the walls were mainly related to the development of cracks. In the early stage of loading, the cracks of the two types of wall were mainly concentrated in the adobe-block masonry at both ends, and the difference in the degrees of damage between the two types of wall was not large. After this stage, the adobe blocks and masonry at both ends basically stopped working, and the middle column of the composite wall reduced the damage degree of the middle wall and its energy consumption; however, the energy-consumption reserve in the later collapse stage was higher. The modified-mud-masonry specimens (EAW, EAW-MS, and EAW-MN) had higher energy-dissipation capacities in the early stage of loading, which was 10% higher than the unmodified-mud-masonry specimens (UAW-MS and UAW-MN). The reason for this phenomenon was that the shear strength of the modified mud was higher, and the frictional energy-dissipation capacities of the mud joint between the adobe blocks during the earthquake were stronger.

4.6. Seismic Mechanism of Composite Walls

The results of this study show that the seismic bearing capacity of the modified-mud-masonry wall was increased by 24% compared to the nonmodified-mud-masonry wall. The proposed practice in this paper of adding wooden structural columns and steel-wire-mesh ties (EAW-MS) in the middles of the longer walls of conventional adobe structures improved the seismic bearing capacity of the modified adobe wall (EAW) by only 9%. However, the wooden structural columns limited the development of through-masonry shear cracks, and the tie to the wall substantially improved the wall ductility and the collapse residual facade area by about 35% and 20%, respectively. It could be seen that the composite wall of modified adobe blocks and masonry, with columns of wood construction (steel-wire mesh), achieved overall improvements in seismic bearing capacity, ductility, collapse resistance, and other comprehensive seismic performances compared to the unmodified and unconfined adobe wall.
Figure 15 shows a comparison of the stiffness degradation curves of the composite wall (EAW-MS) and the adobe wall (EAW). When the loading was small, the stiffnesses of the two specimens were close to each other. The initial stiffness of the composite wall was slightly lower than that of the adobe wall due to the arrangement of the central structural column, and its stiffness degradation rate was slightly faster. As the loading gradually increased after the wall damage developed, the wooden structural columns gradually participated in bearing the seismic shear, and the stiffness gap between the two types of wall decreased. After loading to 7.5 mm (the curve coincidence point), the stiffness of the composite wall began to exceed that of the adobe wall, and its degradation rate was slow. The stiffness degradation curve was smooth and its curve length was long, indicating that it reached the collapse stage at a relatively late time.
As seen, the modified adobe-block-masonry wall, which could be thought of as the first line of defense, would carry the majority of the horizontal seismic shear force during the elastic stages of small earthquakes. However, during the medium- and large-earthquake elastic-plastic stages, the contribution of the adobe blocks and masonry to the stiffness of the composite wall gradually decreased. As a second line of defense at that time, the wooden structural column gradually contributed to bearing the seismic shear stress, and the percentage of this bearing increased with the severity of the wall damage. The degree and extent of the tie material’s constraint on the wall determined how the composite-wall bearing capacity and stiffness degraded.

5. Conclusions

In this paper, the comprehensive performance-enhancement technology of a modified adobe-brick-masonry composite wall with a wooden-construction center column was proposed. An experimental study of five specimens was conducted to investigate the seismic behavior of adobe walls. The following main conclusions were drawn:
  • The five walls in this study all had shear damage, with cracks extending along the mud joints. Eventually, the triangular area outside the main crack collapsed, and each wall collapsed after the widening of the oblique step of the main crack. The difference is that horizontal through-cracks formed in the middle area of the unrestrained adobe-masonry wall, while the middle areas of the composite walls with wood-structure center-column restraint were better preserved.
  • The adobe wall reinforced with modified mud masonry and steel-wire-mesh ties in wooden structures had the highest overall performance improvement in seismic and collapse resistance. The adobe wall reinforced with modified mud masonry and steel-wire-mesh ties in wooden structures had the highest overall performance improvement in seismic and collapse resistance. Its seismic bearing capacity, ductility, and collapse residual facade area were improved by 24%, 35%, and 20%, respectively, relative to the unmodified, unconfined adobe wall. Its seismic bearing capacity was improved by 12% relative to the walls that used nylon rope as the tie material in conventional adobe construction.
  • The working mechanism of the modified adobe-brick-masonry composite wall with a wooden-construction center column (steel-wire mesh) is as follows: The horizontal seismic shear is primarily supported by the modified adobe brick masonry during the stage of a small earthquake. After entering the medium- and large-earthquake elastic–plastic stages, the wood-structure column, as the second line of defense, gradually participates in bearing the seismic shear, and its proportion of bearing the seismic shear increases with the increase of the damage degree of the wall.

Author Contributions

Conceptualization, H.W. and K.Y.; data curation, S.Z.; supervision, K.Y.; validation, S.Z.; visualization, J.G.; software, J.G.; writing—original draft, H.W.; writing—review and editing, K.Y.; funding acquisition, K.Y. All authors have read and agreed to the published version of the manuscript.

Funding

This research was funded by the National Key Research and Development Program of China, grant number 2018YFD1100402-03, and the Science and Technology Leading Talent Program of Young and Middle-Aged Corps, grant number 2020CB033.

Institutional Review Board Statement

Not applicable.

Informed Consent Statement

Not applicable.

Data Availability Statement

Not applicable.

Conflicts of Interest

The authors declare no conflict of interest.

References

  1. Silveira, D.; Varum, H.; Costa, A.; Neto, C. Survey of the Facade Walls of Existing Adobe Buildings. Int. J. Arch. Herit. 2016, 10, 867–886. [Google Scholar] [CrossRef]
  2. Salih, M.M.; Osofero, A.I.; Imbabi, M.S. Critical review of recent development in fiber reinforced adobe bricks for sustainable construction. Front. Struct. Civ. Eng. 2020, 14, 839–854. [Google Scholar] [CrossRef]
  3. Banadaki, H.M.; Eslami, A.; Ronagh, H. Near-surface-mounted retrofitting of damaged/undamaged adobe walls using steel bars: Analytical evaluation of experimental results. Structures 2020, 28, 2111–2121. [Google Scholar] [CrossRef]
  4. Costa, C.; Cerqueira, A.; Rocha, F.; Velosa, A. The sustainability of adobe construction: Past to future. Int. J. Arch. Herit. 2019, 13, 639–647. [Google Scholar] [CrossRef]
  5. Abdulla, K.F.; Cunningham, L.S.; Gillie, M. Out-of-plane strengthening of adobe masonry using hemp fibre ropes: An experimental investigation. Eng. Struct. 2021, 245, 112931. [Google Scholar] [CrossRef]
  6. Momin, S.; Lovon, H.; Silva, V.; Ferreira, T.M.; Vicente, R. Seismic Vulnerability Assessment of Portuguese Adobe Buildings. Buildings 2021, 11, 200. [Google Scholar] [CrossRef]
  7. Dominguez-Santos, D.; Bravo, A.M. Structural and mechanical performance of adobe with the addition of high-density polyethylene fibres for the construction of low-rise buildings. Eng. Fail. Anal. 2022, 139, 106461. [Google Scholar] [CrossRef]
  8. Preciado, A.; Santos, J.C.; Silva, C.; Ramírez-Gaytán, A.; Falcon, J.M. Seismic damage and retrofitting identification in unreinforced masonry Churches and bell towers by the september 19, 2017 (Mw = 7.1) Puebla-Morelos earthquake. Eng. Fail. Anal. 2020, 118, 104924. [Google Scholar] [CrossRef]
  9. Jove-Sandoval, F.; Barbero-Barrera, M.M.; Medina, N.F. Assessment of the mechanical performance of three varieties of pine needles as natural reinforcement of adobe. Constr. Build. Mater. 2018, 187, 205–213. [Google Scholar] [CrossRef]
  10. Eslami, A.; Mohammadi, H.; Banadaki, H.M. Palm fiber as a natural reinforcement for improving the properties of traditional adobe bricks. Constr. Build. Mater. 2022, 325, 126808. [Google Scholar] [CrossRef]
  11. Olacia, E.; Pisello, A.L.; Chiodo, V.; Maisano, S.; Frazzica, A.; Cabeza, L.F. Sustainable adobe bricks with seagrass fibres. Mechanical and thermal properties characterization. Constr. Build. Mater. 2020, 239, 117669. [Google Scholar] [CrossRef]
  12. Bertelsen, I.M.G.; Belmonte, L.J.; Fischer, G.; Ottosen, L.M. Influence of synthetic waste fibres on drying shrinkage cracking and mechanical properties of adobe materials. Constr. Build. Mater. 2021, 286, 122738. [Google Scholar] [CrossRef]
  13. Rafi, M.M.; Khan, M.S.; Rais, A.; Ahmed, S. Experimental assessment of proposed seismic strengthening scheme for adobe structures. Adv. Struct. Eng. 2022, 25, 3044–3058. [Google Scholar] [CrossRef]
  14. Faghih, K.F.; Kabir, M.Z. The effectiveness of rubber short fibers reinforcing on mechanical characterization of clay adobe elements under static loading. Eur. J. Environ. Civ. Eng. 2022, 26, 2088–2119. [Google Scholar] [CrossRef]
  15. Khorasani, F.F.; Kabir, M.Z. Experimental study on the effectiveness of short fiber reinforced clay mortars and plasters on the mechanical behavior of adobe masonry walls. Case Stud. Constr. Mat. 2022, 16, e00918. [Google Scholar] [CrossRef]
  16. Munoz, P.; Letelier, V.; Munoz, L.; Bustamante, M.A. Adobe bricks reinforced with paper & pulp wastes improving thermal and mechanical properties. Constr. Build. Mater. 2020, 254, 119314. [Google Scholar] [CrossRef]
  17. Moeini, M.E.; Razavi, S.A.; Yekrangnia, M.; Pourasgari, P.; Abbasian, N. Cyclic performance assessment of damaged unreinforced masonry walls repaired with steel mesh reinforced shotcrete. Eng. Struct. 2022, 253, 113747. [Google Scholar] [CrossRef]
  18. Ruiz, D.M.; Reyes, J.C.; Bran, C.; Restrepo, M.; Alvarado, Y.A.; Barrera, N.; Laverde, C.; Suesca, D. Flexural behavior of rammed earth components reinforced with steel plates based on experimental, numerical, and analytical modeling. Constr. Build. Mater. 2022, 320, 126231. [Google Scholar] [CrossRef]
  19. Tarque, N.; Blondet, M.; Vargas-Neumann, J.; Yallico-Luque, R. Rope mesh as a seismic reinforcement for two-storey adobe buildings. Bull. Earthq. Eng. 2022, 20, 3863–3888. [Google Scholar] [CrossRef]
  20. Eslami, A.; Zahedi, A.; Banadaki, H.M. In-plane seismic behavior of NSM strengthened adobe walls: Experimental evaluation of different reinforcements. Eng. Struct. 2021, 246, 113016. [Google Scholar] [CrossRef]
  21. Reyes, J.C.; Galvis, F.A.; Yamin, L.E.; Gonzalez, C.; Sandoval, J.D.; Heresi, P. Out-of-plane shaking table tests of full-scale historic adobe corner walls retrofitted with timber elements. Earthq. Eng. Struct. Dyn. 2019, 48, 888–909. [Google Scholar] [CrossRef]
  22. Aranguren, J.; Vieux-Champagne, F.; Duriez, M.; Aubert, J.E. Experimental analysis of timber inclusions effect on paraseismic behavior of earth masonry walls. Eng. Struct. 2020, 212, 110429. [Google Scholar] [CrossRef]
  23. Zhang, J.F.; Pang, S.Y.; Gao, J.W.; Deng, E.F.; Wang, H.; Zhao, J.J. Experimental study on seismic behaviour of adobe wall reinforced with cold-formed thin-walled steel. Thin-Walled Struct. 2020, 147, 106493. [Google Scholar] [CrossRef]
  24. Zhou, T.G.; Wang, X.; Ma, B.; Zhang, Z.Y.; Tan, W. Seismic performance of new adobe bricks masonry: Design and experiment. Adv. Struct. Eng. 2022, 25, 277–289. [Google Scholar] [CrossRef]
  25. Illampas, R.; Ioannou, I.; Charmpis, D.C. Adobe bricks under compression: Experimental investigation and derivation of stress–strain equation. Constr. Build. Mater. 2014, 53, 83–90. [Google Scholar] [CrossRef]
  26. Piani, T.L.; Weerheijm, J.; Koene, L.; Sluys, L.J. The Adobe delta damage model: A locally regularized ratedependent model for the static assessment of soil masonry bricks and mortar. Eng. Fract. Mech. 2019, 206, 114–130. [Google Scholar] [CrossRef]
  27. GB 50011-2010; Code for Seismic Design of Buildings. China Architecture and Building Press: Beijing, China, 2010.
  28. GB/T50123-2019; Standard for Geotechnical Testing Method. China Architecture and Building Press: Beijing, China, 2010.
  29. Liu, J.; Yuan, K.; Zhang, S.F.; Chen, N. Ecological Modification Formula of Raw Soil Masonry Mud. Bull. Chin. Ceram. Soc. 2023, 42, 496–508. [Google Scholar] [CrossRef]
  30. JGJ\/T70-2009; Standard for Test Method of Performance on Building Mortar. China Architecture and Building Press: Beijing, China, 2009.
  31. GB/T 2542-2012; Test Methods for Wall Bricks. Standards Press of China: Beijing, China, 2012.
  32. GB/T 50129-2011; Standard for Test Method of Basic Mechanics Properties of Masonry. China Architecture and Building Press: Beijing, China, 2011.
  33. JGJ/T 101-2015; Specification for Seismic Test of Buildings. China Architecture and Building Press: Beijing, China, 2015.
  34. Zhang, Z.H.; Cao, F.; Yang, J.Y.; He, Z.G. Experiment on Natural Frequency Change of Reinforced Concrete Members under Low Cycle Loading. Shock. Vib. 2018, 17, 6504519. [Google Scholar] [CrossRef]
Figure 1. Wall models: (a) EAW, (b) EAW-MS/UAW-MS, (c) EAW-MN/UAW-MN, (d) tie method (EAW-MS/UAW-MS), and (e) tie method (EAW-MN/UAW-MN).
Sustainability 15 08360 g001
Figure 2. Compressive-strength test of the mud test block.
Sustainability 15 08360 g002
Figure 3. Compressive-strength test of the adobe block.
Sustainability 15 08360 g003
Figure 4. Shear-strength test of masonry.
Sustainability 15 08360 g004
Figure 5. Test setup and instrumentation. (a) Schematic of the test setup: 1. Reaction wall; 2. Sliding roller; 3. Vertical jacks; 4. Vertical force sensor; 5. Distribution beam; 6. Tie rod; 7. Splint; 8. Wall; 9. Ground anchor bolts; 10. Floor beams; 11. MTS. (b) Test site.
Sustainability 15 08360 g005
Figure 6. Loading scheme.
Sustainability 15 08360 g006
Figure 7. Layout of displacement gauge.
Sustainability 15 08360 g007
Figure 8. Collapse failure modes of specimens: (a) EAW, (b) EAW−MS, (c) UAW−MS, (d) EAW−MN, and (e) UAW−MN.
Sustainability 15 08360 g008
Figure 9. Hysteretic curve of each specimen: (a) EAW, (b) EAW−MS, (c) UAW−MS, (d) EAW−MN, and (e) UAW−MN.
Sustainability 15 08360 g009
Figure 10. Skeleton curve of each specimen.
Sustainability 15 08360 g010
Figure 11. Stiffness degradation curve of each specimen.
Sustainability 15 08360 g011
Figure 12. Schematic diagram of wall residual-area calculation: (a) adobe wall and (b) composite wall.
Sustainability 15 08360 g012
Figure 13. Calculation diagram of each coefficient.
Sustainability 15 08360 g013
Figure 14. Curves of the energy-dissipation coefficients and damping coefficients at characteristic points of each specimen.
Sustainability 15 08360 g014
Figure 15. Composite-wall and adobe-wall stiffness degradation curves.
Sustainability 15 08360 g015
Table 1. Working conditions of the specimens.
No.Construction TypeMud TypeOriginal Size
(mm)
Specimen Size
(mm)
Scale Reduction RatioAspect Ratio
EAWNoneModified2750 × 4250 × 6001100 × 1700 × 2401/2.50.65
EAW-MSCenter column, combed joint, and steel-wire meshModified
UAW-MSUnmodified
EAW-MNCenter column, opposite joint, and nylon ropeModified
UAW-MNUnmodified
Table 2. Main components of soil.
Chemical CompositionSiO2Al2O3CaOFe2O3MgOK2ONa2OTiO2
Content (%)59.4917.47.585.3933.92.891.790.678
Table 3. Basic physical properties of adobe materials.
Atterberg LimitGranulometryMaximum
Dry Density
(g∙cm−3)
Dry Density
(g∙cm−3)
Optimal Water Content
(%)
LL (%)PL (%)PI (%)Clay (%)
d < 5 μm
Silt (%)
5 μm ≤ d ≤ 75 μm
Sand (%)
75 μm ≤ d ≤ 4500 μm
36.323.512.81939422.041.6623
LL = liquid limit; PL = plastic limit; and PI = plasticity index. Dry density is the density measured when a formed maximum-dry-density specimen is placed in an oven at a temperature of 65–70 °C and baked to a constant weight.
Table 4. Test values of test-block compressive strength.
Mean Value (MPa)Standard Deviation
Modified Mud2.8030.1944
Unmodified Mud2.2050.2011
Adobe Block2.3700.0870
Table 5. Masonry shear-strength test values.
Mean Value (MPa)Standard Deviation
Modified Mud0.03760.0033
Unmodified Mud0.02790.0028
Table 6. Load values at the characteristic points of each specimen.
No.Load Value/kN
Yield PointPeak PointFailure PointCollapse Point
EAW33.4838.4028.7521.01
EAW-MS34.6441.6930.1921.31
UAW-MS27.0733.5926.3816.71
EAW-MN28.1037.1226.5818.79
UAW-MN23.1333.1124.2317.01
Table 7. Displacement values at the characteristic points of each specimen.
No.Yield PointPeak PointFailure PointCollapse Point
Δ/mmθΔ/mmθΔ/mmθΔ/mmθ
EAW8.471/13015.451/7124.001/4632.001/34
EAW-MS8.281/13316.121/6831.701/3539.981/28
UAW-MS8.531/12915.601/7131.991/3440.001/28
EAW-MN8.241/13316.101/6831.401/3539.981/28
UAW-MN8.571/12815.801/7032.071/3440.121/27
Table 8. Displacement-ductility coefficient of each specimen.
No.DirectionYield Displacement
Δy/mm
Failure Displacement
Δu/mm
Ductility Coefficient
μ
Average Value of Ductility Coefficient
μ ¯
EAW+8.4724.002.832.82
8.5323.902.80
EAW-MS+8.2831.703.833.81
8.4532.013.79
UAW-MS+8.5331.993.753.76
8.4932.003.77
EAW-MN+8.2431.403.813.79
8.4932.083.78
UAW-MN+8.5732.073.743.72
8.6732.003.69
“+” for push side; “−” for pull side.
Table 9. Proportions of residual area of each specimen.
No.Wall Height
H/m
Wall Length
L/m
Original Area
A0/m2
Residual Area
A1/m2
A1/A0
EAW1.11.71.870.63834.12%
EAW-MS1.11.71.870.78141.75%
UAW-MS1.11.71.870.75440.31%
EAW-MN1.11.71.870.69437.10%
UAW-MN1.11.71.870.67936.32%
Table 10. Energy-dissipation coefficient and damping coefficient of each specimen.
Stressing StageEAWEAW-MSUAW-MSEAW-MNUAW-MN
EYield Point0.880.890.790.840.77
Peak Point0.970.940.850.920.89
Failure Point0.970.730.730.710.72
ζ Yield Point0.1400.1420.1260.1340.123
Peak Point0.1540.1500.1350.1460.142
Failure Point0.1540.1160.1170.1130.115
Disclaimer/Publisher’s Note: The statements, opinions and data contained in all publications are solely those of the individual author(s) and contributor(s) and not of MDPI and/or the editor(s). MDPI and/or the editor(s) disclaim responsibility for any injury to people or property resulting from any ideas, methods, instructions or products referred to in the content.

