Abstract
Disaster is a general term for events that result in physical, economic, and social losses for people and occur when insufficient resources exist. Natural disasters, particularly earthquakes, are frequent occurrences worldwide. Although plans are made for both pre-and post-disaster periods, the painful experience of the recent major earthquake on the Eastern Anatolian Fault Line in Turkey has highlighted the inadequacy of these plans in terms of feasibility. Preventing future disasters is possible by implementing a good disaster management plan. Identifying emergency assembly areas after a disaster is one of the most critical issues in disaster management. This study used four multi-criteria decision-making techniques—AHP, TOPSIS, COPRAS, and BORDA—to evaluate the selection and suitability of emergency assembly areas for the Gölbaşı district of Ankara, Turkey. The AHP method was used to weight criteria, which were then applied in various decision-making approaches. Finally, utilizing the BORDA method, the alternative ranking derived from the AHP, TOPSIS, and COPRAS procedures was rated as more effective. According to the findings, the Sacrificial Slaughter Area, Green Area, Şehir Park, Muhsin Yazıcıoğlu Sports Complex, and the Türkiye Muhasebeciler Association (İncek and Taşpınar) are determined the five most effective emergency assembly areas in the Gölbaşı district.
1. Introduction
Disasters are uncontrollable occurrences that profoundly impact human life and result in numerous material and spiritual losses. The unpredictability of disasters has resulted in even more significant losses during and after the disaster. Recent earthquakes with magnitudes of 7.7 and 7.6, centered in Kahramanmaraş, Turkey, resulted in substantial loss of life and property. The quake devastated not only Kahramanmaraş but also Gaziantep, Kilis, Diyarbakır, Adana, Osmaniye, Şanlıurfa, Adıyaman, Malatya, and Hatay, killing over 48,000 people, injuring over 100,000 people, and destroying nearly 120,000 buildings.
Disaster management consists of four main stages: harm reduction, preparation, response, and recovery. The cycle formed by these successive stages, which includes an inseparable whole, is called the disaster management cycle and its stages are shown in Figure 1 [1]. These stages interact, and a flaw in one part of the cycle causes the entire system to fail.
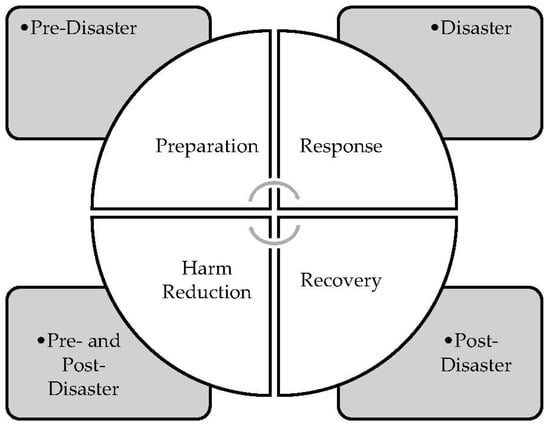
Figure 1.
Stages of disaster management.
Ankara is generally regarded as a safe location regarding seismicity and earthquake danger. However, earthquakes in the last century have demonstrated that this is different. Pampal (2008) claimed that Ankara is surrounded by active fault lines that will cause destructive earthquakes and is located 80–100 km away from these fault lines [2]. Therefore, earthquakes of magnitude 6.5 and higher that occur on these faults will be impacted in a way that will result in loss of life and property. It is situated in between Northern Anatolia to the north, Salt Lake to the south, Kırıkkale-Erbaa to the east, the Eskişehir fault line to the southwest, and the Akpınar fault to the southeast. The faults in question have the potential to cause more magnitude 7 earthquakes, but they are 60–80 km from the city center. Furthermore, a significant portion of the Ankara city area comprises alluvial and clay floors, which will amplify the earthquake effect and have the potential to liquefy. Moreover, because of the mistaken belief that there is no earthquake risk in Ankara, responsible institutions’ lack of adequate work in this regard is viewed as the primary reason that increases the earthquake risk [2].
2. Literature Review on Assembly Area Selection in Disaster Management
It is necessary to plan ahead of time where temporary shelters will be established for disaster victims who have lost their homes following a disaster or whose homes are unusable [3]. Emergency assembly areas are safe areas where the public can congregate away from the danger zone to avoid panic and ensure healthy information exchange until temporary shelter centers are ready following disasters and emergencies. Identifying these areas in advance and informing people about them ensures that people survive the cataclysm with minimal damage [4]. The studies determining the assembly areas during or after a disaster were divided into two categories: studies in the world and studies in Turkey.
2.1. Studies on Emergency Assembly Areas in the World
Dalal et al. (2007) intended to address the cyclone shelter problem in India by dividing the number of villages into a minimum number of clusters and locating and assessing shelter capacity. The Elzinga–Hearn method and heuristic methods were used. A distance matrix was used to create an algorithm, and the Elzinga–Hearn method was used to determine the dimensions of the cyclone shelters [5]. Kar and Hodgson (2008) addressed the problem of identifying temporary shelter areas in the event of a potential disaster in the United States. In this study, they used a GIS-based model to reduce death rates and provide emergency services by evacuating people from danger zones and discovered that 48% of existing shelters were located in physically problematic areas. Shelters in the northern districts have been recommended as potential emergency shelters due to their high suitability score [6]. After an earthquake, Chu and Su (2011) emphasized the importance of emergency assembly areas and established an index system to evaluate emergency shelters in China. They determined the index weight using an analytical hierarchy process, assessed shelters in specific areas using a comprehensive fuzzy assessment method, and ultimately ensured the selection of earthquake emergency shelters [7]. Youssef et al. (2011) used a GIS-based model to determine temporary shelter areas in Egypt during a disaster. They presented advanced remote sensing data such as Thematic Mapper Plus and Shuttle Radar Topography Mission in conjunction with geological, geomorphological, and field data in a GIS environment to predict flash flood risk in this study. The most vulnerable factors for flash flooding and critical sensitive areas were discussed. The study’s findings suggested appropriate measures to reduce potential hazards in the region [8]. In their research in Iran to determine temporary shelters in case of possible disasters, Omidvar et al. (2013) proposed a model for the selection of suitable and systematic locations for temporary shelters before an earthquake by using a geographic information system based on earthquake damage assessment and CCV. The TOPSIS, ELECTRE, SAW, and AHP methods were used in this study. The benefit of using MADM concurrently is that it increases the likelihood of obtaining the best results in different ways. TOPSIS was the best approach for selecting temporary shelter areas, with the lowest RSS error [9]. Wex et al. (2014) used a variety of heuristics, including a Monte Carlo-based heuristic and the GRASP meta-heuristic, to effectively allocate and program rescue units to reduce casualties and economic losses during the natural disaster response phase in Germany [10]. Roh et al. (2015) identified a problem in identifying shelter areas for humanitarian organizations in the United Kingdom. They determined the relative importance of individual criteria using the Analytical Hierarchy Process. The Fuzzy-TOPSIS method was used to obtain the final sequence of positions in which linguistic values address decision uncertainty and subjectivity [11]. Junian and Azizifar (2018) used an analytical hierarchy process as a multi-criteria decision-making method to determine temporary shelter areas after an earthquake in a disaster-prone region of northern Iran. This research was divided into three stages: selecting shelter candidates using a geographic information system, analyzing the spatial scope of the shelters, and determining shelter locations. Finally, they used a case study to demonstrate the utility of the multi-criteria model and its associated solution method in planning urban earthquake evacuation shelters [12].
2.2. Studies on Emergency Assembly Areas in Turkey
Erden and Coşkun (2010) identified the criteria that can be used to determine the new locations of fire stations, calculated the weights for each criterion using the Analytical Hierarchy Process (AHP), and performed the most appropriate location analysis in the geographic information systems (GIS) environment based on the criterion weights [13]. In his study, Ünal (2011) aimed to create a decision support system that ensures the optimal placement of logistical elements, the shortest route between the earthquake zone and the facilities to be opened, as well as timely distribution channels where they are needed, in the emergency logistic aid operation after the possible Istanbul earthquake. An EXCEL-based decision support system was developed; AHP used the Floyd algorithm in model management. This KDS model makes recommendations to those who will implement the program and those who will conduct research and scientific studies on the subject [14]. Maral et al. (2015) prioritized assembly areas (sheltered areas) and tent city areas in their studies, and they carried out studies for the province of Izmir, particularly after the Marmara earthquake in 1999 [15]. Şahin (2017) used the fuzzy multi-criteria decision-making methods TOPSIS and VIKOR to determine the appropriate criteria for determining the locations of the shelter areas to be established to meet the temporary accommodation needs of victims of a possible disaster in Istanbul. Following the studies, the evaluation criteria for selecting temporary housing areas were determined to be transportation, settlement status, infrastructure, area, and environment [16]. Çelik et al. (2017) also established the criteria to determine the appropriate collection areas within the framework of the variables determined. In general, demographic characteristics and spatial size, transportation and accessibility status, infrastructure characteristics, topographic and geological qualities, soil capability, lithological qualities, meteorological and climatic qualities, and environmental risk status were examined to determine the assembly areas as a result of the research [17]. Çınar and Akgün (2018) attempted to examine the national and international criteria used in the determination of emergency assembly and temporary shelter areas after disasters in this article using samples from the Karşıyaka district of İzmir [18]. Hazırcı and Şahin (2019) sought to identify the temporary settlement areas that would be used in the event of an earthquake in Burdur and the neighborhoods that would be assigned to these areas. Using the Analytical Hierarchy Process, they first determined the suitability values of alternative settlement areas based on various criteria. The Analytical Hierarchy Process conformity values were used as the decision variable coefficients in the p-median model. The analysis with the GAMS program determined the neighborhoods to be assigned to each field [19]. Sayar (2018) used the Analytical Hierarchy Process, one of the multi-criteria decision-making methods, to determine the tent city location planned for the Suruç district of Şanlıurfa on a parcel-by-parcel basis, taking into account various risk factors [20]. Gerdan and Şen (2020) aimed to contribute to disaster risk management and response planning by employing decision-making methodologies after examining the emergency meeting areas determined in the Kocaeli/Başiskele district following international standards. They classified existing assembly areas according to international criteria in the first stage. The conformity values of these areas according to the criteria were determined in the second stage using the Analytical Hierarchy Process (AHP) method. The main criterion was “assembly area capacity”. As a result of these evaluations, it was determined that the existing emergency meeting areas of Kocaeli province’s Başiskele district were appropriate. However, because the urban settlement was expected to increase over time, it was suggested that new assembly areas be created [21]. Using decision-making methodologies, Gökgöz et al. (2020) evaluated the characteristics of emergency assembly areas. The evaluation concluded that the characteristics of the required emergency assembly areas were more important than the geological features [22]. The Fuzzy TOPSIS method, which is one of the most used MCDM approaches, was used to determine the selection of temporary living spaces after a possible disaster in Ankara in the study of Ömürgönülşen and Menten (2021). The analysis was carried out based on expert opinions. Ten criteria were determined as “accessibility, social facilities, health services, area capacity, soil type, land slope, security, infrastructure, climate and vegetation, property” [3]. Ekin and Sarıkaya (2021) attempted to identify the most suitable emergency assembly areas in nearby neighborhoods that could serve disaster victims in Kütahya. By determining the necessary criteria, multi-criteria decision-making (MCDM) techniques were used to rank the most suitable alternatives among many alternatives [23]. Aşıkkutlu et al. (2021) analyzed the emergency assembly areas established in Burdur’s city center following the earthquake. They determined that, while these areas appeared to be sufficient in the city center, they were insufficient according to neighborhood scale standards [24]. Dayanır et al. (2022) used the Delphi method to compile, group, and grade the criteria for the location, planning, and design of temporary shelters after the disaster since the proposed post-disaster temporary shelter areas for the province of İzmir were not evaluated according to national and international legislation [25]. Yavuz et al. (2022) calculated earthquake-induced tsunami wave heights and relative social risk levels for critical regions on Turkey’s Eastern Mediterranean coast, including settlements, agricultural areas, ports, and airports. The findings of this study will serve as a scientific resource for local governments and public institutions in determining how to protect against a possible earthquake-induced tsunami [26].
When studies in the literature are examined, it is clear that the emphasis is on natural disasters rather than technological disasters and the preparation and intervention stages as disaster management stages in general. Many methods, such as geographic information system-based models, decision support systems, and multi-criteria decision-making methods, were used in studies on the location selection of emergency assembly areas.
The primary goal of studies on emergency assembly areas is to locate these areas as close to the population as possible and to find a location where disaster victims can congregate. There are numerous criteria to consider when determining the best site for emergency assembly areas. When the studies in the literature were examined, it was discovered that these criteria differed depending on the physical conditions of the study area and the expert comments. Table 1 summarizes the literature’s criteria for determining emergency assembly areas.

Table 1.
Criteria used to determine emergency assembly areas.
It is well known that multi-criteria decision-making methods are frequently preferred and used in many studies when there are conflicting criteria, uncertain situations, and deciding between alternatives. The standards affecting the subject of interest are determined and ranked in order of importance using expert opinions and subjective evaluations of decision-makers in the multi-criteria decision-making method. Among the alternatives, appropriate choices are made based on the weight of the criteria. Multi-criteria decision-making techniques were used in the study’s methodology.
3. Multi-Criteria Decision-Making Methods
3.1. Analytical Hierarchy Process (AHP)
The Analytical Hierarchy Process is a mathematical theory for measurement and decision-making developed in the mid-1970s by Thomas L. Saaty of the University of Pennsylvania [28]. Over the last 20 years, AHP has been widely studied in the literature and used in almost all multi-criteria decision-making applications [29]. The AHP method’s application steps are as follows:
3.1.1. Step 1: Problem Definition and Hierarchy Structure Creation
A decision hierarchy is built from the top down to decide. There are criteria at the intermediate level and alternatives at the lowest level [30]. Figure 2 shows the decision hierarchy structure.
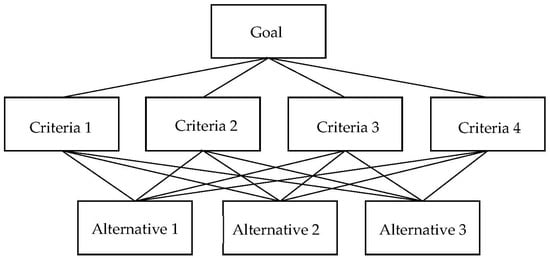
Figure 2.
Decision hierarchy (three levels) [31].
3.1.2. Step 2: Determination of Pairwise Comparison Matrices (A) and Importance
Following the determination of the purpose, criteria, and sub-criteria, the pairwise comparison matrix (nxn) shown in the first expression is created to determine the importance levels of the standards and sub-criteria among themselves [32]. The decision-maker compares the criteria or alternatives in pairs for the criteria matrix or the alternative matrix. Figure 3 depicts the criteria–comparison matrix.
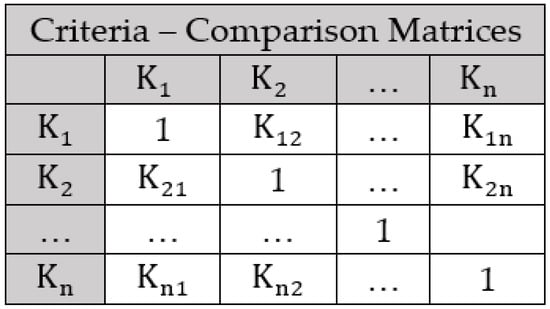
Figure 3.
Criteria—comparison matrices.
The values in the standard preference table are used to determine the levels of importance. Table 2 contains the standard preference table.
Table 2.
Standard preference table.
3.1.3. Step 3: Determination of the Eigenvector (Relative Importance Vector)
Following the creation of the pairwise comparison matrices, the eigenvector is calculated, indicating each element’s importance in the respective matrix concerning the other elements. The matrix’s eigenvector at dimension nx1 is calculated as Equation (1).
The vectors of the column W = must be calculated to determine the percent importance distributions of the criteria. The arithmetic mean of the row elements of the matrix formed by the values specified in the preceding equation yields the W column vector.
3.1.4. Step 4: Calculating the Consistency of the Eigenvector
The consistency ratio (CR) is calculated for each pairwise comparison matrix, and the upper limit for this ratio is 0.10. A ratio greater than 0.10 indicates an inconsistency in the decision-makers’ judgments. In this instance, judgments must be improved. First, the largest eigenvector () of the A matrix should be computed to determine the CR value.
Another value needed to calculate the consistency ratio is the randomness index (RI). The data containing the RI values, which consist of constant numbers and are determined according to the n value, are given in Table 3. In line with this information, the CR value is given in Equation (3).
Table 3.
Random Index (RI).
3.1.5. Step 5: Obtaining the General Result of the Hierarchical Structure
The four preceding stages are computed for the entire hierarchical structure. The mx1 size priority column vectors generated by each of the n criteria in the hierarchical structure are combined at this point to form the mxn size DW decision matrix. The R result is obtained by multiplying the matrix with the inter-criterion W priority vector.
3.2. Technique for Order Preference by Similarity to Ideal Solution (TOPSIS)
The TOPSIS method was developed by Hwang and Yoon (1981) based on the concept of the solution alternative as the shortest distance to the positive ideal solution and the longest distance to the negative ideal solution [33]. The TOPSIS method involves the following steps:
3.2.1. Step 1: Goals and Evaluation Criteria Definition
Assume the problem has m alternatives, and each alternative is evaluated using n decision criteria/attributes, denoted by . Values or ratings are assigned to each alternative for each standard and organized into a decision matrix. This enables a systematic evaluation and comparison of other options based on multiple criteria to aid decision-making.
3.2.2. Step 2: Creation of the Decision Matrix (D)
The decision matrix is constructed by listing the alternatives in a vertical column, followed by the features or evaluations () for each criterion in horizontal rows. This enables a clear and organized representation of each alternative’s evaluation across all requirements, making it easier to compare and make a final decision.
3.2.3. Step 3: Creation of the Normalized Decision Matrix (R)
The matrix is normalized by taking the square root of the sum of the squares of the scores or features associated with the decision matrix’s criteria. The following equation is used for normalization, and the “R” matrix is obtained at the end of the process.
3.2.4. Step 4: Creation of the Weighted Normalized Decision Matrix (V)
Weight measure “j” is represented by . The weighted normalized decision matrix is determined using Equation (7).
3.2.5. Step 5: Determine the Positive and Negative Ideal Solutions
The positive ideal solution consists of the best performance values of the weighted normalized decision matrix, while the negative ideal solution consists of the worst values. Positive and negative ideal solutions are calculated using Equation (8). In both formulas, I represents the benefit (maximization) and J represents the cost (minimization).
3.2.6. Step 6: Calculation of Special Measures (Distance of Alternatives from the Positive Ideal and Negative Ideal Solutions)
The distance from the positive ideal solution () and the negative ideal solution ( for each alternative according to the given criteria is determined using Equation (9).
3.2.7. Step 7: Calculating the Relative Proximity to the Ideal Solution
The relative proximity to the ideal solution () is calculated using Equation (10).
The alternatives are sorted by proximity to the ideal solution () values. The maximum value is chosen.
3.3. Complex Proportional Assessment (COPRAS)
The COPRAS method, which means “Complex Proportional Evaluation,” can evaluate qualitative and quantitative criteria. It has been used in many areas for ranking and considering options, considering the minimization and maximization aspects of the criteria. The most crucial difference between the COPRAS method and other MCDM methods is that the options compare and reveal how good or bad they are compared to other options as a percentage.
The COPRAS method’s process steps are as follows:
3.3.1. Step 1: Creation of the Decision Matrix
Equation (11) depicts the formulation of the decision matrix.
represents the value of the j. option based on the i. criteria. n represents the number of options to compare, and m represents the number of criteria.
3.3.2. Step 2: Creation of the Normalized Decision Matrix
Equation (12) is used to normalize the decision matrix. The weights of the criteria are indicated by . In the COPRAS method, there is no application for determining criterion weights. The practitioner can assess criterion weights using AHP or a simple scoring technique.
The sum of the weighted values for each criterion xi equals the qi, the relevant criterion’s weight value. This is depicted in Equation (12).
3.3.3. Step 3: Summation of Weighted Indexes
The lower the S-j value calculated using minimization-oriented criteria, the higher the goal achievement. Similarly, the higher the S+j value calculated using maximization-oriented criteria, the more likely it is to reach the goal.
3.3.4. Step 4: Calculating the Relative Importance of the Options
, showing the relative importance of the options compared, is calculated by Equation (14). is arranged in ascending order. The higher the , the greater its relative importance.
3.3.5. Step 5: Determining the Degree of Utility of Options
Equation (15) determines the degree of utility of the options. The option with the highest utility rating is the best. Other options are ranked from best to worst.
3.4. Borda Count (BORDA)
Numerous studies in the literature use more than one CCVP technique concurrently. These studies aim to obtain comparable results using various ranking methods. Determining the best alternative using multiple methods is viewed as an effectiveness criterion. The Borda Count method combines sequences from multiple such classifiers to produce a single series [34]. This method, which assigns equal importance to each class for classification performance, is also quite simple in applicability [35]. From the m alternatives in the class under consideration, a decreasing value is assigned to the one in the best situation (m-1) and the one in the second-best case (m-2) and scoring is performed to obtain the worst alternative (0) value. Finally, the values assigned to the alternatives in all classes are collected, and the Borda score is calculated and used to rank the alternatives.
4. Application: Ankara/Gölbaşı Example
4.1. Problem Definition
Emergency assembly areas allow people to communicate with their relatives while remaining safe, accessible, and protected. Identifying and informing people about these areas in advance ensures they can escape the disaster with minimal damage [23]. The first 12–24 h following a disaster are critical regarding access to safe assembly areas for disaster-affected people, access to information provided by local authorities, and avoiding potential disruptions [15].
There is a lot of complexity during and immediately after a disaster. With the disaster’s fear and excitement, it is impossible to make the right decision. As a result, people should be aware of the predetermined emergency assembly areas, where they can ensure the safety of themselves and their immediate surroundings and where they can be in contact at any time, before the disaster. These areas are the first step toward transitioning to temporary shelters where people can live for a limited time. Determining the emergency assembly areas ahead of time ensures that life goes on and that there are fewer casualties. When the social and psychological conditions of the people after the disaster are considered, it is discovered that the choice of emergency assembly area is very important for both children and adults and thus the assembly areas should be determined very carefully.
Turkey’s most recent major earthquake demonstrates the importance of being fully prepared for future earthquakes. Examining the literature reveals that a study has yet to be conducted to determine the emergency assembly areas in Ankara. In the event of an earthquake in Ankara, studies conducted in the preparation and damage reduction phases before the disaster and the intervention and rescue phases after the disaster will be critical in reducing the disaster’s effects. In this context, it is necessary to identify the disaster victims’ emergency assembly areas before and after the disaster.
The study determined the most appropriate emergency assembly areas to be present in the Gölbaşı district, which was chosen as the pilot region of Ankara Province. The following are the study’s steps:
- Determination of the main criteria and sub-criteria for the selection of emergency assembly areas: the main criteria and sub-criteria to be used in the study were determined by combining the examinations made in the region, literature research, and expert opinions.
- Using the AHP (Analytic Hierarchy Process) method, one of the multi-criteria decision-making techniques, to determine the importance levels of the main and sub-criteria: the weights of the main criteria and sub-criteria were determined using the AHP method. AFAD provided the necessary expert opinion to evaluate the main criteria and sub-criteria. With the data obtained, the solution was created using the AHP method. The importance levels of the main and sub-criteria were determined as a result of the solution.
- Selecting between alternatives using the AHP, TOPSIS (Technique for Order Preference by Similarity to Ideal Solution), and COPRAS (Complex Proportional Assessment) methods: the AHP, TOPSIS, and COPRAS methods were used to generate a list of alternatives.
- Implementing the BORDA (Borda Count) method: creating a single row by combining alternative rankings from the AHP, TOPSIS, and COPRAS methods with the BORDA method.
Regarding this topic, AFAD provided data on the locations that could be used as assembly areas for the Gölbaşı district. These locations were evaluated using the criteria. Google Maps, TUIK, and GSM Access Centers provided the data needed for the evaluation. The most appropriate area was determined based on these data. Table 4 shows the coordinates and addresses of the existing assembly areas in the Gölbaşı district. In addition, photographs of emergency assembly areas are shown in Appendix A.
Table 4.
Gölbaşı district emergency assembly areas.
4.2. Criteria and Sub-Criteria
For the selection of emergency assembly areas, four main criteria and fourteen sub-criteria were determined based on expert opinions, regional characteristics, and studies in the literature. The main criteria were coverage area, environmental safety, field size, and field features. Sub-criteria were determined and classified among themselves based on the main criteria. Table 5 lists the criteria that were selected.
Table 5.
Criteria and sub-criteria.
4.2.1. Coverage Area
Coverage area refers to the area affected by a zone. The coverage area criteria are critical in determining emergency assembly areas because these areas must be close to areas free of disaster risk to ensure the evacuation of disaster victims to a safe location. Accessibility, population density, and the possibility of expansion are among the sub-criteria used in determining the coverage area.
- Accessibility: The distance between the building areas and the emergency assembly areas should be at a level that is easily accessible to each individual. The distance between the relevant assembly area and the building units was considered in the evaluation.
- Population Density: Population density is the number of people living in a given unit area. It was calculated by considering the density of people living around the relevant assembly area and estimating how many people would be evacuated to these areas. The arithmetic population density was calculated in this study.
- Expansion Possibility: The population density within a given area determines assembly areas. Given the growing population, expanding the relevant assembly areas should be considered.
4.2.2. Environmental Safety
Emergency assembly areas are safe areas that are not at risk of disaster and are away from the dangers that may arise from the environment that people must reach as soon as possible during and after a disaster. As a result, environmental safety is critical in determining emergency assembly areas. Its sub-criteria include geological hazards, road conditions, and distance to hazardous areas.
- Geological Hazards: Many disaster victims temporarily continue their lives in emergency assembly areas. As a result, these areas should not be vulnerable to disasters such as landslides and floods, and earthquake aftershocks should not harm them.
- Road Condition: Regarding people’s safety, if we accept that the disaster victims sheltering in the emergency assembly areas are pedestrians, there should be no highways, boulevards, or wide and heavy-traffic streets surrounding these areas.
- Distance from Hazardous Areas: To allow disaster victims to live healthy lives, emergency assembly areas should be located away from polluting industrial factories, petrol stations, power stations that emit radiation, etc.
4.2.3. Field Size
The locations designated as emergency assembly areas should be chosen based on the area size and capacity to provide adequate living conditions for those evacuated to this area. It has two sub-criteria: suitable size and power.
- Appropriate Size: In the assembly area, there is a necessary area for disaster victims to sustain their lives. This area should have a dimension that allows them to meet their personal needs as well as their social activities. The usable area designated as the emergency assembly area must be adequate for the calculated capacity.
- Capacity: The maximum number of people who can settle in the designated assembly area is referred to as the capacity. The minimum living space of the people is considered when determining capacity.
4.2.4. Field Features
Temporary shelters must be suitable for temporary living conditions in emergency assembly areas. The slope of the land, water provision, proximity to road networks, distance to medical centers, sourcing of local materials, and field type are its sub-criteria.
- The Slope of the Land: The low slope of the area to be established in temporary shelter areas is critical for providing ease of accommodation and settlement, such as tents and awnings.
- Water Provision: Water access is expected to be necessary for human livelihood conditions. As a result, areas with natural water resources should be prioritized.
- Proximity to Road Networks: Because debris will likely spread to the streets after the earthquake, proximity to main streets is important for transportation.
- Distance to Medical Facilities: The proximity of medical facilities is an essential criterion for quick and easy intervention in emergencies.
- Sourcing of Materials: Such supplies are expected to be simple to obtain to maintain access to food and necessities. The structures where such needs can be met must be close to emergency assembly areas.
- Field Type: In general, emergency assembly areas are open areas such as parks, gardens, green areas, school gardens, and marketplaces. Priority should be given to public lands.
4.3. Solution of Problem
When the studies conducted in the literature are examined, it is seen that the number of studies to determine the location selection of emergency assembly areas has increased in recent years, indicating that this issue has received attention. Most location selection problems were solved using geographical information system-based models in the past, but in recent years, multi-criteria decision-making methods have been used. Using multi-criteria decision-making methods, emergency assembly areas for the Gölbaşı district of Ankara province were determined within the framework of the literature and expert opinions examined in this study.
The studies using multi-criteria decision-making methods on various subjects were thoroughly examined, and AHP, TOPSIS, COPRAS, and BORDA Counting methods were considered appropriate. Because of their simplicity of use and the need for precise evaluation, more than one multi-criteria decision-making method was used.
The Analytic Hierarchy Process (AHP) method’s main advantage is its ability to solve multi-criteria decision-making (MCDM) problems. The AHP method is a multicriteria decision method based on a ratio scale that can be used to analyze best decisions based on structured techniques. It is a powerful and precise decision-making tool that can be useful in decision-making [32,36]. The AHP method can be applied to a variety of fields, including transportation planning, waste management, renewable energy systems, supplier selection, finance investment strategies, and job evaluation [37,38,39,40]. The AHP method is useful when evaluating alternatives with multiple criteria and when selecting the best alternative among all feasible alternatives is difficult. The AHP method can lead to more accurate and dependable decision-making processes [36].
The main advantage of the COPRAS method is that it can be used to evaluate both maximum values and minimizing criteria [41]. The COPRAS method is a decision-making analytical tool for multi-criteria problems [42]. The COPRAS method has been used for decision-making in a variety of fields, including wind farm construction, material selection, supplier selection, and site selection [43,44,45,46]. The COPRAS method can be used to analyze various alternatives and estimate them based on their utility level, with the values of the attributes expressed in intervals to increase efficiency and accuracy in the decision-making process [47]. When evaluating alternatives with multiple criteria is difficult, the COPRAS method is useful for selecting the best alternative among all feasible alternatives [48]. The COPRAS method can be combined with other methods, such as the Analytic Hierarchy Process (AHP), to improve COPRAS evaluation performance [41,49]. As a result, the COPRAS method can be justified for use in decision-making processes involving multiple criteria and the evaluation of maximum and minimum values.
The TOPSIS method’s main advantage is its ability to provide a simple and easy-to-understand mathematical form for measuring the performance of decision alternatives [50]. TOPSIS is a multi-criteria decision-making (MCDM) method that ranks the benefits and drawbacks of an evaluation object based on the Euclidean distance between the evaluation object and idealized goals [51,52]. The TOPSIS method has low requirements for the number of indicators and sample size, making it easier to obtain the best solution through rigorous quantitative analysis [50,53]. The TOPSIS method is widely used in a wide range of decision-making evaluations and evaluations, including supplier selection, employee recruitment, material selection, and academic journal evaluation [50,52,54,55]. The TOPSIS method can also be used to find alternative solutions [56]. As a result, the TOPSIS method’s use in decision-making processes involving multiple criteria and requiring a simple and easy-to-understand mathematical form to measure the performance of decision alternatives can be justified.
The BORDA Counting method has the main advantage of being a fair and simple method for aggregating individual preferences into a group preference. The BORDA Counting method is a voting system that assigns points to each candidate based on their rank in each voter’s preference list, with the winner being the candidate with the highest total score [57]. The BORDA Counting method is widely used in a variety of applications, including electoral systems, wine quality ranking, and waste management [57,58,59]. This method can also be used to reduce the amount of manipulation in group decisions [60]. Because it uses all of the information provided by each voter, the BORDA Counting method is mathematically superior to other methods such as the Cordorcet method [58]. As a result, the Borda Counting method can be justified for use in decision-making processes requiring a fair and simple method for aggregating individual preferences into a group preference.
4.3.1. Analytic Hierarchy Process (AHP)
The four main criteria determined by applying the AHP method steps were scored using Saaty’s 1–9 scale. Experts were asked to compare and score the criteria based on the information provided. Table 6 shows the decision matrix, and Table 7 shows the importance of the main criteria in the order of importance. Table 8 shows the eigenvalue and consistency analysis of the main criteria comparison matrix.
Table 6.
Main criteria pairwise comparison matrix.
Table 7.
Main criteria’s importance.
Table 8.
Eigenvalue and consistency analysis of the main criteria comparison matrix.
For example, a comparison matrix was created for field features’ criteria and is given in Table 9.
Table 9.
Field Features’ Criteria Comparison Matrix.
Decision matrices were created in the same way for all sub-criteria, and the eigenvalues and consistency analysis of the relevant matrices are given in Table 10.
Table 10.
Main criteria’s importance.
The values found through the comparison matrix between the sub-criteria were multiplied by the importance levels of the criteria to generate the final weighted values shown in Table 11.
Table 11.
Main criteria’s importance.
Likewise, a comparison matrix of all alternatives was made, and their importance levels are given in Table 12. In Table 13, the final alternative ranking is obtained by multiplying the importance levels of the alternatives and the weighted sub-criteria.
Table 12.
Alternatives’ importance.
Table 13.
Ranking of alternatives by AHP method.
According to the solution results of the AHP method in Table 13, the first five places for meeting areas that can serve the Gölbaşı district of Ankara are the Sacrificial Area, Green Area, Şehir Park, Adem Bilhan Uysal Primary School Garden, and Muhsin Yazıcıoğlu Sports Complex.
4.3.2. Technique for Order Preference by Similarity to Ideal Solution (TOPSIS)
Using the criterion weights determined by AHP, the TOPSIS method steps were applied, and the alternatives were reordered. The decision matrix for TOPSIS is given in Table 14, and the normalized decision matrix is shown in Table 15. The decision matrix was created in line with expert opinion.
Table 14.
Decision matrix.
Table 15.
Normalized decision matrix.
The distance to the positive ideal solution () and the negative ideal solution ( and the relative proximity to the ideal solution () were calculated, and the alternatives were sorted according to the relative proximity to the ideal solution (). Table 15 gives the positive ideal solution () and the negative ideal solution ( values. Table 16 shows the ranking of the final alternative assembly areas with TOPSIS.
Table 16.
Positive ideal Solution (), the negative ideal solution (, and values.
According to the TOPSIS method’s solution results in Table 17, the first five places for emergency assembly areas that can serve the Gölbaşı district of Ankara Province are the Sacrificial Slaughter Area, Green Area, Şehir Park, the Türkiye Muhasebeciler Association (İncek and Taşpınar), and Adem Bilhan Uysal Primary School Garden.
Table 17.
Ranking of alternatives by TOPSIS method.
4.3.3. Complex Proportional Assessment (COPRAS)
The steps of the COPRAS method were applied, and the alternatives were reordered using the criterion weights determined by AHP. Table 18 shows the normalized decision matrix.
Table 18.
Normalized decision matrix.
As a result of the COPRAS method, the option with an value of 100 is the most useful. The order of the other alternative was also determined according to the best grade. Table 19 shows the ranking of the alternatives using the COPRAS method. According to the COPRAS method solution results, Mogan Park, Bekir Gönenç Park, Osmanlı Park, the Sacrificial Slaughter Area, and Atatürk Sahil Park were the top five assembly areas in the Gölbaşı district.
Table 19.
Ranking of alternatives by COPRAS method.
4.3.4. Borda Count (BORDA)
The Borda Counting method is the final method used and provides the overall study result ranking. The alternative sequences obtained from the AHP, TOPSIS, and COPRAS methods differ among all of them. When the top five emergency assembly areas are considered, the top three rankings of the AHP and TOPSIS methods are the same: Sacrificial Slaughter Area, Green Area, and Şehir Park. According to the results of the TOPSIS method, the fourth place was taken by the Türkiye Muhasebeciler Association (İncek and Taşpınar), and the fifth place was taken by Adem Bilhan Uysal Primary School Garden. The COPRAS method yields completely different results from the AHP and TOPSIS methods. Mogan Park, Bekir Gönenç Park, Osmanlı Park, the Sacrificial Slaughter Area, and Atatürk Sahil Park took the first five areas for emergency assembly areas that can serve Ankara Province’s Gölbaşı district.
Numerous studies in the literature use multiple criteria decision-making techniques together. These studies aim to obtain comparable results using various sequencing methods. Determining the best alternative using multiple methods is regarded as an efficient criterion. The Borda Count method combines rankings produced by multiple classifiers into one ranking. Because the results of the three different methods differed, the study obtained an integrated ranking using the Borda Count method to obtain a general ranking. By grouping the ranking classes into a single category, the Borda Count method produces a consensus result. Table 20 shows the scores and rankings of the BORDA Count method and other methods used.
Table 20.
BORDA Count method results.
According to the BORDA method’s solution results in Table 21, the first five emergency assembly areas that can serve the Gölbaşı district are the Sacrificial Slaughter Area, Green Area, Şehir Park, Muhsin Yazıcıoğlu Sports Complex, and the Türkiye Muhasebeciler Association (İncek and Taşpınar).
Table 21.
Ranking of alternatives by BORDA method.
Table 22 compares alternative rankings obtained using the AHP, TOPSIS, COPRAS, and BORDA methods. The Sacrificial Slaughter Area is first in the AHP, TOPSIS, and BORDA methods for emergency assembly areas that can serve the Gölbaşı district of Ankara. Mogan Park took first place in the COPRAS method ranking. The first three rows of the AHP, TOPSIS, and BORDA methods are the same.
Table 22.
Ranking of alternatives by BORDA method.
5. Conclusions
The 7.7 and 7.6 magnitude earthquakes centered in Kahramanmaraş and Elbistan on Turkey’s Eastern Anatolian Fault Line caused significant damage and loss of life in the ten surrounding provinces. While approximately 48 thousand people lost their lives in the earthquake, the region where around 13.5 million people live in 10 provinces was affected. This disaster demonstrates the importance of being prepared for potential disasters that may occur in the future, as well as developing and implementing emergency action plans for this issue. In Turkey, disaster management studies are at an advanced stage. Following potential disasters, citizens must be in a safe environment where their needs can be met. Pre-disaster and post-disaster studies should be prioritized, particularly in large cities such as Ankara, which appear safe from natural disasters but are located near many major fault lines and are likely to be severely affected in the event of an earthquake.
The Ankara Province’s Gölbaşı district was chosen as a pilot region for the study, and the problem of selecting emergency assembly areas after a disaster was discussed. Many studies have been conducted in recent years in the world and Turkey, following a review of the literature on the location selection of emergency assembly areas. When the related studies were thoroughly examined, it was discovered that the researchers established criteria and sub-criteria for area selection. A study for the Gölbaşı district has not been found in the literature. For this reason, the goal of this study was to determine the post-disaster emergency assembly areas for the Gölbaşı district of Ankara by national and international standards by using multi-criteria decision-making techniques, which are based on four main criteria and fourteen sub-criteria determined under comprehensive studies based on the literature and expert opinions. The Analytical Hierarchy Process (AHP) method was used to determine the criteria weights and list the alternatives. With 35.9%, coverage area was the most important of the main criteria. Following that are environmental safety, field size, and field features. TOPSIS and COPRAS methods list the alternatives based on these determined weights. Because the results of the three different ranking methods differed in the study, a single integrated ranking was obtained using the BORDA Count method to obtain a general ranking. Alternative rankings were assessed using all methods, and comparisons were made. According to the comparison results, the sacrificial slaughter area takes first place in the AHP, TOPSIS, and BORDA methods for emergency assembly areas that can serve the Gölbaşı district of Ankara. Mogan Park took first place in the COPRAS method ranking.
As a similar study could not be found, the ranking of the alternatives could not be compared. However, it is known in the literature that performing the decision-making process by using more than one multi-criteria decision technique on a problem leads to more accurate results [61]. The literature suggests that using multiple MCDM methods can help to overcome the limitations of individual methods and provide more robust and reliable results [61,62]. For instance, Mohammadnazari et al. (2022) used an integrated approach based on four multi-criteria decision-making (MCDM) techniques, namely TOPSIS, ELECTRE III, VIKOR, and PROMETHEE, to assist decision-makers in prioritizing post-disaster projects [63]. Boyacı and Tüzemen (2022) used AHP, TOPSIS and COPRAS techniques for the selection of aircraft-material selection problem. Then the Borda Count method was used to obtain the final integrated rankings.Therefore, the research results provide evidence that using multiple MCDM methods can lead to more accurate and reliable results in decision-making processes.
This study, conducted in the Gölbaşı district of Ankara Province, is expected to serve as a model for other districts in Ankara Province and benefit researchers. Furthermore, the study’s findings will serve as a scientific guide for local governments and public institutions in taking preventive measures in the aftermath of an earthquake. The study should not be limited to Ankara province; all cities should be prepared for potential disasters. As a result, except for Ankara Province, similar studies can be updated based on physical conditions and expert opinions from all regions and provinces in Turkey.
Author Contributions
Conceptualization, E.A. (Ediz Atmaca), E.A. (Esra Aktaş), and H.N.Ö.; methodology, E.A. (Ediz Atmaca), E.A. (Esra Aktaş), and H.N.Ö.; validation, E.A. (Ediz Atmaca), E.A. (Esra Aktaş), and H.N.Ö.; investigation, E.A. (Ediz Atmaca), E.A. (Esra Aktaş), and H.N.Ö.; resources, E.A. (Ediz Atmaca), E.A. (Esra Aktaş), and H.N.Ö.; data curation, E.A. (Ediz Atmaca), E.A. (Esra Aktaş), and H.N.Ö.; writing—original draft preparation, E.A. (Ediz Atmaca), E.A. (Esra Aktaş), and H.N.Ö.; writing—review and editing, E.A. (Ediz Atmaca), E.A. (Esra Aktaş), and H.N.Ö.; supervision, E.A. (Ediz Atmaca), E.A. (Esra Aktaş), and H.N.Ö. All authors have read and agreed to the published version of the manuscript.
Funding
This research received no external funding.
Institutional Review Board Statement
Not applicable.
Informed Consent Statement
Not applicable.
Data Availability Statement
All data generated or analyzed during this study are included in the published article.
Conflicts of Interest
The authors declare no conflict of interest.
Appendix A

Figure A1.
Emergency assembly areas in the District Center where the population density is high.

Figure A2.
Emergency assembly areas in the District Center where the population density is medium.

Figure A3.
Emergency assembly areas in the District Center where the population density is low.
References
- Şahin, N. Afet Yönetimi ve Acil Yardım Planları. In Proceedings of the TMMOB İzmir Kent Sempozyumu, İzmir, Turkey, 8–10 January 2009; pp. 131–142. [Google Scholar]
- Ankara’nın Deprem Tehlikesi ve Riski Çalıştayı Bildiriler Kitabı; Pampal, S., Özmen, B., Eds.; Gazi Üniversitesi: Ankara, Turkey, 2008; ISBN 9789755071688. [Google Scholar]
- Ömürgönülşelen, M.; Menten, C. Bulanık TOPSIS Yöntemi Ile Ankara İli İçin Olası Afet Sonrası Geçici Barınma Alanlarının Seçimi. Doğal Afetler Ve Çevre Derg. 2021, 7, 159–175. [Google Scholar] [CrossRef]
- Yalçıner Çal, D.; Aydemir, E. Yerleşke İçi Acil Durum Toplanma Yerlerinin Belirlenmesi: Süleyman Demirel Üniversitesi Örneği. Mühendislik Bilim. Ve Tasarım Derg. 2018, 6, 520–531. [Google Scholar] [CrossRef]
- Dalal, J.; Mohapatra, P.K.J.; Mitra, G.C. Locating Cyclone Shelters: A Case. Disaster Prev. Manag. Int. J. 2007, 16, 235–244. [Google Scholar] [CrossRef]
- Kar, B.; Hodgson, M.E. A GIS-Based Model to Determine Site Suitability of Emergency Evacuation Shelters. Trans. GIS 2008, 12, 227–248. [Google Scholar] [CrossRef]
- Chu, J.; Su, Y. Comprehensive Evaluation Index System in the Application for Earthquake Emergency Shelter Site. Adv. Mater. Res. 2011, 156–157, 79–83. [Google Scholar] [CrossRef]
- Youssef, A.M.; Pradhan, B.; Hassan, A.M. Flash Flood Risk Estimation along the St. Katherine Road, Southern Sinai, Egypt Using GIS Based Morphometry and Satellite Imagery. Environ. Earth Sci. 2011, 62, 611–623. [Google Scholar] [CrossRef]
- Omidvar, B.; Baradaran-Shoraka, M.; Nojavan, M. Temporary Site Selection and Decision-Making Methods: A Case Study of Tehran, Iran. Disasters 2013, 37, 536–553. [Google Scholar] [CrossRef]
- Wex, F.; Schryen, G.; Feuerriegel, S.; Neumann, D. Emergency Response in Natural Disaster Management: Allocation and Scheduling of Rescue Units. Eur. J. Oper. Res. 2014, 235, 697–708. [Google Scholar] [CrossRef]
- Roh, S.; Pettit, S.; Harris, I.; Beresford, A. The Pre-Positioning of Warehouses at Regional and Local Levels for a Humanitarian Relief Organisation. Int. J. Prod. Econ. 2015, 170, 616–628. [Google Scholar] [CrossRef]
- Junian, J.; Azizifar, V. The Evaluation of Temporary Shelter Areas Locations Using Geographic Information System and Analytic Hierarchy Process. Civ. Eng. J. 2018, 4, 1678. [Google Scholar] [CrossRef]
- Erden, T.; Coşkun, M.Z. Coğrafi Bilgi Sistemleri ve Analitik Hiyerarşi Yöntemi Yardımıyla İtfaiye İstasyon Yer Seçimi. In Proceedings of the TMMOB Harita ve Kadastro Mühendisleri Odası, 13. Türkiye Harita Bilimsel ve Teknik Kurultayı, Ankara, Turkey, 18–22 April 2011. [Google Scholar]
- Ünal, G. Emergency-logistic relief operations earthquake logistics decision support system: ELRO-ELDSS (a sample probable Istanbul Earthquake). Ph.D. Disertation, Kara Harp Okulu, Ankara, Turkey, 2011. [Google Scholar]
- Maral, H.; Akgün, Y.; Çınar, A.K.; Karavelli, A.S. İzmir’deki Afet Sonrası Toplanma ve Acil Barınma Alanları Üzerine Bir Değerlendirme. In Proceedings of the 3rd Türkiye Deprem Mühendisliği ve Sismoloji Konferansı, İzmir, Turkey, 14–16 October 2015. [Google Scholar]
- Şahin, S. Selection of temporary housing area in the disaster management system at fuzzy environment by make a decision methods with multi criteria. Master’s Disertation, İstanbul Ticaret Üniversitesi, İstanbul, Turkey, 2017. [Google Scholar]
- Çelik, H.; Özcan, N.S.; Erdin, H.E. Afet ve Acil Durumlarda Halkın Toplanma Alanlarının Kullanılabilirliğini Belirleyen Kriterler. In Proceedings of the 4th Uluslararası Deprem Mühendisliği ve Sismoloji Konferansı, Eskişehir, Turkey, 11–13 October 2017. [Google Scholar]
- Çınar, A.K.; Akgün, Y. Analysing The Planning Criterias of Emergency Assembly Points and Temporary Shelter Areas: Case of İzmir-Karşıyaka. J. Plan. 2018, 28, 179. [Google Scholar] [CrossRef]
- Şahin, Y.; Hazırcı, M. Geçici İskan Alanlarının Seçimi Için AHP Temelli P-Median Modeli: Burdur Örneği. Mühendislik Bilim. Ve Tasarım Derg. 2019, 7, 403–417. [Google Scholar] [CrossRef]
- Sayar, M.A. Determination of the most suitable place for tent-city using AHP method: Case of Suruc district. Master’s Disertation, Necmettin Erbakan University, Konya, Turkey, 2018. [Google Scholar]
- Gerdan, S.; Şen, A. Kocaeli/Başiskele İlçesi Afet ve Acil Durum Toplanma Alanlarının Yeterliliklerinin Değerlendirilmesi. Mühendislik Bilim. Ve Tasarım Derg. 2020, 8, 489–500. [Google Scholar] [CrossRef]
- Gökgöz, B.İ.; İlerisoy, Z.Y.; Soyluk, A. Acil Durum Toplanma Alanlarının AHP Yöntemi Ile Değerlendirilmesi. Eur. J. Sci. Technol. 2020, 19, 935–945. [Google Scholar] [CrossRef]
- Ekin, E.; Sarıkaya, Z. AHP Tabanlı Topsıs Yöntemi Ile Afet Sonrası Acil Toplanma Alanlarının Belirlenmesine Yönelik Bir Uygulama. Sos. Bilim. Araştırma Derg. 2021, 10, 696–713. [Google Scholar]
- Aşıkkutlu, H.S.; Aşık, Y.; Yücedağ, C.; Kaya, L.G. Olası Deprem Durumunda Mahalle Ölçeğinde Burdur Kenti Acil Toplanma Alanlarının Yeterliliğinin Saptanması. Mehmet Akif Ersoy Üniversitesi İktisadi Ve İdari Bilim. Fakültesi Derg. 2021, 8, 442–456. [Google Scholar] [CrossRef]
- Dayanır, H.; Çınar, A.K.; Akgün, Y.; Çorumluoğlu, Ö. Delphi Yöntemi Kullanarak Afet Sonrası Geçici Barınma Alanı Seçimi ve Planlaması Ölçütlerinin Belirlenmesi: İzmir/Seferihisar Örneği. Doğal Afetler Ve Çevre Derg. 2022, 8, 87–102. [Google Scholar] [CrossRef]
- Yavuz, C.; Kentel, E. Doğu Akdeniz’deki Tsunamijenik Depremlerin Sosyal Risklerinin Monte Carlo Yöntemi Değerlendirmesi. Tek. Dergi 2022, 33, 12741–12760. [Google Scholar] [CrossRef]
- Saaty, T.L.; Niemira, M.P. A Framework for Making a Better Decision. Res. Rev. 2006, 13, 44–48. [Google Scholar]
- Ho, W. Integrated Analytic Hierarchy Process and Its Applications–A Literature Review. Eur. J. Oper. Res. 2008, 186, 211–228. [Google Scholar] [CrossRef]
- Khan, W.A.; Ma, H.L.; Chung, S.H.; Wen, X. Hierarchical Integrated Machine Learning Model for Predicting Flight Departure Delays and Duration in Series. Transp. Res. Part C Emerg. Technol. 2021, 129, 103225. [Google Scholar] [CrossRef]
- Saaty, T.L.; Vargas, L.G. Models, Methods, Concepts & Applications of the Analytic Hierarchy Process; International Series in Operations Research & Management Science; Springer: Boston, MA, USA, 2001; Volume 34, ISBN 978-1-4613-5667-7. [Google Scholar]
- Saaty, T.L. How to Make a Decision: The Analytic Hierarchy Process. Eur. J. Oper. Res. 1990, 48, 9–26. [Google Scholar] [CrossRef]
- Monjezi, M.; Dehghani, H.; Singh, T.N.; Sayadi, A.R.; Gholinejad, A. Application of TOPSIS Method for Selecting the Most Appropriate Blast Design. Arab. J. Geosci. 2012, 5, 95–101. [Google Scholar] [CrossRef]
- Wu, W.W. Beyond Travel & Tourism Competitiveness Ranking Using DEA, GST, ANN and Borda Count. Expert Syst. Appl. 2011, 38, 12974–12982. [Google Scholar] [CrossRef]
- Ho, T.K.; Hull, J.J.; Srihari, S.N. On Multiple Classifier Systems for Pattern Recognition. In Proceedings of the Pattern Analysis and Machine Intelligence TPAMI, The Hague, The Netherlands, 30 August–3 September 1992; pp. 84–87. [Google Scholar]
- Grošelj, P.; Zadnik Stirn, L.; Ayrilmis, N.; Kuzman, M.K. Comparison of Some Aggregation Techniques Using Group Analytic Hierarchy Process. Expert Syst. Appl. 2015, 42, 2198–2204. [Google Scholar] [CrossRef]
- Hruška, R.; Průša, P.; Babić, D. The Use of AHP Method for Selection of Supplier. Transport 2014, 29, 195–203. [Google Scholar] [CrossRef]
- Stojanovic, M. Multi-Criteria Decision-Making for Selection of Renewable Energy Systems. Saf. Eng. 2013, 3, 115–120. [Google Scholar] [CrossRef]
- Demircan, B.G.; Yetilmezsoy, K. A Hybrid Fuzzy AHP-TOPSIS Approach for Implementation of Smart Sustainable Waste Management Strategies. Sustainability 2023, 15, 6526. [Google Scholar] [CrossRef]
- Meng, X.; Shaikh, G.M. Evaluating Environmental, Social, and Governance Criteria and Green Finance Investment Strategies Using Fuzzy AHP and Fuzzy WASPAS. Sustainability 2023, 15, 6786. [Google Scholar] [CrossRef]
- Kushadianto, B.N.D.; Ciptomulyono, U. AHP-COPRAS Model for Determination of Suitability of Surveyor Assignment for Survey of New Building Ships at PT. BKI Main Branch Surabaya. IJEBD Int. J. Entrep. Bus. Dev. 2022, 5, 476–486. [Google Scholar] [CrossRef]
- Hajiagha, S.H.R.; Hashemi, S.S.; Zavadskas, E.K. A Complex Proportional Assessment Method for Group Decision Making in an Interval-Valued Intuitionistic Fuzzy Environment. Technol. Econ. Dev. Econ. 2013, 19, 22–37. [Google Scholar] [CrossRef]
- Yazdani, M.; Alidoosti, A.; Zavadskas, E.K. Risk Analysis of Critical Infrastructures Using Fuzzy Copras. Econ. Res. Istraživanja 2011, 24, 27–40. [Google Scholar] [CrossRef]
- Chatterjee, N.C.; Bose, G.K. A COPRAS-F Base Multi-Criteria Group Decision Making Approach for Site Selection of Wind Farm. Decis. Sci. Lett. 2013, 2, 1–10. [Google Scholar] [CrossRef]
- Xia, F.; Wei, H.; Yang, L.W. Improved COPRAS Method and Application in Material Selection Problem. Appl. Mech. Mater. 2014, 707, 505–508. [Google Scholar] [CrossRef]
- Xie, Z.; Tian, G.; Tao, Y. A Multi-Criteria Decision-Making Framework for Sustainable Supplier Selection in the Circular Economy and Industry 4.0 Era. Sustainability 2022, 14, 16809. [Google Scholar] [CrossRef]
- Wibisono, S.; Hadikurniawati, W.; Jananto, A.; Cahyono, T.D. A Ranking Systems for Handlinf Covid-19 in Southeast Asian Using AHP-COPRAS. JURTEKSI (J. Teknol. Dan Sist. Inf.) 2022, 9, 57–64. [Google Scholar] [CrossRef]
- Mesran, A.; Ramadhani, P.; Nasution, A.; Siregar, D.; Fadlina, F.; Siahaan, A.P.U. Implementation of Complex Proportional Assessment Method in the Selection of Mango Seeds. Int. J. Sci. Res. Sci. Technol. 2017, 3, 397–402. [Google Scholar] [CrossRef]
- Ayrim, Y.; Atalay, K.D.; Can, G.F. A New Stochastic MCDM Approach Based on COPRAS. Int. J. Inf. Technol. Decis. Mak. 2018, 17, 857–882. [Google Scholar] [CrossRef]
- Handayani, R.I.; Normah, N.; Wironoto, D. TOPSIS Method Application in Choosing The Most-Sale POS Cashier Machine Stuffs and Tools in PT. Mahadana Wikasita. SinkrOn 2021, 6, 1–12. [Google Scholar] [CrossRef]
- Wang, X.; Long, S. Analysis of Sustainable Development Level for Resource-Exhausted Cities in China from Perspective of Resilience. Pol. J. Environ. Stud. 2023, 32, 1967–1974. [Google Scholar] [CrossRef]
- Aska, S.T.; Praharsi, Y.; Suhardjito, G. Performance Analysis and Supplier Evaluation Using Analytical Hierarchy Process and Technique for Order Preference by Similarity to Ideal Solution at the Shipyard Company. In Proceedings of the International Conference on Applied Science and Technology on Social Science 2022 (iCAST-SS 2022), Bandung, Indonesia, 21–23 October 2022; pp. 553–562. [Google Scholar]
- Qi, H.; Wang, Y.; Liu, L. Quantitative Analysis of Higher Education Based on AHP-TOPSIS. J. Phys. Conf. Ser. 2022, 2381, 012034. [Google Scholar] [CrossRef]
- Yu, L.; Yang, W.; Duan, Y.; Long, X. A Study on the Application of Coordinated TOPSIS in Evaluation of Robotics Academic Journals. Math. Probl. Eng. 2018, 2018, 1–7. [Google Scholar] [CrossRef]
- Alam Bhuiyan, M.M.; Hammad, A. A Hybrid Multi-Criteria Decision Support System for Selecting the Most Sustainable Structural Material for a Multistory Building Construction. Sustainability 2023, 15, 3128. [Google Scholar] [CrossRef]
- Safronova, A.; Barisa, A.; Kirsanovs, V. Linking Sustainable Mobility Criteria to Policymaking: Results of Multi-Criteria Analysis. EAI Endorsed Trans. Energy Web 2022, 9, e7. [Google Scholar] [CrossRef]
- Reilly, B. Social Choice in the South Seas: Electoral Innovation and the Borda Count in the Pacific Island Countries. Int. Polit. Sci. Rev. 2002, 23, 355–372. [Google Scholar] [CrossRef]
- Hulkower, N.D. Comment on “A New Method to Obtain a Consensus Ranking of a Region’s Vintages’ Quality”. J. Wine Econ. 2012, 7, 241–244. [Google Scholar] [CrossRef]
- Tot, B.; Vujić, G.; Srđević, Z.; Ubavin, D.; Russo, M.A.T. Group Assessment of Key Indicators of Sustainable Waste Management in Developing Countries. Waste Manag. Res. J. A Sustain. Circ. Econ. 2017, 35, 913–922. [Google Scholar] [CrossRef]
- Kontek, K.; Sosnowska, H. Specific Tastes or Cliques of Jurors? How to Reduce the Level of Manipulation in Group Decisions? Gr. Decis. Negot. 2020, 29, 1057–1084. [Google Scholar] [CrossRef]
- Zavadskas, E.K.; Turskis, Z.; Kildienė, S. State of Art Surveys of Overviews on MCDM/MADM Methods. Technol. Econ. Dev. Econ. 2014, 20, 165–179. [Google Scholar] [CrossRef]
- Seddiki, M.; Anouche, K.; Bennadji, A.; Boateng, P. A Multi-Criteria Group Decision-Making Method for the Thermal Renovation of Masonry Buildings: The Case of Algeria. Energy Build. 2016, 129, 471–483. [Google Scholar] [CrossRef]
- Mohammadnazari, Z.; Mousapour Mamoudan, M.; Alipour-Vaezi, M.; Aghsami, A.; Jolai, F.; Yazdani, M. Prioritizing Post-Disaster Reconstruction Projects Using an Integrated Multi-Criteria Decision-Making Approach: A Case Study. Buildings 2022, 12, 136. [Google Scholar] [CrossRef]
- Boyacı, A.Ç.; Tüzemen, M.Ç. Multi-Criteria Decision-Making Approaches for Aircraft-Material Selection Problem. Int. J. Mater. Prod. Technol. 2022, 64, 45. [Google Scholar] [CrossRef]
Disclaimer/Publisher’s Note: The statements, opinions and data contained in all publications are solely those of the individual author(s) and contributor(s) and not of MDPI and/or the editor(s). MDPI and/or the editor(s) disclaim responsibility for any injury to people or property resulting from any ideas, methods, instructions or products referred to in the content. |
© 2023 by the authors. Licensee MDPI, Basel, Switzerland. This article is an open access article distributed under the terms and conditions of the Creative Commons Attribution (CC BY) license (https://creativecommons.org/licenses/by/4.0/).