Abstract
The harmonious development of human settlement environments (HSEs) and resident demands (RD) contributes to the sustainable development of areas. However, few studies have focused on development-level evaluations and analyses of coupling coordination between the two. This study used a comprehensive evaluation index model and a coupling coordination degree model to measure the development level, coupling coordination degrees, and spatial characteristics of HSE and RD in 31 regions of China. The results display the following: (1) The developing degree of HSE and RD continued to improve, with spatial heterogeneity, whereas the development level of RD and the regional economy was positively correlated; (2) the degree of coupling between the two was relatively high, with high-level coupling areas accounting for 77%, and the coupling coordination level included a medium level and primary levels; (3) in the coupling and coordination relationship between subsystems, living needs > security requirements > respected needs > social needs > self-realization needs, and environmental safety > ecological environment. This study offered a new research perspective for the sustainable development of areas and put forward suggestions for promoting development.
1. Introduction
Human settlement environments have an extremely powerful impact on people’s quality of life and health. Human settlement environments (HSE) refers to the environment in which humans live, produce, and work, as well as the surface space related to human survival activities [1]. A good living environment can affect a person’s physical health and emotions and can also promote social and economic development. In September 2015, the United Nations proposed to make cities resilient, inclusive, safe, and diverse by 2030, including the goal of accelerating sustainable economic, social, and environmental development, ensuring that everyone has a safe space [2]. During the last decade, China has continuously increased efforts to improve urban human settlements. At the Urban Work Meeting, Chairman Jinping Xi proposed that “city administration should take creating a good living ambient as the final purpose”. In 2022, China issued the latest version of the “Management Measures for the Application and Selection of the China Habitat Environment Award”, aiming to comprehensively promote the improvement of the quality of China’s living environment. The demand of the world, and China, for the improvement of human settlements continues to drive research on the same.
HSE research in European and American countries began in the 16th to 18th centuries [3]. The British scholar Howard proposed the concept of the “garden city”, believing that cities should be combined with landscaping to improve HSEs [4]. In the 1950s, Dosayadis proposed the definition of a “human settlement”, initiating a systematic study of HSEs [5]. In the latter part of the 20th century, HSE science began to develop and gradually grew into a global research field, with human–environment relations becoming the focus of research [6]. On 17 December 1985, the United Nations adopted a resolution at the 40th United Nations General Assembly to establish World Habitat Day, proposing to accelerate the continuous development of HSE, aiming to raise people’s awareness of HSE issues and promote HSE research. The disciplines involved in HSE research include environmental science and ecology, science and technology, green sustainability and technology, and urban research. China’s HSE research originated in the 1950s and increased in the 1990s. Chinese scholars’ research on HSE has involved the intersection and integration of multiple disciplines, including architecture, planning, geography, etc. [7]. The research content has included overviews [5], indicator systems [8], theories [9], etc. The research methods have included questionnaires and surveys [10], analytic hierarchy processes [11], ArcGIS spatial analyses, etc. [12]. International HSE research originated from human settlements, primarily focusing on physical geography at the micro level. In comparison, China’s HSE research originated from architecture, primarily focusing on regional differences and relationships with cities from a macro perspective. HSE is related to many sectors, such as nature, ecology, and economics [13]. As interdisciplinary research targets, these continue to integrate and develop along with geography, psychology, and other fields.
There is a close relationship between HSE and RD. RD determines the direction and focus of HSE development, and HSE improvement can also meet and promote RD. RD is the demand of residents for their environment, public facilities, and services. International scholars have conducted research on residents’ needs, including research on residents’ satisfaction and hierarchical research on RD. For example, Bisbas et al. conducted research on overall residential satisfaction in social research from 1961 to 2020 [14]. Gharagozlou et al. conducted complex research exploring the impact of factors such as the living environment, housing quality, and community facilities on residents’ satisfaction [15]. Maslow’s demand hierarchy theory is currently considered the most comprehensive interpretation of RD, reflecting the hierarchy and system of human needs, including physiological, security, social, respect, and self-realization needs. Research on RD in China has primarily included research on RD in different fields, research on the influencing factors of RD, and research on the relationships between RD and other factors, such as elderly care needs [16], leisure needs [17], and sports or public service needs [18]. Zhong proposed, through research, that the influencing factors of RD included the economic level, educational level, social status, etc. [19]. Wang systematically analyzed the connection between RD and city layout and proposed relevant theories and practices [20]. Liu et al. investigated the relationship between RD and public service and proposed differentiated public service supplies based on RD [21].
From the existing literature, research on HSE and RD has been consistently enriched, but few people have focused on HSE and RD at the same time. Coordinated development of HSE and RD could reduce environmental pollution, improve the qualitative city ecological environments, and achieve sustainable development of cities. Therefore, research on the problem of coupling and coordination of these two should be deeply explored. In summary, this article attempted to address the following issues: (1) Establish a comprehensive evaluation index system for the development level of HSE and RD; (2) analyze the coupling and coordination relationship between HSE and RD; and (3) provide suggestions for the coordinated development of HSE and RD.
To facilitate these goals, the study established an indicator system for the development level of HSE and RD and measured the spatial and temporal variations of the development level, Coupling Degree (CD), and Coupling Coordination Degree (CCD) using data from four time periods in 31 regions of China (from the years 2005 to 2020) as samples. The contributions of this article were as follows: (1) Based on Maslow’s demand hierarchy theory, the development-level assessment system of RD was established, and the development-level evaluation indices system of HSE was constructed from the perspective of the ecological environment and environmental safety. (2) The paper measured and evaluated the development degree of HSE and RD in 31 regions of China, as well as their coupling and coordination relationships and their spatiotemporal variation characteristics, offering empirical evidence for the harmonious development of HSE and RD. (3) The interactive coupling and coordination relation between the RD subsystem and the HSE subsystem was analyzed, and countermeasures and advice for accelerating the harmonious development of the two subsystems were offered.
2. Materials and Methods
2.1. Study Area
This study area chose 31 regions in China, excluding Hong Kong, Macao, and Taiwan. China has a total area of 9.6 million square kilometers, spanning two geographical regions: East Asia and Central Asia. According to physical and geographical characteristics, these were subdivided divided into the Northeastern region, Northwestern region, Eastern region, Northern region, Central region, Southwestern region, and Southern region, as Figure 1 shows.
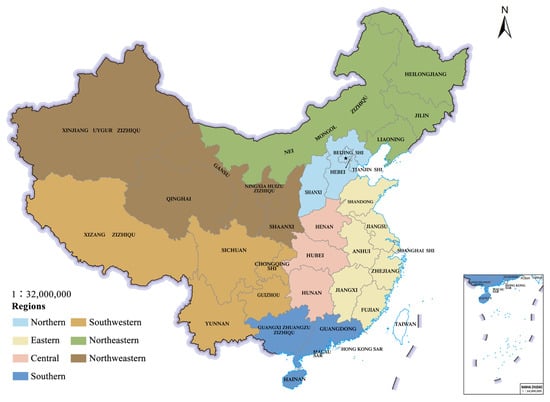
Figure 1.
Map of 31 regions and their geographical distribution in China.
2.2. Data Sources and Indicators
The research data involved in this paper included data taken from the China Statistical Yearbook (2011–2021), China Environmental Statistical Yearbook, and China Tourism Statistical Yearbook. The research sample period was selected from four time periods between 2005 and 2020: 2005, 2010, 2015, and 2020.
The ecological environment and environmental safety are two important aspects of HSE; both are directly related to people’s health and quality of life. Preserving the eco-environment and strengthening environmental safety are basic requirements for sustainable development. Thus, choosing these two aspects as evaluation indicators for HSE is beneficial to promoting a city’s sustainable development. Specifically, HSE includes 2 first-grade indicators and 11 secondary indicators. The selection of secondary indicators for the ecological environment comprehensively considers both the overall level and the per capita level, while environmental safety comprehensively considers both environmental pressure and the environmental response and combines previous research results. Among these, ecological environmental indicators include forest coverage [22], per capita water resources, green coverage in built-up areas [23], per capita park green space area [24], and natural reserve area [25]. Environmental safety indicators include the treatment rate of urban sewage, the harmless treatment rate of domestic garbage, the treatment rate of industrial solid waste [26], the total amount of industrial wastewater discharge, the total amount of industrial exhaust gas discharge, and the amount of industrial solid waste generated [27].
Based on Maslow’s demand hierarchy theory, this study constructed the development-level evaluation index system for RD. Maslow’s demand hierarchy theory has the advantages of comprehensiveness and scientificity, including living needs, security requirements, social needs, respected needs, and self-realization needs. These five aspects are Maslow’s scientific judgments, made through actual case studies and data validation, comprehensively summarizing various human needs. In addition, Maslow’s five demand levels have a progressive relationship. This study did not use the progressive relationship but rather used the entropy method to scientifically quantify the weight of the index. Specifically, the RD indicator system included 5 primary indicators and 18 secondary indicators. Living needs indicators included per capita household disposable income [28], Engel’s coefficient [29], the prevalence rate of urban water consumption [30], the prevalence rate of urban gas, and public transportation vehicles. Security requirements included the number of medical institutions, the number of beds in those medical institutions [31], environmental pollution, damage or accidents, and natural disaster losses. Social needs included the total number of domestic tourist attractions receiving tourists, the operating revenue of tourist attractions [32], the number of museum visitors, and the number of audience members at art performance venues [33]. Respected needs included the proportion of people receiving higher education and the divorce rate [34]. Self-realization needs included the number of research and experimental development (R&D) projects, research and experimental development (R&D) funding expenditures [35], total wages of urban unit employees, and the urban registered unemployment rate [36]. This study used the entropy method to calculate indicator weights, as Table 1 shows.

Table 1.
The development level evaluation index system of HSE level and RD.
2.3. Research Methods
2.3.1. Entropy Method
This study used the entropy method to compute the weight of indicators. This method can comprehensively and objectively reflex the significance of indicators and has the advantages of simple calculation and easy implementation, as shown in Formulas (1) and (2). Qij represents the proportion of the index Xij, Ri represents the entropy value of the index, and λij represents the weight of the index.
The first step is to standardize the data.
The second step is to calculate indicator weights.
2.3.2. Calculation of Comprehensive Evaluation Index
This research adopted the comprehensive evaluation index method to evaluate the development level of the HSE system and the RD system, as shown in Formula (3). k1 represents the comprehensive evaluation index of HSE, and k2 represents the comprehensive evaluation index of RD. The comprehensive evaluation index method is an integrated index system evaluation approach based on multiple factors and wide applications in ecological environment governance evaluation.
2.3.3. Coupling Coordination Model
This study used the CD calculation Formula (4) and the CCD calculation Formula (5). Among them, C represents the coupling degree, T represents the coordination index, and D represents coupling co scheduling. The coupling coordination model can reflex the degree of interaction between an HSE system and an RD system and is an effective evaluation tool that reflects the coordinated development level among multiple systems. It has been widely used to analyze economic, social, and environmental issues considering different scales and regions [37].
3. Results
3.1. Analysis of the Development Level of HSE and RD
3.1.1. HSE Development Level Index
Index evaluation can objectively reflect the development level and direction of research objects. As shown in Figure 2, the development level index of HSE in 31 regions of China continued to improve. Among these regions, Xizang had the highest development level of HSE, followed by Qinghai, Xinjiang, and Neimenggu. Xizang’s HSE level always led the country, with a 2020 HSE index of 0.70—higher than Qinghai’s (0.26), which ranked second. Xizang is rich in natural resources such as water resources, mineral resources, and grassland resources, and has excellent air quality due to its high altitude and low atmospheric pressure. As displayed in the 2021 Xizang Autonomous Region Ecological Environment Status Bulletin, monitoring showed that the overall ecological and environmental quality of Xizang remained stable, and it ranked among regions with the best ecological and environmental quality in the world. In 2020, the areas with a low level of HSE system in human settlements included Tianjin (0.07), Shanghai (0.07), and Jiangsu (0.08). Tianjin and Jiangsu, at the time of this work, had a permanent resident population of over 10 million, and their economic development level was at the forefront of China. However, HSE and economic development were poor due to insufficient environmental infrastructure, difficulties reducing pollution, and unstable environmental improvement results. In comparing HSE indexes across four time periods (2005, 2010, 2015, and 2020), it was noted that the levels of HSE in all 31 regions improved. These improvements cannot be separated from continuous policy promotion. The 16th National Congress of China established the goal of sustainable development. The 18th National Congress of China incorporated the construction of an eco-civilization into the general layout of Chinese characteristic socialism. Thus, ecological civilization construction was upgraded to a national strategic goal. Since that time, various environmental protection policies have been continuously improved, including regional environmental policies [38], air pollution control policies [39], and environmental policies at specific government levels [40]. The number of environmental policies has also shown an upward trend. In 2005, there were 15 active environmental policies. After 2010, the number of policies increased significantly, reaching a peak of 62 environmental policies in 2016 [41].
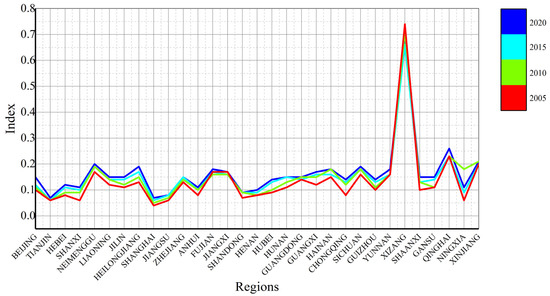
Figure 2.
The development level index of HSE.
3.1.2. RD Development Level Index
As shown in Figure 3, a time series analysis of the development level index of RD in 31 regions in China in 2005, 2010, 2015, and 2020 showed that the development level indexes of RD in all 31 regions significantly increased in 2020. In 2020, the region with the highest RD index was Shanghai (0.95), with a growth rate of 73% compared to 2005, followed by Beijing (0.89) with a growth rate of 66%, Zhejiang (0.68) with a growth rate of 43%, and Jiangsu (0.56) with a growth rate of 32%. In 2020, the RD indexes of Xizang (0.23), Gansu (0.25), Guizhou (0.27), Yunnan (0.29), Qinghai (0.29), and Xinjiang (0.29) increased by 10% and 16%, respectively. China made significant progress in various aspects and RD indicators from 2005 to 2020. During that time, China’s total GDP increased from 18.2 trillion RMB to 101.6 trillion RMB, with an annual increase rate of 7.9%. Urban per capita disposable income increased from 10,493 RMB to 43,834 RMB. The urbanization rate increased from 43.9% to 63.9%. The penetration rate of internet access and digital technology increased from 10.5% to 67.1%. Infrastructure aspects, such as high-speed railways, highways, and bridges, were continuously strengthened, and the medical/ health system, education system, and physical fitness reform all continuously improved. Therefore, the development level indexes of RD in 31 regions all improved to varying degrees. By comparing Figure 2 and Figure 3, it can be found that the increase in RD is significantly greater than that of HSE, indicating that the growth of RD can promote the growth of HSE. Based on the analysis of HSE and RD index systems, it is found that the higher the RD level, the higher people’s living standards, and the more attention will be paid to the improvement of the HSE level. Meanwhile, compared with the RD level, the HSE level needs to be greatly increased.
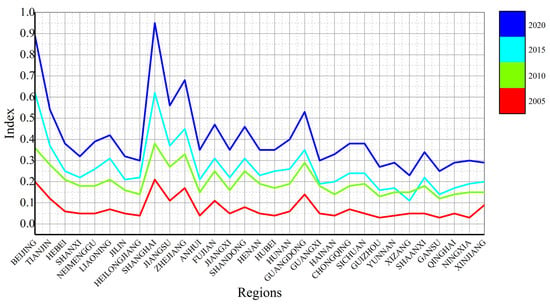
Figure 3.
The development level index of RD.
3.1.3. Spatial Distribution Characteristics of Development Level for HSE and RD
For the purpose of studying the spatial distribution feature of the development level for HSE and RD, the level indexes of the two were classified based on the average, maximum, minimum, and regional distribution of the level indexes. The development level index of HSE was divided into three levels. High-level areas (1.0–0.7), medium-level areas (0.7–0.1), and low-level areas (0.1–0). The RD level was also divided into three levels: High-level areas (1.0–0.4), medium-level areas (0.4–0.3), and low-level areas (0.3–0). As shown in Figure 4, HSE and RD exhibited spatial heterogeneity. In 2020, the RD levels were high in Shanghai, Beijing, Zhejiang, Jiangsu, Tianjin, Guangdong, Fujian, Shandong, and Liaoning, while the HSE levels were either low or medium. Xizang, which had a high HSE level, has a relatively low RD level and was only located in low-level areas. Based on analyses of practical factors, it was determined that the economic development level had a certain negative influence on HSE. Areas with high RD levels were concentrated in the coastal areas of China, where the level of economic development was relatively high. However, these same areas caused pollution and damage to the environment to varying degrees. In the meantime, the distribution of natural resources and human resources differed. Xizang, a region with a high level of HSE, was rich in natural resources, had a relatively small population, and had low levels of human resources and economic development. This resulted in a good ecological and environmental foundation, a high level of environmental safety, and a low level of economic activity that inhibited the improvement of residents’ demand. Therefore, areas with high HSE levels appeared in pairs with areas with low RD levels, and areas with low HSE levels appeared in pairs with areas with high RD levels.
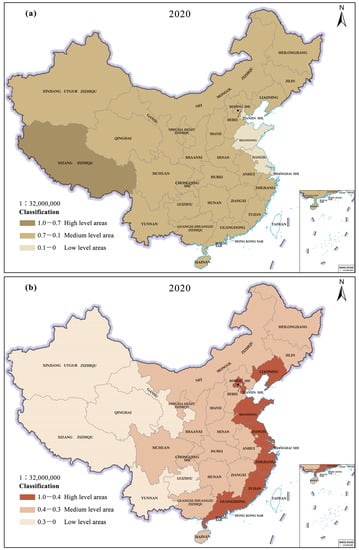
Figure 4.
Spatial distribution of HSE and RD level index grading in 2020: (a) HSE; (b) RD.
3.1.4. The Relationship between RD Level and Economic Development
The RD level was closely related to economic development. For further analysis, the RD index and per capita gross national product (GNP) aggregation and combination charts were drawn, as shown in Figure 5 and Figure 6. There was a remarkable positively correlated between RD levels and per capita GNP. In 2020, in Beijing (164,900 RMB/person), Shanghai (155,800 RMB/person), Jiangsu (121,200 RMB/person), Tianjin (101,600 RMB/person), Zhejiang (100,600 RMB/person), and Guangdong (88,200 RMB/person), where per capita GNP values were relatively high, the RD level indexes were, respectively, 0.89 for Beijing and 0.95 for Shanghai. At the same time, in Gansu (36,000 RMB/person), Guizhou (46,300 RMB/person), Heilongjiang (42,600 RMB/person), and other regions with relatively low per capita GNP, the RD levels were also relatively low (Gansu 0.25), Guizhou (0.27), and Heilongjiang (0.30). This indicated that the level of RD could not be separated from the increase in the district economy development level. With the development of the economy, people’s income levels improved, and the demand for material and cultural life increased, thereby promoting the growth of RD levels. At the same time, improvements in RD levels could stimulate economic development, stimulate market demand, and promote industrial upgrading and technological innovation. Therefore, RD levels and economic development levels have a mutually beneficial relationship.
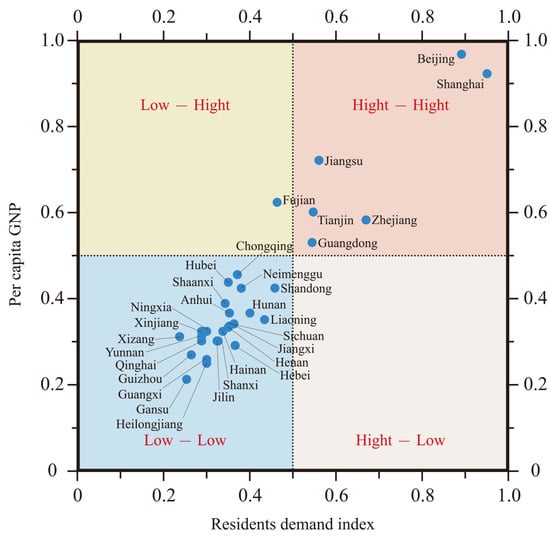
Figure 5.
Cluster Diagram of RD index and per capita GNP in 2020.
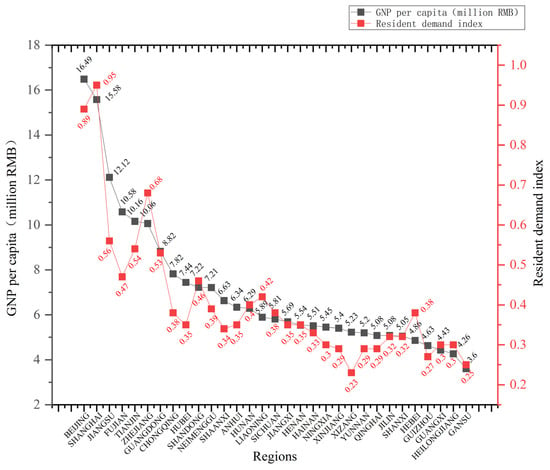
Figure 6.
Combination diagram of RD index and per capita GNP in 2020.
3.2. Spatiotemporal Analysis of CD and CCD
3.2.1. Coupling Degree Analysis of HSE and RD
This study measured the CD of HSE and RD based on cross-sectional data from 31 regions in China in 2005, 2010, 2015, and 2020. For the purpose of demonstrating the spatial distribution feature of CD between the two, a hierarchical classification of CD was conducted. Because the coupling degree is always high, trisection is not used. This study divides the index of 0 to 1 into a 2:4:4 ratio. CD values lower than 0.4 were referred to as low-level coupling, CD values between 0.4 and 0.8 were referred to as medium-level coupling, and CD values above or equal to 0.8 were referred to as high-level coupling. As shown in Figure 7, based on spatial analysis, the CD of HSE and RD showed a significant increase over time, with a gradual increase in high-level coupling regions from 19 in 2005 to 24 in 2020, accounting for 77%. Moreover, high-level coupling areas were concentrated in the northeastern, northwestern, central, southern, and some southwest areas, while Shandong, Jiangsu, Shanghai, Zhejiang, and Beijing in the northern region and Tianjin in the eastern region were reduced from high-level coupling areas to medium-level coupling areas. While the overall level of coupling in China significantly increased, there were decreases in CD in areas such as Beijing, Tianjin, Shandong, Jiangsu, and Zhejiang, which decreased from high-level to medium-level coupling areas. Improvements in the economic level promoted the diversity of RD and enhanced residents’ adaptability to HSEs. Additionally, those improvements added to innovations of HSEs, thus alleviating the contradiction between HSE and RD to a certain extent. Therefore, the CD decreases in some regions with high levels of economic development.
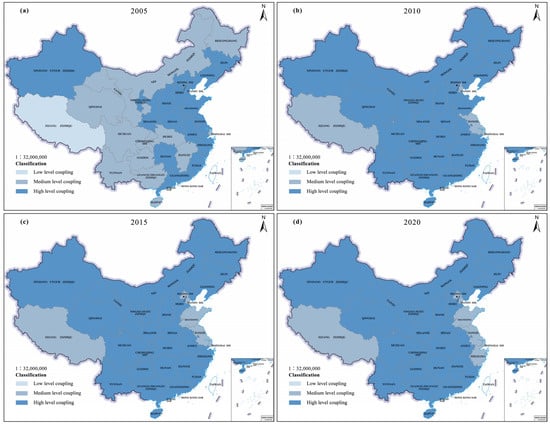
Figure 7.
The spatiotemporal evolution of the CD between HSE and RD: (a) 2005; (b) 2010; (c) 2015; (d) 2020.
3.2.2. Coupling Coordination Degree Analysis of HSE and RD
To demonstrate the spatio-temporal change of CCD, this study classified the CCD values of HSE and RD into four levels: Low-level coordination (<0.3), primary-level coordination (0.3–0.5), medium-level coordination (0.5–0.7), and high-level coordination (>0.7). As shown in Figure 8, the CCD values in 31 regions showed growth over time and certain regional differences in space. The number of medium-level coordination regions grew from 0 in 2005 to 14 in 2020, primarily distributed in Heilongjiang, Jilin, and Neimenggu in the northeastern, Xinjiang and Qinghai in the northwestern, Xizang and Sichuan in the southwestern area, Zhejiang, Jiangxi, and Fujian in the eastern area, Hunan in the middle area, and Guangzhou and Hainan in the southern area. The remaining 17 regions were primary-level coupling coordination regions in 2020. The quantity of low-level coupling coordination areas decreased from 24 in 2005 to 0 in 2020, while the number of high-level coupling coordination areas was always 0. High-level coupling and coordination areas did not emerge in the periods under study, indicating the need for further improvement in the following aspects: (1) The humanization levels of urban planning and construction in various regions, (2) residents’ satisfaction with the urban environment, and (3) the attractiveness of the city image. To do so would further improve the coupling and coordination of HSE and RD and accelerate the continuous development of the region. At the same time, the balance between HSE and RD must be closely watched in practical applications to avoid the overconsumption of sources and costs.
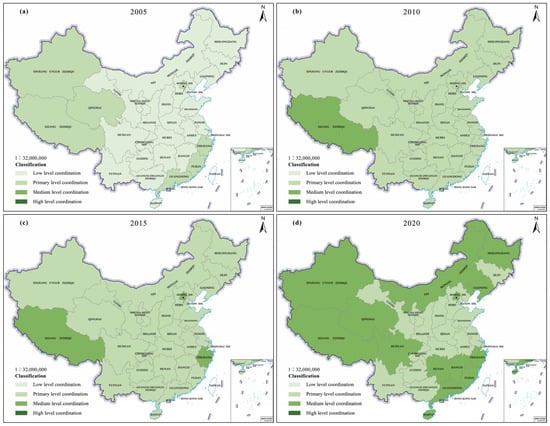
Figure 8.
The spatiotemporal evolution of the CCD between HSE and RD: (a) 2005; (b) 2010; (c) 2015; (d) 2020.
3.2.3. Coupling Coordination Relation between HSE and RD Subsystem
For further analysis of the interactive coupling coordination relationship between the HSE and RD subsystems, the CCD values of the HSE and RD subsystems were calculated using 2020 as a sample period, as shown in Table 2 and Figure 9. Overall, the living needs subsystem (LN) (0.534) > security requirements subsystem (SR) (0.530) > respected needs subsystem (RN) (0.495) > social needs subsystem (SN) (0.425) > self-realization needs subsystem (SRN) (0.386). From the CCD of the HSE and living needs subsystem, only Xizang was high level. Meanwhile, 20 regions, including Beijing and Qinghai, were medium level, and 10 regions, including Guizhou and Hebei, were primary level. According to the CCD of the HSE and security requirements subsystem, 24 regions, including Xizang and Sichuan, were medium level, while the remaining 7 regions were primary level. According to the CCD of the HSE and social needs subsystem, five regions, including Jiangxi and Sichuan, were medium-level, while 23 cities, including Henan, Anhui, and Hubei, were primary-level. Shanghai, Tianjin, and Ningxia were low-level. According to the CCD of the HSE and respected needs subsystem, Xizang was at a high level, while 16 regions, including Beijing, Jiangxi, and Guangdong, were medium level, and 14 cities, including Heilongjiang, Neimenggu, and Qinghai, were primary level. From the perspective of the CCD of the HSE and self-realization needs subsystem, Guangdong and Zhejiang were medium-level, while 26 regions, including Jiangsu, Fujian, and Sichuan, were primary-level, and Hainan and Tianjin were low-level. The primary and medium levels were the main coordination types. From the level distribution of CCD, we observed that, in most regions, the CCD values of the HSE and living needs subsystem and the security requirements subsystem were relatively high, and the coupling and coordination relationships with the self-realization needs subsystem were the lowest. The self-realization needs subsystem became the main factor restricting the CCD of HSE and RD.

Table 2.
Coupling coordination relation between subsystems.
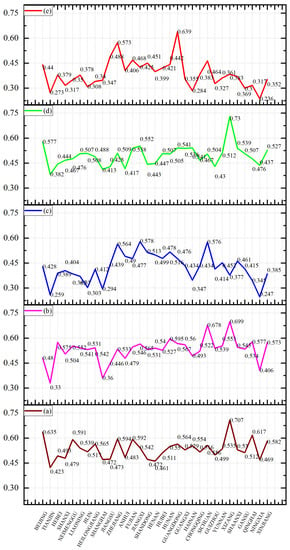
Figure 9.
The CCD of HSE and RD subsystems: (a) HS-LN; (b) HS-SR; (c) HS-SN; (d) HS-RN; (e) HS-SRN.
Upon further analysis of the interactive coupling coordination relationship between RD and HSE subsystems, taking 2020 as the sample period, the CCD of RD and HSE subsystems was calculated, as shown in Table 2 and Figure 10. Overall, the environmental safety subsystem (ES) (0.951) was greater than the ecological environment subsystem (EE) (0.791). The CCD between RD and the environmental safety subsystem was significantly higher than that between RD and the ecological environment subsystem. According to the CCD of RD and the ecological environment subsystem, 24 regions, including Beijing, Tianjin, and Hebei were high-level, while 5 regions, including Yunnan and Xizang, were medium-level. Ningxia and Xinjiang were primary-level. According to the CCD of RD and the environmental safety subsystem, all 31 regions were high-level. This indicated that, compared to the environmental safety subsystem, it would be necessary to further strengthen the coupling and coordinated development of RD and the ecological environment subsystem. The high CCD of RD and the environmental safety subsystem indicated that China’s environmental safety construction achieved certain results. In order to promote environmental safety construction, China revised and implemented a new version of the Environmental Protection Law in 2014. China’s environmental safety construction experienced an exploration period (1978–1988), a development period (1989–2002), a deepening period (2003–2012) [42], and an improvement period (2013–2020). Driven by continuous policy tools, environmental safety protection efforts have been continuously strengthened.
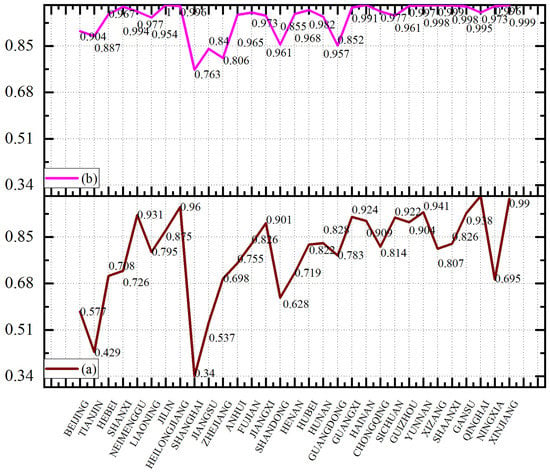
Figure 10.
The CCD of RD and HSE subsystems: (a) RD-ES; (b) RD-EE.
4. Discussion
4.1. Research Contributions and Research Comparisons
The main contribution of this study was the construction of an RD evaluation indicator system on the basis of Maslow’s demand hierarchy theory, which comprehensively covered various levels of RD elements, providing support for the exploration of the coupling-coordinated development of HSE and RD. In addition, this study proposed a new perspective for studies on the continuous development of people and the environment. HSE and RD are two mutually reinforcing and interdependent systems. The coordinated development of the two could promote social harmony and regional sustainable development. This sustainable development would be based on the current situation of the ecological environment and environmental safety, combined with the theory of human demand hierarchy, and ultimately conducive to promoting the harmonious coexistence of humans and the environment.
In comparison with similar types of research, this research drew on the coupling coordination model of coordinated development of multi-systems, which is a relatively mature and extensively used method. For example, Luo et al. used CCD models to explore the coupling and coordination between low-carbon development and the ecological environment in their research on sustainable development approaches [34]. Feng et al. applied the CCD model to measure the coupling and coordination scheduling of urbanism and ecological elements’ total energy efficiency [43]. Liang et al. investigated the coupling and coordination relation between the social economy and the ecological environment using the CCD model [44]. In the choice of research methods, based on the research methods of these scholars, this paper added the interaction coupling coordination analysis of subsystems in order to analyze the critical factors influencing the CCD of the two.
4.2. Recommendations
- (1)
- As can be observed from the HSE- and RD-level evaluation and coupling coordination analysis, policy tools have been the main driving factor behind the promotion of the coupling-coordinated development of HSE and RD in China. In order to take that drive further, it will be necessary to formulate and implement cross-border environmental protection policies, including joint policies between different departments, and regional environmental protection policies with urban agglomerations, such as the Yangtze River Delta, the Guangdong–Hong Kong–Macao Greater Bay Area, and the Beijing–Tianjin–Hebei region.
- (2)
- From the distribution of the coupling coordination level of subsystems, the self-realization requirements subsystem and the ecological environment subsystem were key factors. They constrained the development level of coupling coordinated. Our specific analysis found that R&D investment and urban income level were the limiting factors in the secondary indicators. The insufficient investment in Government R&D funds has constrained the development of technology, reducing the employment and income levels of related industries. Therefore, social forces should be introduced to take an active role in the development of ecological products, industrial development, technological innovation, and technical services, and encourage social capital to enter the pollutant treatment market, participate in ecological environment construction, and expand the scale of the environmental protection industry and the production of renewable and clean energy.
4.3. Future Research Directions
Due to article length limitations, this study had some shortcomings and should be expanded in future research. First, because of the restriction of data consistency and usability, the selection of RD indicators in this study was insufficient. In the future, relevant data will be obtained through questionnaires, interviews, and other forms to strengthen the scientific nature of indicator construction. Second, the driving system for the coupling-coordinated development of HSE and RD was not deeply explored. Future research will address these shortcomings.
5. Conclusions
The paper established an HSE index system based on the ecological environment and environmental safety, and an RD indicator system based on Maslow’s demand hierarchy theory. Using a comprehensive evaluation model and CCD model, it measured the development degree of HSE and RD in China, as well as CCD, and its interactive coupling coordination relationship. The research conclusions were as follows:
- (1)
- The levels of HSE and RD in China continue to grow, with significant spatial distribution characteristics. RD levels decreased from coastal areas to inland areas, while HSE levels decreased from inland areas to coastal areas. The RD and per capita regional GDP exhibited the characteristic of mutual agglomeration at the same level.
- (2)
- There was a significant coupling relationship between HSE and RD, with a high CD. The level of CCD was concentrated at the medium and primary levels, and high-level CCD areas have not appeared.
- (3)
- Through the CCD analysis of HSE and RD subsystems, it is found that living needs > security requirements > respected needs > social needs > self-realization needs. Through the CCD analysis of RD and HSE subsystems, it was found that the environmental safety subsystem > ecological environment subsystem.
Author Contributions
Conceptualization, investigation, writing—original draft, writing—review and editing, Y.Z.; software, visualization, data curation, methodology, Z.F.; conceptualization, Z.X. All authors have read and agreed to the published version of the manuscript.
Funding
This research received no external funding.
Institutional Review Board Statement
Not applicable.
Informed Consent Statement
Not applicable.
Data Availability Statement
The data will be made available upon request.
Conflicts of Interest
No conflict of interest exists in the submission of this manuscript. We would like to declare that the work described is original research that has not been published previously and is not under consideration for publication elsewhere, in whole or in part.
References
- Zhang, T. A Brief Discussion on the Rural Human Settlements Environment in Xi’an under the Rural Revitalization Strategy. Agric. Dev. Equip. 2023, 254, 6–7. [Google Scholar]
- Guerra, J.B.S.O.A.; Hoffmann, M.; Bianchet, R.T.; Medeiros, P.; Provin, A.P.; Iunskovski, R. Sustainable Development Goals and Ethics: Building “the Future We Want”. Environ. Dev. Sustain. 2021, 24, 1–22. [Google Scholar] [CrossRef]
- Engels, F. Socialism: Utopian and Scientific; Foreign Languages Press: Beijing, China, 1974. [Google Scholar]
- Ebenezer, H. Tomorrow’s Pastoral City; Commercial Press: Beijing, China, 2002. [Google Scholar]
- Tian, S.; Yang, B.; Li, X.; Yang, J.; Liu, Z. A Review and Prospect of Domestic and International Living Environments from Interdisciplinary Knowledge to Cross Integration. World Geogr. Res. 2022, 01, 1–19. [Google Scholar]
- Wu, L. Research Progress. in Human. Settlement Environment Science: 2002–2010; China Construction Industry Press: Beijing, China, 2011. [Google Scholar]
- Ma, R.; Zhang, W.; Yu, J.; Wang, D.; Chen, L. Overview and Prospect of Research on Human Settlement of Chinese Geographers. Sci. Geogr. Sin. 2014, 34, 1470–1479. [Google Scholar]
- Li, X.; Li, W. Quantative Analysis about Coordinating Development of Environment of Urban Human Settlements and Economy in Dalian since the 1990s. Econ. Geogr. 2005, 25, 383–386. [Google Scholar]
- Qi, X.; Cheng, Y.; Chen, L.; Chen, J. Review of Literatures on Human Settlements. World Reg. Stud. 2007, 16, 17–24. [Google Scholar]
- Wang, D.; Fang, C.; Yang, Q.; Li, F. Chinese Urbanization Speed Judging Based on Urbanization Quality. Sci. Geogr. Sin. 2010, 30, 643–650. [Google Scholar]
- Cong, Y.; Xia, B.; Zhang, J. Associated Evaluation of Subjective and Objective of Human Settlements on a City Scale: A Case Study of Guangzhou City. Trop. Geogr. 2010, 30, 183–187. [Google Scholar]
- Yang, J.; Guo, A.; Xi, J.; Ge, Q.; Li, X. Spatial-Temporal Differentiation of Three-Dimensional Urban Landscape Pattern: A Case Study of Zhongshan District in Dalian. Acta Geogr. Sin. 2017, 72, 646–656. [Google Scholar]
- Zhang, W.; Li, C.; Yang, Y. Research Progress on Human Settlement Evolution. Prog. Geogr. 2013, 32, 710–721. [Google Scholar]
- Biswas, B.; Sultana, Z.; Priovashini, C.; Ahsan, M.N.; Mallick, B. The Emergence of Residential Satisfaction Studies in Social Research: A Bibliometric Analysis. Habitat. Int. 2021, 109, 102336. [Google Scholar] [CrossRef]
- Fariba, G.; Seyed, M. Residential Satisfaction: A Review of Literature. Int. J. Hous. Mark. Anal. 2018, 11, 73–100. [Google Scholar]
- Yang, W.; Li, M. Research on the Demand for Elderly Care Real Estate among Chinese Residents and Its Influencing Factors: An Empirical Study Based on Wuhan City Data. Constr. Econ. 2020, 41, 92–98. [Google Scholar]
- Wang, Q.; Wei, J. Changes in Leisure Needs of Urban Residents in China over the Past Twenty Years. J. Harbin Inst. Technol. (Soc. Sci. Ed.) 2020, 22, 45–51. [Google Scholar]
- Xia, J. Investigation and Research on the Demand for Sports Public Services among Urban and Rural Residents in the Yangtze River Delta Region of China. J. Nanjing Norm. Univ. (Nat. Sci. Ed.) 2012, 35, 150–156. [Google Scholar]
- Zhong, X. Research on the Influencing Factors of Residents’ Demand. Theor. Res. Urban. Constr. 2019, 25, 96–99. [Google Scholar]
- Wang, X. Resident Needs and Urban. Planning: Theory and Practice; China Construction Industry Press: Beijing, China, 2018. [Google Scholar]
- Liu, H.; Zhang, M. Research on the Matching between Residents’ Needs and Public Services. Econ. Theory Bus. Manag. 2019, 35, 58–62. [Google Scholar]
- Ge, D.; Chen, Q.; Lai, Z. Coupling and Coordination Analysis of Provincial Tourism, Economy, and Ecological Environment in China. Ecol. Econ. 2021, 37, 132–139. [Google Scholar]
- Cheng, H.; Xu, Q.; Guo, R. The Spatiotemporal Evolution of the Coupling and Coordinated Development of Tourism Resource Development and Ecological Environment in China. Econ. Geogr. 2019, 39, 233–240. [Google Scholar]
- Ma, Z.; Xie, Z. Sun Research on the Coupling and Coordination of Population, Economy and Environment in “the Belt and Road” Provinces (Municipalities, Autonomous Regions). J. Southwest. Norm. Univ. (Nat. Sci. Ed.) 2020, 45, 32–39. [Google Scholar]
- Han, W.; Chen, X.; Pang, J.; Wang, N.; Yu, Y. Research on the Coupled and Coordinated Development of Urbanization Ecological Environment Tourism Industry: A Case Study of 9 Provinces (Districts, Cities) along the Silk Road Economic Belt. J. Lanzhou Univ. (Nat. Sci.) 2018, 54, 762–769. [Google Scholar]
- Song, J. Evaluation of the Coordination Degree of Population Economy Environment System Coupling in the Yellow River Basin. Stat. Decis.-Mak. 2021, 37, 185–188. [Google Scholar]
- Yang, S.; Qin, Y.; Deng, W.; Ji, M. Comparison of the Coupling Relationship between Tourism Economy and Ecological Environment in China’s Top Ten Urban Agglomerations. Stat. Decis. Mak. 2017, 22, 131–134. [Google Scholar]
- Ma, M.; Tang, J. Interactive Coercive Relationship and Spatio-Temporal Coupling Coordination Degree between Tourism Urbanization and Eco-Environment: A Case Study in Western China. Ecol. Indic. 2022, 142, 109149. [Google Scholar] [CrossRef]
- Song, M.; Hu, C. A Coupling Relationship between the Eco-Environment Carrying Capacity and New-Typ Urbanization: A Case Study of the Wuhan Metropolitan Area in Chin. Sustainability 2018, 10, 4671. [Google Scholar] [CrossRef]
- Lin, G.; Jiang, D.; Yin, Y. A Carbon-Neutral Scenario Simulation of an Urban Land-Energy-Water Coupling System: A Case Study of Shenzhen, China. J. Clean. Prod. 2023, 383, 135534. [Google Scholar] [CrossRef]
- Lin, X.; Lu, C.; Song, K. Influencing the Coordinated Development of Urbanization and Its Spatial Effects: A Case Study of Beijing-Tianjin-Hebei Region. Sustainability 2023, 15, 4137. [Google Scholar]
- Weng, G.; Tang, Y.; Pan, Y.; Mao, Y. The Spatiotemporal Evolution and Spatial Differences in the Coupling and Coordination of Tourism Ecology Urbanization in the Beijing Tianjin Hebei Region. Econ. Geogr. 2021, 41, 196–204. [Google Scholar]
- Wang, S.; Lin, X.; Xiao, H. Empirical Study on Human Capital, Economic Growth and Sustainable Development: Taking Shandong Pronvince as an Example. Sustainability 2022, 14, 7221. [Google Scholar] [CrossRef]
- Luo, L.; Wang, Y.; Liu, Y.; Zhang, X.; Fang, X. Where Is the Pathway to Sustainable Urban Development? Coupling Coordination Evaluation and Configuration Analysis between Low-Carbon Development and Eco-Environment: A Case Study of the Yellow River Basin, China. Ecol. Indic. 2022, 144, 109473. [Google Scholar] [CrossRef]
- Bao, C.; Zou, J. Exploring the Coupling and Decoupling Relationships between Urbanization Quality and Water Resources Contraint Intensity: Spatiotemporal Analysis for Northwest China. Sustainability 2017, 9, 1960. [Google Scholar] [CrossRef]
- Sun, A.; Zhang, C.; Tan, Q. Analysis of Coupling Coordination Variance between Urbanization Quality and Eco-Environment Pressure: A Case Study of the West Taiwan Strait Urban Agglomeration, China. Sustainability 2023, 12, 2643. [Google Scholar]
- Wu, X.; Liu, X. Coupling and Coordination Analysis of New Urbanization and Economic Resilience: A Case Study of Cities in the Middle Reaches of the Yangtze River. J. Reg. Financ. Res. 2022, 603, 77–84. [Google Scholar]
- Sun, T.; Wen, X. Regional Environmental Governance from the Perspective of Intergovernmental Relations: A Quantitative Analysis Based on the Atmospheric Governance Policy Text in the Beijing Tianjin Hebei Region. Urban. Dev. Stud. 2017, 12, 45–53. [Google Scholar]
- Feng, G. Changes in Air Pollution Prevention and Control Policies and Construction of an Interpretation Framework - Based on the Perspective of Policy Networks. Chin. Public. Adm. 2014, 9, 16–20+80. [Google Scholar]
- Zhou, D.; Zhang, X. A Study on the Evolution of Intergovernmental Cooperation in China’s Environmental Policy: A Quantitative Analysis of 205 Policy Texts Based on Joint Writing by Central Government Departments. J. Soc. Dev. 2020, 3, 209–246. [Google Scholar]
- Li, Z.; Yu, X. Research on the Changes of China’s Cross Border Environmental Protection Policies: A Quantitative Analysis Based on Relevant Policy Texts (1982–2020). J. Shanghai Adm. Inst. 2021, 22, 15–26. [Google Scholar]
- Li, H.; Liu, Y. Policy Text Analysis in the Evolution of China’s Ecological Civilization Policy. Leadersh. Sci. 2021, 809, 105–109. [Google Scholar]
- Ren, F.; Yu, X. Coupling Analysis of Urbanization and Ecological Total Factor Energy Efficiency—A Case Study from Hebei Province in China. Sustain. Cities Soc. 2021, 74, 103183. [Google Scholar] [CrossRef]
- Li, L.; Fan, Z.; Feng, W.; Yuxin, C.; Keyu, Q. Coupling Coordination Degree Spatial Analysis and Driving Factor between Socio-Economic and Eco-Environment in Northern China. Ecol. Indic. 2022, 135, 108555. [Google Scholar] [CrossRef]
Disclaimer/Publisher’s Note: The statements, opinions and data contained in all publications are solely those of the individual author(s) and contributor(s) and not of MDPI and/or the editor(s). MDPI and/or the editor(s) disclaim responsibility for any injury to people or property resulting from any ideas, methods, instructions or products referred to in the content. |
© 2023 by the authors. Licensee MDPI, Basel, Switzerland. This article is an open access article distributed under the terms and conditions of the Creative Commons Attribution (CC BY) license (https://creativecommons.org/licenses/by/4.0/).