
Coupling Coordination between Fintech and Digital Villages: Mechanism, Spatiotemporal Evolution and Driving Factors—An Empirical Study Based on China


Abstract
:1. Introduction
2. Literature Review and Mechanism of Coupling Action between Fintech and Digital Villages
2.1. Literature Review
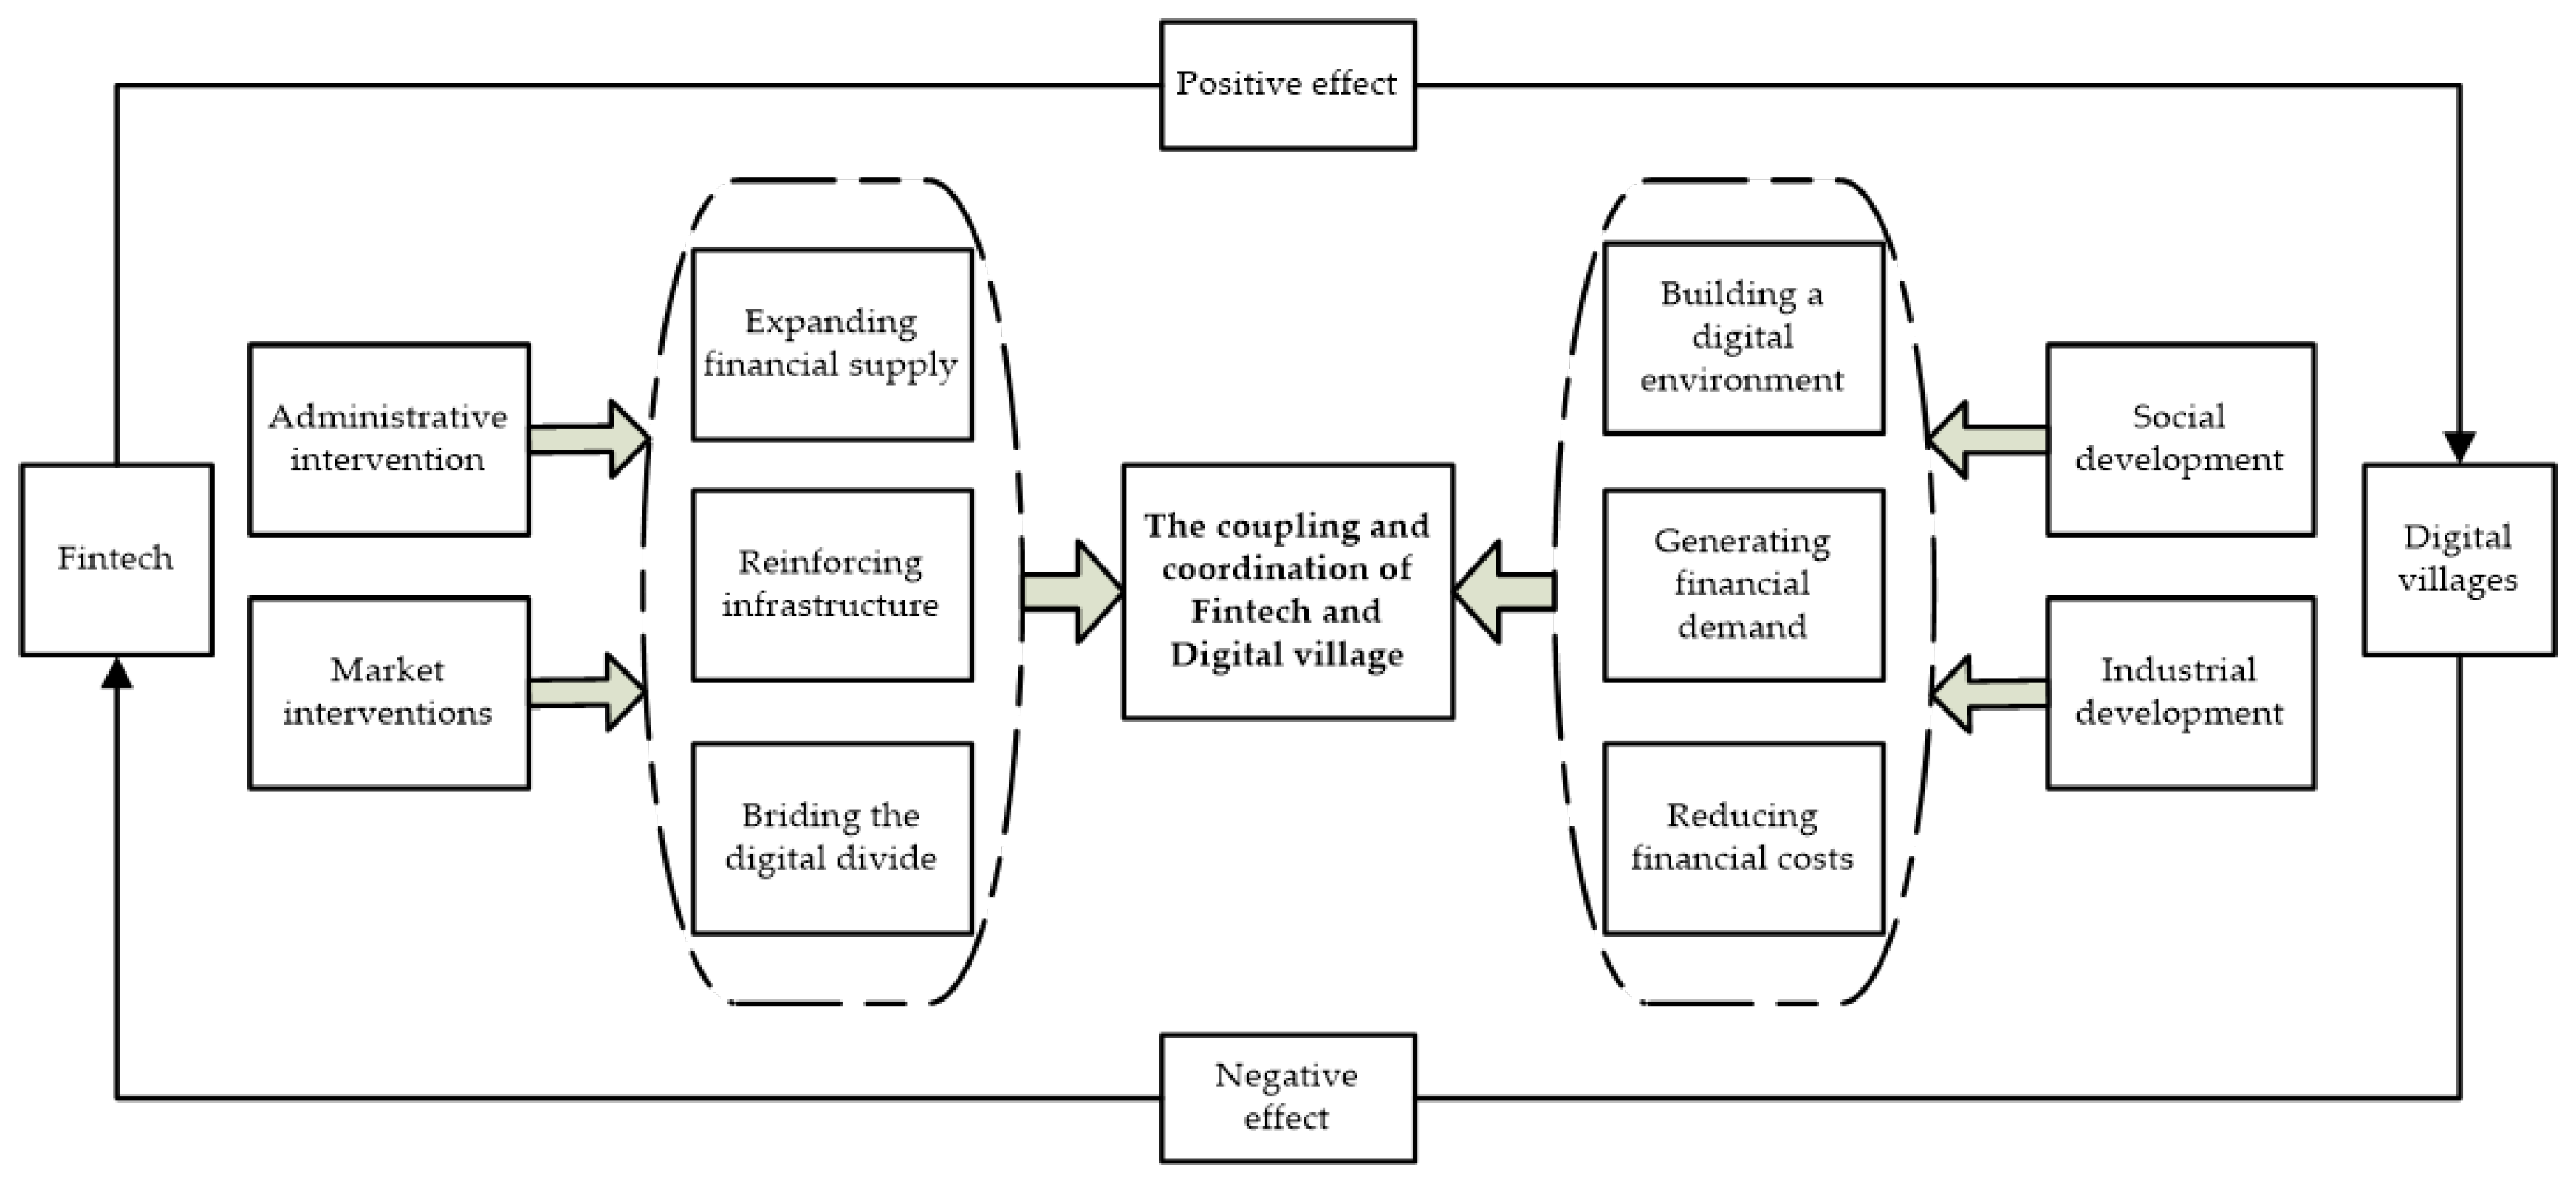
2.2. Analysis of the Mechanism of Coupling Action between Fintech and Digital Villages
2.2.1. Analysis of the Mechanism of the Role of Fintech in Digital Villages
2.2.2. Analysis of the Mechanism of the Role of Digital Villages in Fintech
2.2.3. Analysis of the Mechanisms for the Integration of Fintech and Digital Village Development
3. Indicator System, Research Methods and Data Sources
3.1. The Construction of the Indicator System
3.2. Data Sources
3.3. Research Methodology
3.3.1. Standardization of Index Data
3.3.2. Entropy Evaluation Method
3.3.3. Coupling Coordination Model
3.3.4. Panel Data Regression Model
4. Empirical Study
4.1. Analysis of the Comprehensive Index of Fintech and Digital Villages
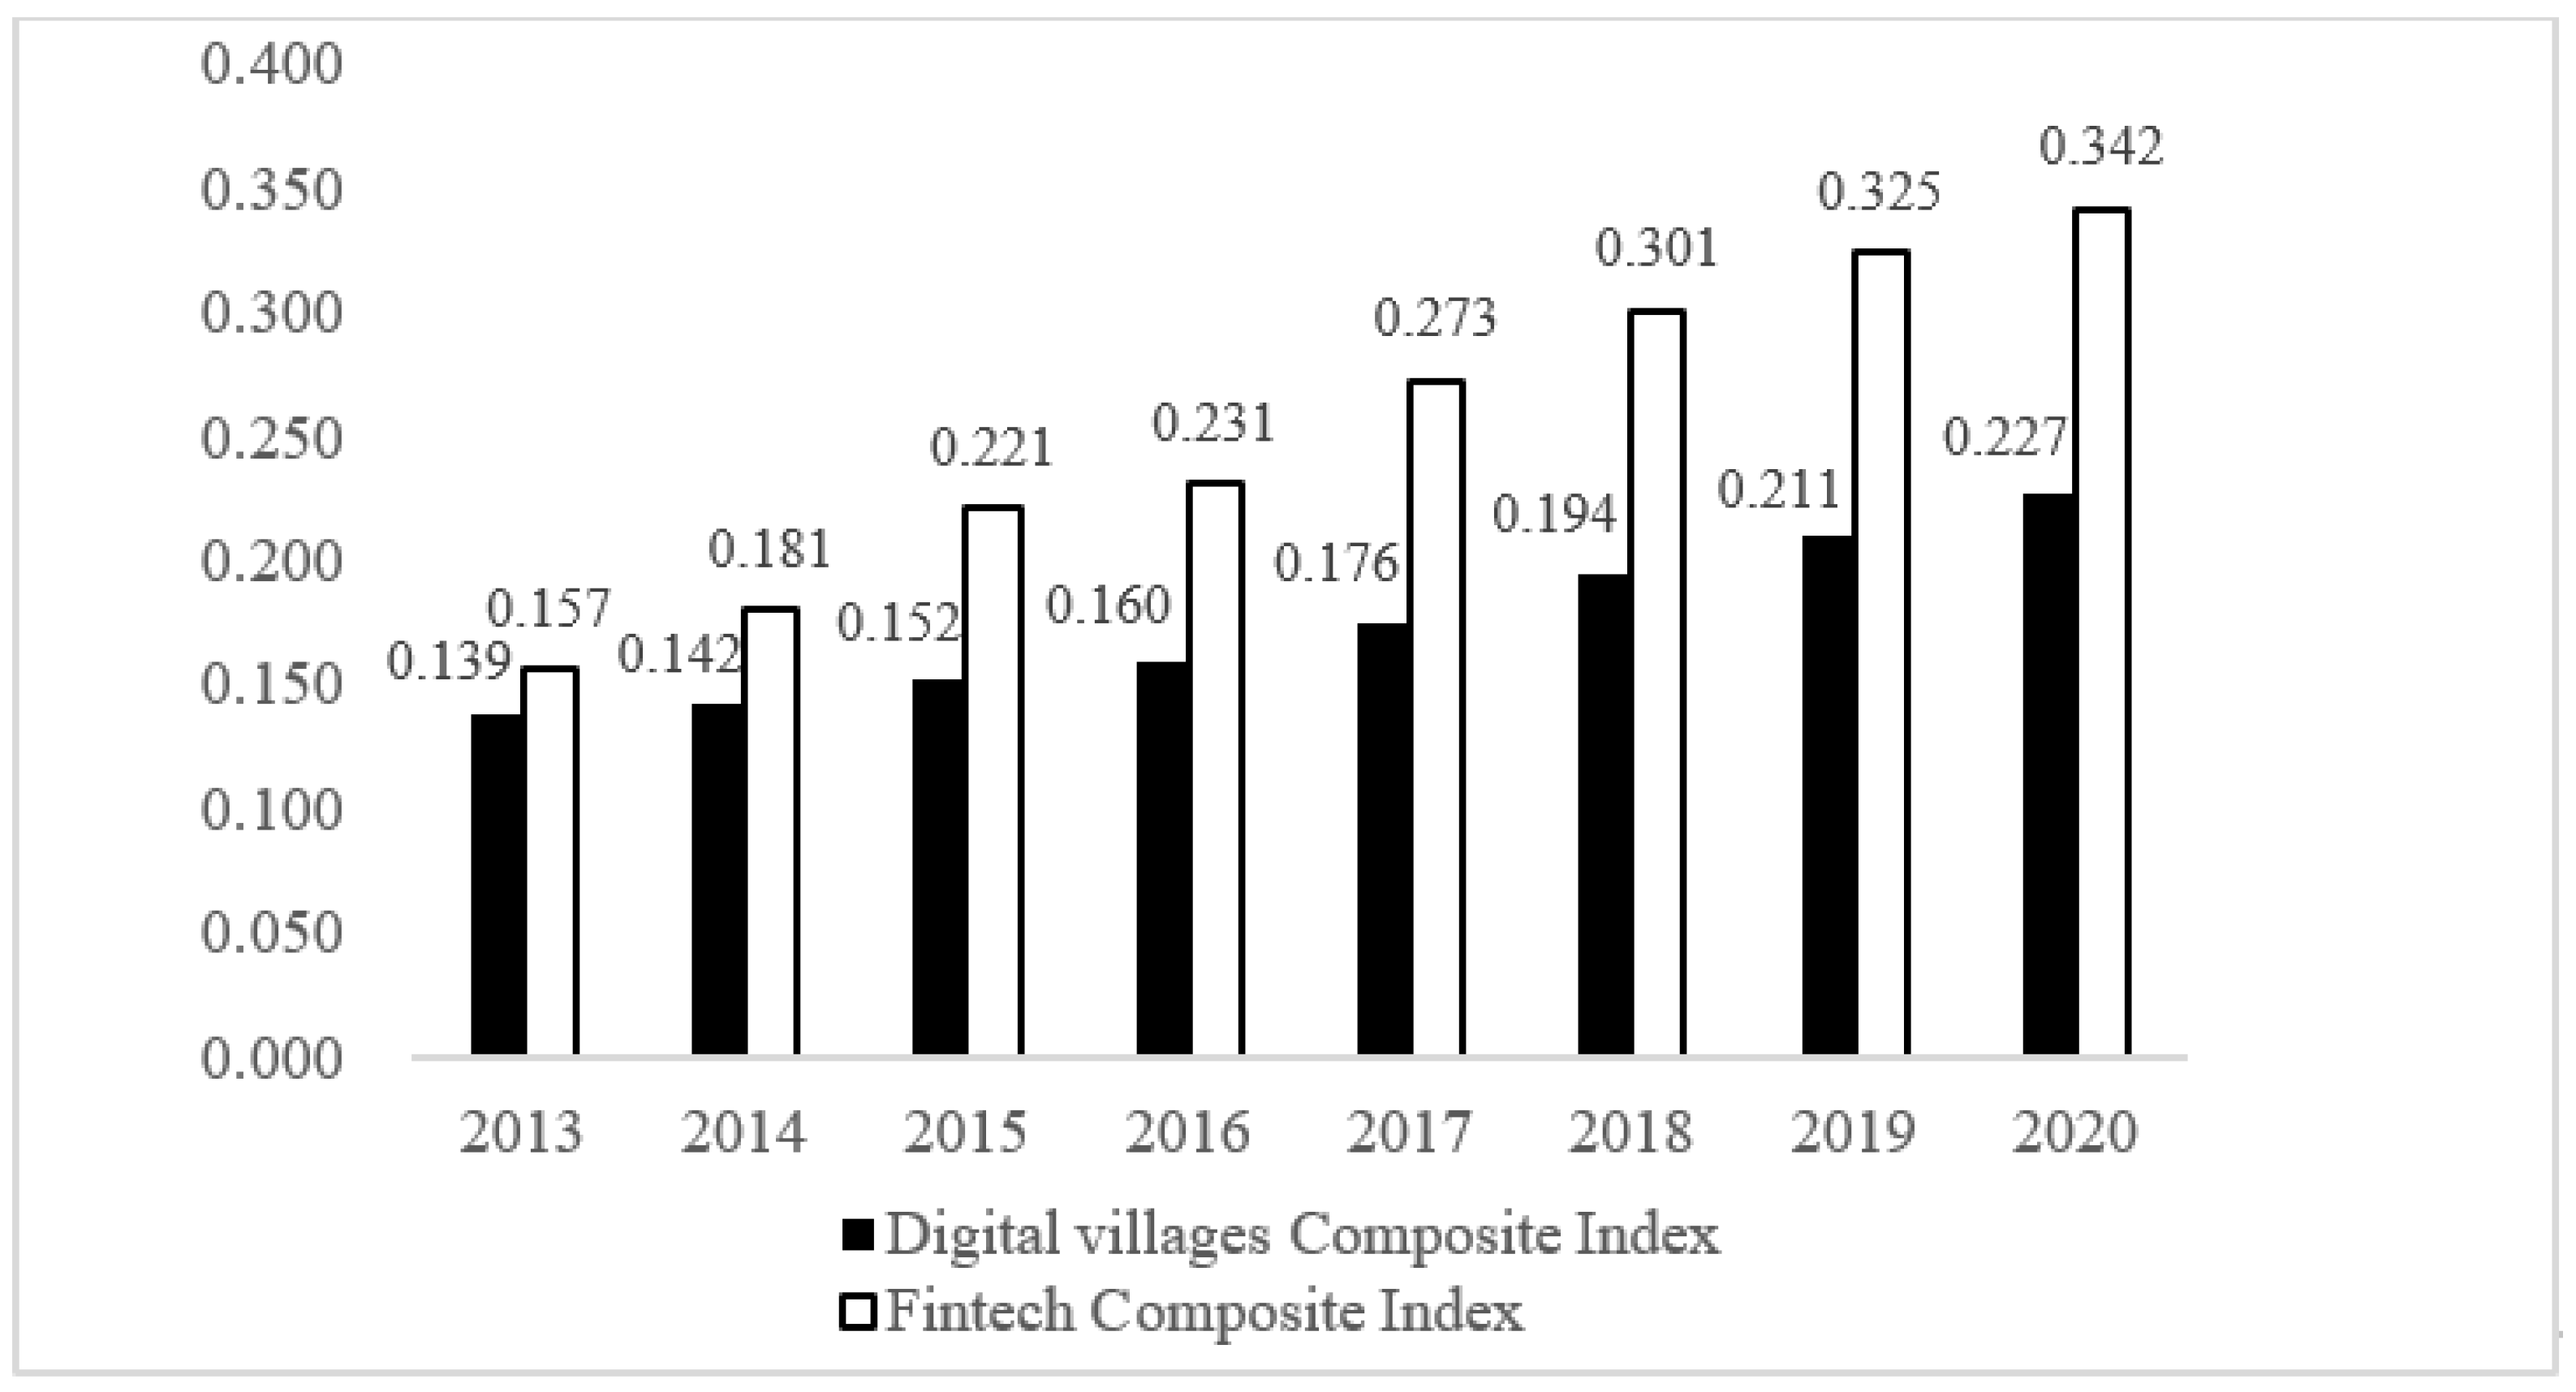
4.1.1. Time-Order Characteristics of the Comprehensive Index
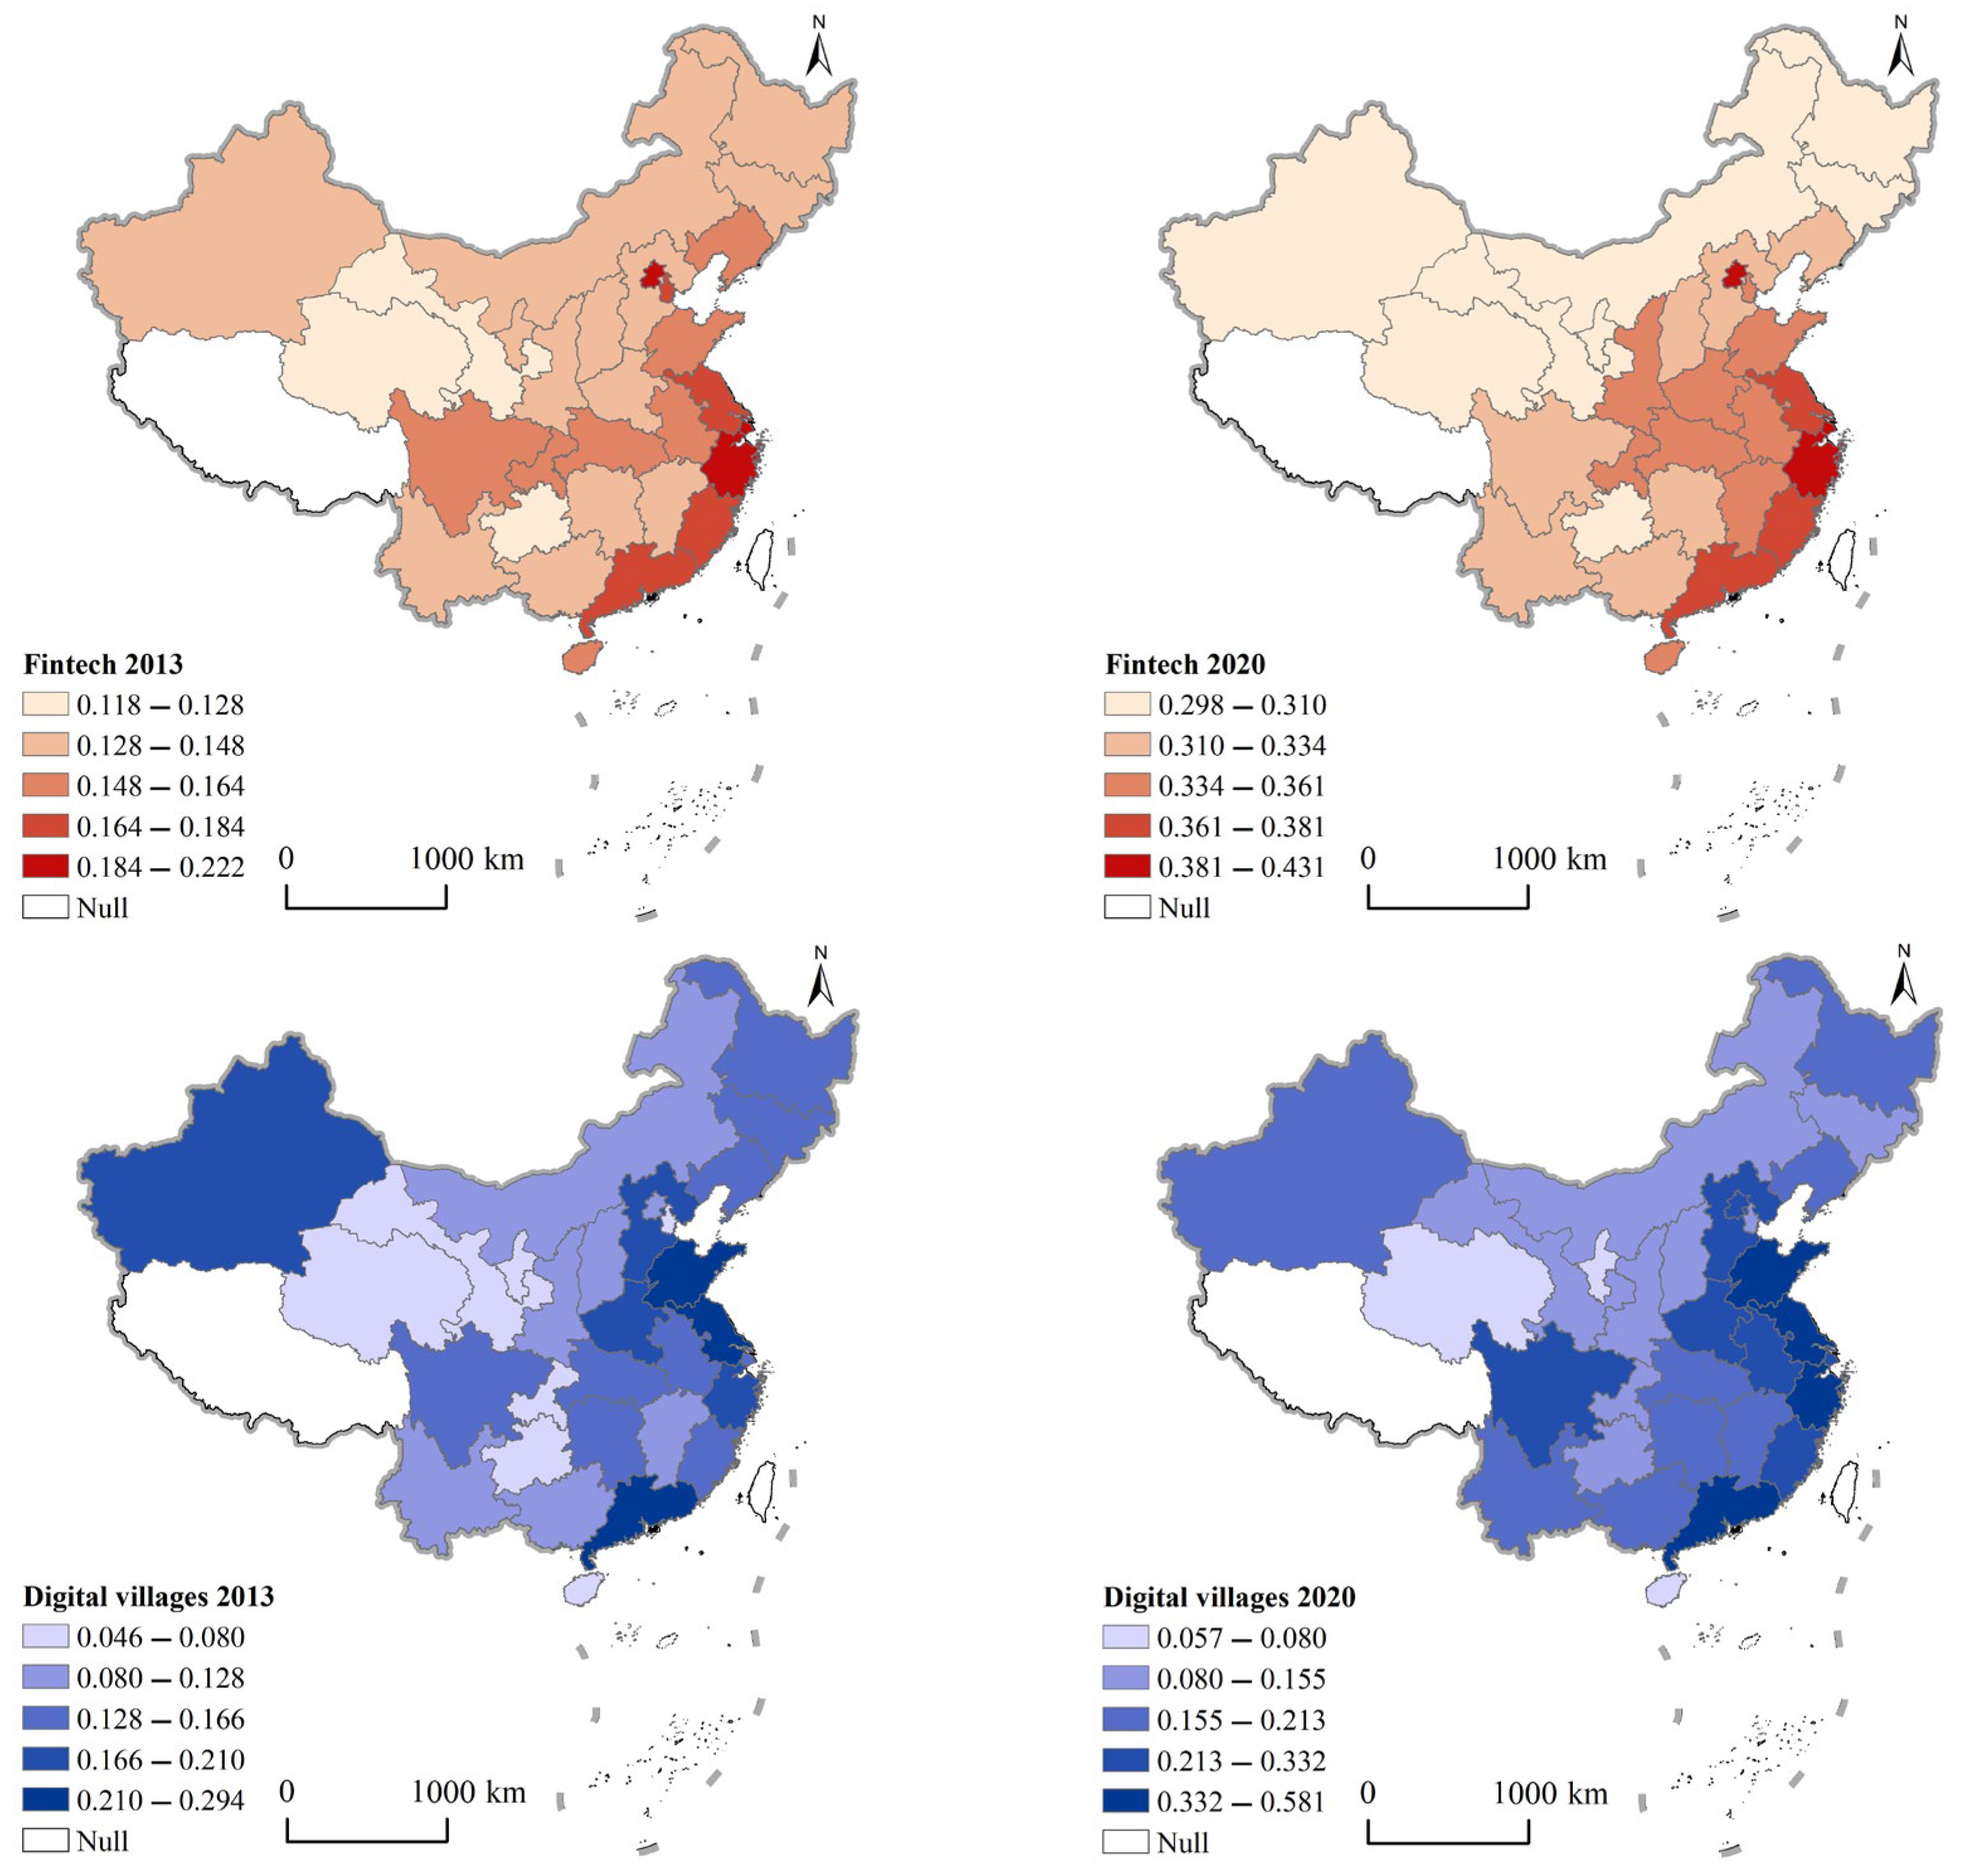
4.1.2. Spatial Characteristics of the Comprehensive Index
4.2. Time-Order Characteristics Analysis of Coupling Coordination between Fintech and Digital Villages
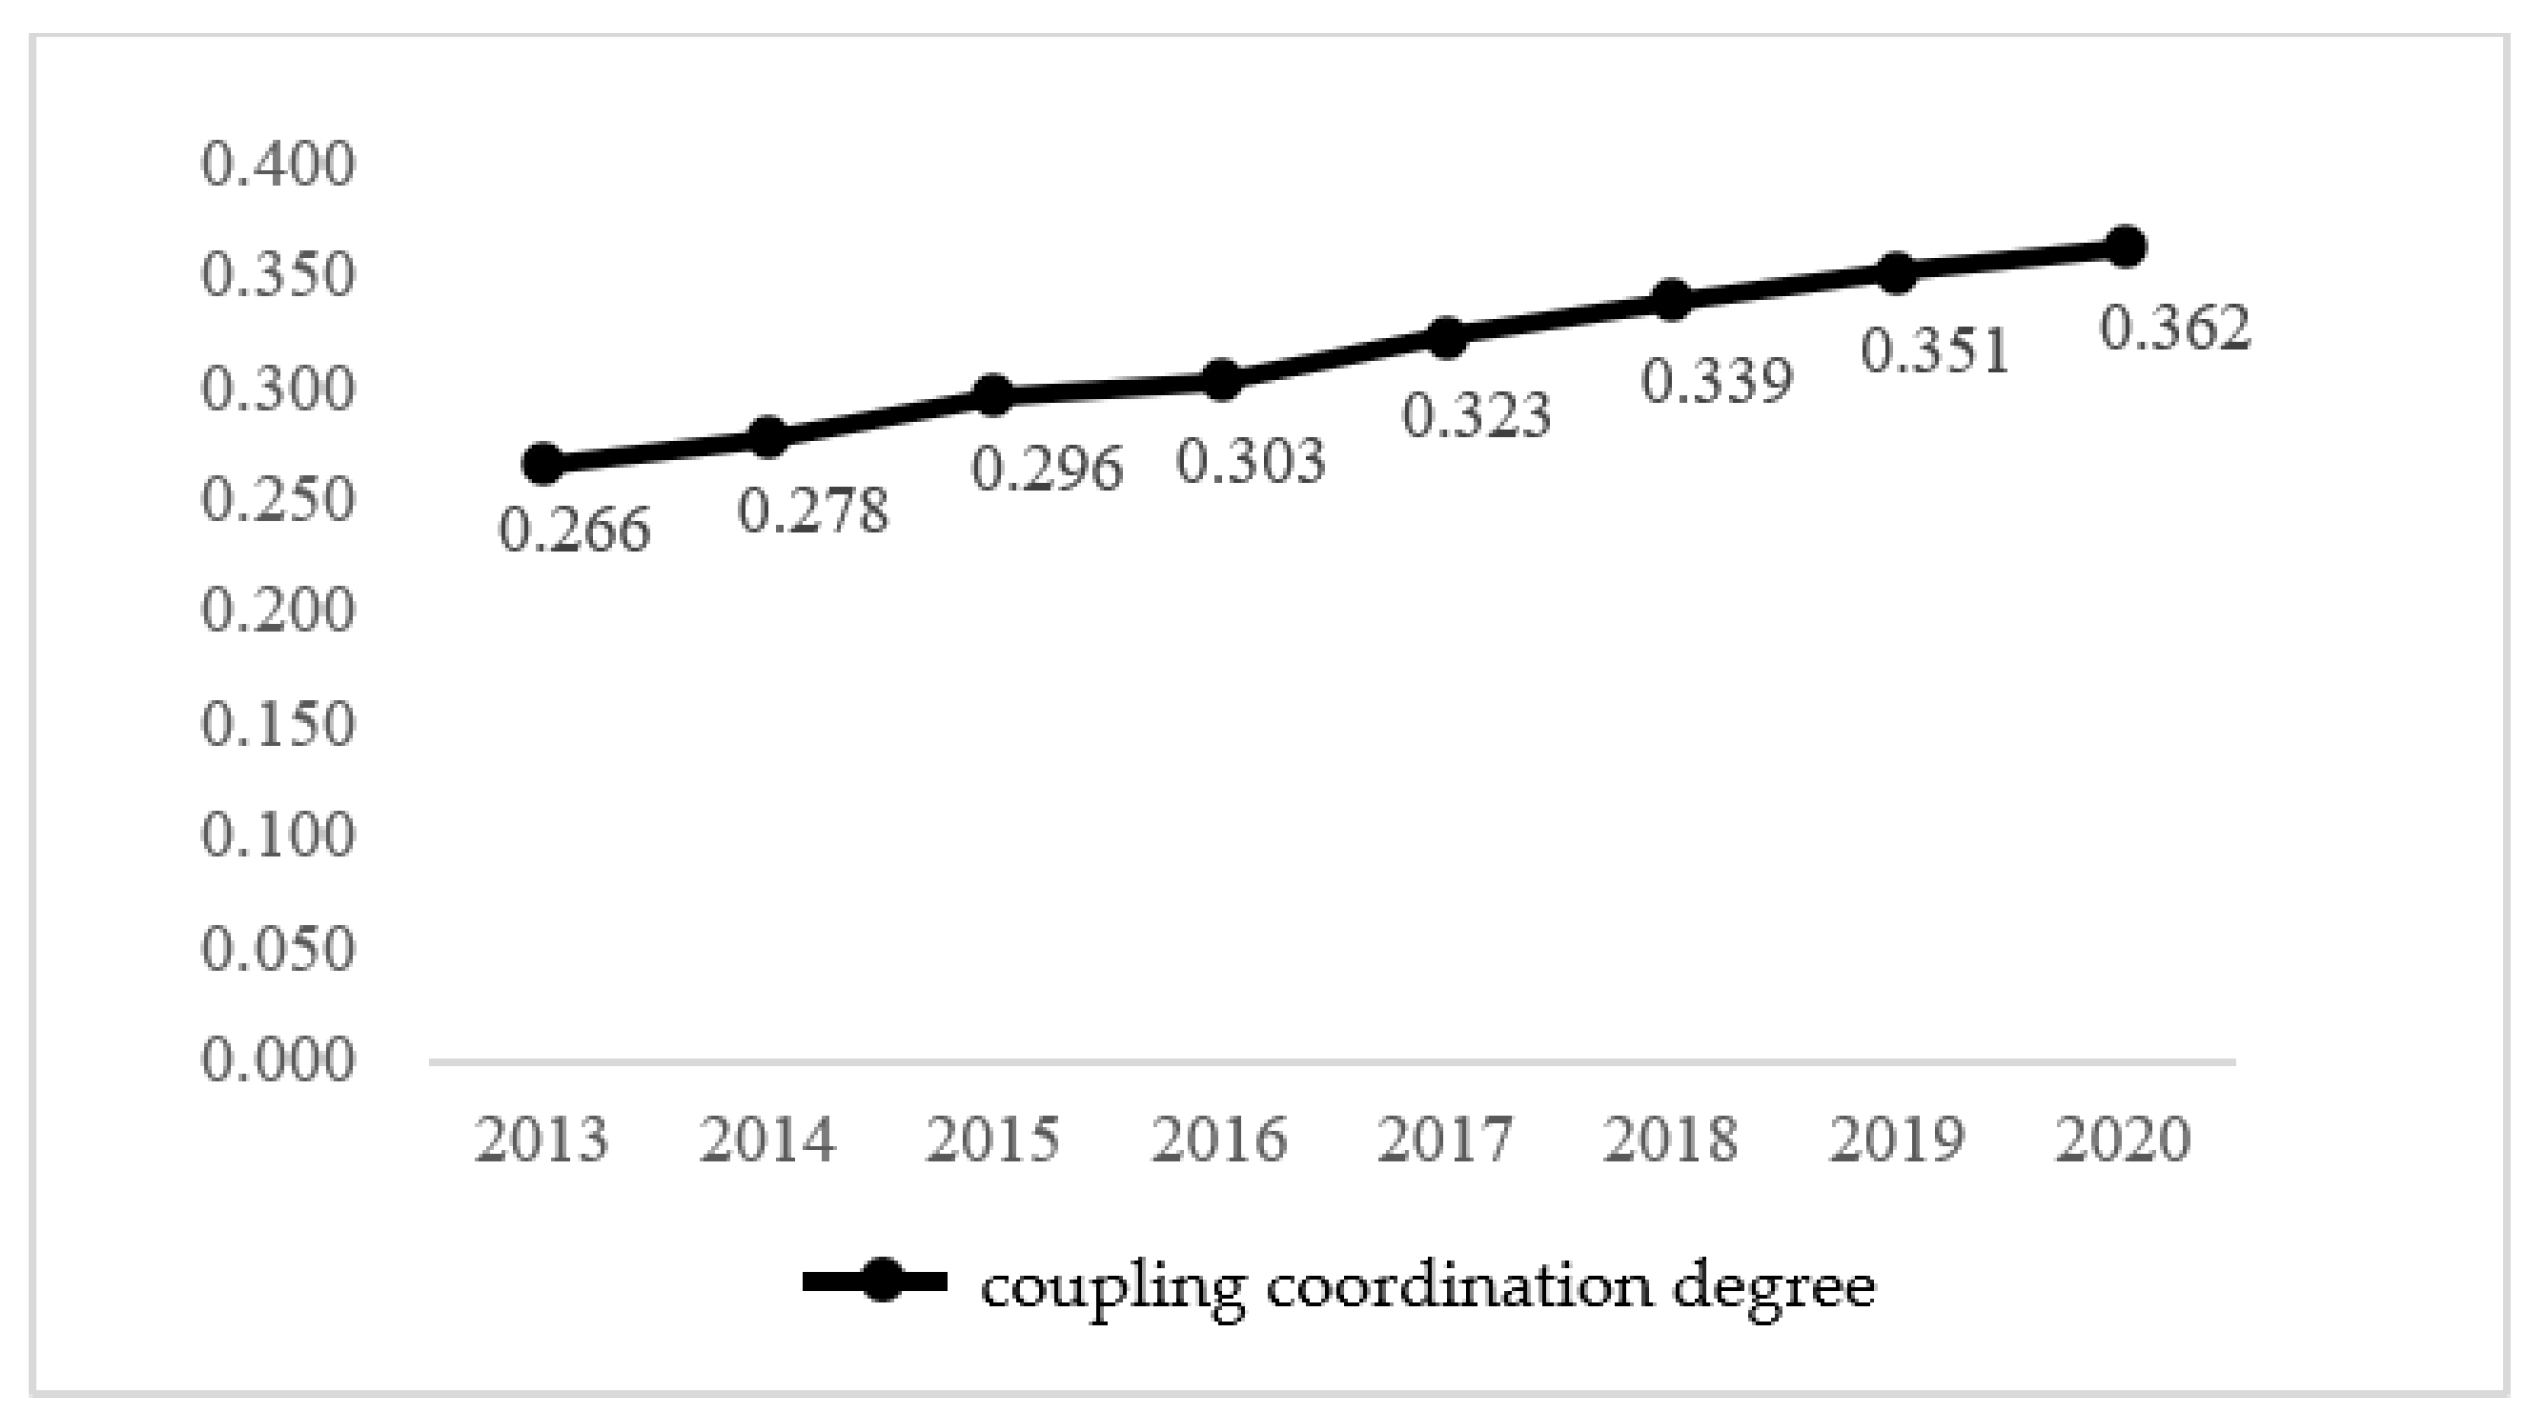
4.2.1. Time-Order Characteristics of the Coupling Coordination Degree
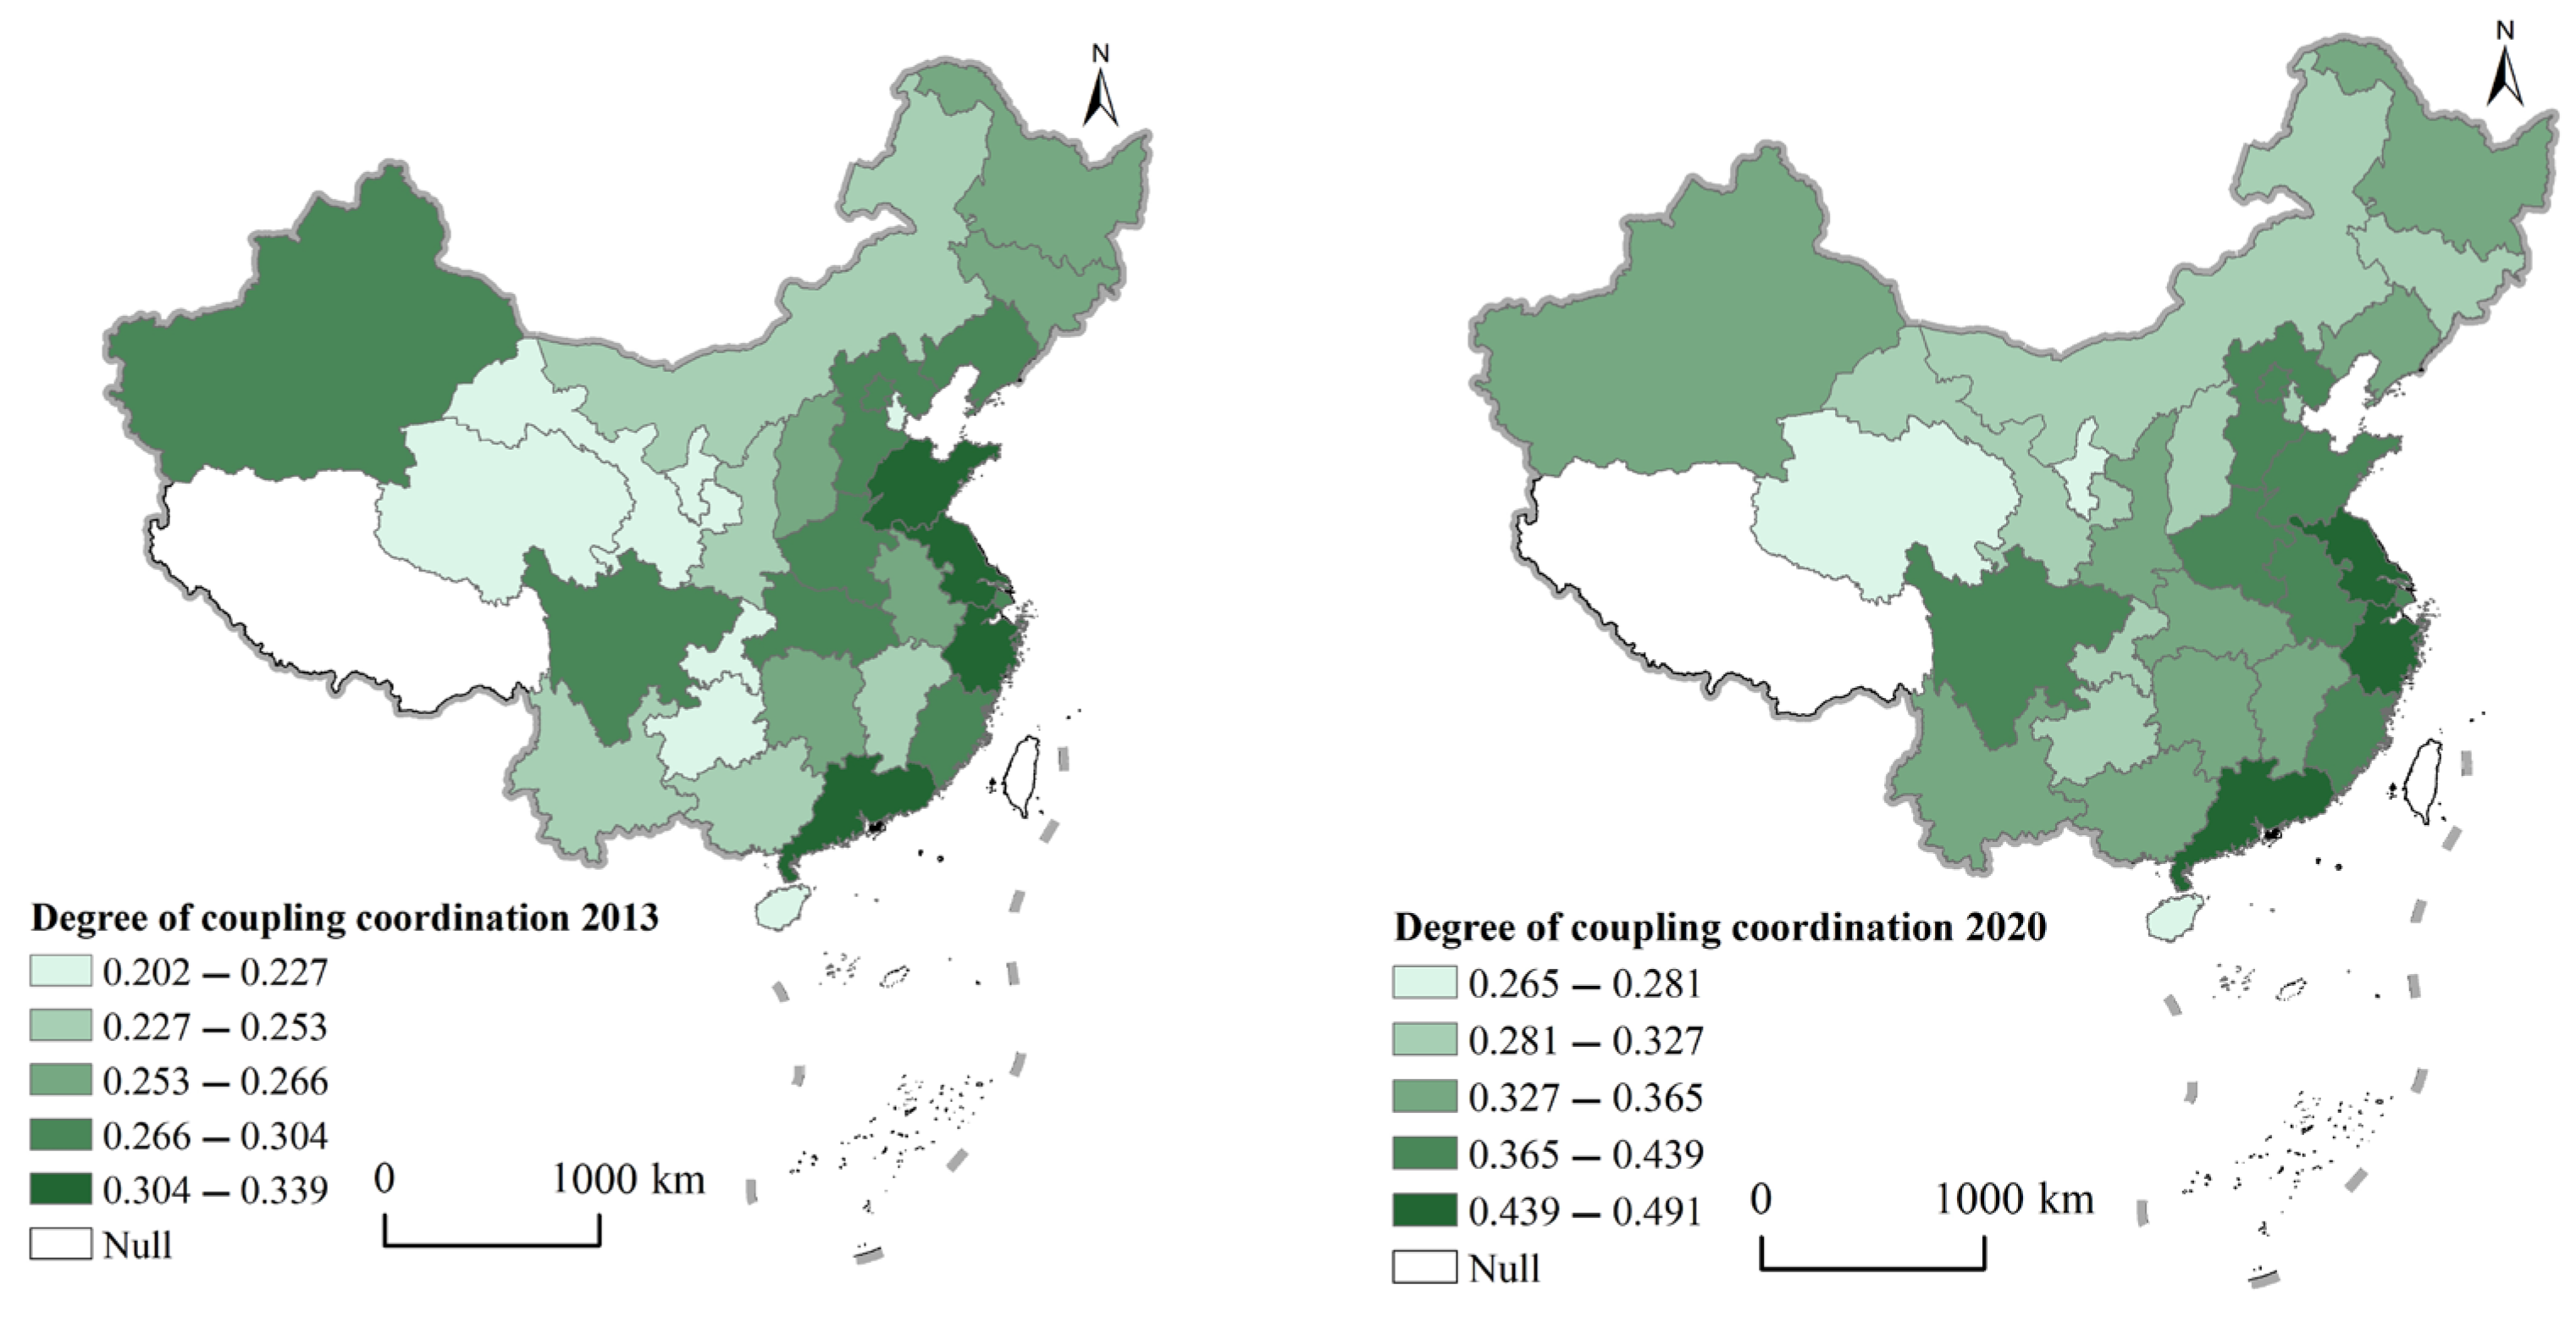
4.2.2. Spatial Characteristics of Coupling Coordination Degree
4.3. Study of Driving Factors
4.3.1. Descriptive Statistical Analysis
4.3.2. Correlation Study
4.3.3. Regression Analysis
4.3.4. Endogeneity Test
4.3.5. Heterogeneity Test
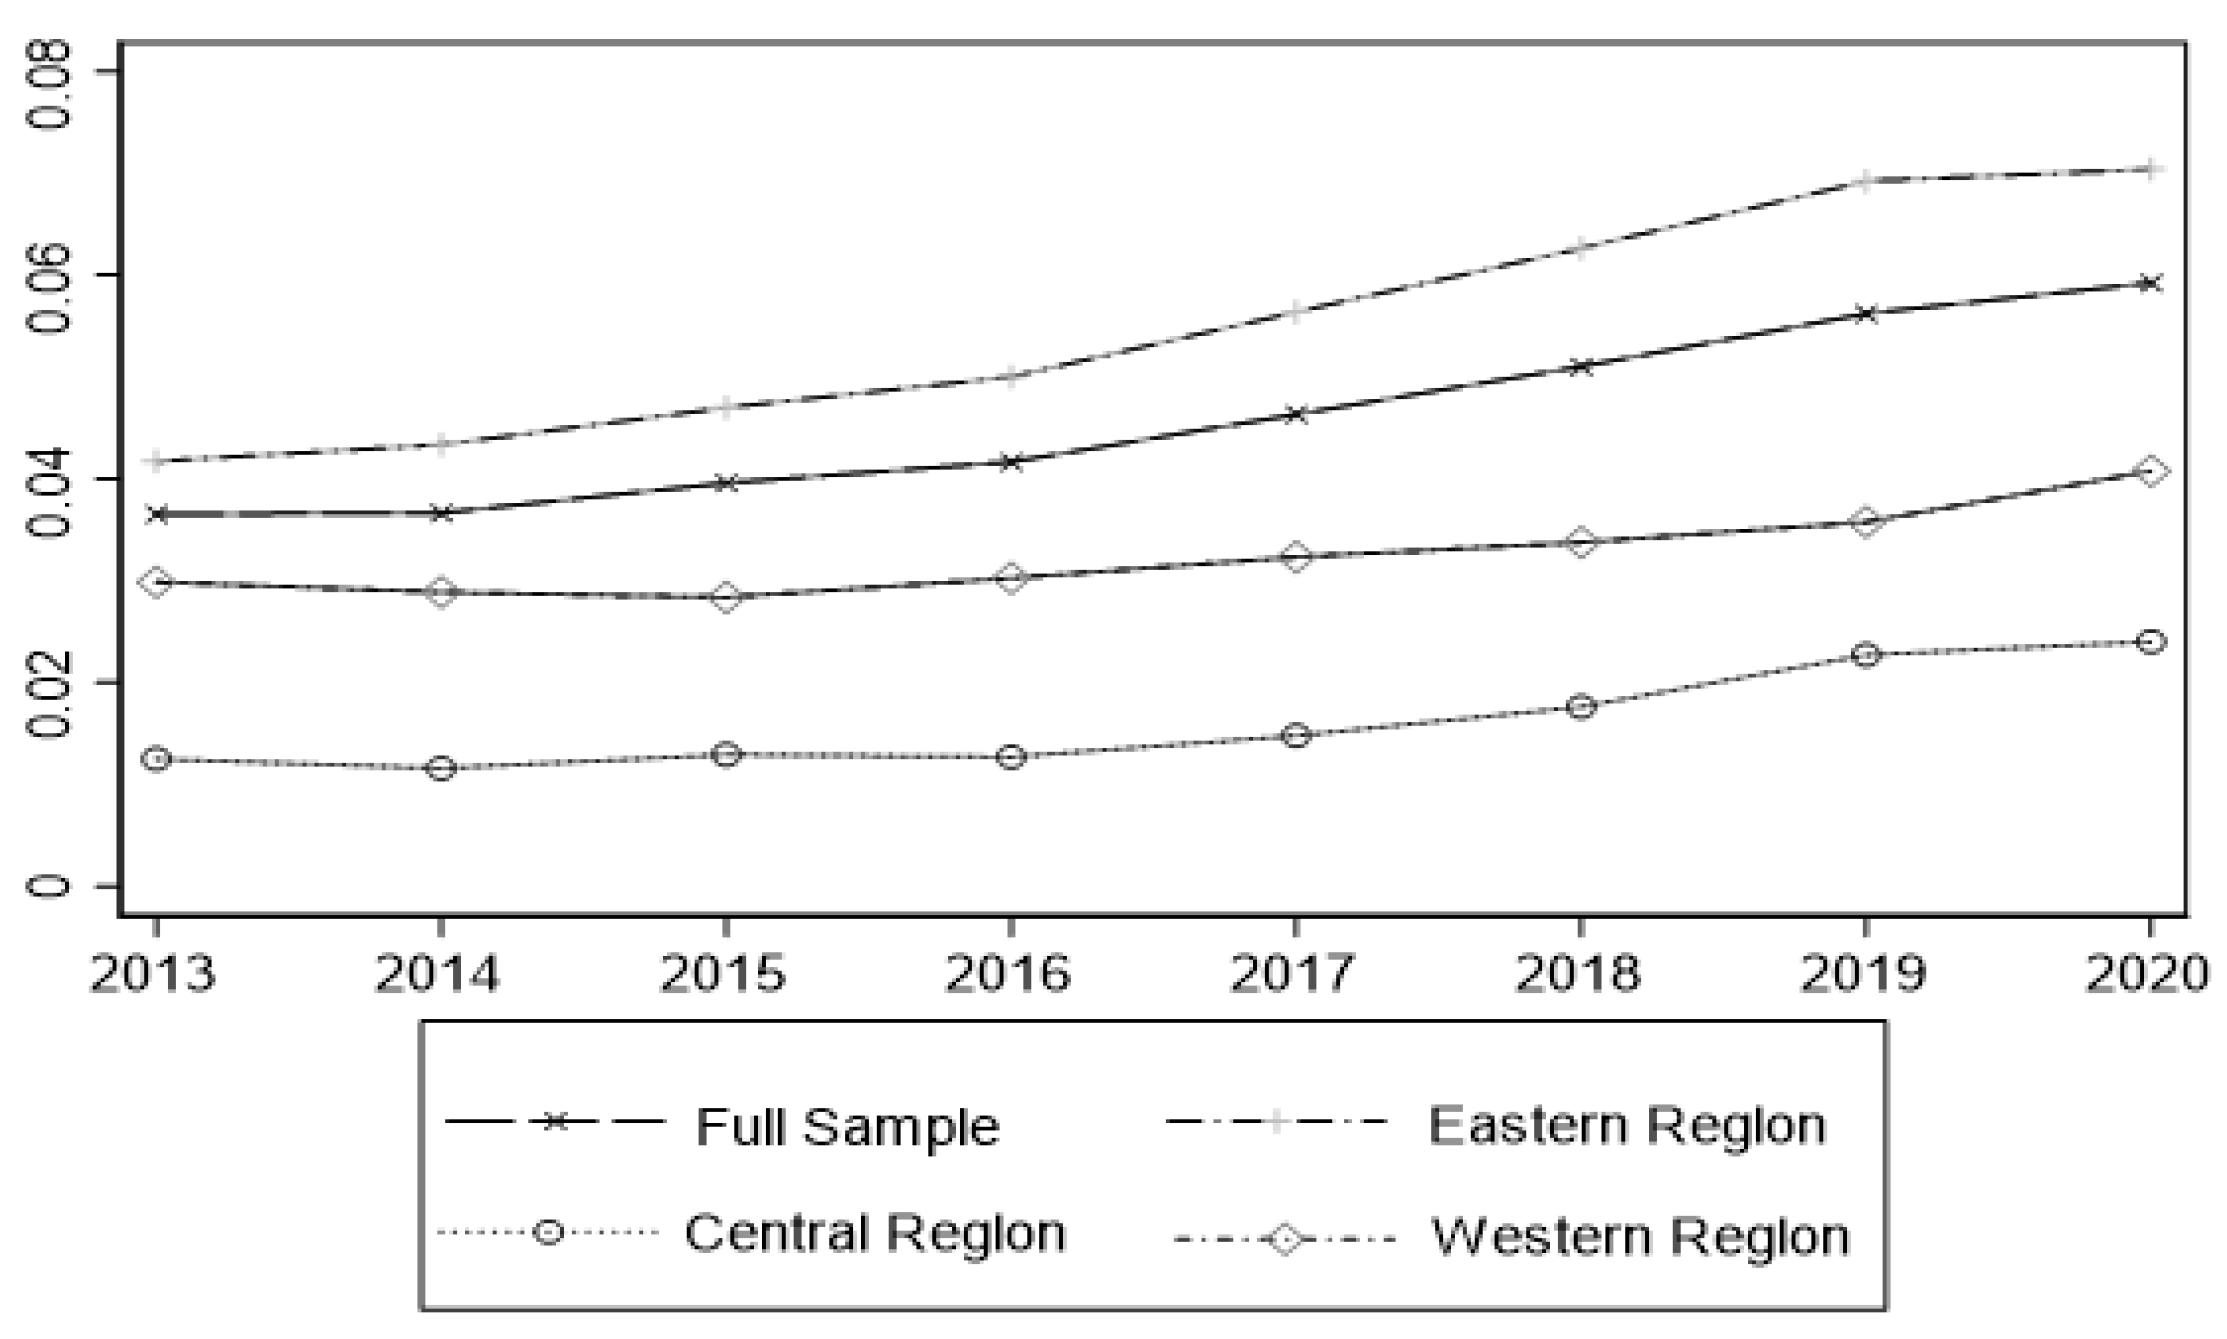
4.4. Convergence Analysis
4.4.1. Convergence Test
4.4.2. β Convergence Test
5. Conclusions and Recommendations
5.1. Conclusions
5.2. Policy Recommendations
6. Research Limitations and Discussion
Author Contributions
Funding
Institutional Review Board Statement
Informed Consent Statement
Data Availability Statement
Conflicts of Interest
References
- Akram, U.; Fülöp, M.T.; Tiron-Tudor, A.; Topor, D.I.; Căpușneanu, S. Impact of digitalization on customers’ well-being in the pandemic period: Challenges and opportunities for the retail industry. Int. J. Environ. Res. Public Health 2021, 18, 7533. [Google Scholar] [CrossRef] [PubMed]
- Fülöp, M.T.; Topor, D.I.; Ionescu, C.A.; Căpușneanu, S.; Breaz, T.O.; Stanescu, S.G. Fintech accounting and Industry 4.0: Future-proofing or threats to the accounting profession? J. Bus. Econ. Manag. 2022, 23, 997–1015. [Google Scholar] [CrossRef]
- General Office of the State Council, Outline of the Digital Countryside Development Strategy. Available online: http://www.gov.cn/zhengce/2019-05/16/content_5392269.htm (accessed on 20 January 2023).
- Zhang, L.; Wen, T. Study on the integration of digital inclusive finance and digital village development. Rural Financ. Res. 2022, 3–12. Available online: http://www.card.zju.edu.cn/2022/0912/c24475a2630359/page.htm (accessed on 20 January 2023).
- Tan, Y.; Li, Y.; Ye, C. Evaluation of digital inclusive finance and rural revitalization in provincial areas and its coupling and synergy analysis. Econ. Geogr. 2021, 41, 187–195+222. [Google Scholar] [CrossRef]
- Li, J.; Ma, J. Empirical evidence on the relationship between digital inclusive finance development and rural revitalization. Stat. Decis. Mak. 2021, 37, 138–141. [Google Scholar]
- Lontchi, C.B.; Yang, B.; Shuaib, K.M. Effect of Financial Technology on SMEs Performance in Cameroon amid COVID-19 Recovery: The Mediating Effect of Financial Literacy. Sustainability 2023, 15, 2171. [Google Scholar] [CrossRef]
- Bayram, O.; Talay, I.; Feridun, M. Can Fintech Promote Sustainable Finance? Policy Lessons from the Case of Turkey. Sustainability 2022, 14, 12414. [Google Scholar] [CrossRef]
- Gálvez-Sánchez, F.J.; Lara-Rubio, J.; Verdú-Jóver, A.J.; Meseguer-Sánchez, V. Research Advances on Financial Inclusion: A Bibliometric Analysis. Sustainability 2021, 13, 3156. [Google Scholar] [CrossRef]
- Ma, Y.; Liu, D. Introduction to the Special Issue on Crowdfunding and FinTech. Financ. Innov. 2017, 3, 8. [Google Scholar] [CrossRef]
- Pi, T.i.; Liu, Y.; Wu, H. Fintech: Connotation, logic and risk regulation. Financ. Econ. Sci. 2018, 9, 16–25. [Google Scholar]
- Shi, Z.; Han, J. Analysis of the mechanism of digital financial inclusion and application of financial technology. Sci. Manag. Res. 2022, 40, 150–157. [Google Scholar]
- Guo, F.; Wang, J.Y.; Wang, F.; Kong, T.; Zhang, X.; Cheng, Z.Y. Measuring the development of digital inclusive finance in China: Indexing and spatial characteristics. Econometrica 2020, 19, 1401–1418. [Google Scholar] [CrossRef]
- Li, K.; Mengmeng, H.; Huo, J. Digital Inclusive Finance and Asset Allocation of Chinese Residents: Evidence from the China Household Finance Survey. PLoS ONE 2022, 17, e0267055. [Google Scholar] [CrossRef]
- Xiong, M.; Fan, J.; Li, W.; Sheng Xian, B.T. Can China’s Digital Inclusive Finance Help Rural Revitalization? A Perspective Based on Rural Economic Development and Income Disparity. Front. Environ. Sci. 2022, 10, 2095. [Google Scholar] [CrossRef]
- Sun, J.; Sun, Y. Does financial technology contribute to rural industrial revitalization under the goal of common prosperity? Financ. Econ. Ser. 2022, 291, 51–60. [Google Scholar] [CrossRef]
- Ji, M.; Zeng, X.H. The role of digital inclusive finance in promoting consumption under the goal of common prosperity. Price Theory Pract. 2022, 455, 66–69+193. [Google Scholar] [CrossRef]
- Yan, J.; Zhu, S.; Du, J. How financial technology promotes common prosperity: Theoretical mechanisms and empirical evidence. Explor. Econ. Issues 2022, 483, 16–32. [Google Scholar]
- Zhang, R.; Wu, K.; Cao, Y.; Sun, H. Digital Inclusive Finance and Consumption-Based Embodied Carbon Emissions: A Dual Perspective of Consumption and Industry Upgrading. J. Environ. Manag. 2023, 325, 116632. [Google Scholar] [CrossRef]
- Ge, H.; Li, B.; Tang, D.; Xu, H.; Boamah, V. Research on Digital Inclusive Finance Promoting the Integration of Rural Three-Industry. Int. J. Environ. Res. Public Health 2022, 19, 3363. [Google Scholar] [CrossRef]
- Li, Y.; Zheng, H.; Jiang, H. A study on the impact of financial technology on industrial structure upgrading: An example with empirical data from 2011–2019 in the Chengdu-Chongqing region. J. Yunnan Univ. Financ. Econ. 2022, 38, 18–28. [Google Scholar]
- Li, H.; Zhang, J. The impact of financial technology on the optimization of industrial structure and industrial upgrading in China. Stat. Res. 2022, 39, 102–118. [Google Scholar]
- Malik, P.K.; Singh, R.; Gehlot, A.; Akram, S.V.; Das, P.K. Village 4.0: Digitalization of Village with Smart Internet of Things Technologies. Comput. Ind. Eng. 2022, 165, 107938. [Google Scholar] [CrossRef]
- Zhao, Y.; Li, R. Coupling and Coordination Analysis of Digital Rural Construction from the Perspective of Rural Revitaliza-tion: A Case Study from Zhejiang Province of China. Sustainability 2022, 14, 3638. [Google Scholar] [CrossRef]
- Chen, W.; Wang, Q.; Zhou, H. Digital Rural Construction and Farmers’ Income Growth: Theoretical Mechanism and Micro Experience Based on Data from China. Sustainability 2022, 14, 11679. [Google Scholar] [CrossRef]
- Zeng, Y.; Song, Y.; Lin, X.; Fu, C. Some issues of digital village construction in China. China Rural Econ. 2021, 436, 21–35. [Google Scholar]
- Xie, W.; Song, D.; Bi, Y. Construction of digital countryside in China: Internal mechanism, articulation mechanism and practical path. J. Soochow Univ. (Philos. Soc. Sci. Ed.) 2022, 43, 93–103. [Google Scholar] [CrossRef]
- Tang, Y.; Chen, M. The Impact Mechanism and Spillover Effect of Digital Rural Construction on the Efficiency of Green Transformation for Cultivated Land Use in China. Int. J. Environ. Res. Public Health 2022, 19, 16159. [Google Scholar] [CrossRef]
- Li, G. Study on the impact of rural digital infrastructure construction on rural residents’ consumption: An analysis of the transmission path based on rural industrial structure. Price Theory Pract. 2022, 461, 112–115. [Google Scholar] [CrossRef]
- Sun, X.; Wu, H.R.; Guo, W.; Li, Q.X.; Peng, C. Design and application of digital rural big data platform. Jiangsu Agric. Sci. 2021, 49, 181–188. [Google Scholar]
- Wang, X. Evaluation of the quality of rural e-commerce cluster development in China in the context of digital countryside. Bus. Econ. Res. 2022, 849, 133–137. [Google Scholar]
- Li, B.; Zhou, Q.; Yue, H. An empirical test of the impact of digital village construction on industrial prosperity. Stat. Decis. 2022, 38, 5–10. [Google Scholar]
- Ren, X. Theoretical Logic, Realistic Challenges, and Path Selection of High Quality Financial Technology Services for Rural Revitalization. Contemp. Econ. Manag. 2023, 1–10. Available online: http://kns.cnki.net/kcms/detail/13.1356.F.20230418.1424.004.html (accessed on 20 January 2023).
- Wang, J.; Shi, Y. Study on the Impact of Financial Technology on Profitability and Risk of Retail Business of Chinese Commercial Banks. Ph.D. Thesis, University of International Business and Economics, Beijing, China, 2021. [Google Scholar] [CrossRef]
- Liu, S.; Zhou, J. Causes and solutions of the problem of “rural immobility” in digital village construction. Learn. Explor. 2022, 318, 35–45. [Google Scholar]
- Yi, J.; Yang, Z. Progress and optimization of the digital divide between urban and rural areas in China. Jianghan Forum 2022, 530, 65–70. [Google Scholar]
- Liu, Y.; Zhong, Y. Analysis of the spatial and temporal changes of urbanization level and its economic influencing factors in Jiangxi Province. Spec. Econ. Zone 2007, 227, 186–187. [Google Scholar]
- Lu, F. Analysis of the spatial variation of leisure agriculture and its socio-economic influencing factors in Nanjing. China Agric. Resour. Zoning 2017, 38, 231–236. [Google Scholar]
- Wang, Y.; Wu, J.; Miao, H.; Gao, Y. Spatial patterns and influencing factors of coupled coordination between ecological vulnerability and economic integration in Gansu Province. J. Environ. Eng. Technol. 2023, 13, 808–816. [Google Scholar]
- She, M.; Wang, Y. Analysis of the coupled and coordinated development of science and technology innovation and rural revitalization system and its influencing factors. Stat. Decis. Mak. 2021, 37, 84–88. [Google Scholar]
- Zhang, Y.; Hu, S. Research on the impact of digital inclusive finance on the coordinated development of economy and environment—Mesomeric effect driven by innovation. Soft Sci. 2023, pp. 1–11. Available online: http://kns.cnki.net/kcms/detail/51.1268.G3.20221108.1658.006.html (accessed on 20 January 2023).
- Zhou, H.; Li, Y.; Li, R. A Study on the Spatial Effect of Financial Industry Agglomeration on Regional Economic Growth. Mod. Financ. Econ. (J. Tianjin Univ. Financ. Econ.) 2016, 36, 63–76. [Google Scholar]
- Li, F.; Fang, L. Regional Differences in Rural Financial Exclusion in China: Insufficient Supply or Insufficient Demand—Comparative Analysis of Banking, Insurance, and Internet Finance. Manag. World 2016, 276, 70–83. [Google Scholar] [CrossRef]
- Huang, R.; Lai, X.; Tang, S. How does financial technology affect corporate financing constraints?—A test of dynamic effects, heterogeneity characteristics and macro and micro mechanisms. Dyn. Eff. Heterog. Charact. Macro-Micro Mech. Insp. 2020, 6, 25–33. [Google Scholar]
- Li, N. A study on the coupling of rural digital inclusive finance and new urbanization. Res. Technol. Econ. Manag. 2022, 314, 67–72. [Google Scholar]
- Xia, L.; Wang, X. The coupling and coordination of industrial and consumption “double upgrading”: Mechanism, spatial and temporal evolution and driving forces. Bus. Econ. Res. 2021, 826, 172–176. [Google Scholar]
- Barro, R.J.; Sala-i-Martin, X. Convergence. J. Political Econ. 1992, 100, 223–251. [Google Scholar] [CrossRef]

| Systems | Tier 1 Indicators | Secondary Indicators | Interpretation of Secondary Indicators (Units, Attributes) | Weighting | Data Sources |
|---|---|---|---|---|---|
| Fintech | Breadth of coverage | - | - | - | Peking University Digital Inclusive Finance Index (2011–2020) |
| Depth of use | |||||
| Degree of digitization | |||||
| Digital villages | Financial input | Investment in agricultural production | Amount of investment in agriculture in the category of rural fixed assets as a proportion of the total output value of agriculture, forestry, animal husbandry and fisheries (%, positive) | 0.033 | China Rural Statistical Yearbook |
| Investment in IT applications in agriculture | Investment in fixed assets in rural transport, storage and postal services (RMB billion, positive) | 0.076 | China Rural Statistical Yearbook | ||
| Infrastructure | Rural basic communication facilities | Length of fiber optic cable lines (km, positive) | 0.043 | China Statistical Yearbook | |
| Rural internet communication facilities | Number of rural broadband access subscribers (million, positive) | 0.069 | China Statistical Yearbook | ||
| Rural mobile communication facilities | Mobile phone penetration rate per 100 population (units) | 0.023 | China Statistical Yearbook | ||
| Rural radio and television communication facilities | Number of rural cable broadcast TV subscribers as a proportion of total households (%, positive) | 0.039 | China Statistical Yearbook | ||
| Agricultural production | Application of science and technology in agricultural production | Number of national modern agricultural demonstration zones and industrial parks, number of national demonstration parks for integrated development of rural industries and agricultural science and technology parks and number of national key leading enterprises in agricultural industrialization (pcs, positive) | 0.034 | Ministry of Agriculture and Rural Affairs. National Development and Reform Commission | |
| Scale of agricultural production | Number of farms as a proportion of primary sector output (%, positive) | 0.071 | China Rural Statistical Yearbook | ||
| Electricity consumption for rural production | Rural electricity consumption (billion kWh, positive) | 0.108 | China Statistical Yearbook | ||
| Agricultural machinery applications | Total power of agricultural machinery (million kW, positive) | 0.052 | China Statistical Yearbook | ||
| Agrometeorological applications | Number of operational agrometeorological observation sites (nos., positive) | 0.021 | China Statistical Yearbook | ||
| Digital agriculture talent | Number of agricultural technicians (persons, positive) | 0.035 | National Statistical Office; Provincial Statistical Yearbooks | ||
| Life services | Rural e-commerce penetration | Percentage of Taobao villages among all administrative villages (%, positive) | 0.263 | The 1% Change—2020 China Taobao Village Research Report; administrative village statistics from the National Bureau of Statistics | |
| Rural e-commerce transaction value | E-commerce purchases and sales (billion) | 0.100 | China Statistical Yearbook | ||
| Rural logistics coverage | Rural delivery routes (km, positive) | 0.033 | China Statistical Yearbook |
| Coupling Coordination Degree | Coupling Coordination Level | Coupling Coordination Degree | Coupling Coordination Level |
|---|---|---|---|
| (0, 0.1) | Extremely imbalanced | (0.4, 0.5) | Intermediate coordination |
| [0.1, 0.2) | Severely imbalanced | [0.5, 0.6) | Benign coordination |
| [0.2, 0.3) | On the verge of imbalance | [0.6, 0.8) | High coordination |
| [0.3, 0.4) | Primary coordination | [0.8, 1.0) | High-quality coordination |
| Region | 2013 | 2015 | 2017 | 2020 | ||||
|---|---|---|---|---|---|---|---|---|
| Fintech | Digital Villages | Fintech | Digital Villages | Fintech | Digital Villages | Fintech | Digital Villages | |
| National | 0.157 | 0.139 | 0.221 | 0.152 | 0.273 | 0.176 | 0.342 | 0.227 |
| Beijing | 0.216 | 0.114 | 0.276 | 0.126 | 0.330 | 0.155 | 0.418 | 0.239 |
| Tianjin | 0.175 | 0.062 | 0.238 | 0.066 | 0.284 | 0.080 | 0.362 | 0.112 |
| Hebei | 0.145 | 0.190 | 0.200 | 0.219 | 0.258 | 0.227 | 0.323 | 0.300 |
| Shanxi | 0.144 | 0.129 | 0.206 | 0.141 | 0.260 | 0.142 | 0.326 | 0.130 |
| Inner Mongolia | 0.147 | 0.112 | 0.215 | 0.117 | 0.259 | 0.129 | 0.309 | 0.148 |
| Liaoning | 0.160 | 0.153 | 0.226 | 0.155 | 0.267 | 0.168 | 0.326 | 0.164 |
| Jilin | 0.138 | 0.132 | 0.208 | 0.128 | 0.255 | 0.140 | 0.308 | 0.145 |
| Heilongjiang | 0.141 | 0.131 | 0.210 | 0.141 | 0.257 | 0.147 | 0.306 | 0.177 |
| Shanghai | 0.222 | 0.155 | 0.278 | 0.180 | 0.337 | 0.195 | 0.432 | 0.274 |
| Jiangsu | 0.181 | 0.294 | 0.244 | 0.352 | 0.298 | 0.415 | 0.382 | 0.557 |
| Zhejiang | 0.206 | 0.210 | 0.265 | 0.266 | 0.318 | 0.354 | 0.407 | 0.574 |
| Anhui | 0.151 | 0.134 | 0.211 | 0.147 | 0.272 | 0.162 | 0.350 | 0.238 |
| Fujian | 0.183 | 0.140 | 0.245 | 0.163 | 0.299 | 0.206 | 0.380 | 0.291 |
| Jiangxi | 0.146 | 0.114 | 0.208 | 0.124 | 0.267 | 0.160 | 0.341 | 0.173 |
| Shandong | 0.159 | 0.282 | 0.221 | 0.319 | 0.272 | 0.369 | 0.348 | 0.430 |
| Henan | 0.142 | 0.196 | 0.205 | 0.216 | 0.267 | 0.218 | 0.341 | 0.257 |
| Hubei | 0.165 | 0.158 | 0.227 | 0.144 | 0.285 | 0.178 | 0.359 | 0.199 |
| Hunan | 0.148 | 0.137 | 0.206 | 0.155 | 0.261 | 0.181 | 0.332 | 0.213 |
| Guangdong | 0.185 | 0.254 | 0.241 | 0.291 | 0.296 | 0.401 | 0.380 | 0.582 |
| Guangxi | 0.142 | 0.106 | 0.207 | 0.122 | 0.262 | 0.129 | 0.325 | 0.190 |
| Hainan | 0.158 | 0.046 | 0.230 | 0.051 | 0.276 | 0.051 | 0.344 | 0.058 |
| Chongqing | 0.160 | 0.058 | 0.222 | 0.071 | 0.276 | 0.083 | 0.345 | 0.118 |
| Sichuan | 0.153 | 0.166 | 0.216 | 0.178 | 0.268 | 0.220 | 0.335 | 0.332 |
| Guizhou | 0.121 | 0.081 | 0.193 | 0.085 | 0.252 | 0.103 | 0.308 | 0.146 |
| Yunnan | 0.138 | 0.118 | 0.204 | 0.116 | 0.256 | 0.131 | 0.319 | 0.179 |
| Shaanxi | 0.148 | 0.110 | 0.216 | 0.109 | 0.267 | 0.132 | 0.342 | 0.156 |
| Gansu | 0.128 | 0.080 | 0.200 | 0.092 | 0.244 | 0.099 | 0.306 | 0.112 |
| Qinghai | 0.118 | 0.057 | 0.195 | 0.064 | 0.240 | 0.065 | 0.298 | 0.070 |
| Ningxia | 0.137 | 0.061 | 0.215 | 0.056 | 0.256 | 0.062 | 0.310 | 0.081 |
| Xinjiang | 0.143 | 0.183 | 0.206 | 0.174 | 0.249 | 0.172 | 0.308 | 0.170 |
| Region | Province | 2013 | Ranking | 2020 | Ranking |
|---|---|---|---|---|---|
| Eastern | Zhejiang | 0.322 | 4 | 0.492 | 1 |
| Guangdong | 0.329 | 2 | 0.485 | 2 | |
| Jiangsu | 0.340 | 1 | 0.480 | 3 | |
| Shandong | 0.325 | 3 | 0.440 | 4 | |
| Shanghai | 0.305 | 5 | 0.415 | 5 | |
| Fujian | 0.283 | 10 | 0.408 | 7 | |
| Beijing | 0.280 | 12 | 0.398 | 8 | |
| Hebei | 0.288 | 7 | 0.394 | 9 | |
| Liaoning | 0.279 | 13 | 0.340 | 18 | |
| Tianjin | 0.228 | 24 | 0.317 | 26 | |
| Hainan | 0.207 | 29 | 0.266 | 30 | |
| Central | Henan | 0.289 | 6 | 0.385 | 10 |
| Anhui | 0.267 | 14 | 0.380 | 11 | |
| Hubei | 0.284 | 9 | 0.366 | 12 | |
| Hunan | 0.266 | 15 | 0.365 | 13 | |
| Jiangxi | 0.254 | 19 | 0.348 | 15 | |
| Heilongjiang | 0.261 | 16 | 0.341 | 17 | |
| Inner Mongolia | 0.253 | 20 | 0.327 | 21 | |
| Jilin | 0.260 | 18 | 0.325 | 23 | |
| Shanxi | 0.261 | 17 | 0.321 | 24 | |
| Western | Sichuan | 0.282 | 11 | 0.408 | 6 |
| Guangxi | 0.247 | 23 | 0.353 | 14 | |
| Yunnan | 0.253 | 22 | 0.345 | 16 | |
| Shaanxi | 0.253 | 21 | 0.340 | 19 | |
| Xinjiang | 0.284 | 8 | 0.338 | 20 | |
| Guizhou | 0.222 | 26 | 0.326 | 22 | |
| Chongqing | 0.220 | 27 | 0.318 | 25 | |
| Gansu | 0.225 | 25 | 0.304 | 27 | |
| Ningxia | 0.213 | 28 | 0.281 | 28 | |
| Qinghai | 0.203 | 30 | 0.269 | 29 |
| Variables | Sample Size | Mean | Median | Standard Deviation | Minimum Value | Maximum Value |
|---|---|---|---|---|---|---|
| D | 240.00 | 0.31 | 0.31 | 0.06 | 0.20 | 0.49 |
| EDL | 240.00 | 0.06 | 0.05 | 0.03 | 0.02 | 0.16 |
| RIS | 240.00 | 0.09 | 0.05 | 0.16 | 0.01 | 0.99 |
| RPD | 240.00 | 0.48 | 0.29 | 0.72 | 0.01 | 3.95 |
| DIL | 240.00 | 1.13 | 0.91 | 0.83 | 0.07 | 3.99 |
| Variables | D | EDL | RIS | RPD | DIL |
|---|---|---|---|---|---|
| D | 1.0000 | ||||
| EDL | 0.5712 *** | 1.0000 | |||
| RIS | 0.2065 *** | 0.7636 *** | 1.0000 | ||
| RPD | 0.2722 *** | 0.7134 *** | 0.9479 *** | 1.0000 | |
| DIL | 0.8522 *** | 0.2273 *** | −0.1587 ** | −0.0473 *** | 1.0000 |
| (1) | (2) | (3) | (4) | |
|---|---|---|---|---|
| D | D | D | D | |
| edl | 1.051 *** | 1.853 *** | 1.387 *** | 1.230 *** |
| (0.356) | (0.404) | (0.250) | (0.229) | |
| ris | −0.174 *** | −0.179 *** | −0.105 *** | |
| (0.0525) | (0.0293) | (0.0299) | ||
| rpd | 0.653 *** | 0.463 *** | ||
| (0.165) | (0.159) | |||
| dil | 0.0178 *** | |||
| (0.00277) | ||||
| Time effect | Control | Control | Control | Control |
| Individual effects | Control | Control | Control | Control |
| Constant | 0.220 *** | 0.199 *** | −0.0872 | −0.00713 |
| (0.0168) | (0.0148) | (0.0757) | (0.0703) | |
| Observations | 240 | 240 | 240 | 240 |
| R-squared | 0.926 | 0.937 | 0.958 | 0.970 |
| Number of pro | 30 | 30 | 30 | 30 |
| Variables | (1) | (2) | (3) | (4) | (5) | (6) | (7) | (8) |
|---|---|---|---|---|---|---|---|---|
| edl | D | ris | D | rpd | D | dil | D | |
| l.edl | 0.8689 *** | |||||||
| (0.038) | ||||||||
| l.ris | 0.8178 *** | |||||||
| (0.129) | ||||||||
| l.rpd | 0.8314 *** | |||||||
| (0.0914) | ||||||||
| l.dil | 0.8544 *** | |||||||
| (0.049) | ||||||||
| edl | 1.725 *** | 0.9523 *** | 1.564 *** | −0.218 * | 1.496 *** | −1.704 | 1.492 *** | |
| (0.186) | (0.414) | (0.152) | (0.1305) | (0.161) | (2.048) | (0.152) | ||
| ris | 0.0167 *** | −0.142 *** | −0.130 *** | 0.0296 | −0.124 *** | −0.342 | −0.106 *** | |
| (0.005) | (0.0249) | (0.0290) | (0.041) | (0.0256) | (0.303) | (0.0248) | ||
| rpd | −0.0181 | 0.524 *** | −0.115 | 0.540 *** | 0.614 *** | 0.031 | 0.497 *** | |
| (0.016) | (0.0824) | (0.120) | (0.0867) | (0.107) | (0.968) | (0.0859) | ||
| dil | 0.0005 | 0.0167 *** | −0.0034 | 0.0168 *** | 0.0046 ** | 0.0161 *** | 0.0209 *** | |
| (0.0004) | (0.00219) | (0.003) | (0.00218) | (0.002) | (0.00223) | (0.00252) | ||
| Time effect | Control | Control | Control | Control | Control | Control | Control | Control |
| Individual effects | Control | Control | Control | Control | Control | Control | Control | Control |
| Constant | 0.0810 | −1.801 *** | 0.5028 | −1.852 *** | 0.6707 * | −2.136 *** | 0.591 | −1.698 *** |
| 0.0617 | (0.313) | (0.473) | (0.330) | (0.3439) | (0.409) | (3.690) | (0.329) | |
| Observations | 210 | 210 | 210 | 210 | 210 | 210 | 210 | 210 |
| R-squared | 0.998 | 0.989 | 0.995 | 0.990 | 1.000 | 0.989 | 0.979 | 0.989 |
| Variables | (1) | (2) | (3) |
|---|---|---|---|
| Eastern Region | Central Region | Western Region | |
| D | D | D | |
| edl | 1.408 *** | 0.0578 | 0.431 |
| (0.285) | (0.335) | (1.139) | |
| ris | −0.111 *** | −0.0344 | −0.256 |
| (0.0313) | (0.205) | (0.538) | |
| rpd | 0.355 ** | 0.826 *** | 0.846 |
| (0.145) | (0.121) | (0.833) | |
| dil | 0.0245 *** | 0.0141 * | 0.0180 *** |
| (0.00587) | (0.00625) | (0.00457) | |
| Time effect | Control | Control | Control |
| Individual effects | Control | Control | Control |
| Constant | −0.108 | 0.0408 | 0.113 |
| (0.120) | (0.0323) | (0.101) | |
| Observations | 96 | 72 | 72 |
| R-squared | 0.979 | 0.976 | 0.975 |
| Number of pro | 12 | 9 | 9 |
| Convergence Coefficient | Full Sample | Eastern Region | Central Region | Western Region | ||||
|---|---|---|---|---|---|---|---|---|
| OLS | FE | OLS | FE | OLS | FE | OLS | FE | |
| β | 0.0380 *** | −0.0175 | 0.0538 *** | 0.0101 | −0.0333 | −0.0675 ** | −0.0045 | −0.0320 |
| (3.924) | (−1.155) | (3.756) | (0.410) | (−1.356) | (−2.597) | (−0.211) | (−1.208) | |
| Constant | 0.0021 | 0.0191 *** | −0.0018 | 0.0127 | 0.0223 *** | 0.0327 *** | 0.0135 ** | 0.0212 *** |
| (0.682) | (4.086) | (−0.370) | (1.549) | (2.953) | (4.107) | (2.240) | (2.864) | |
| Observations | 210 | 210 | 84 | 84 | 63 | 63 | 63 | 63 |
| F | 15.40 *** | 1.33 | 14.11 *** | 0.17 | 1.84 | 6.75 ** | 0.04 | 1.46 |
| Convergence Coefficient | Full Sample | Eastern Region | Central Region | Western Region | ||||
|---|---|---|---|---|---|---|---|---|
| OLS | FE | OLS | FE | OLS | FE | OLS | FE | |
| β | −0.0938 *** | −0.4238 *** | −0.0911 ** | −0.5425 *** | −0.1964 *** | −0.3251 *** | −0.1225 ** | −0.2972 *** |
| (−3.909) | (−7.985) | (−1.991) | (−5.601) | (−4.637) | (−3.842) | (−2.274) | (−2.709) | |
| edl | 0.0819 ** | 0.8876 *** | 0.0552 | 1.1328 *** | 0.0292 | 0.4246 | −0.0320 | 0.3974 |
| (2.241) | (6.029) | (0.894) | (4.889) | (0.370) | (1.421) | (−0.253) | (0.944) | |
| ris | 0.0149 | −0.0462 ** | 0.0382 * | −0.0652 ** | −0.0695 * | 0.0984 | 0.0109 | 0.3419 |
| (1.168) | (−2.020) | (1.821) | (−2.062) | (−1.790) | (0.660) | (0.112) | (1.369) | |
| rpd | −0.0014 | 0.2145 *** | −0.0067 * | 0.1790 ** | 0.0114 ** | 0.2740 | 0.0059 | 0.5640 |
| (−0.587) | (3.494) | (−1.767) | (2.087) | (2.205) | (1.266) | (0.670) | (1.418) | |
| dil | 0.0078 *** | 0.0106 *** | 0.0090 *** | 0.0175 *** | 0.0084 *** | 0.0095 ** | 0.0084 *** | 0.0100 *** |
| (5.523) | (4.923) | (3.177) | (4.013) | (3.389) | (2.438) | (3.788) | (2.966) | |
| Constant | 0.0276 *** | −0.0198 | 0.0290 *** | −0.0657 | 0.0605 *** | 0.0027 | 0.0383 *** | −0.0253 |
| (5.327) | (−0.740) | (2.820) | (−0.932) | (5.651) | (0.047) | (3.229) | (−0.419) | |
| Observations | 210 | 210 | 84 | 84 | 63 | 63 | 63 | 63 |
| F | 53.73 *** | 14.39 *** | 22.90 *** | 7.38 *** | 28.66 *** | 5.17 *** | 28.66 *** | 4.29 *** |
Disclaimer/Publisher’s Note: The statements, opinions and data contained in all publications are solely those of the individual author(s) and contributor(s) and not of MDPI and/or the editor(s). MDPI and/or the editor(s) disclaim responsibility for any injury to people or property resulting from any ideas, methods, instructions or products referred to in the content. |
© 2023 by the authors. Licensee MDPI, Basel, Switzerland. This article is an open access article distributed under the terms and conditions of the Creative Commons Attribution (CC BY) license (https://creativecommons.org/licenses/by/4.0/).
Share and Cite
Zhang, C.; Zhang, Y.; Li, Y.; Li, S. Coupling Coordination between Fintech and Digital Villages: Mechanism, Spatiotemporal Evolution and Driving Factors—An Empirical Study Based on China. Sustainability 2023, 15, 8265. https://doi.org/10.3390/su15108265
Zhang C, Zhang Y, Li Y, Li S. Coupling Coordination between Fintech and Digital Villages: Mechanism, Spatiotemporal Evolution and Driving Factors—An Empirical Study Based on China. Sustainability. 2023; 15(10):8265. https://doi.org/10.3390/su15108265
Chicago/Turabian StyleZhang, Chengkai, Yanjun Zhang, Yu Li, and Shan Li. 2023. "Coupling Coordination between Fintech and Digital Villages: Mechanism, Spatiotemporal Evolution and Driving Factors—An Empirical Study Based on China" Sustainability 15, no. 10: 8265. https://doi.org/10.3390/su15108265
APA StyleZhang, C., Zhang, Y., Li, Y., & Li, S. (2023). Coupling Coordination between Fintech and Digital Villages: Mechanism, Spatiotemporal Evolution and Driving Factors—An Empirical Study Based on China. Sustainability, 15(10), 8265. https://doi.org/10.3390/su15108265