Article

Use of a Biopolymer for Road Pavement Subgrade

1
Department of Civil Engineering, University of Gaziantep, Gaziantep 27410, Turkey
2
Department of Civil Engineering, Hasan Kalyoncu University, Gaziantep 27410, Turkey
3
Department of Civil Engineering, Kilis 7 Aralik University, Kilis 79000, Turkey
4
Department of Civil Engineering, Turgut Ozal University, Malatya 44210, Turkey
*
Author to whom correspondence should be addressed.
Sustainability 2023, 15(10), 8231; https://doi.org/10.3390/su15108231
Submission received: 14 April 2023 / Revised: 13 May 2023 / Accepted: 15 May 2023 / Published: 18 May 2023
(This article belongs to the Section Sustainable Engineering and Science)

Abstract

:
This paper presents an extensive series of laboratory works and a prediction model on the design of a road pavement subgrade with Xanthan Gum (XG) biopolymer. The experimental works were carried out using mixtures of conventional aggregate for road pavement construction and XG at the ratios of 0%, 1%, 2%, and 5%, by dry weight. Unconfined compressive strength (UCS) and California bearing ratio (CBR) tests were conducted during the experimental works at the end of the various curing periods (4, 8, 16, and 32 days). An example of an improvement in the UCS values for a specimen with 5% XG addition tested at the end of 4-daycuring yields about a 200% increment by the end of a 32-daycuring. The CBR values of clean aggregates were found to be increased by about 300% by 5% XG addition for all curing periods applied. Furthermore, the energy absorption capacity of the aggregates was observed to be increased significantly by both XG inclusion and curing period. Moreover, scaled conjugate gradient (SCG) training algorithm-based models developed for the prediction of CBR and UCS test results displayed a very high estimation performance with the regression coefficients of R2 = 0.967 and R2 = 0.987, respectively. Evidently, XG biopolymer is provably of use as an alternative inclusion in road pavement subgrades constructed with conventional aggregates.

1. Introduction

The need for soil improvement in construction and in infrastructure activities that arise due to rapid population growth is of increasing importance across the world. The fact is that soil improvement techniques still remain challenging for researchers and engineers in practice, although it is among the most studied subjects in geotechnics. Specifically, due to the significant environmental concerns regarding the harmful effects of cementitious binders, such as toxicity, on the natural ecosystem, the number of the studies on alternative chemical approaches have increased substantially in order to provide a healthier and safer environment [1,2,3].
In an effort to address the environmental concerns associated with traditional cementitious binders, a range of biopolymers have been introduced as potential alternative materials for soil stabilization as well as to enhance the mechanical properties of various earth materials containing sand, clay, mine tailing, waste materials, silt, and sand–clay mixtures [4,5,6,7,8,9,10,11]. For example, direct shear testing data reported by Cabalar [12] showed a significant increment (up to about 300% by 5% XG addition) in shear strength as the XG content increased regardless of curing period. Bouazza et al. [4] revealed a significant decrease in the hydraulic conductivity of silty sand mixed with biopolymer due to the pore-clogging effect. Ayeldeen et al. [13] pointed out a substantial increment in the optimum moisture content (wopt), unconfined compressive strength (qu), modulus of elasticity (E), and cohesion (c) values of the soils by biopolymer additions. Chen et al. [6] studied the uniaxial and triaxial response of mine tailings with various contents of XG biopolymer and realized an increment of about 145% and 175% in the qu and deviatoric stress values, respectively. Dehghan et al. [14] carried out a comparative study of various polymer applications by using different testing machines, which resulted in the highest deviatoric stress and lowest hydraulic conductivity values when XG was used in the soils. Chang and Cho [15] showed a significant increment in the undrained shear strength (su), internal angle of friction (ϕ), and cohesion (c) values of a soil mixed with the biopolymer addition. Smitha and Rangaswamy [16] carried out cyclic triaxial tests on silty sands treated with biopolymer at various curing times (3 days, 7 days, and 28 days), and proposed the use of biopolymers in the remediating of the liquefaction potential. Recently, Cabalar and Demir [10] employed XG biopolymer to enhance the su values of samples with different water content and sand grain size/shape.
The fact is that there are a limited number of studies which have been carried out on the use of biopolymers in road pavement designs, although much research is available on their response in soil element tests [5,17]. Therefore, this paper aims to describe the results of extensive laboratory works into the use of biopolymer in road pavement subgrade design. The paper identifies the experimental results on the conventional aggregate used for road construction prepared with water and the XG biopolymer at varying proportions ranging from 0% to 3% based on the dry weight. The equipment employed in these mixtures were unconfined compressive strength (UCS) and California bearing ratio (CBR) testing machines. The laboratory tests were performed at the end of 4-, 8-, 16-, and 32-day curing time periods in order to perform a systematic analysis of the development of curing time on the response of such mixtures. Furthermore, data sets were created based on the results of the experimental studies, and prediction models were developed to predict both the CBR and UCS results.

2. Experimental Study

Materials and Methods

Crushed rock grains (CG), described as conventional aggregate for road construction, and Xanthan Gum (XG) biopolymer were used during the experimental studies. The commercially purchasable CG samples were obtained by mechanically crushing the rocks naturally available in and around the Gaziantep region in southern central Turkey into angular grains that ranged from 0.06 mm to 19.0 mm in size. The properties of the CG samples, classified as well-graded gravel (GW) using the unified soil classification system (USCS), were selected to mimic the Type I Gradation B in accordance with ASTM D1241-15 [18]. Specific gravity (Gs) value of the CG grains was examined to be 2.65. It was in the form of calcium carbonate. Roundness (R) and sphericity (S) for these grains were estimated at about 0.16 and 0.55 by employing the research by Muszynski and Vitton [19]. Apparently, the CG grains have been investigated and are widely regarded as highly angular [19,20,21,22]. The XG is a polysaccharide-based biopolymer obtained by the bacteria named Xanthomonas campestris. The XG polymer, regularly utilized in various applications including food, cosmetics, and agriculture industries, has a combination of mannoses (C6H12O6), glucoses (C6H12O6), and glucuronic acid (C6H10O7). There have been numerous studies published over last decades proving the potential of XG for soil improving in geotechnical engineering applications [12,17], as it generates a viscous solution with high shear stability when it is mixed with water [5,23,24].
Required amounts of CG and XG samples were mixed together with water until homogenous specimens were obtained for testing in both UCS and CBR machines by considering the ratios between the size of the testing molds and soil grains. The compacted specimens were tested in accordance with the ASTM D2166 [25] in order to understand their responses at the end of various curing times. The samples were prepared using an identical method, compacted into molds measuring 150 mm in diameter and 175 mm in height, and evaluated under un-soaked conditions (in accordance with ASTM D1883 [26]) to analyze their CBR performance (Table 1).

3. Experimental Results and Discussion

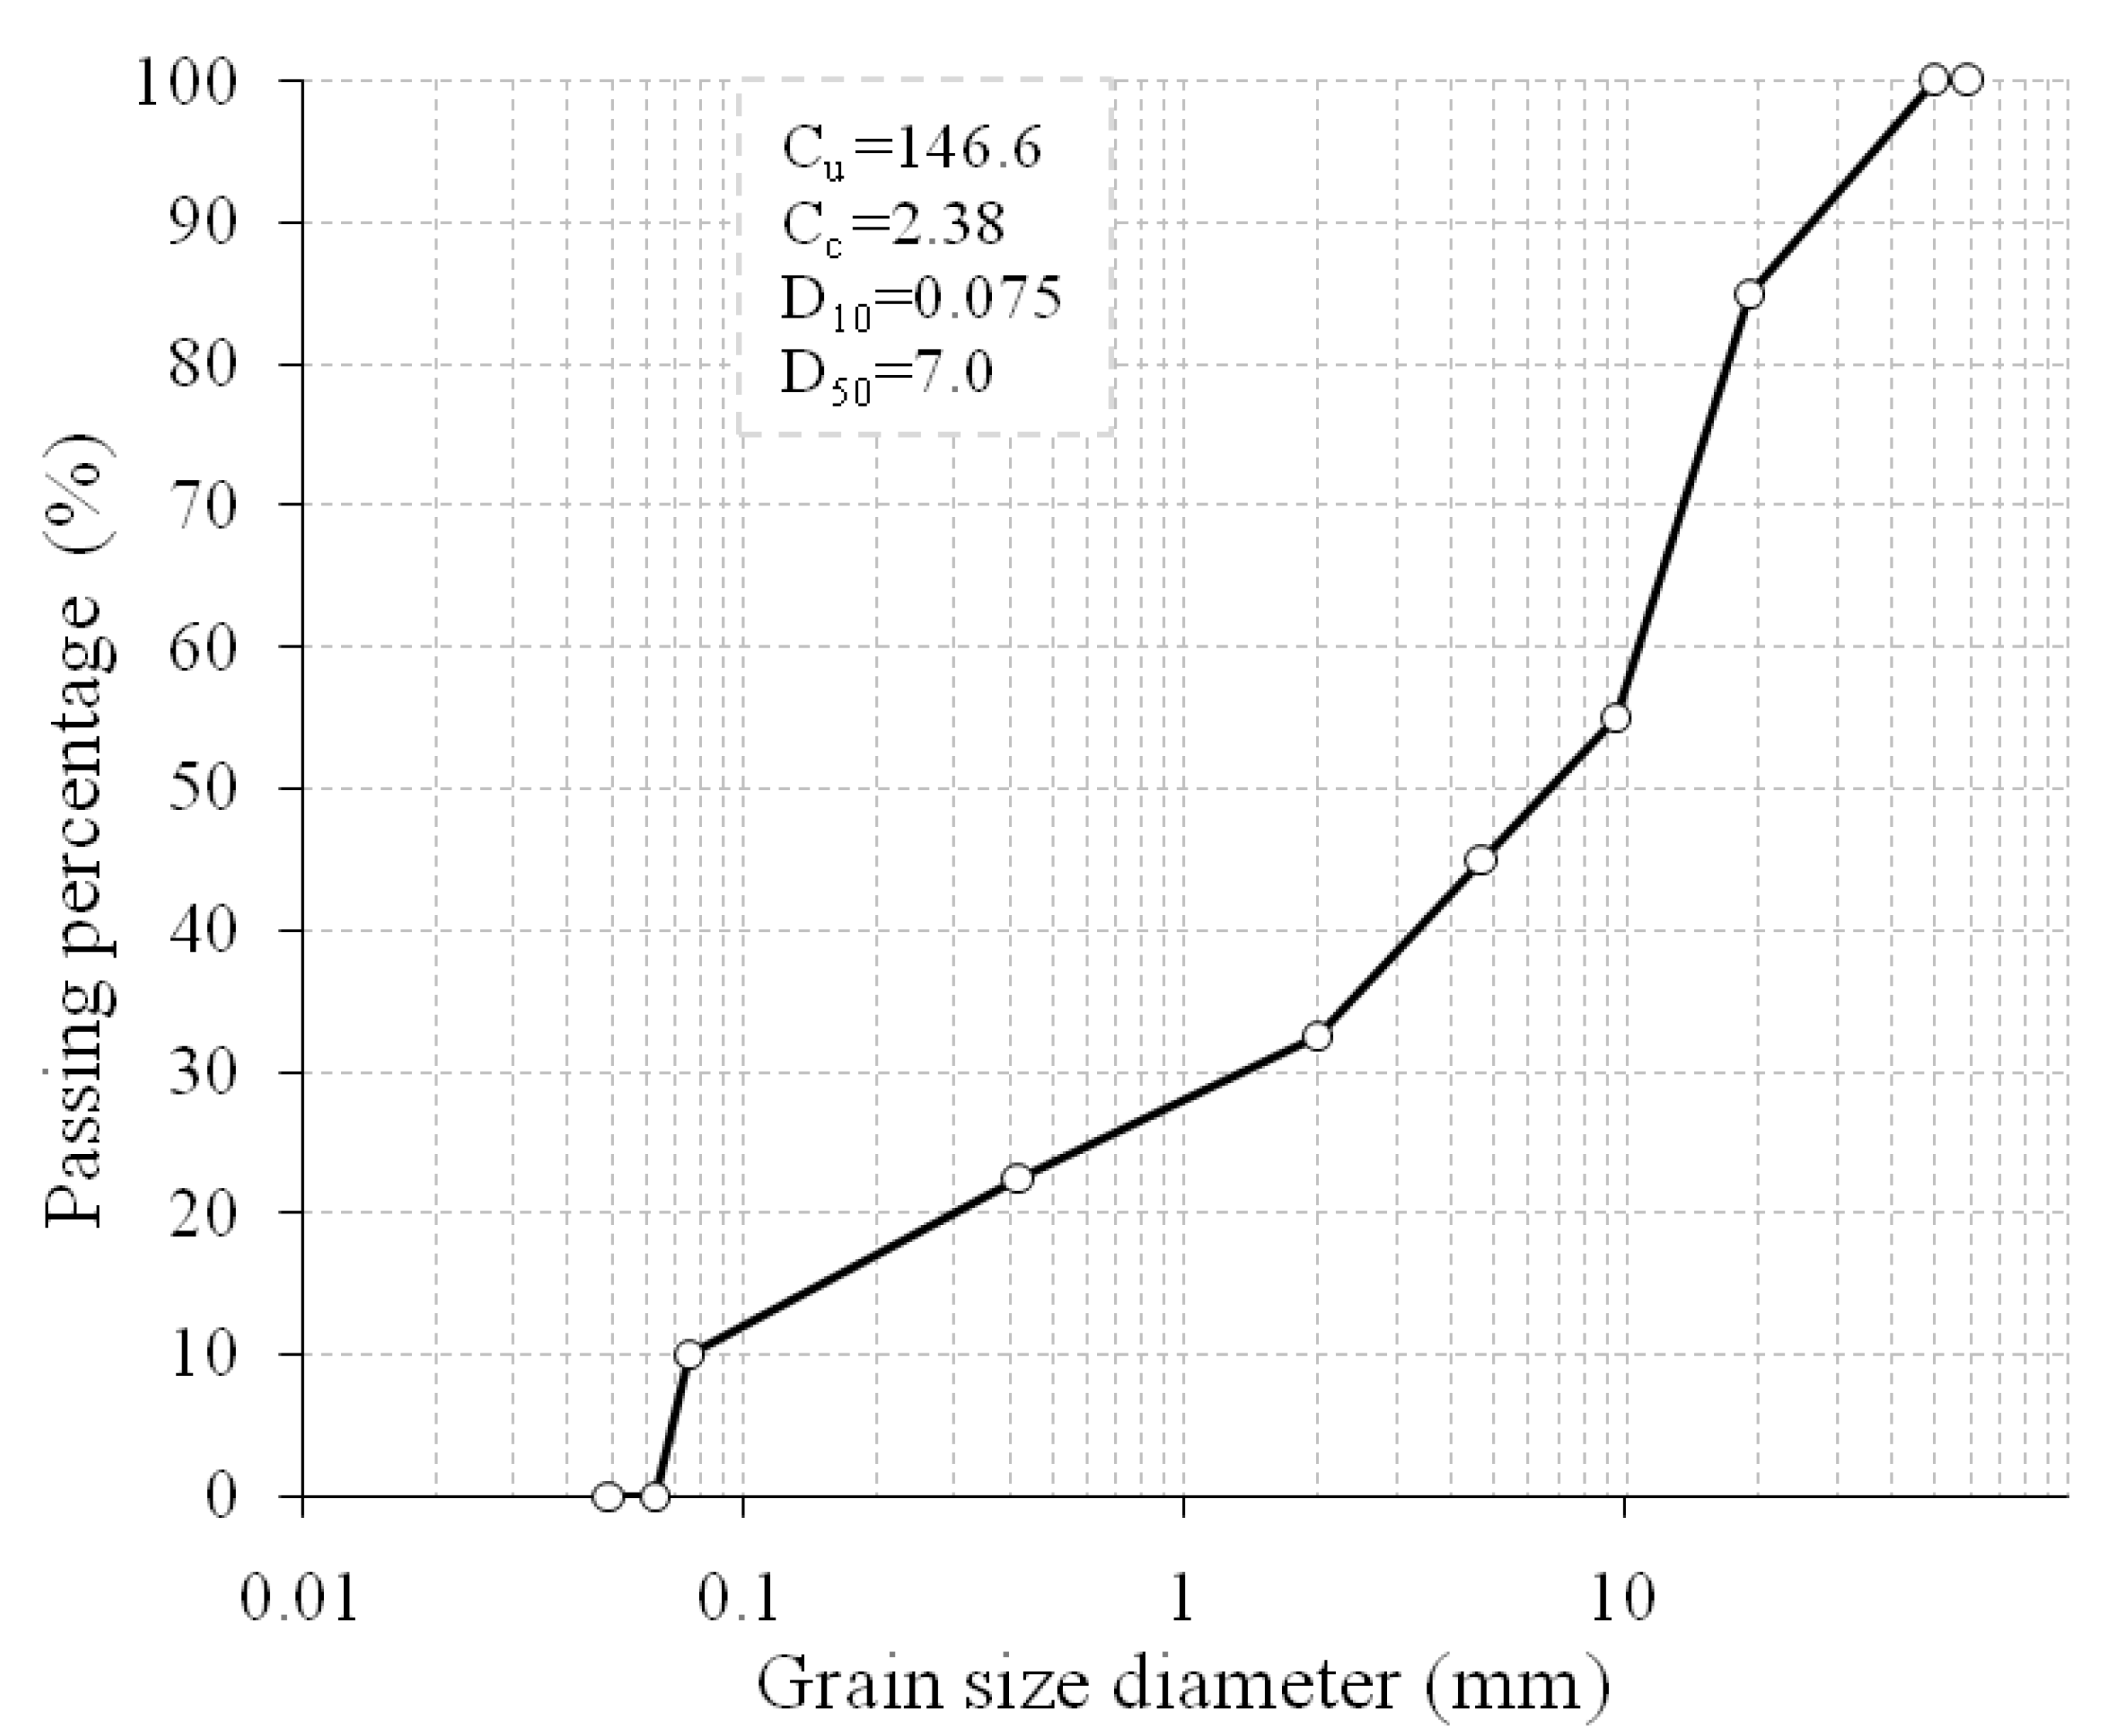
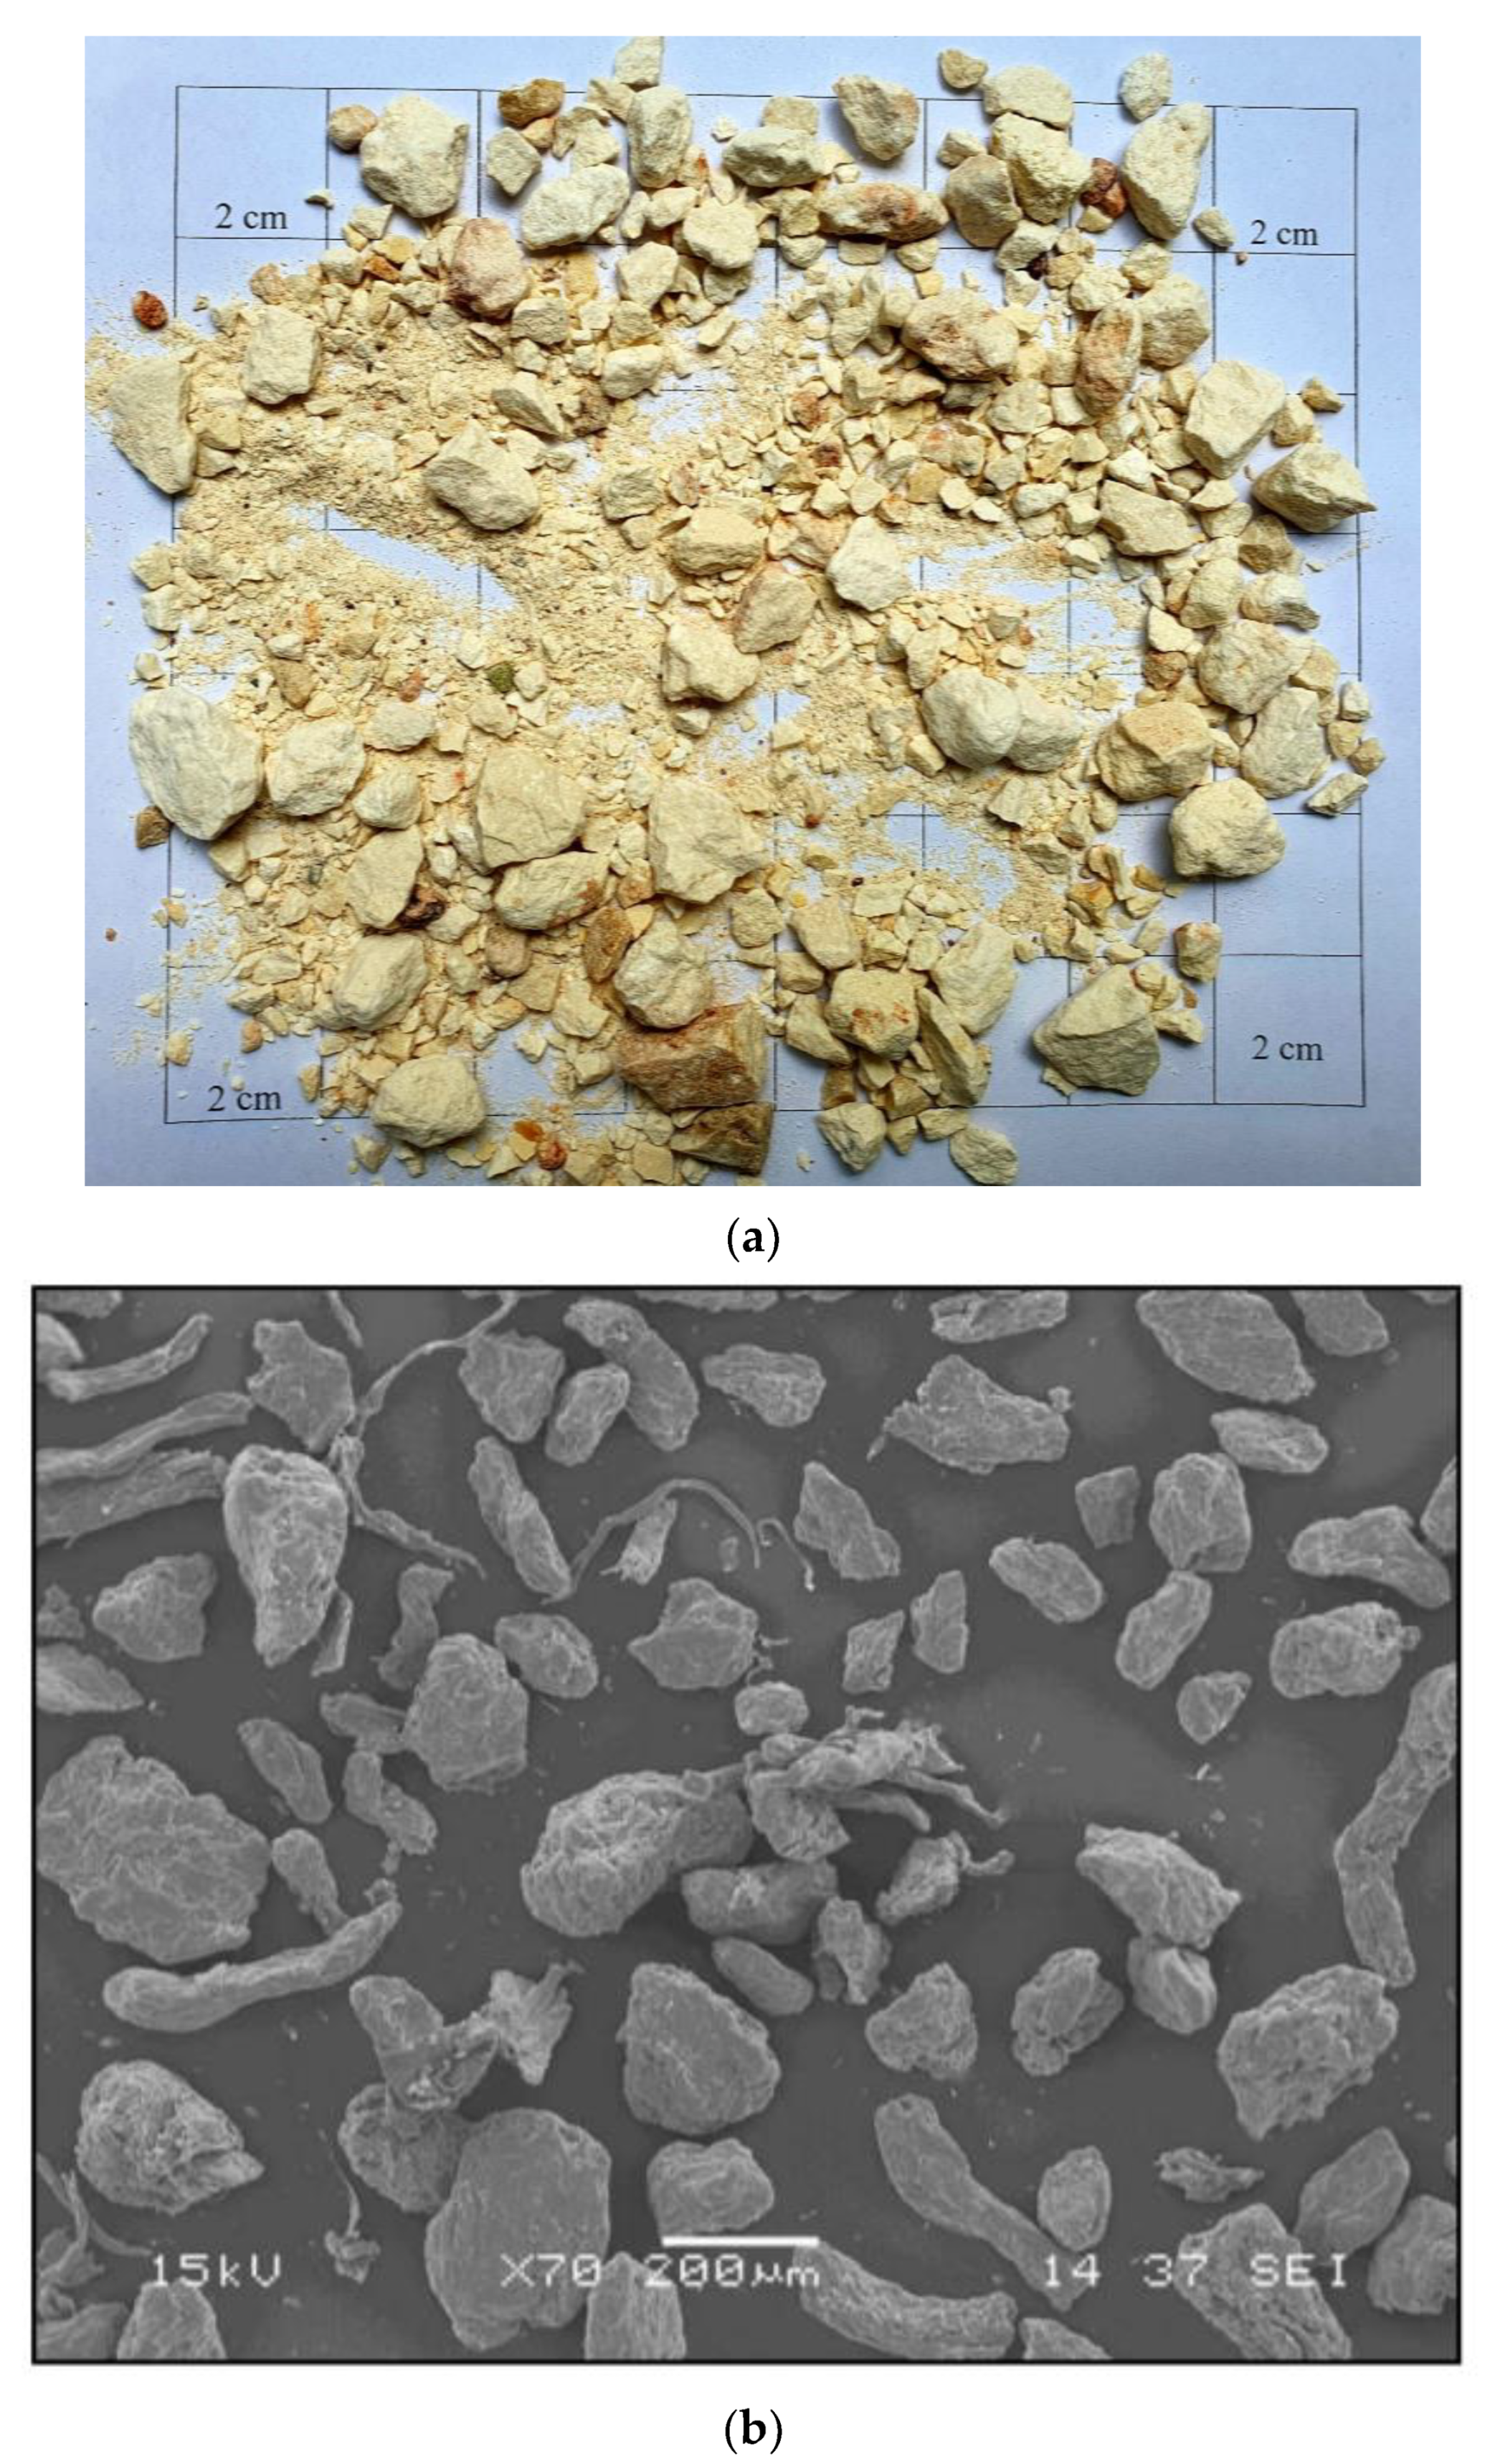
Figure 1 and Figure 2 present the grains’ size distribution, scanning electron microscopy (SEM) picture and shape characteristics, respectively. As can be seen, 90% of the crushed rock grains had a size of less than 19 mm with an angular shape, whilst the XG grains had an irregular shape.
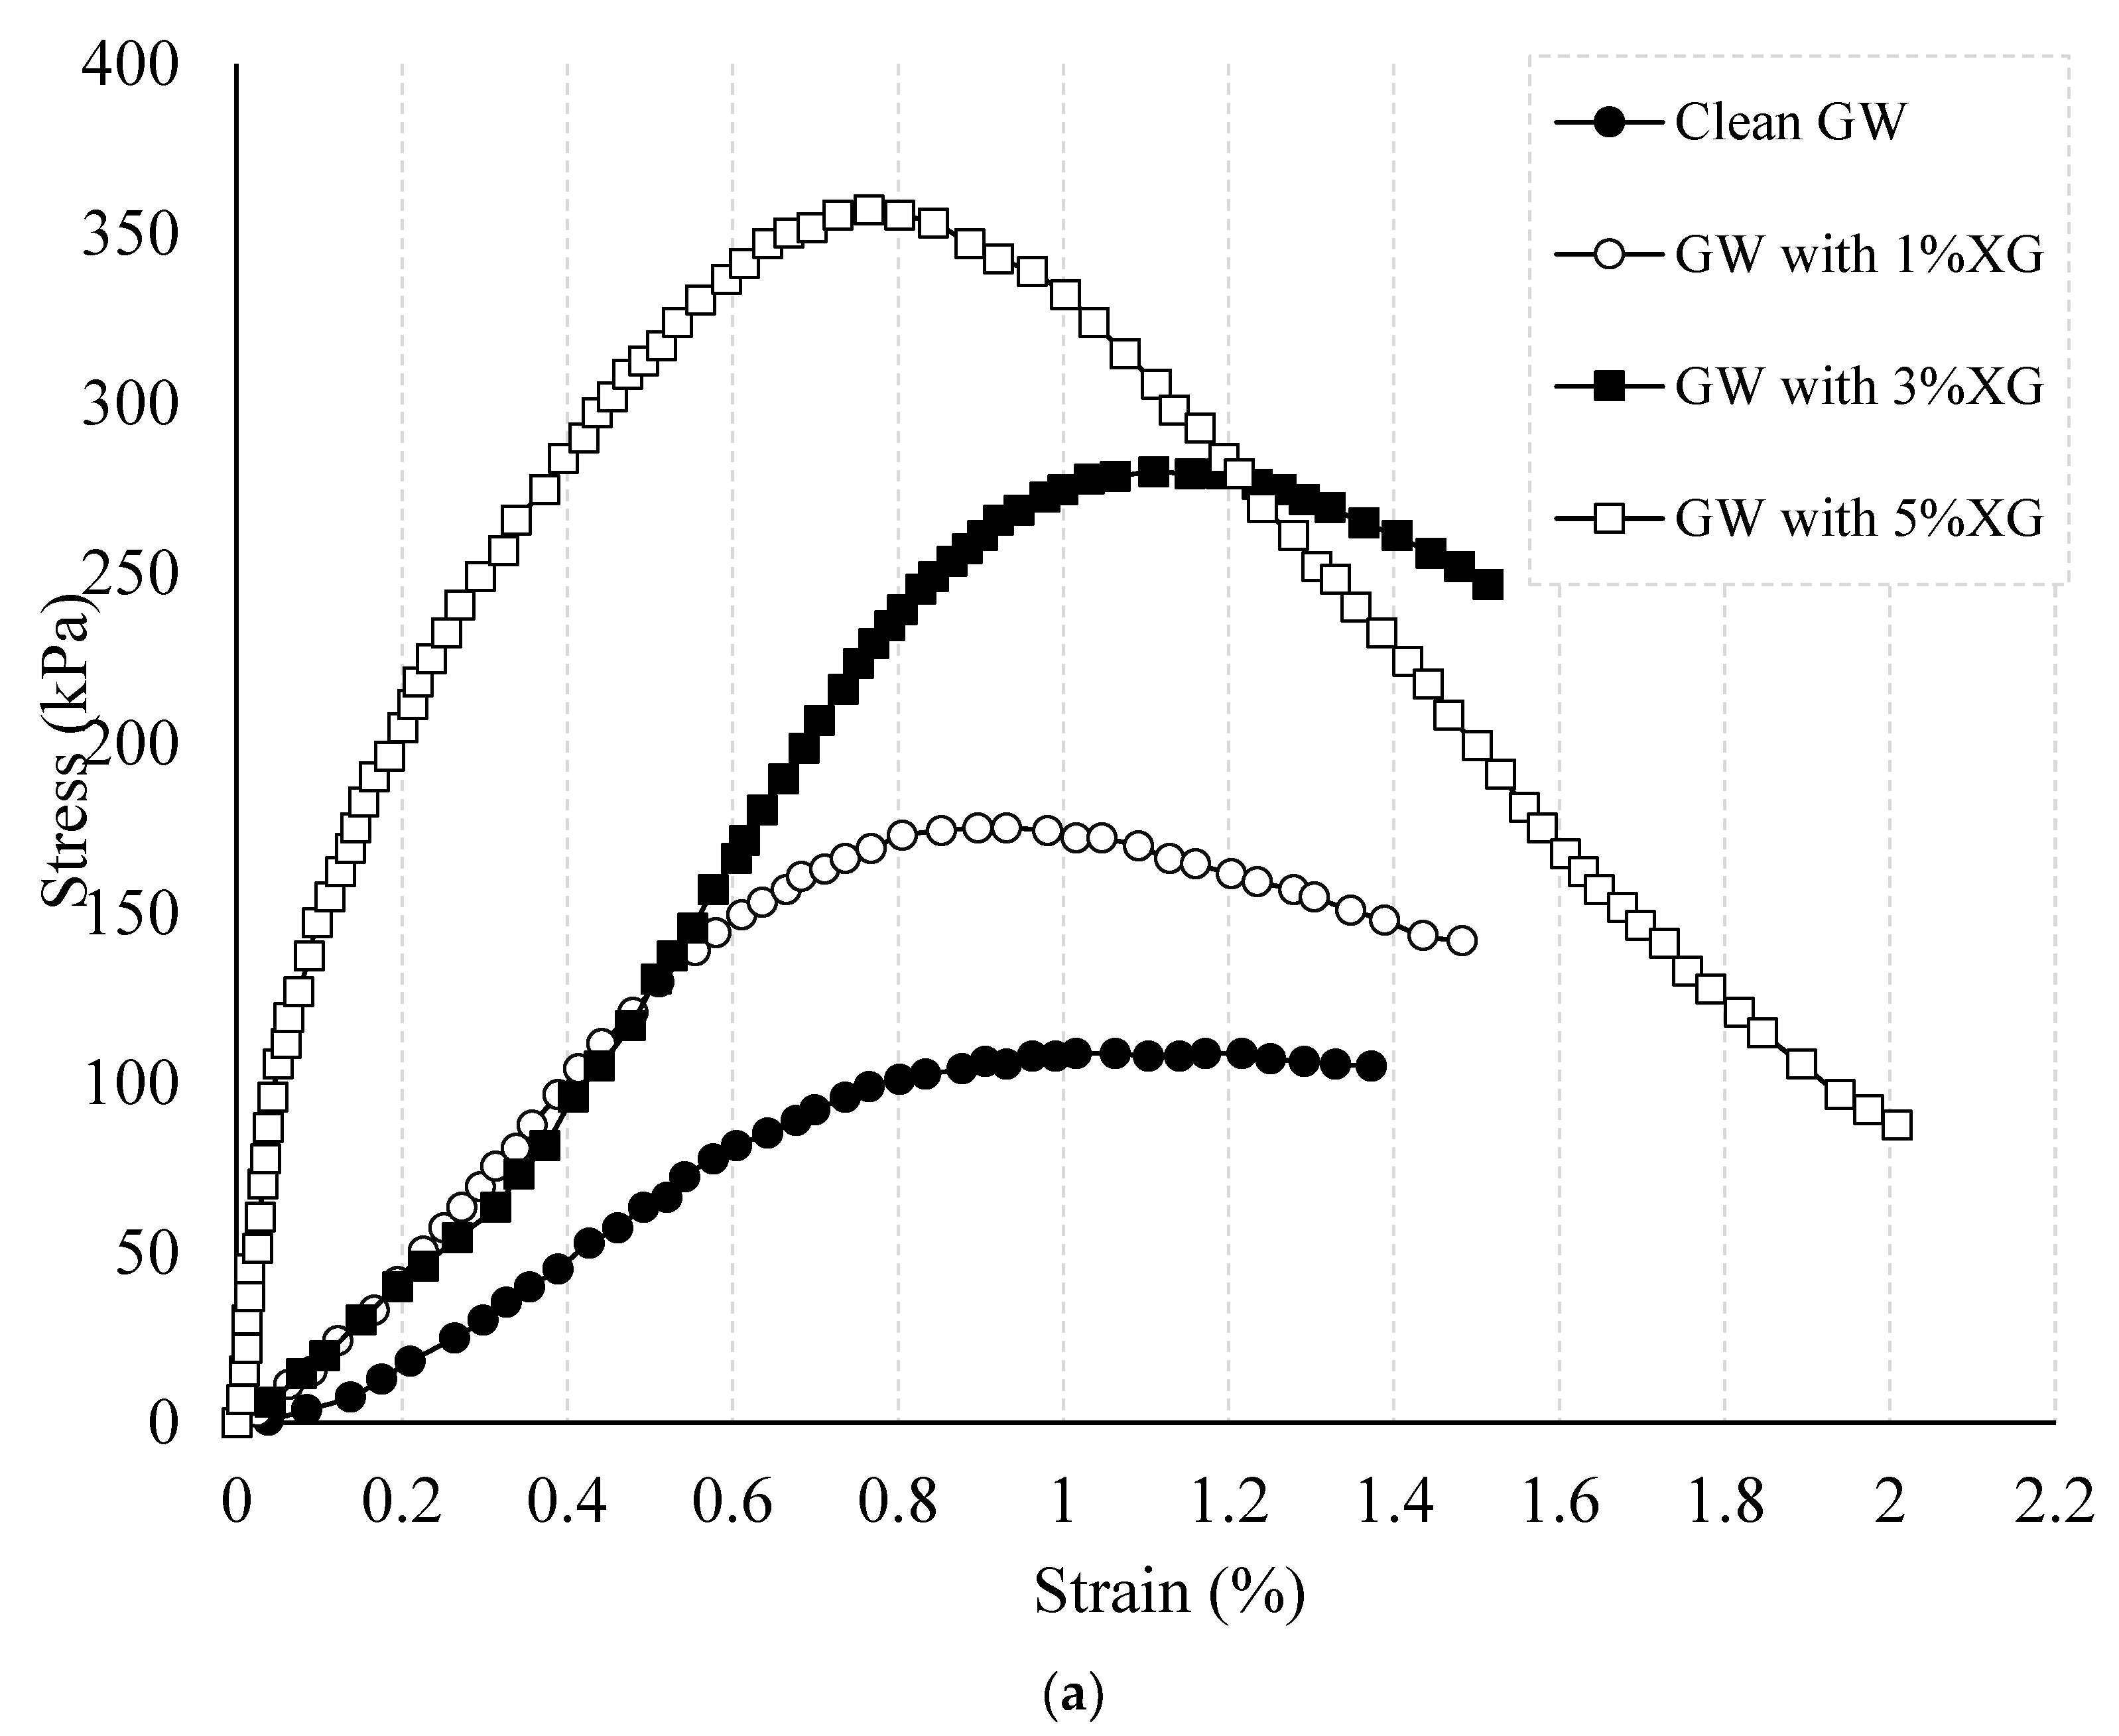
Figure 3 presents the effect of XG biopolymer on the UCS testing results of specimens tested at the end of 4- and 32-daycuring times. The unconfined compressive strength (qu) value for the well-graded crushed rock grains (GW), tested after 4-daycuring time, was observed to be about 110 kPa, while it was found to be about 460 kPa at the end of a 32-daycuring time. This is a more than fourfold increase. Such a finding is attributed to the calcium carbonate (CaCO3) form of the grains as this type of geomaterials could have different engineering properties from other earth materials. The fact is that the unexpectedly observed low driving resistance in the 1982 North Rankin platform construction prompted research on the engineering behavior of geomaterials with a CaCO3 composition [27]. Since then, numerous studies on the engineering behavior of soils with a calcium carbonate form have been carried out [28,29,30,31,32]. In the present laboratory investigation, the grains mixed with the optimum amount of water were thought to increase the cementation, and thus the qu value of the surface area available to react chemically increases. It can be seen that the cementation through the grains increased in proportion to the amount of XG in the samples. This indicates that the chemical reactions that took place through the compounds C6H12O6, C6H10O7, and CaCO3contributed positively to the overall behavior. A closer look at Figure 1 shows that the maximum qu value of the clean sample was increased to 360 kPa and 1020 kPa with 5% XG addition tested at the end of a 4- and 32 day-curing period, respectively. In addition to the cementation that took place between the soil grains themselves, such an increase in the qu values was likely due to the XG biopolymer, which provided an interparticle bonding among the soil grains by hydrogels. The XG biopolymer in voids acted as a bridge between the soil grains, and thus increased the qu values of the samples. Many studies in the literature have recently made similar observations on such influences of various biopolymers [5,6,7,9,10,13,33,34,35].
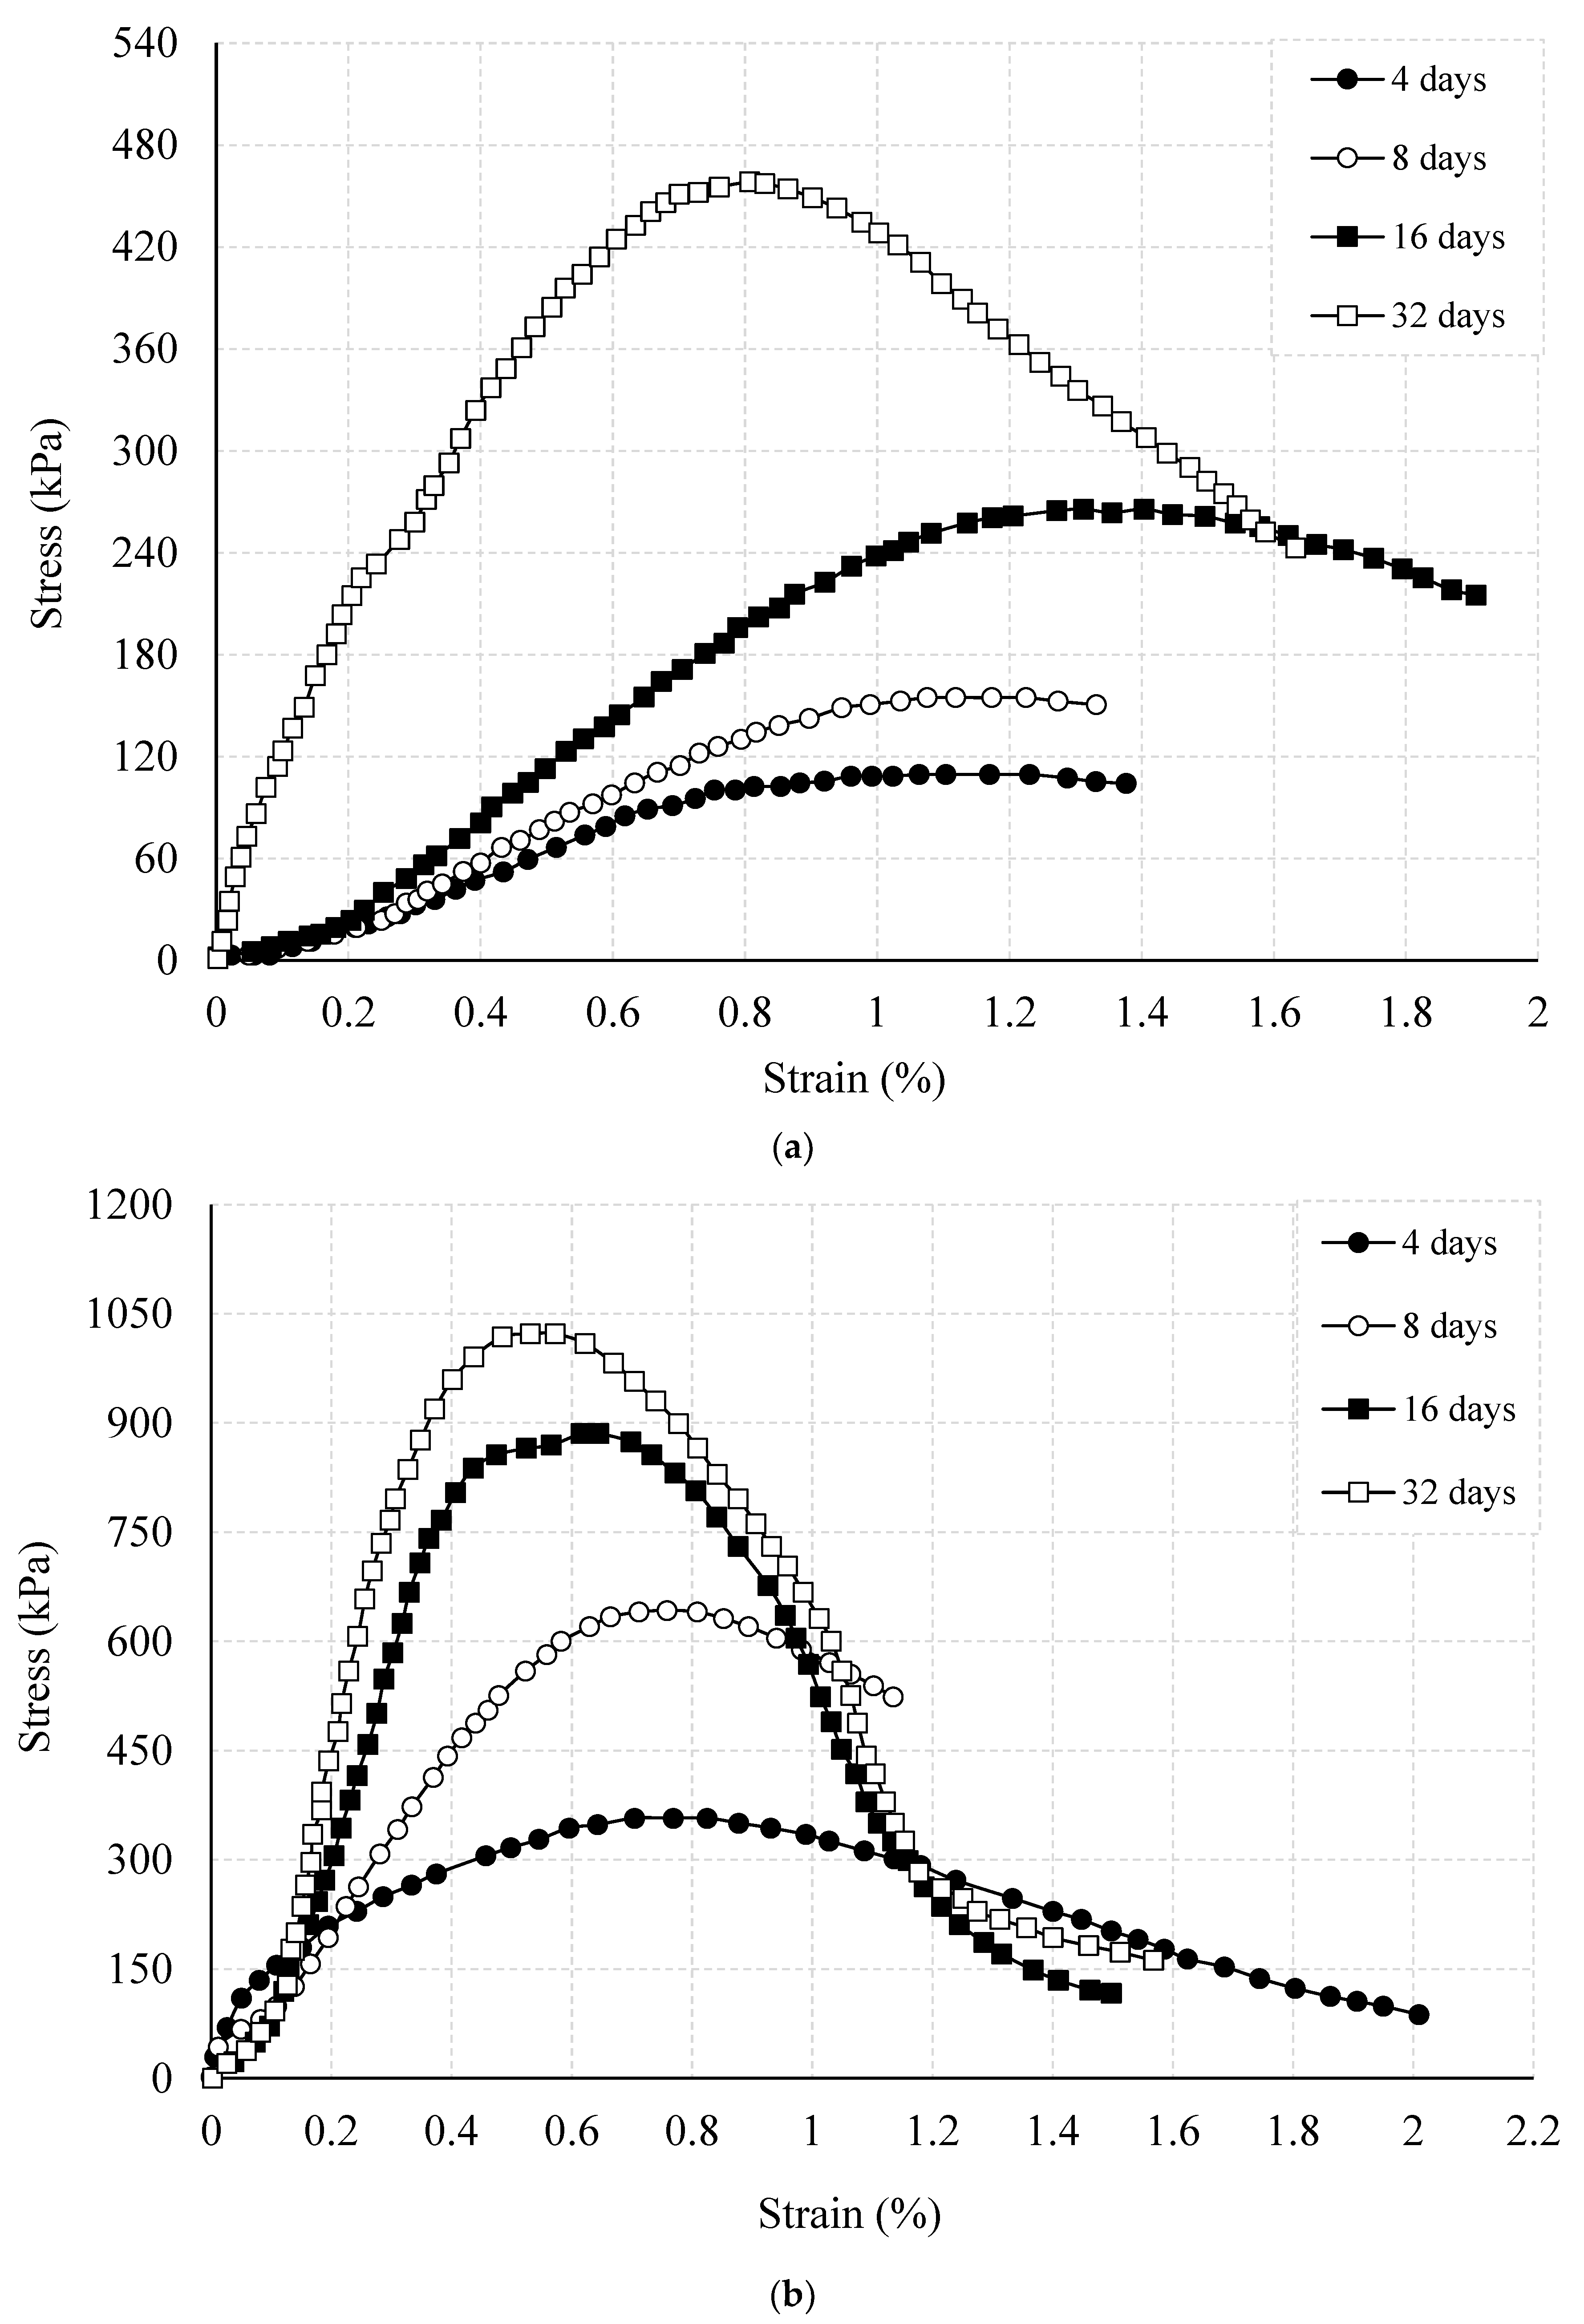
Figure 4 shows the effect of curing period on the qu values of crushed rock grains only and those with 5% XG biopolymer. The qu value for clean grains tested was observed to increase to 110 kPa after a 4-daycuringtime, 160 kPa after an 8-daycuringtime, 270 kPa after a 16-daycuringtime, and to 460 kPa after a 32-daycuringtime. Furthermore, the grains with 5% XG tested after a 4-daycuringtime had a qu value of 360 kPa whilst this value increased to 660 kPa after an 8-daycuringtime, 890 kPa after a 16-daycuringtime, and to 1020 kPa after a 32-daycuringtime. Similar findings on the effect of curing time on different soil types mixed with XG biopolymer at various contents have been reported by many researchers including [7,9,33,34,36,37]. The significant increase is due to the dehydration of biopolymers that leads to the strengthening of the XG biopolymer cement bridges formed between the grains of soil.
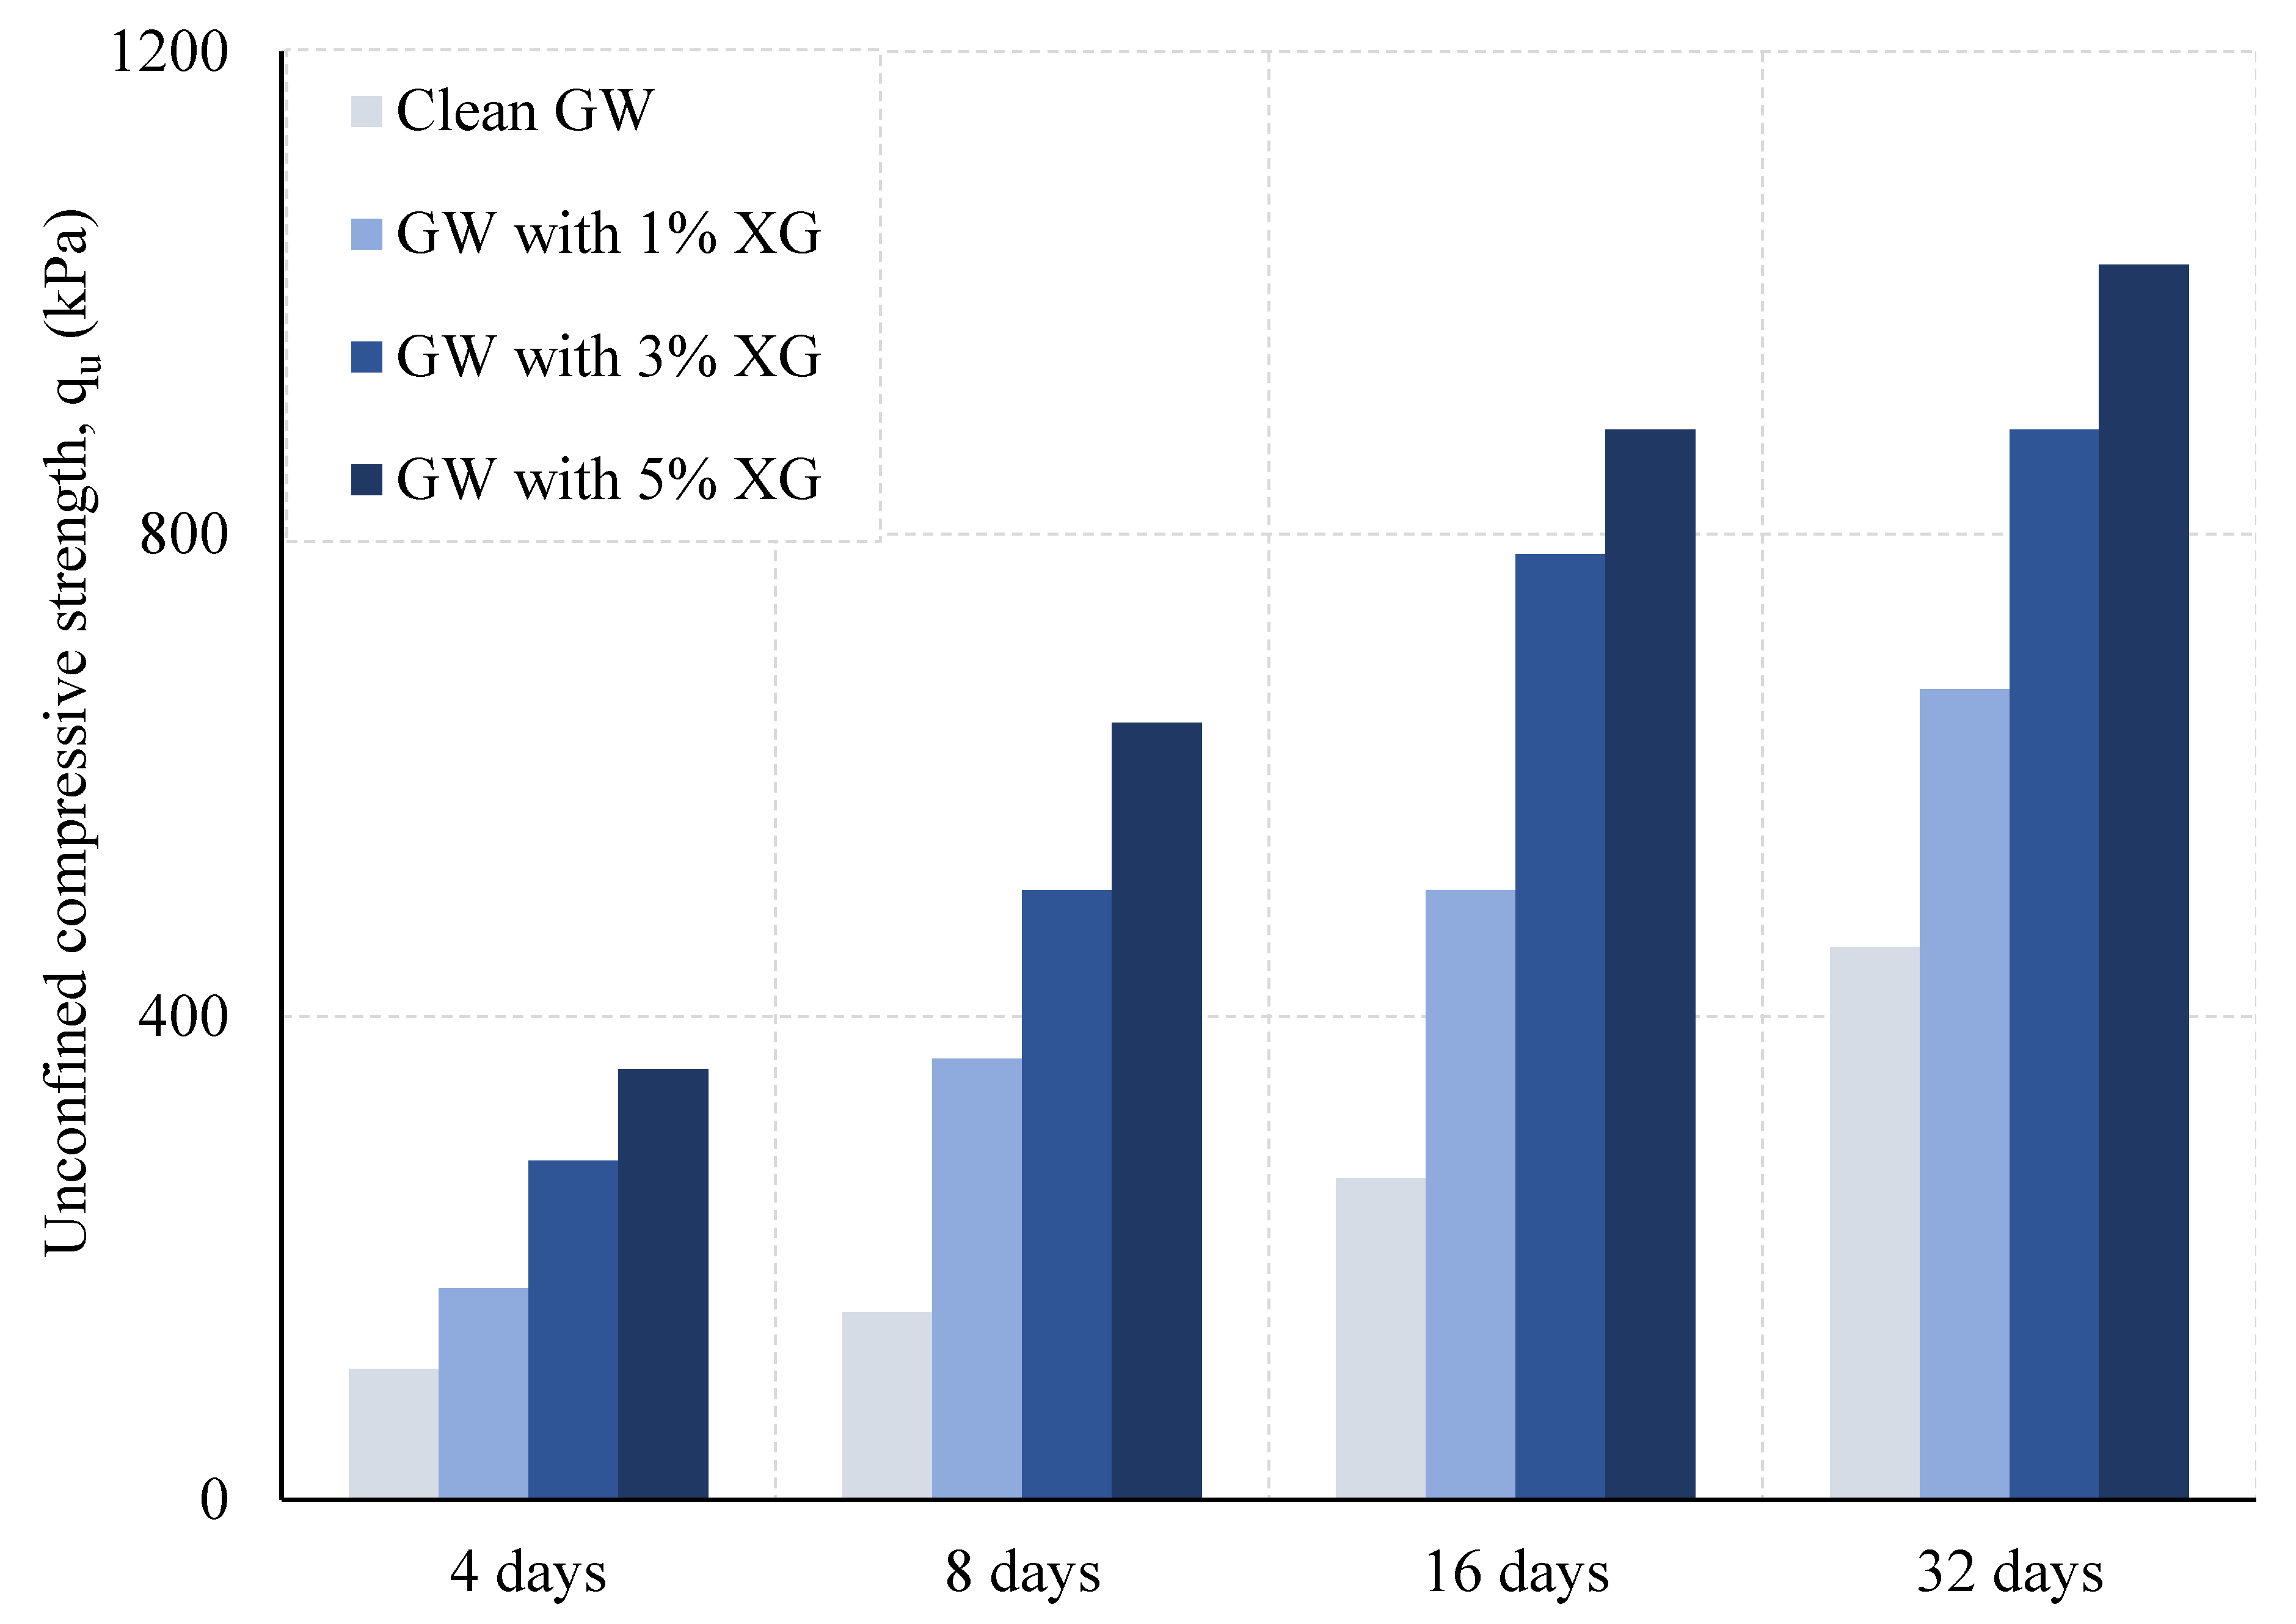
Figure 5 presents all the testing results of the UCS experiments illustrated in a bar chart. As can be seen clearly, the results were found to be strongly affected by both the (i) XG biopolymer content and (ii) curing time period. Such effects of the biopolymer on some other soil types have also been observed [35,38].
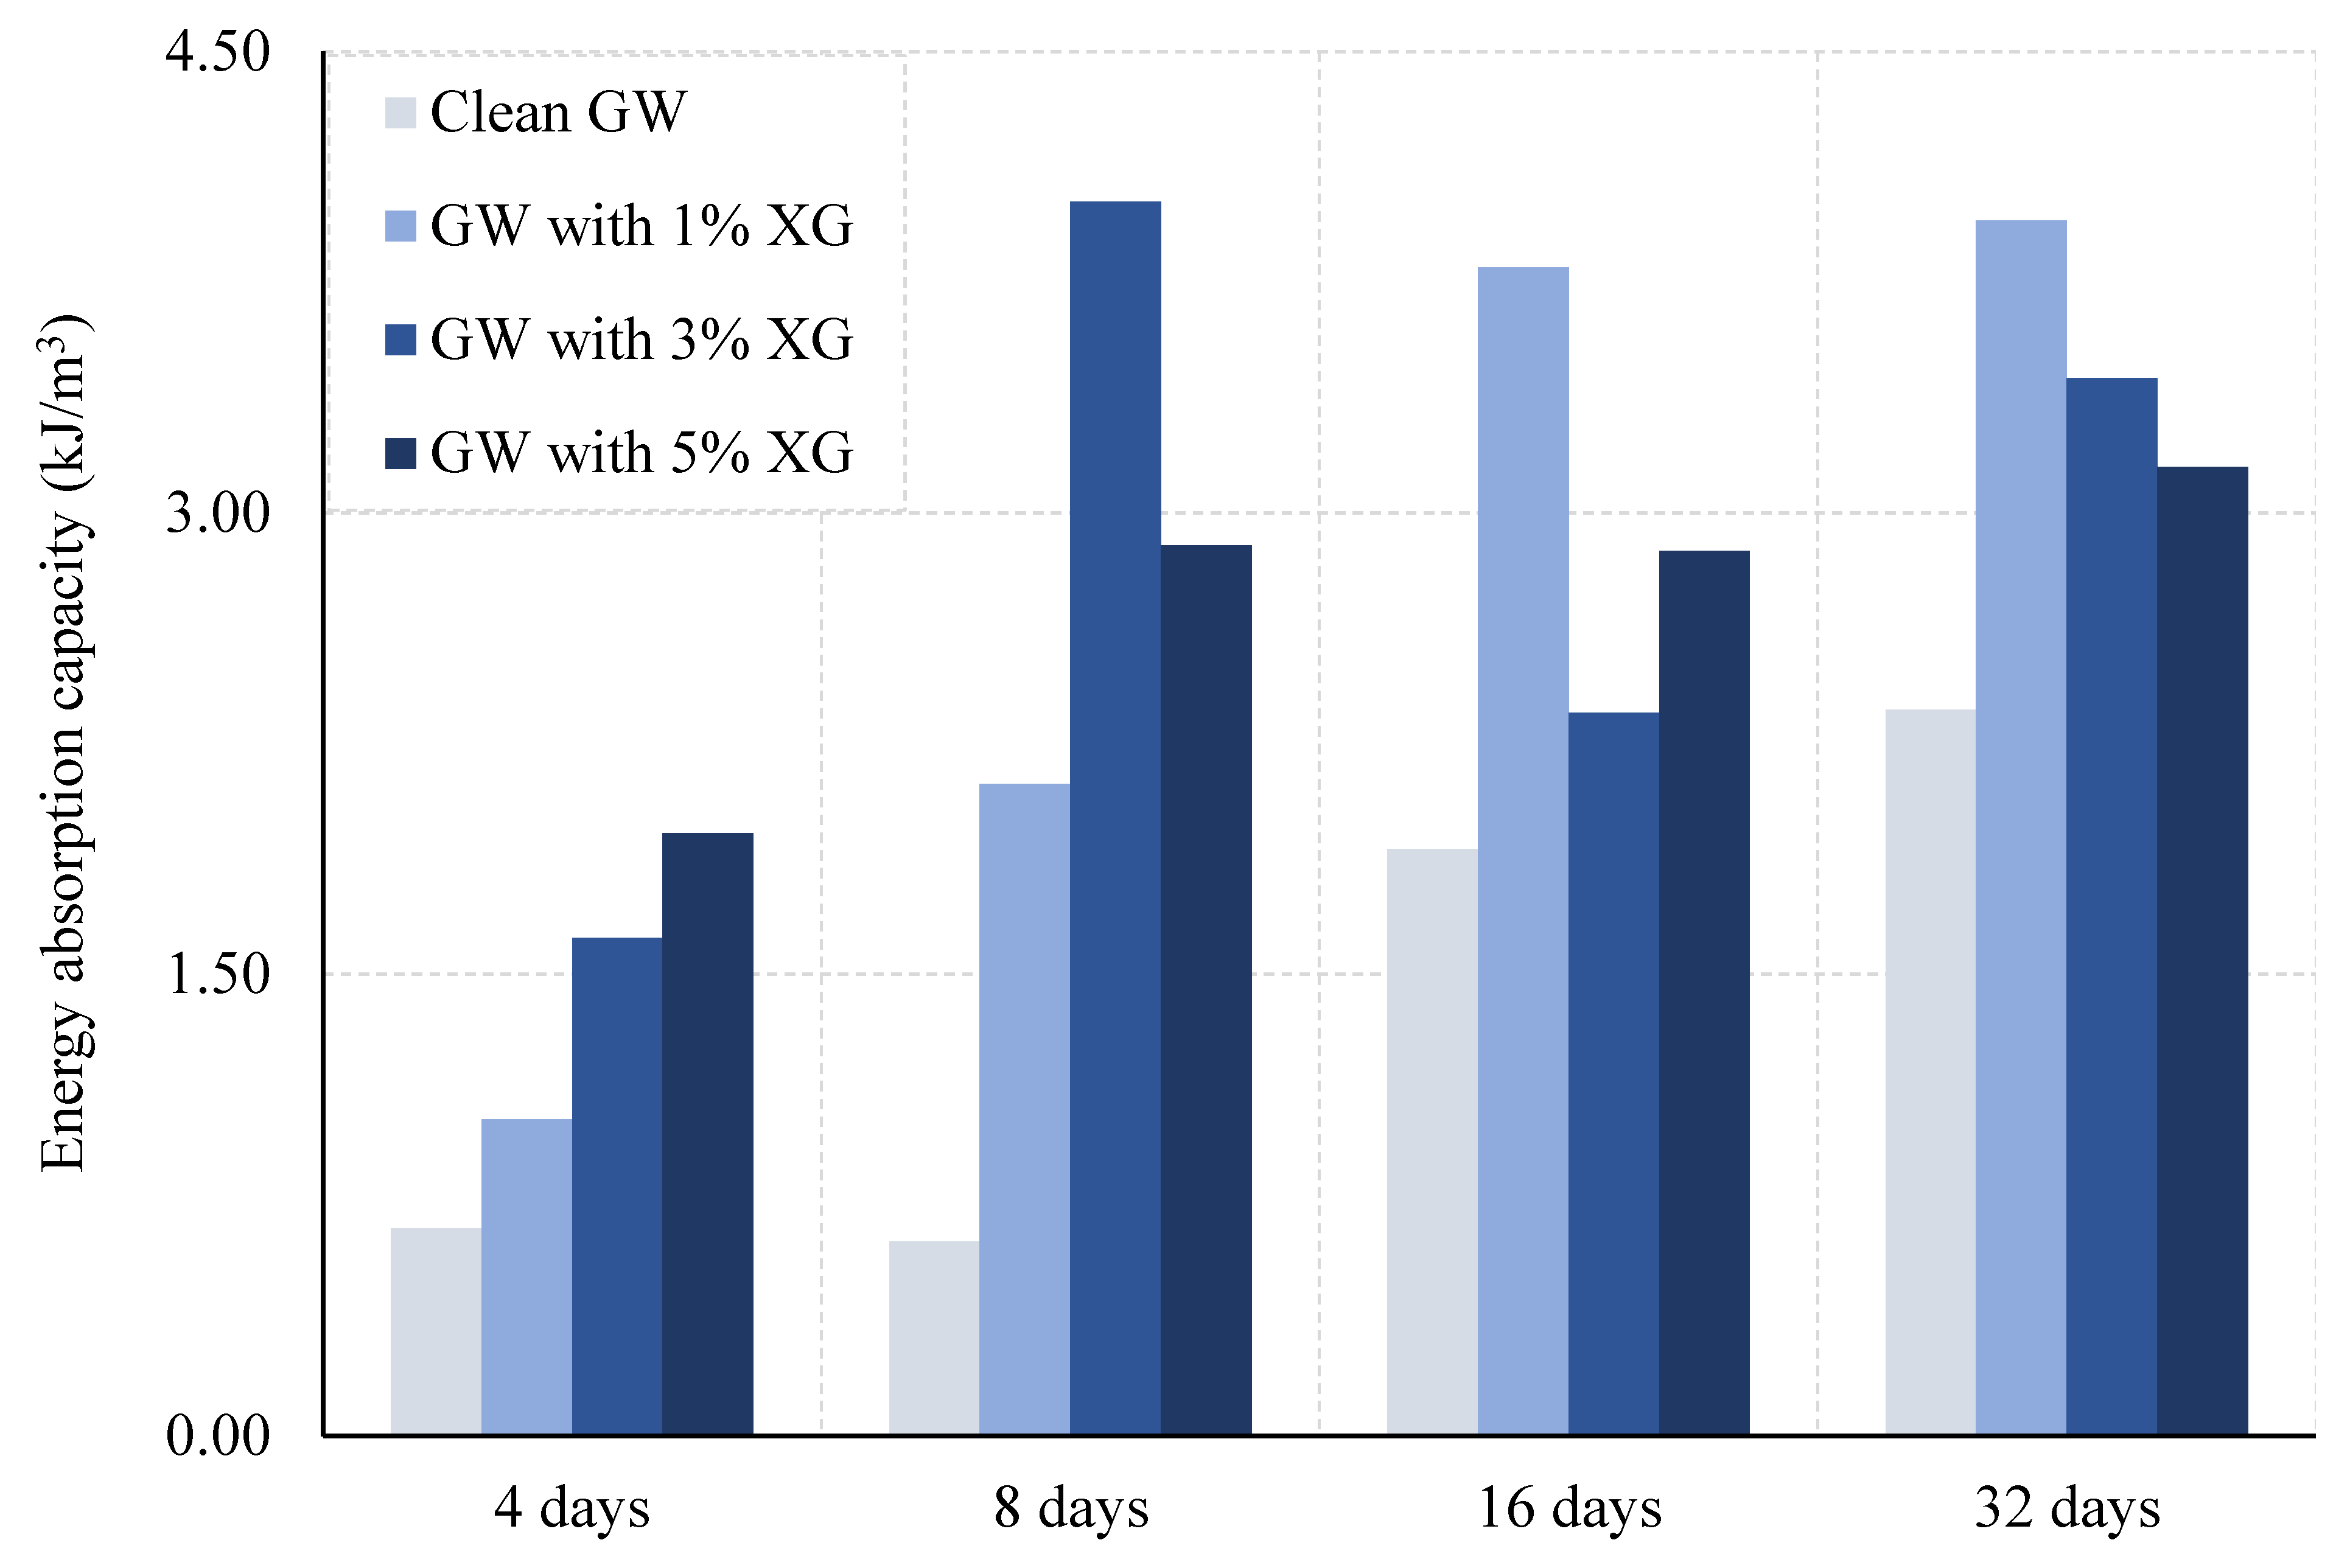
Figure 6 presents the energy absorption capacity of samples tested in a UCS machine. The energy absorption capacity, which plays a significant role in the deformation and failure of geomaterials, is important for estimating the engineering response of the samples treated with XG biopolymer. The most striking point in the plot area is that the energy absorption capacity of the clean gravel samples had the lowest value in all the curing periods employed during the experimental studies. It can be clearly seen that the XG biopolymer addition in the gravel samples substantially increased the energy absorption capacity of the mixtures, although at varying rates depending on the curing period employed and amount of XG added. A similar increase in the energy absorption capacity resulting in a much higher ductility for the samples has been reported by some researchers [5,9,13,39].
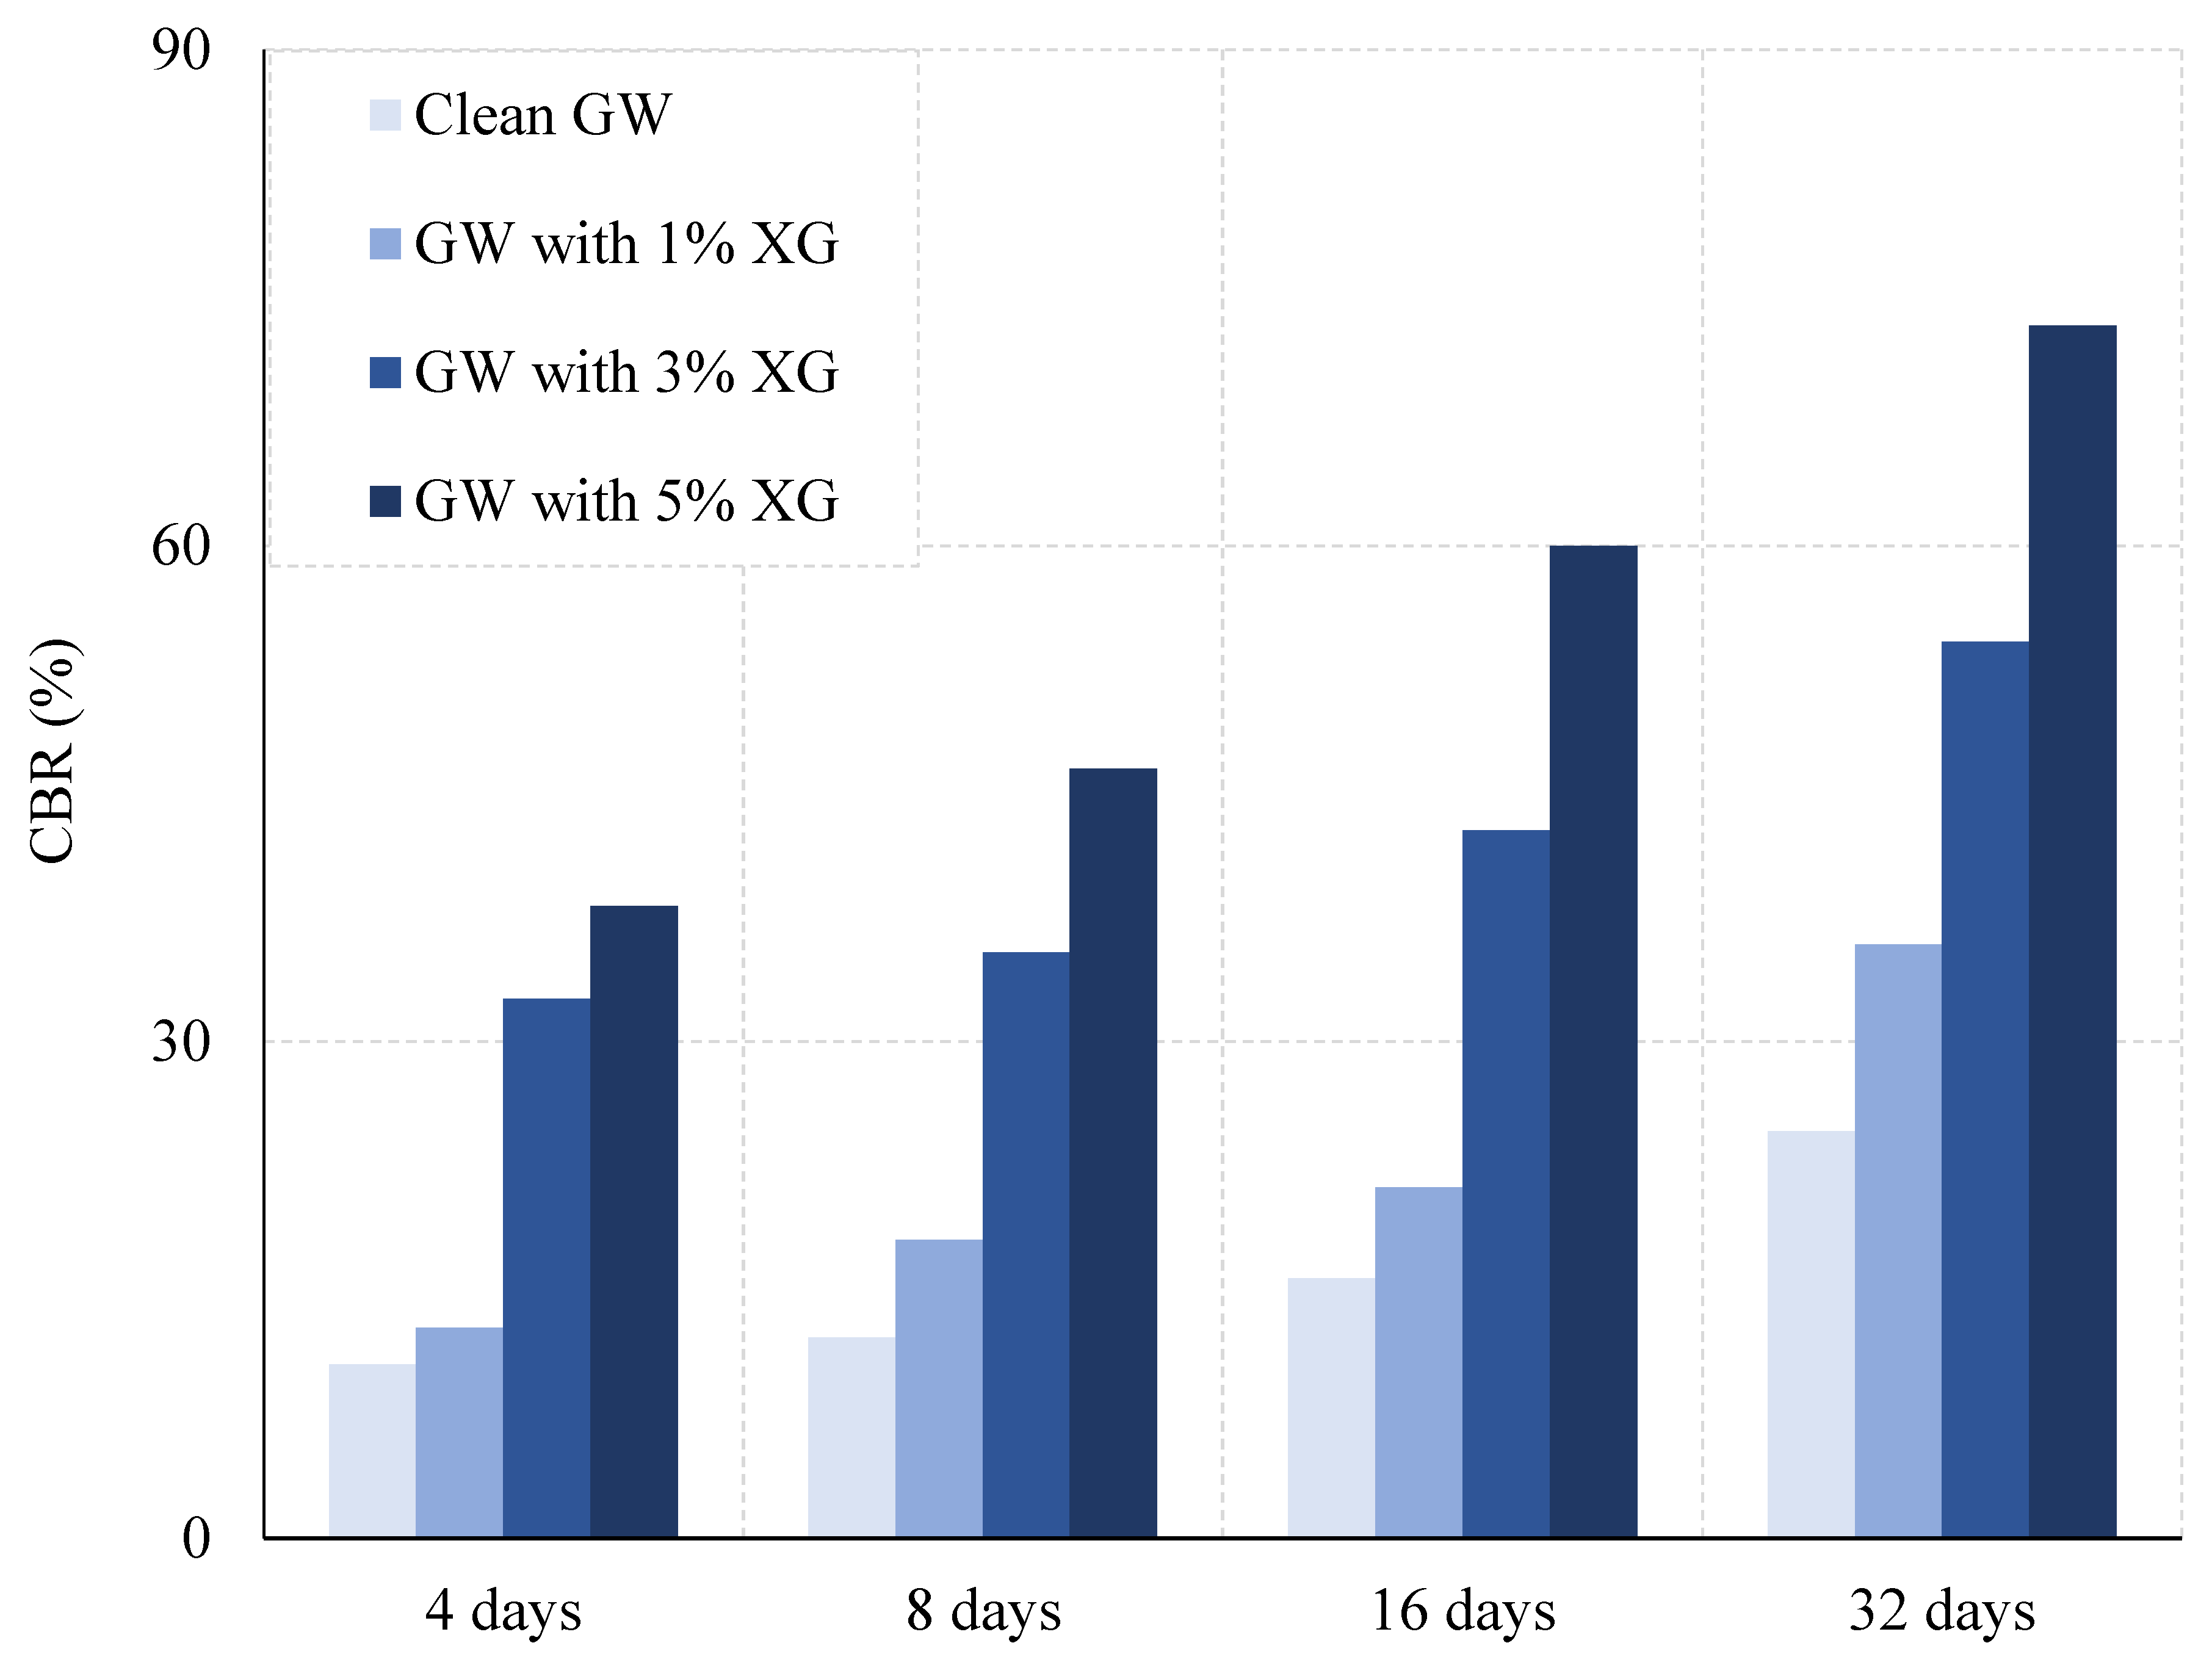
Figure 7 presents the CBR performance of samples with various XG contents tested at the end of different curing periods. The CBR values, typically reported as soil resistance at either 2.54 mm or 5.08 mm penetration depth, are used as a measure of strength and bearing capacity of soils to be used in subgrade and subbase pavements. It can be seen from the Figure 7 that XG addition in gravel samples exhibits a significant enhancement in CBR performance. It has been found that both the curing period and the XG ratio had a considerable effect on the CBR testing results. For example, the CBR value for the gravel sample tested at the end of a 4-daycuringtime was seen to increase from about 10% to 38% by 5% XG biopolymer addition. Similar to the analysis of the UCS testing results, such significant increases in the CBR values of the samples examined are thought to be due to the biopolymer bridges between the soil grains. Significant increases in the results of the experiments reported by Fatehi et al. [8] support the findings in the present study.
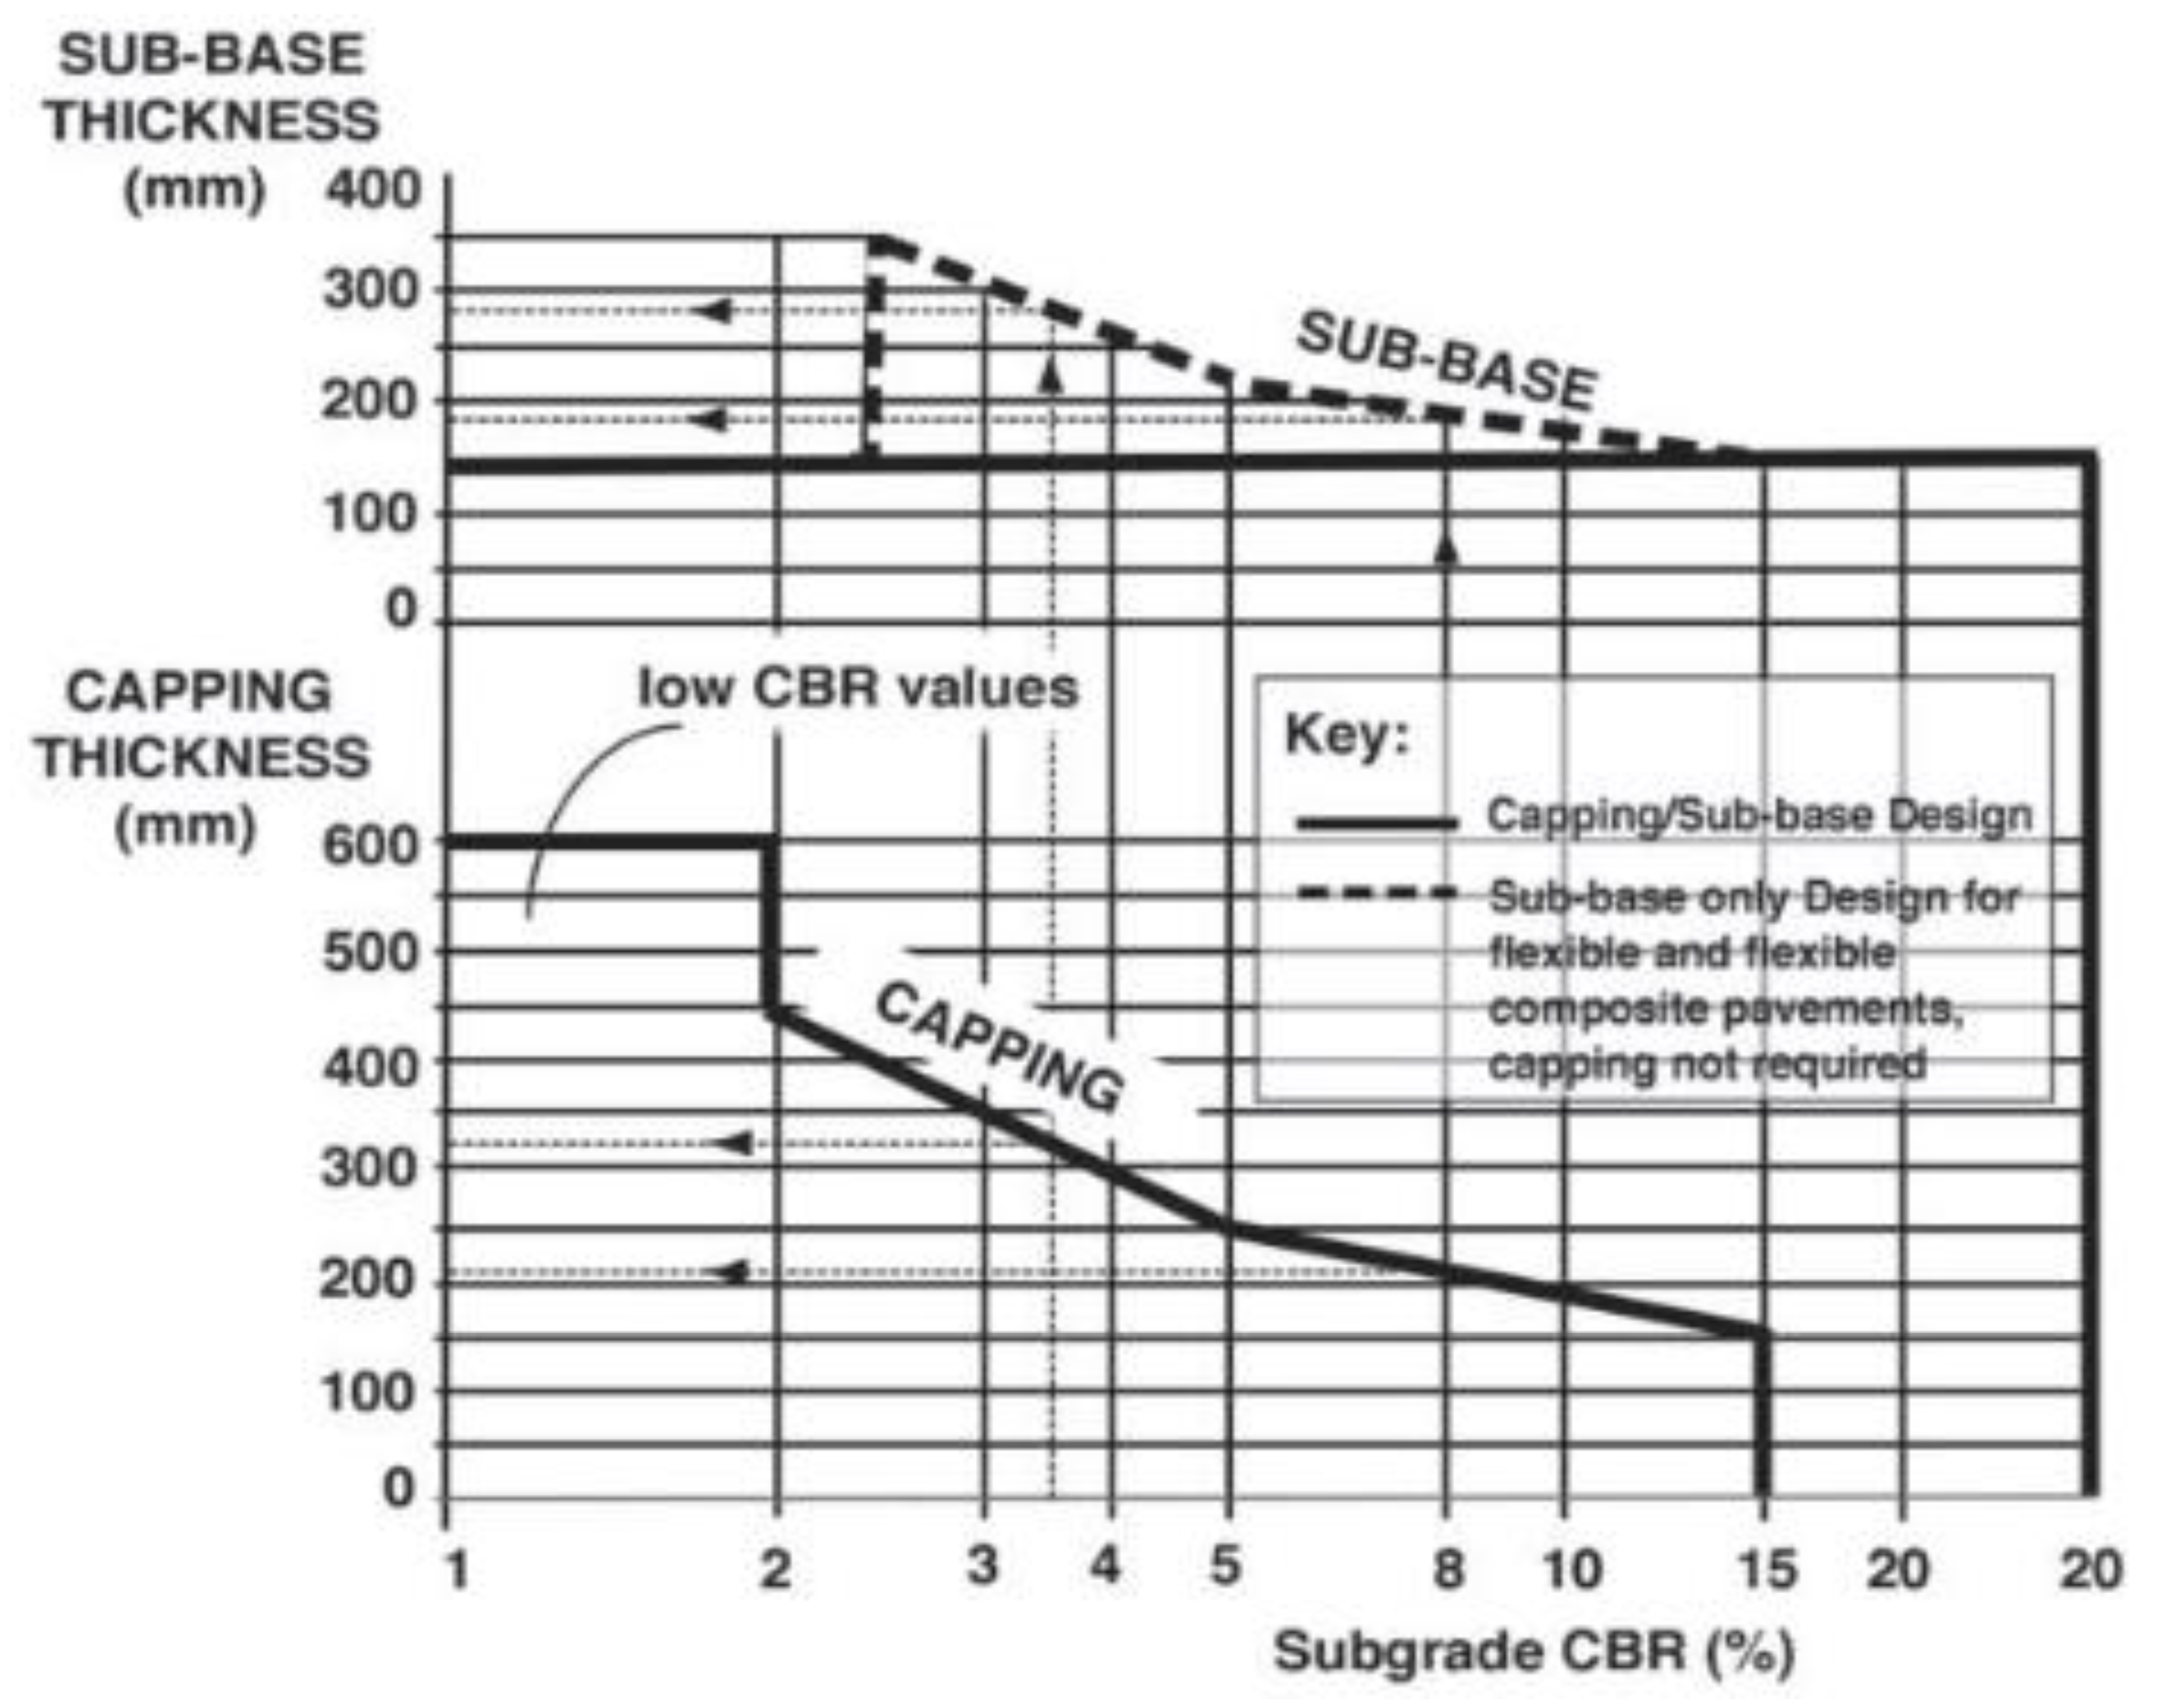
Road subgrade pavements may be designed in a coordinated way by using both the CBR testing results and the HD 26/06 [40] presented in Figure 8. Based on the results obtained, Table 2 suggests two different pavement design alternatives. It was observed that the XG content in the samples tested after the 4- and 8-daycuringtimes had a partial effect on the design thickness, while for those tested after the 16- and 32-day curing times, it did not affect the design thickness.
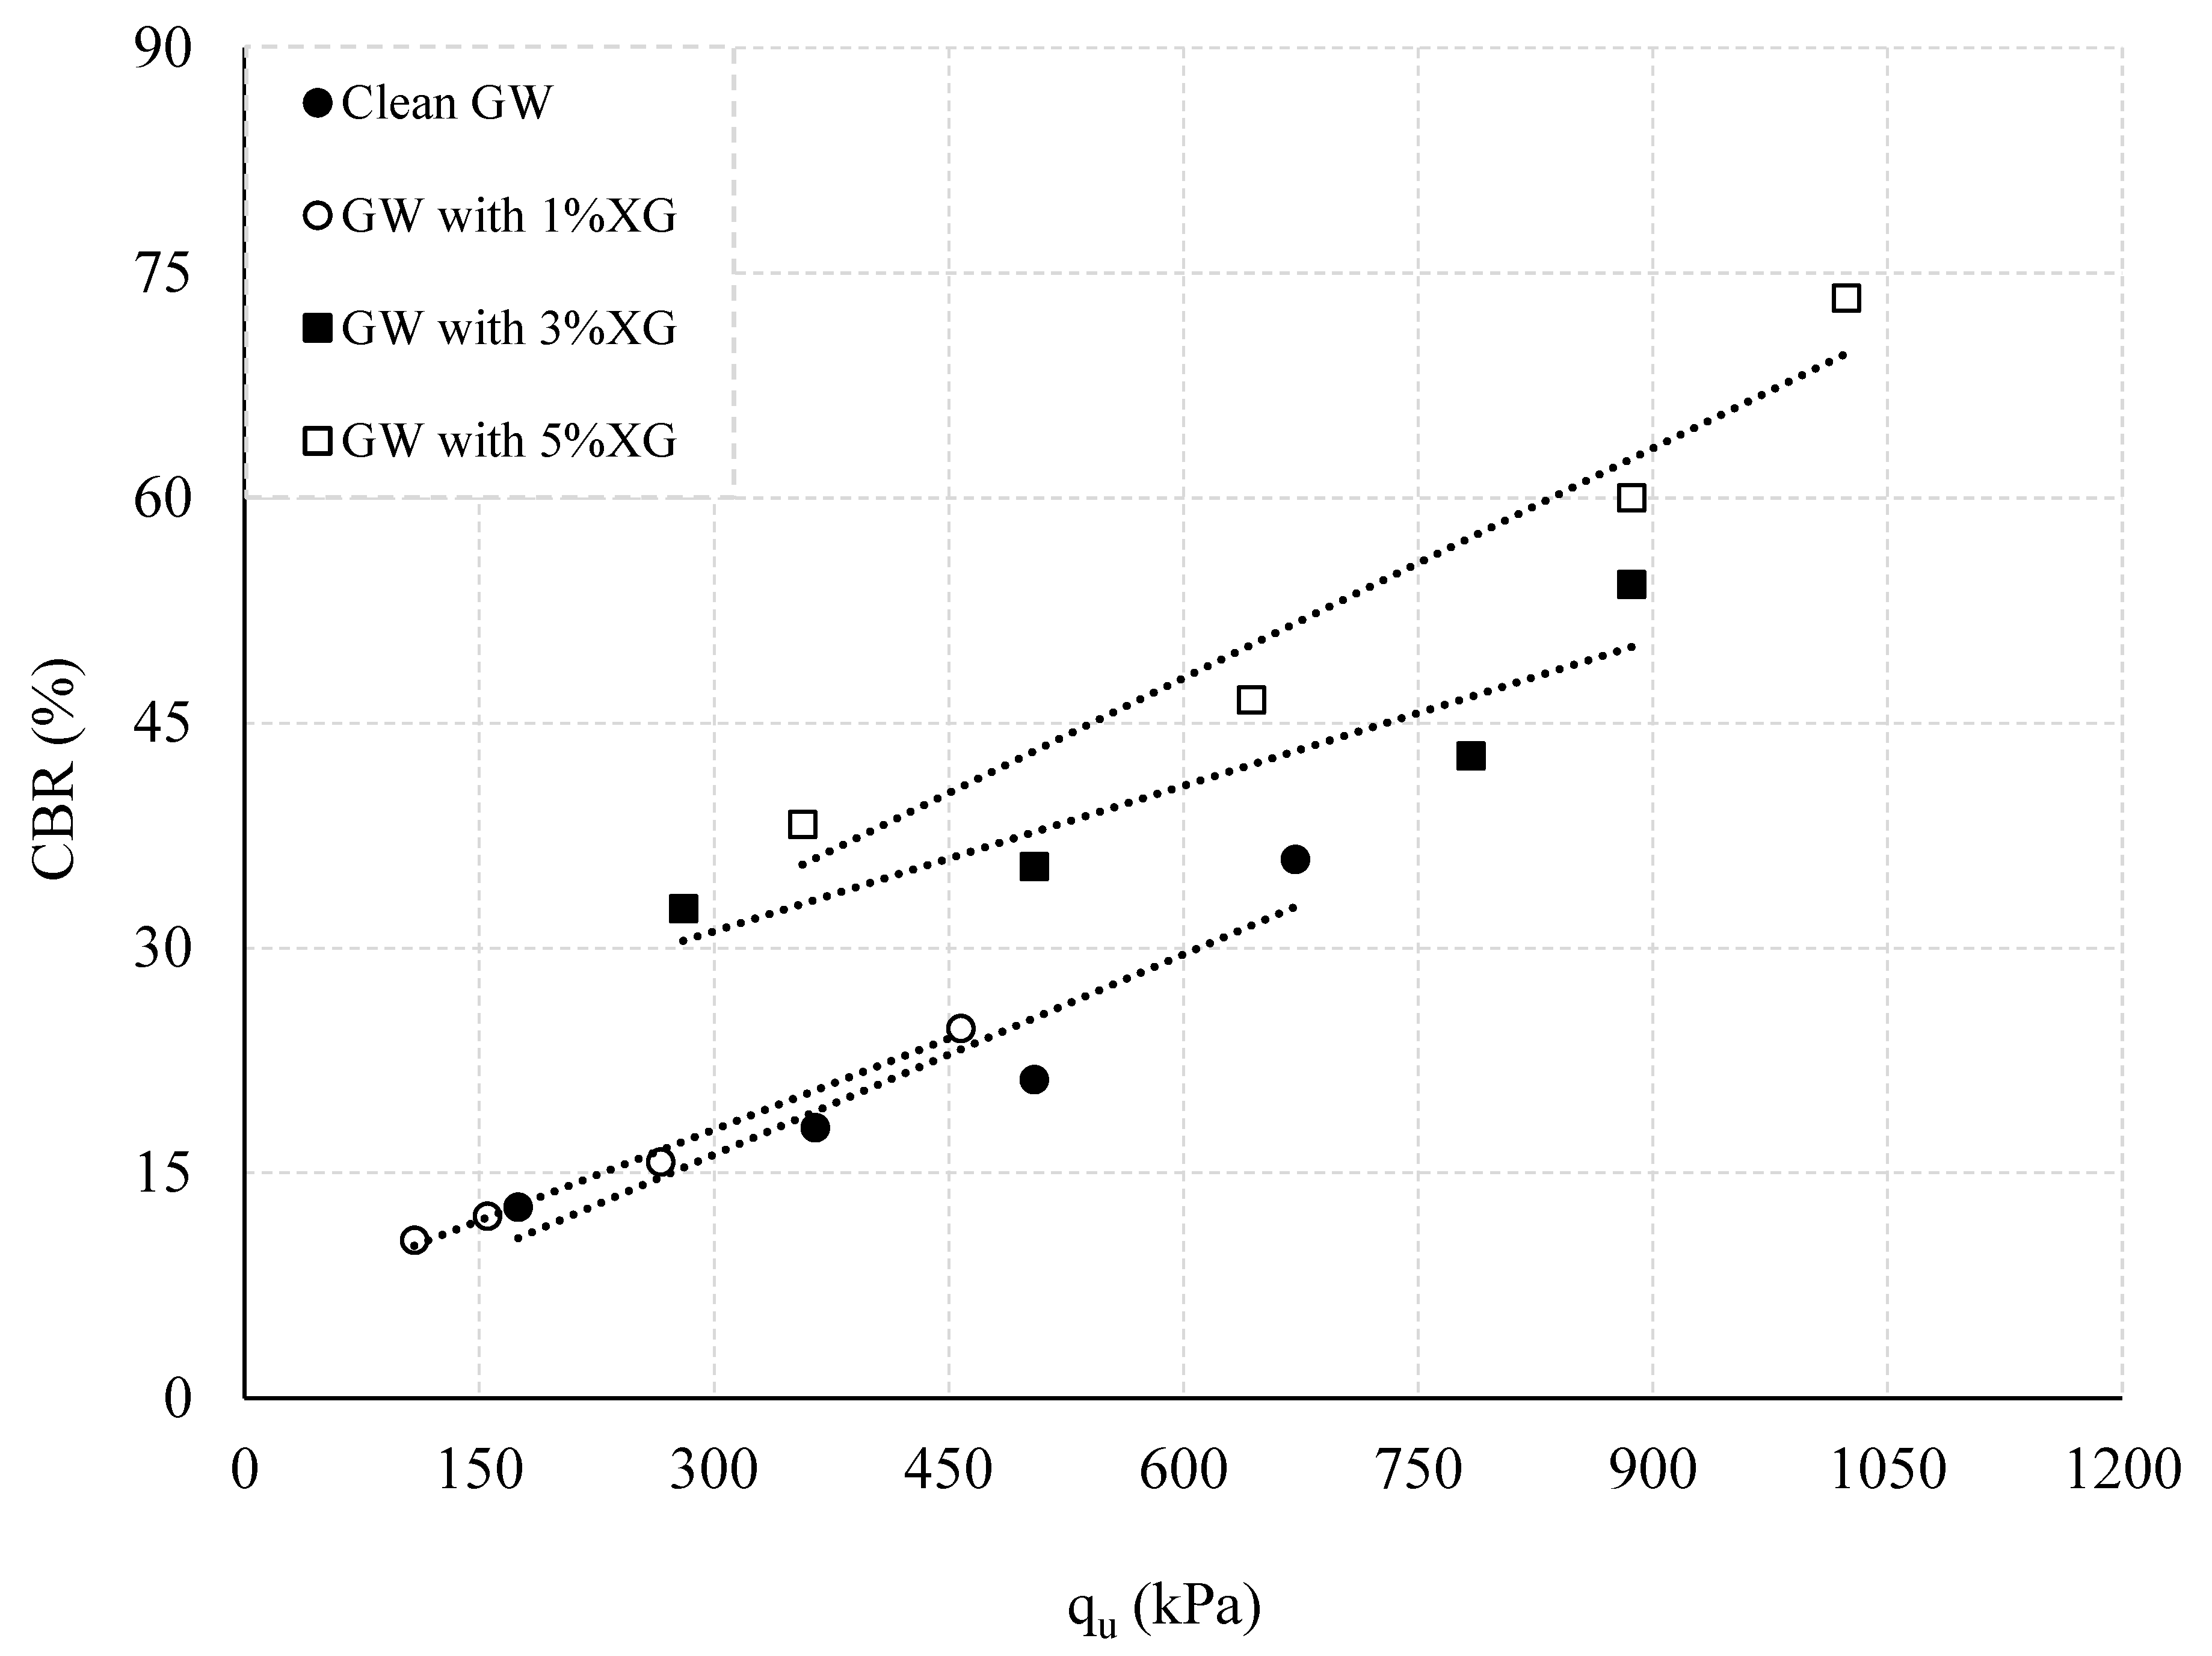
Despite the fact that the CBR test provides excellent information for designing road pavement subgrades, the test has some disadvantages including the large amount of soil required to test in the laboratory, and the fact that it istime-consuming to carry out. On the other hand, UCS testing is relatively easy to carry out, and requires a small amount of soil [41]. Thus, a series of correlations specifically valid for the tests performed here in this investigation have been developed to predict the CBR of the stabilized specimens by using the more easily and quickly reached qu values (Figure 9). The CBR values increase with the qu values and curingperiod employed. The influence of XG on the samples becomes more obvious the highertheamount of XG in the mixtures.
This investigation further presents a comparative study of an economic analysis for the use of XG polymer in the construction industry. Since the experimental results show the 3% XG addition in CG samples to be the most optimum, it has been determined that about 30 kg of XG is required to effectively improve 1 ton of CG sample to be used in a road course. Considering that a kilogram of XG is USD 1.75 in the world market, it is estimated that there will be a cost of USD 52.5 to improve 1 ton of CG sample to be used on a construction site. On the other hand, in the view of the research by Consoli et al. [42], Park [43], and Consoli et al. [44], the cost of the amount of Portland cement required for the same work in the field may be determined as about USD 1.2 [45]. Although this difference seems high at first glance, considering the negative effects of Portland cement on the natural surroundings and human health during the production and application processes, the XG is thought to provide significant advantages in the long term [46,47,48].

4. Prediction Model

The results obtained from the experimental studies have been compiled for the purpose of processing with information processing techniques. A prediction model based on the scaled conjugate algorithm (SCG) training algorithm has been improved. Moller [49] improved a model that employs conjugate directions, but differs from other conjugate gradient algorithms that perform a line search in every iteration, as it does not execute a line search in each iteration. The most important factor in choosing this training algorithm was that it exhibits the highest prediction success with the data set and the developed architecture. Vinodhkumar et al. [50] used fly ash to subgrade the stabilization of SCG used in many geotechnical estimation problems. For the purpose of liquefaction evaluation [51], in the analysis of soft soil settlement [52], and for the prediction of lateral stress of cohesionless soils [53] SCG-based prediction models were developed. Again, in different problem types and application examples of geotechnology, estimation models with different training algorithms displayed successful results [54,55,56,57].
It is preferable that the generated data set is large in order to train the prediction models in the most appropriate way using this training algorithm. In this direction, the Monte Carlo stochastic simulation type was implemented to expand the data set. The Monte Carlo simulation is a class of numerical computation algorithms that are widely used in many fields and are used to obtain a number of numerical results with a large number of repeated random samplings. It is very useful in estimating the results of physical processes involving stochastic events. It has become a frequently used data generation instrument in geotechnical engineering and in the elimination of uncertainty in soil features [58], in seismic field response analysis [59,60], in overcoming spatial variability in soil deposits, in the analysis of slope stability, in reliability analysis of geotechnical structures [61], and in bearing capacity analysis of shallow foundations [62].
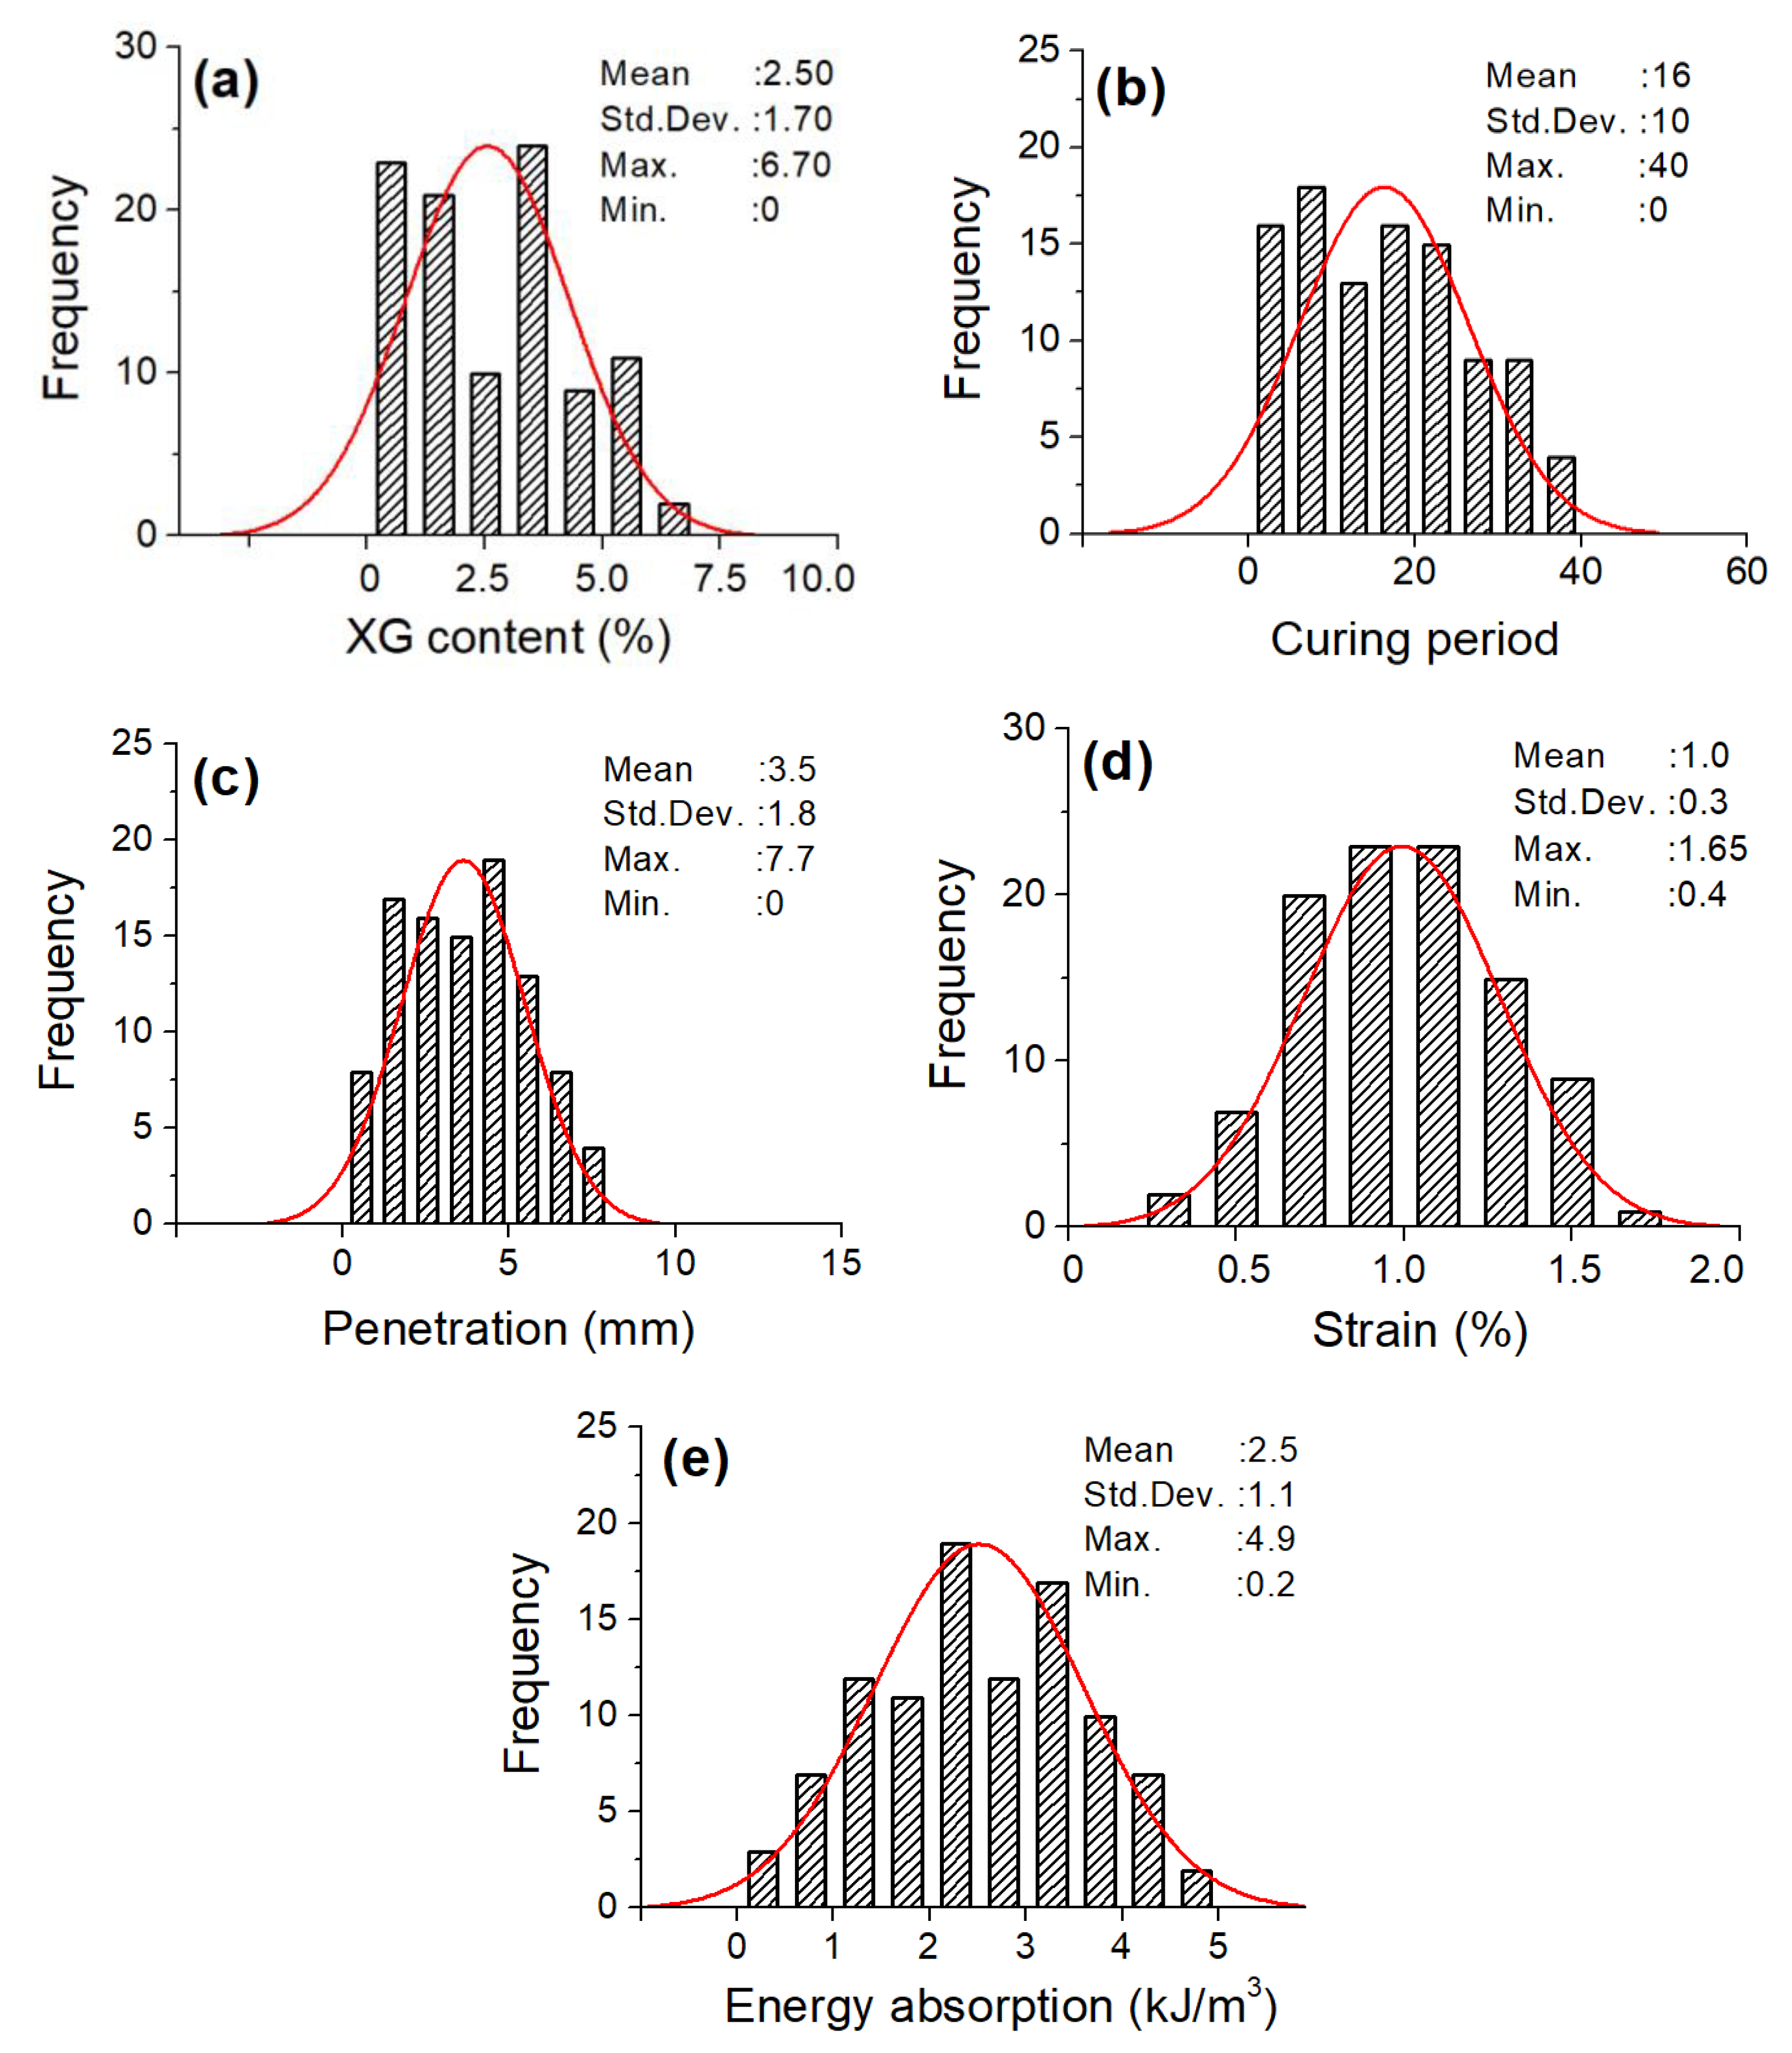
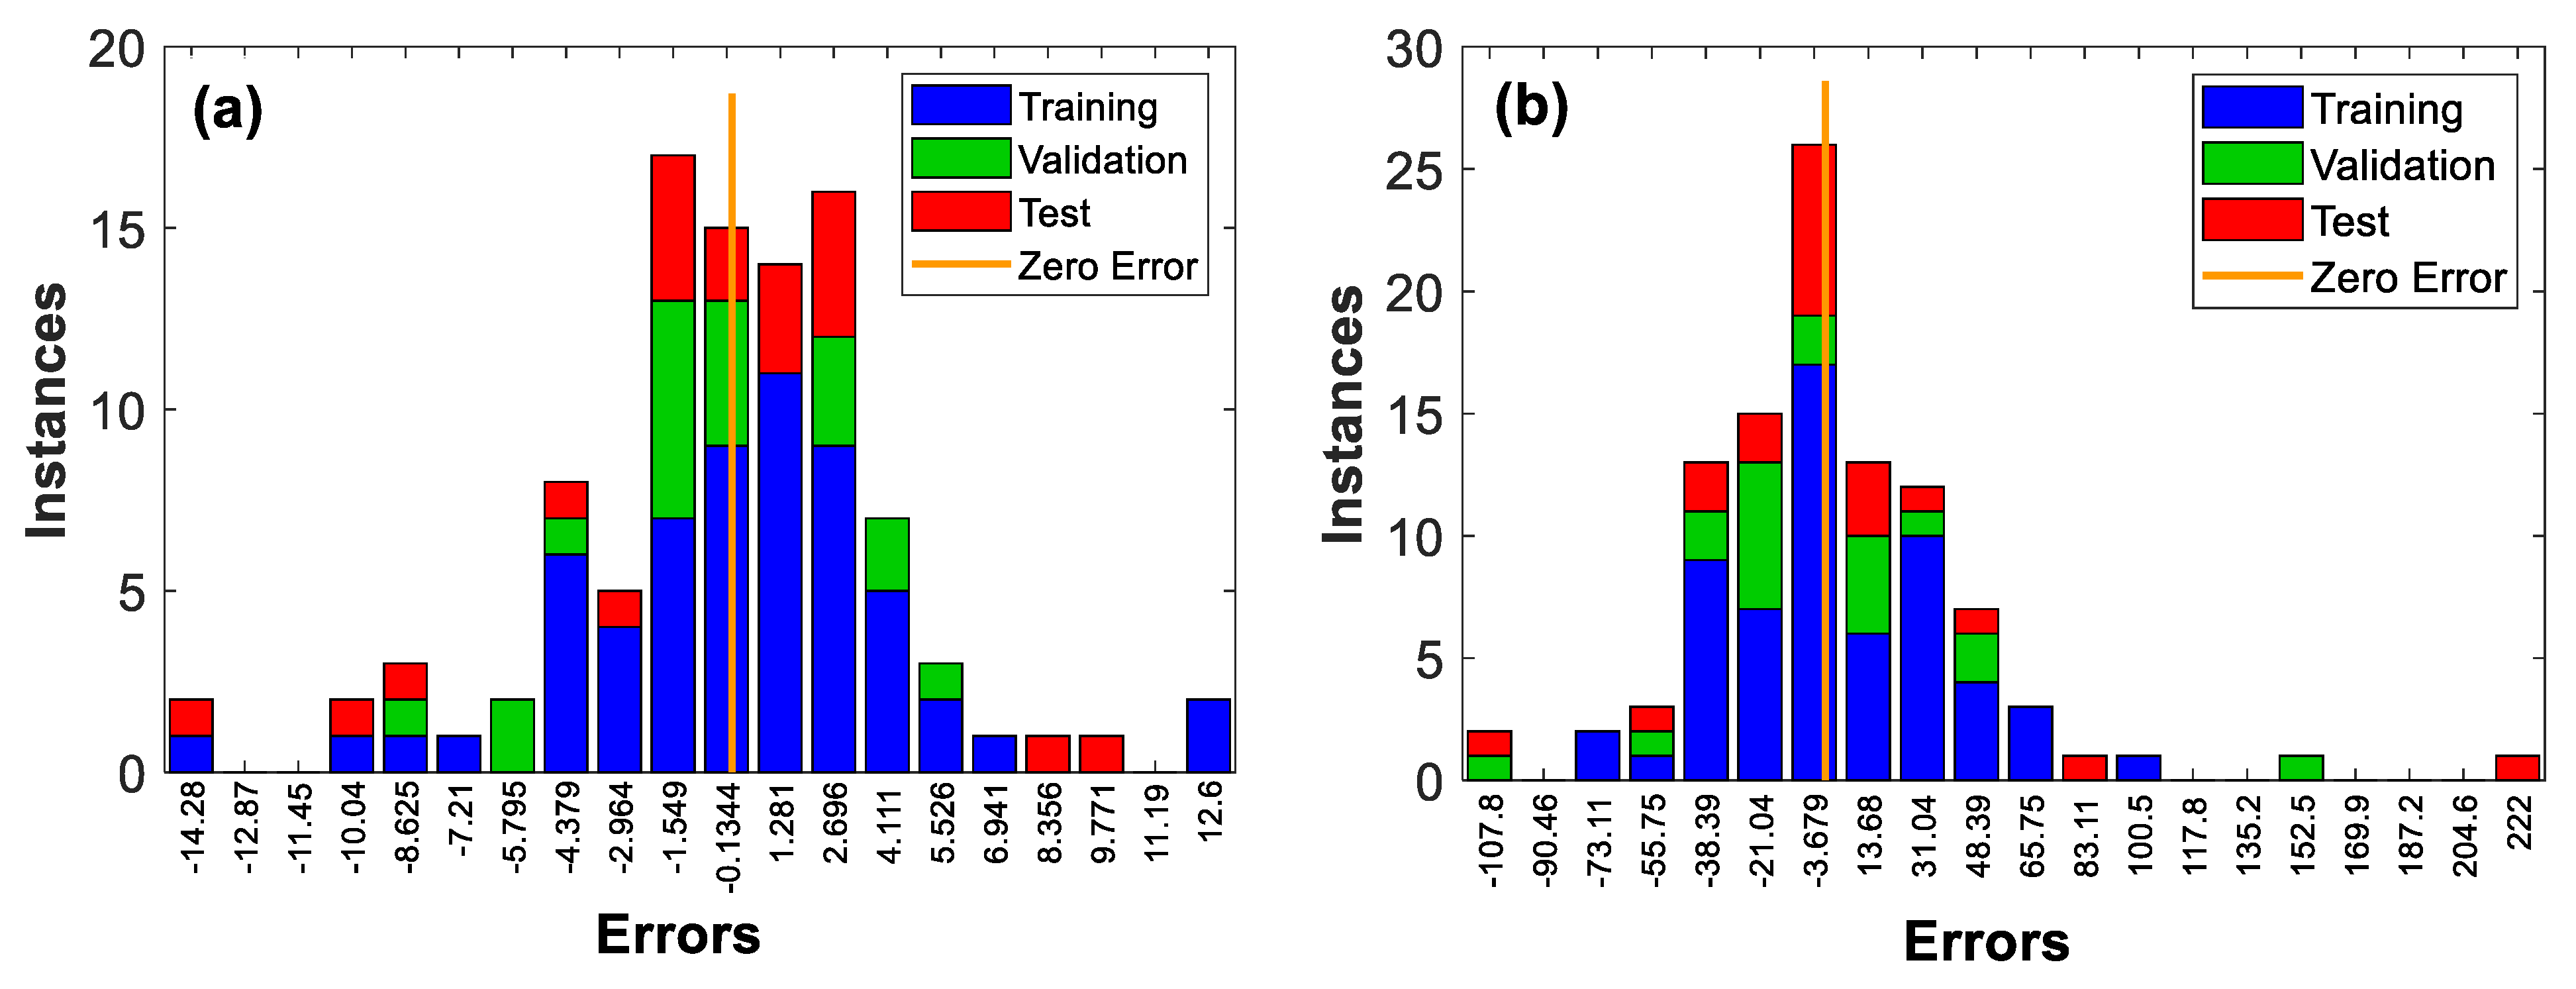
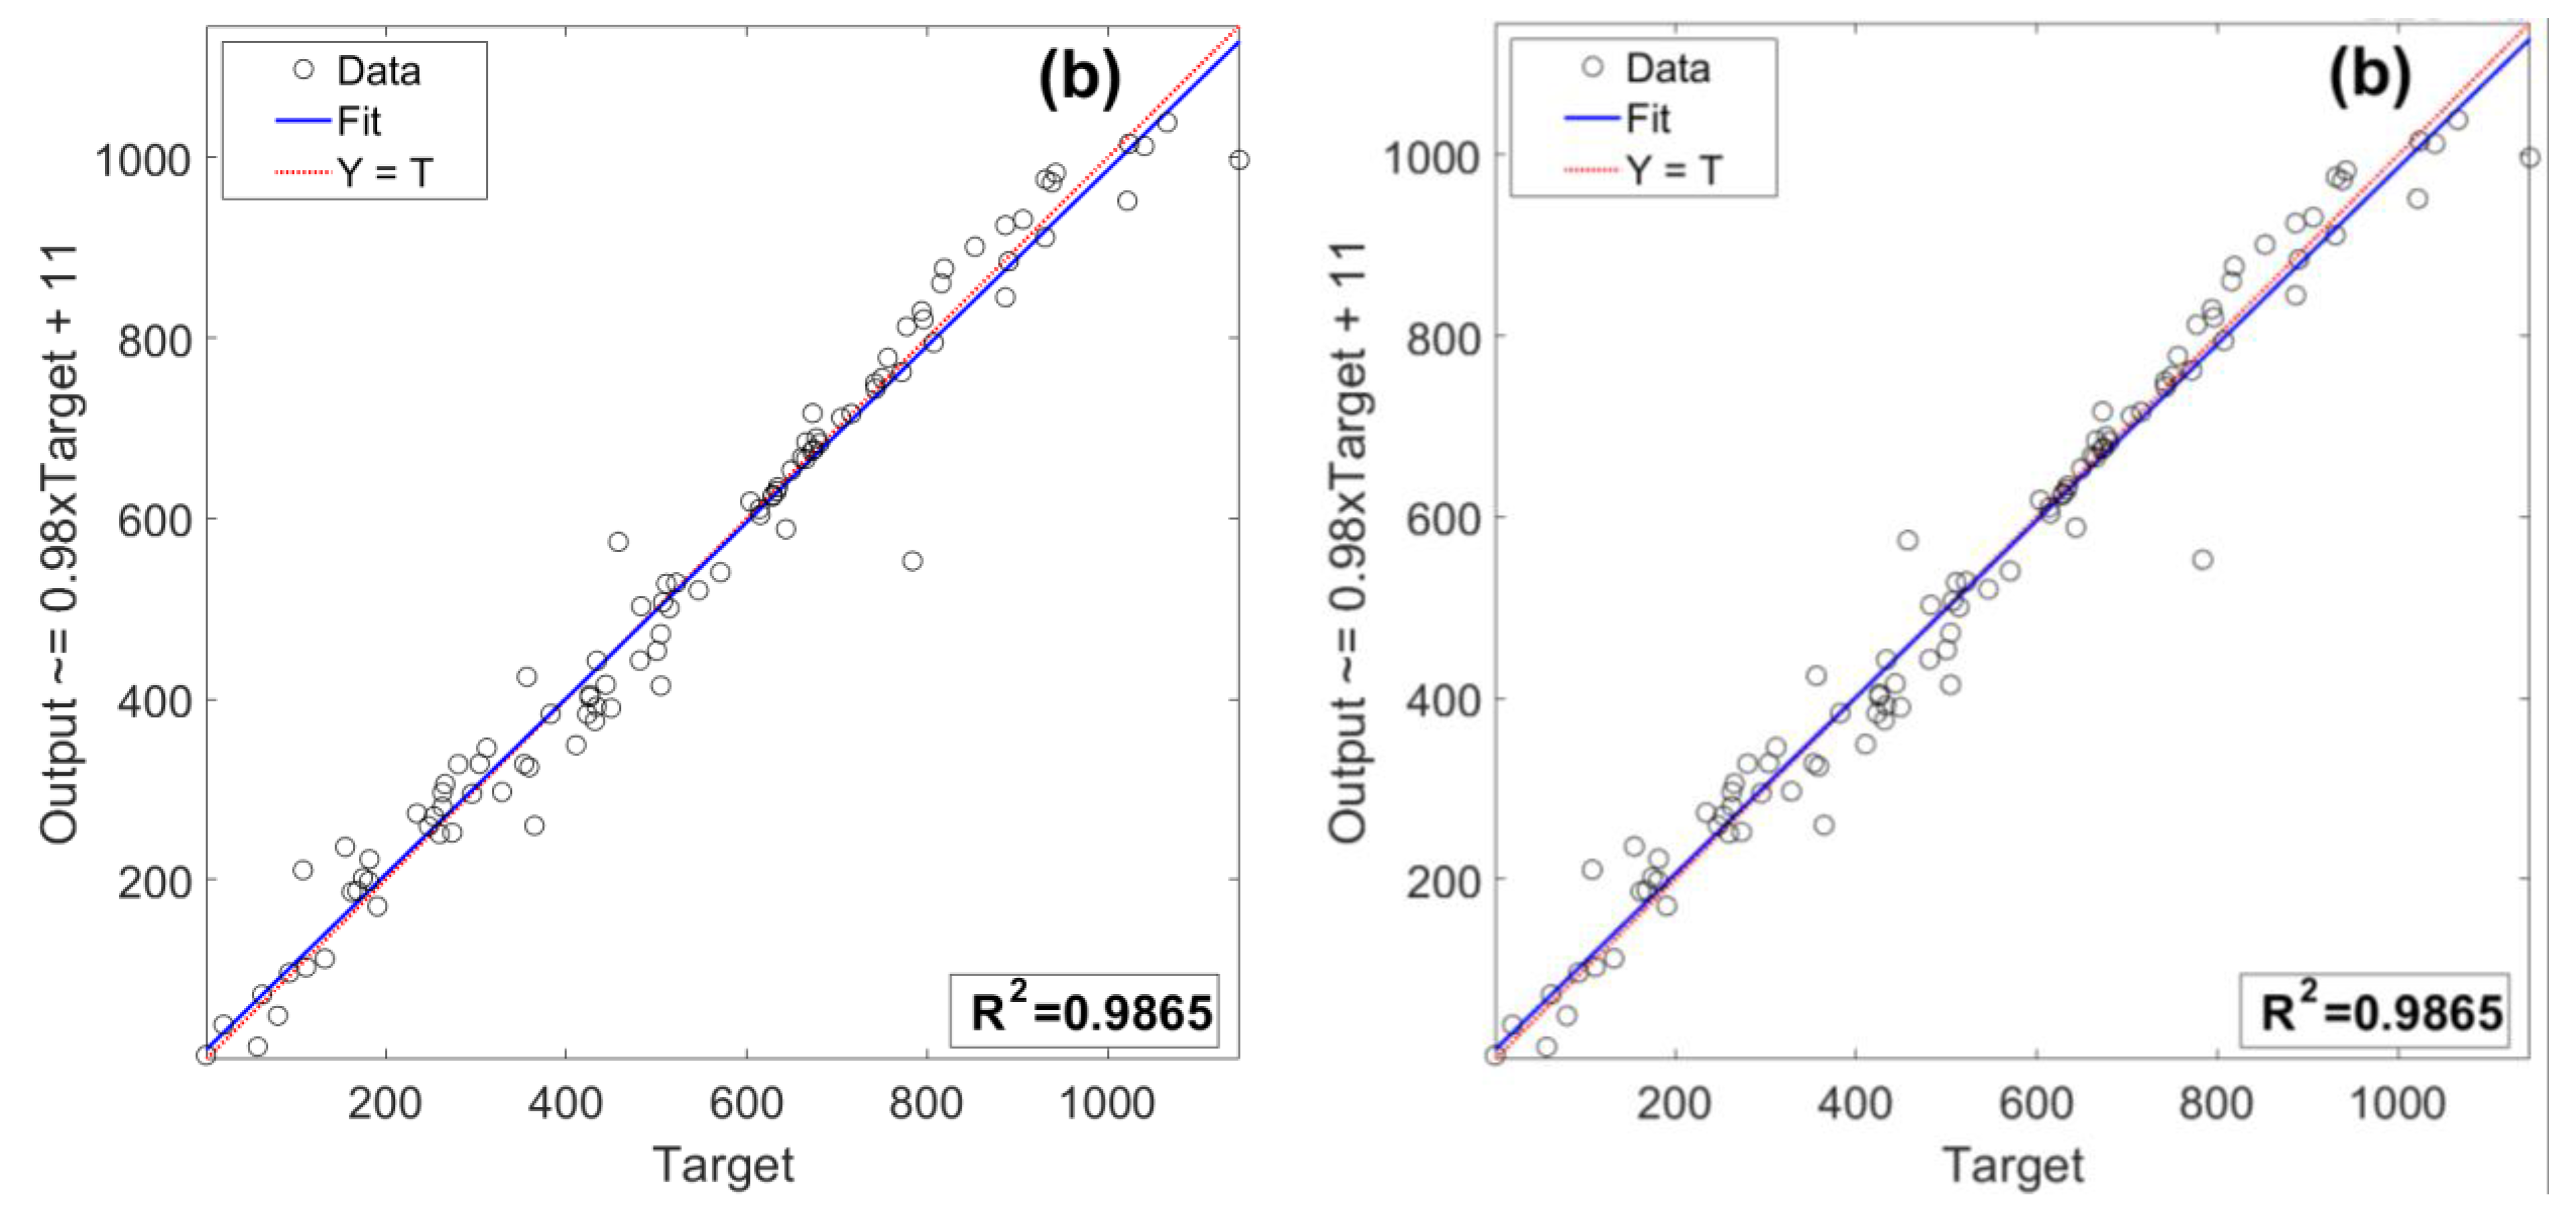
The amount of data in the data set was increased to 100 with the Monte Carlo simulation. At this stage, statistical details such as the standard deviation, min., max., and mean values of the original experimental data were taken into account inherently by the simulation. The frequency distribution of the parameters in the expanding data set is given in Figure 10. The developed prediction model is randomly divided into sections for training, validation, and testing stages as 60%, 20%, and 20%. In the input layer, the XG content, curing period, strain measured in UCS tests, penetration in CBR tests, and energy absorption were determined as input parameters. The hidden layer was designed as five neurons and the output layer was designed as CBR and qu. The developed model was a feed-forward model organized in layers that allows one-way information flow. The error was distributed backwards in this model. With back propagation, it was possible to update each of the weights in the network so that the actual output was closer to the target output. Two different models with the same architectural features were developed for each of the output parameters. The flowchart summarizing the generation of the data set and the development of the estimation model is given in Figure 11. A predictive model comprising three layers, namely, an input layer, a hidden layer, and an output layer, was developed. The architecture of the developed predictive model is shown in Figure 12. In the training of the developed model, the SCG training algorithm, which shows fast and high prediction success, was used. The degree of effectiveness and achievement of the developed prediction models was assessed in terms of the mean squared error (MSE) and R2. In terms of the MSE value, which represents the contrast between the anticipated and factual values, the best validation performance was achieved for both parameters at the 9th and 34th epoch cycles, respectively (Figure 13). The error distribution frequencies demonstrated that the models developed for both parameters clustered at a very low level of error values of a significant number of predictions (Figure 14). The regression curves of the prediction model for the CBR showed a significant level of success. The high success of the prediction model for CBR was achieved with the regression coefficient R2 = 0.9665. A similar level of high performance was obtained with the model developed for qu with the regression coefficient R2 = 0.9865 (Figure 15). Undoubtedly, the experimental results that make up the data set used, and the quality of the stochastically produced data based on these results, have a great share in the success of the developed models with such a high correlation coefficient. However, both the chosen training algorithm and the specified architecture of the network justify the adoption of soft computing techniques as part of a common methodology for estimating geotechnical parameters.

5. Conclusions

The mixtures of conventionally used aggregates (crushed rock grains) and xanthan gum (XG) biopolymer at different contents were tested by employing an extensive series of unconfined compressive strength (UCS) and California bearing ratio (CBR) tests. The gravel samples with 0%, 1%, 2%, and 5% XG biopolymer additions by dry weight were tested at the end of 4-, 8-, 16-, and 32-daycuringtimeperiods. Moreover, prediction models were also developed from an estimation of the CBR and UCS testing results. The conclusions reported here point out five new facets as follows:
  • The unconfined compressive strength (qu) value of clean gravel samples was found to be increased significantly with both XG biopolymer addition and curing time period employed.
  • The XG biopolymer addition in the CG samples substantially increased the energy absorption capacity of the mixtures at varying rates (from 15% to 400%) depending on the curing period employed and amount of XG biopolymer added.
  • The XG biopolymer addition in gravel samples pointed to a substantial increase in the CBR performance. Both the curing period and amount of the XG biopolymer were found to be significantly effective on the CBR testing results.
  • The XG content in the gravel samples tested after the 4- and 8-daycuringtimes had a partial effect on the design thickness while, for those tested after the 16- and 32-daycuringtimes, it did not affect the design thickness.
  • The SCG algorithm-based models, developed to predict the change in the UCS and CBR test results of gravel with the addition of XG, exhibited a high accuracy prediction success with the regression coefficients of R2 = 0.967 and R2 = 0.987, respectively. These results demonstrate that models based on sets with high data quality can show significant success in estimating the geotechnical properties of soils.
This points to the fact that the XG biopolymer could be used as an alternative binding material in road subgrade pavement construction and provide significant advantages.

Author Contributions

Conceptualization, A.F.C. and N.A.; methodology, N.A.; software, O.Y.; validation, N.A.; formal analysis, A.F.C.; investigation, N.A.; resources, N.A.; data curation, N.A.; writing—original draft preparation, S.D.; writing—review and editing, A.F.C.; visualization, S.D.; supervision, A.F.C.; funding acquisition, N.A. All authors have read and agreed to the published version of the manuscript.

Funding

This research received no external funding.

Institutional Review Board Statement

Not applicable.

Informed Consent Statement

Not applicable.

Data Availability Statement

Not applicable.

Conflicts of Interest

The authors declare no conflict of interest.

References

  1. Worrell, E.; Price, L.; Martin, N.; Hendriks, C.; Media, L.O. Carbon dioxide emissions from the global cement industry. Annu. Rev. Energy Environ. 2001, 26, 303–329. [Google Scholar] [CrossRef]
  2. De Jong, J.T.; Mortensen, B.M.; Martinez, B.C.; Nelson, D.C. Bio-mediated soil improvement. Ecol. Eng. 2010, 36, 197–210. [Google Scholar] [CrossRef]
  3. Chang, I.; Minhyeong, L.; Tran, A.T.P.; Lee, S.; Kwon, Y.M.; Im, J.; Cho, G.Y. Review on biopolymer-based soil treatment (BPST) technology in geotechnical engineering practices. Transp. Geotech. 2020, 24, 100385. [Google Scholar] [CrossRef]
  4. Bouazza, A.; Gates, W.P.; Ranjith, P.G. Hydraulic conductivity of biopolymer-treated silty sand. Géotechnique 2009, 59, 71–72. [Google Scholar] [CrossRef]
  5. Chang, I.; Im, J.; Prasidhi, A.K.; Cho, G.C. Effects of Xanthan gum biopolymer on soil strengthening. Constr. Build. Mater. 2015, 74, 65–72. [Google Scholar] [CrossRef]
  6. Chen, R.; Ramey, D.; Weiland, E.; Lee, I.; Zhang, L. Experimental investigation on biopolymer strengthening of mine tailings. J. Geotech. Geoenvironmental Eng. 2016, 142, 06016017. [Google Scholar] [CrossRef]
  7. Cabalar, A.F.; Wiszniewski, M.; Skutnik, Z. Effects of xanthan gum biopolymer on the permeability, odometer, unconfined compressive and triaxial shear behavior of a sand. Soil Mech. Found. Eng. 2017, 54, 356–361. [Google Scholar] [CrossRef]
  8. Fatehi, H.; Abtahi, S.M.; Hashemolhosseini, H.; Hejazi, S.M. A novel study on using protein-based biopolymers in soil strengthening. Constr. Build. Mater. 2018, 167, 813–821. [Google Scholar] [CrossRef]
  9. Cabalar, A.F.; Awraheem, M.H.; Khalaf, M.M. Geotechnical properties of a low-plasticity clay with biopolymer. J. Mater. Civ. Eng. 2018, 30, 04018170. [Google Scholar] [CrossRef]
  10. Cabalar, A.F.; Demir, S. Fall-cone testing of different size/shape sands treated with a biopolymer. Geomech. Eng. 2020, 22, 441–448. [Google Scholar] [CrossRef]
  11. Reddy, N.G.; Nongmaithem, R.S.; Basu, D.; Rao, B.H. Application of biopolymers for improving the strength characteristics of red mud waste. Environ. Geotech. 2020, 9, 340–359. [Google Scholar] [CrossRef]
  12. Cabalar, A.F. Ground Improvement by Bacteria and Synthetic Polymers. Master’s Thesis, University of Gaziantep, Gaziantep, Turkey, 2002. [Google Scholar]
  13. Ayeldeen, M.K.; Negm, A.M.; El Sawwaf, M.A. Evaluating the physical characteristics of biopolymer/soil mixtures. Arab. J. Geosci. 2016, 9, 371. [Google Scholar] [CrossRef]
  14. Dehghan, H.; Tabarsa, A.; Latifi, N.; Bagheri, Y. Use of xanthan and guar gums in soil strengthening. Clean Technol. Environ. Policy 2019, 21, 155–165. [Google Scholar] [CrossRef]
  15. Chang, I.; Cho, G.C. Shear strength behavior and parameters of microbial gellan gum-treated soils: From sand to clay. Acta Geotech. 2019, 14, 361–375. [Google Scholar] [CrossRef]
  16. Smitha, S.; Rangaswamy, K. Effect of Biopolymer Treatment on Pore Pressure Response and Dynamic Properties of Silty Sand. J. Mater. Civ. Eng. 2020, 32, 04020217. [Google Scholar] [CrossRef]
  17. Lee, S.; Chung, M.; Park, H.M.; Song, K.I.; Chang, I. Xanthan Gum Biopolymer as Soil-Stabilization Binder for Road Construction Using Local Soil in Sri Lanka. J. Mater. Civ. Eng. 2019, 31, 06019012. [Google Scholar] [CrossRef]
  18. ASTM D1241-15:2016; Standard Specification for Materials for Soil-Aggregate Subbase, Base, and Surface Courses. ASTM International: West Conshohocken, PA, USA, 2016.
  19. Muszynski, M.R.; Stanley, J.V. Particle shape estimates of uniform sands: Visual and automated methods comparison. J. Mater. Civil Eng. 2012, 24, 194–206. [Google Scholar] [CrossRef]
  20. Powers, M.C. A new roundness scale for sedimentary particles. J. Sediment. Petrol. 1953, 23, 117–119. [Google Scholar] [CrossRef]
  21. Youd, T.L. Factors controlling maximum and minimum densities of sands. In Evaluation of Relative Density and Its Role in Geotechnical Projects Involving Cohesionless Soils; ASTM STP523; ASTM: West Conshohocken, PA, USA, 1973; pp. 98–112. [Google Scholar]
  22. Santamarina, J.C.; Cho, G.C. Soil Behaviour: The role of particle shape. In Advances in Geotechnical Engineering: The Skempton Conference; Thomas Telford: London, UK, 2004; pp. 604–617. [Google Scholar]
  23. Garcia-Ochoa, F.; Santos, V.E.; Casas, J.A.; Gómez, E. Xanthan gum: Production, recovery, and properties. Biotechnol. Adv. 2000, 18, 549–579. [Google Scholar] [CrossRef]
  24. Rosalam, S.; England, R. Review of xanthan gum production from unmodified starches by Xanthomonas comprestris sp. Enzym. Microb. Technol. 2006, 39, 197–207. [Google Scholar] [CrossRef]
  25. ASTM D2166:2010; Standard Test Method for Unconfined Compressive Strength of Cohesive Soil. ASTM International: Philadelphia, PA, USA, 2010.
  26. ASTM D1883:2021; Standard Test Method for California Bearing Ratio of Laboratory Compacted Soils. ASTM International: West Conshohocken, PA, USA, 2021.
  27. King, R.; Lodge, M. Northwest Shelf development-the foundation engineering challenge. In Proceedings of the International Conference on Calcareous Sediments, Perth, Australia, 15–18 March 1988; pp. 333–342. [Google Scholar]
  28. Fookes, P.G. The geology of carbonate soils and rocks and their engineering characterisation and description. In Proceedings of the International Conference on Calcareous Sediments, Perth, Australian, 15–18 March 1988; pp. 787–806. [Google Scholar]
  29. Coop, M.R. The mechanics of uncemented carbonate sands. Géotechnique 1990, 40, 607–626. [Google Scholar] [CrossRef]
  30. Lord, J.A.; Clayton, C.R.I.; Mortimore, R.N. Engineering in Chalk; Construction Industry Research and Information Association: London, UK, 2002. [Google Scholar]
  31. Porcino, D.; Caridi, G.; Ghionna, V.N. Undrained monotonic and cyclic simple shear behaviour of carbonate sand. Géotechnique 2008, 58, 635–644. [Google Scholar] [CrossRef]
  32. Wang, G.; Zha, J.J. Particle breakage evolution during cyclic triaxial shearing of a carbonate sand. Soil Dyn. Earthq. Eng. 2020, 138, 106326. [Google Scholar] [CrossRef]
  33. Latifi, N.; Horpibulsuk, S.; Meehan, C.L.; AbdMajid, M.Z.; Rashid, A.S.A. Xanthan gum biopolymer: An eco-friendly additive for stabilization of tropical organic peat. Environ. Earth Sci. 2016, 75, 825. [Google Scholar] [CrossRef]
  34. Muguda, S.; Booth, S.J.; Hughes, P.N.; Augarde, C.E.; Perlot, C.; Bruno, A.W.; Gallipoli, D. Mechanical properties of biopolymer-stabilised soil-based construction materials. Géotechnique Lett. 2017, 7, 309–314. [Google Scholar] [CrossRef]
  35. Qureshi, M.U.; Chang, I.; Al-Sadarani, K. Strength and durability characteristics of biopolymer-treated desert sand. Geomech. Eng. 2017, 12, 785–801. [Google Scholar] [CrossRef]
  36. Ayeldeen, M.; Negm, A.; El-Sawwaf, M.; Kitazume, M. Enhancing mechanical behaviors of collapsible soil using two biopolymers. J. Rock Mech. Geotech. Eng. 2017, 9, 329–339. [Google Scholar] [CrossRef]
  37. Singh, S.P.; Das, R. Geo-engineering properties of expansive soil treated with xanthan gum biopolymer. Geomech. Geoengin. 2020, 15, 107–122. [Google Scholar] [CrossRef]
  38. Choi, S.G.; Chang, I.; Lee, M.; Lee, J.H.; Han, J.T.; Kwon, T.H. Review on geotechnical engineering properties of sands treated by microbially induced calcium carbonate precipitation (MICP) and biopolymers. Constr. Build. Mater. 2020, 246, 118415. [Google Scholar] [CrossRef]
  39. Khatami, H.R.; O’Kelly, B.C. Improving mechanical properties of sand using biopolymers. J. Geotechn. Geoenvironmental Eng. 2013, 139, 1402–1406. [Google Scholar] [CrossRef]
  40. HD26/06:2006; Pavement Design and Maintenance-Foundations, Volume 7, Design Manual for Roads and Bridges (DMRB). The Stationery Office: London, UK, 2006.
  41. Ghorbani, A.; Hasanzadehshooiili, H. Prediction of UCS and CBR of microsilica-lime stabilized sulfate silty sand using ANN and EPR models; application to the deep soil mixing. Soils Found. 2018, 58, 34–49. [Google Scholar] [CrossRef]
  42. Consoli, N.C.; Cruz, R.C.; Floss, M.F.; Festugato, L. Parameters Controlling Tensile and Compressive Strength of Artificially Cemented Sand. J. Geotech. Geoenviron. Eng. 2010, 136, 759–763. [Google Scholar] [CrossRef]
  43. Park, H. Study for Application of Artificial Neural Networks in Geotechnical Problems. In Artificial Neural Networks-Application; IntechOpen: London, UK, 2011. [Google Scholar] [CrossRef]
  44. Consoli, N.C.; Ferreira, P.M.V.; Tang, C.S.; Marques, S.F.V.; Festugato, L.; Corte, M.B. A unique relationship determining strength of silty/clayey soils: Portland cement mixes. Soils Found. 2016, 56, 1082–1088. [Google Scholar] [CrossRef]
  45. Statista. Cement Production in the United States from 2010 to 2022. 2020. Available online: https://www.statista.com/statistics/219343/cement-production-worldwide/?gclid=EAIaIQobChMIovKHtdP5_gIVA_d3Ch2JxgZhEAAYAiAAEgL_h_D_BwE (accessed on 13 April 2023).
  46. Van den Heede, V.P.; De Belie, N. Environmental impact and life cycle assessment (LCA) of traditional and ‘green’ concretes: Literature review and theoretical calculations. Cem. Concr. Compos. 2012, 34, 431–442. [Google Scholar] [CrossRef]
  47. Habert, G. Eco-Efficient Concrete: Environmental Impact of Portland Cement Production; Woodhead Publishing Series in Civil and Structural Engineering; Elsevier: Amsterdam, The Netherlands, 2013. [Google Scholar]
  48. Andrew, R.M. Global CO2 emissions from cement production. Earth Syst. Sci. Data 2018, 10, 195–217. [Google Scholar] [CrossRef]
  49. Møller, M.F. A scaled conjugate gradient algorithm for fast supervised learning. Neural Netw. 1993, 6, 525–533. [Google Scholar] [CrossRef]
  50. Vinodkumar, S.B.S. Artificial Neural Network Modelling and Economic Analysis of Black Cotton Soil Subgrade Stabilized with Flyash and Geotextile. Int. J. Earth Sci. Eng. 2016, 9, 81–86. [Google Scholar]
  51. Egbueri, J.C.; Igwe, O.; Omeka, M.E.; Agbasi, J.C. Development of MLR and variedly optimized ANN models for forecasting the detachability and liquefaction potential index of erodible soils. Geosyst. Geoenviron. 2022, 2, 100104. [Google Scholar] [CrossRef]
  52. Li, G.; Han, C.; Mei, H.; Chen, S. Application of the WNN-Based SCG Optimization Algorithm for Predicting Soft Soil Foundation Engineering Settlement. Sci. Program. Smart Internet Things 2021, 2021, 9936285. [Google Scholar] [CrossRef]
  53. Kisi, O.; Uncuoglu, E. Comparison of three back-propagation training algorithms for two case studies. Indian J. Eng. Mater. Sci. 2005, 12, 434–442. [Google Scholar]
  54. Cevik, A.; Sezer, E.A.; Cabalar, A.F.; Gokceoglu, C. Modeling of the uniaxial compressive strength of some clay-bearing rocks using neural network. Appl. Soft Comput. 2011, 11, 2587–2594. [Google Scholar] [CrossRef]
  55. Yildiz, O.; Berilgen, M. Artificial Neural Network Model to Predict Anchored Pile-Wall Displacements on Istanbul Greywackes. Tek. Dergi 2020, 31, 10147–10166. [Google Scholar] [CrossRef]
  56. Cabalar, A.F.; Karabas, B.; Mahmutluoglu, B.; Yildiz, O. An IDW-based GIS application for assessment of geotechnical characterization in Erzincan, Turkey. Arab. J. Geosci. 2021, 14, 2129. [Google Scholar] [CrossRef]
  57. Yıldız, Ö. Correlation Between Spt and Pmt Results for Sandy and Clayey Soils. Eskişehir Tech. Univ. J. Sci. Technol. A-Appl. Sci. Eng. 2021, 22, 175–188. [Google Scholar] [CrossRef]
  58. Rathje, E.M.; Kottke, A.R.; Trent, W.L. Influence of input motion and site property variabilities on seismic site response analysis. J. Geotech. Geoenviron. Eng. 2010, 136, 607–619. [Google Scholar] [CrossRef]
  59. Field, E.H.; Jacob, K.H. Monte-Carlo simulation of the theoretical site response variability at Turkey Flat, California, given the uncertainty in the geotechnically derived input parameters. Earthq. Spectra 1993, 9, 669–701. [Google Scholar] [CrossRef]
  60. Andrade, J.E.; Borja, R.I. Capturing strain localization in dense sands with random density. Int. J. Numer. Methods Eng. 2006, 67, 1531–1564. [Google Scholar] [CrossRef]
  61. Wang, Z.Z. Deep Learning for Geotechnical Reliability Analysis with Multiple Uncertainties. J. Geotech. Geoenviron. Eng. 2022, 148, 06022001. [Google Scholar] [CrossRef]
  62. Ravichandran, N.; Mahmoudabadi, V.; Shrestha, S. Analysis of the bearing capacity of shallow foundation in unsaturated soil using Monte Carlo simulation. Int. J. Geosci. 2017, 8, 1231–1250. [Google Scholar] [CrossRef]
Figure 1. Grain size distribution of GW samples used during the tests.
Sustainability 15 08231 g001
Figure 2. (a) Picture of GW and (b) SEM picture of XG grains.
Sustainability 15 08231 g002
Figure 3. UCS testing results for the samples tested at the end of a (a) 4-day and(b) 32-day curing period.
Sustainability 15 08231 g003aSustainability 15 08231 g003b
Figure 4. Effect of curing period on the UCS testing results for (a) GW only, and (b) GW with 5%XG samples.
Sustainability 15 08231 g004
Figure 5. The qu values of the samples tested.
Sustainability 15 08231 g005
Figure 6. Energy absorption capacities of the samples.
Sustainability 15 08231 g006
Figure 7. CBR values of the samples.
Sustainability 15 08231 g007
Figure 8. Capping and sub-base thickness design [40].
Sustainability 15 08231 g008
Figure 9. The qu versus CBR testing results for the samples.
Sustainability 15 08231 g009
Figure 10. Frequency distribution of the parameters in dataset; (a) XG content, (b) curing period, (c) penetration, (d) strain and (e) energy absorption.
Sustainability 15 08231 g010
Figure 11. Flowchart of the prediction models.
Sustainability 15 08231 g011
Figure 12. Architecture of the prediction model.
Sustainability 15 08231 g012
Figure 13. Best validation performance curves of the predictions of; (a) CBR and (b) qu.
Sustainability 15 08231 g013
Figure 14. Error frequency distribution of the predictions of (a) CBR and (b) qu.
Sustainability 15 08231 g014
Figure 15. Scatter plots of output versus target values of (a) CBR and (b) qu by prediction models.
Sustainability 15 08231 g015
Table 1. Test scheme employed during the experimental study.
Name of the SpecimensHost MaterialAdmixture MaterialAdmixture Content (%)Curing DaysTotal Number of Specimens TestedTest Setup
Clean GWGWXG biopolymer03, 7, 14, 2816UCS, and
CBR
GW with 1% XG13, 7, 14, 28
GW with 3% XG33, 7, 14, 28
GW with 5% XG53, 7, 14, 28
GW = well-graded gravel; XG=xanthan gum; UCS: unconfined compressive strength; CBR: California bearing ratio.
Table 2. Summary of testing results.
Curing PeriodSampleCBR
(%)
qu
(kPa)
Energy Absorption Capacity (kJ/m3)Pavement Design Alternatives
Alternative 1Alternative 2
Subbase (mm)Capping
(mm)
Subbase
(mm)
4-DayClean GW10.511080150195173
GW with 1% XG12.717092150173162
GW with 3% XG32.6280173150n.a.150
GW with 5% XG38.2360201150n.a.150
8-DayClean GW12.1160100150230165
GW with 1% XG18.0360198150n.a.150
GW with 3% XG35.4620430150n.a.150
GW with 5% XG46.5660284150n.a.150
16-DayClean GW15.7270213150n.a.150
GW with 1% XG21.2510425150n.a.150
GW with 3% XG42.8780385150n.a.150
GW with 5% XG60.0890338150n.a.150
32-DayClean GW24.6460236150n.a.150
GW with 1% XG35.9670391150n.a.150
GW with 3% XG54.2880342150n.a.150
GW with 5% XG73.31020316150n.a.150
GW: well-graded gravel; XG: xanthan gum; CBR: California bearing ratio; qu: unconfined compressive strength value.
Disclaimer/Publisher’s Note: The statements, opinions and data contained in all publications are solely those of the individual author(s) and contributor(s) and not of MDPI and/or the editor(s). MDPI and/or the editor(s) disclaim responsibility for any injury to people or property resulting from any ideas, methods, instructions or products referred to in the content.