Article

Soil Water Erosion and Its Hydrodynamic Characteristics in Degraded Bald Patches of Alpine Meadows in the Yellow River Source Area, Western China

1
Geological Engineering Department, Qinghai University, Xining 810016, China
2
Key Lab of Cenozoic Resource & Environment in North Margin of the Tibetan Plateau, Xining 810016, China
3
State Key Laboratory of Plateau Ecology and Agriculture, Qinghai University, Xining 810016, China
4
College of Agriculture and Animal Husbandry, Qinghai University, Xining 810016, China
*
Author to whom correspondence should be addressed.
Sustainability 2023, 15(10), 8165; https://doi.org/10.3390/su15108165
Submission received: 12 April 2023 / Revised: 11 May 2023 / Accepted: 15 May 2023 / Published: 17 May 2023
(This article belongs to the Special Issue Research on Water and Soil Conservation)

Abstract

:
Degraded bald patches have been active influencing factors in recent years, leading to meadow degradation and soil erosion in the Yellow River source area. In this study, we aimed to quantify the soil water erosion patterns and the hydrodynamic characteristics of degraded bald patches under different vegetation coverage (10%, 30%, 50%, 70% and 90%) and slope (10°, 20° and 30°) combination treatments through simulated rainfall experiments, and to investigate the influence of rodent activities on meadow degradation and soil erosion using zokor mound bare ground as a control. The results show that rodent activity exacerbates erosion problems and that soil erosion rates are negatively correlated with the degree of meadow degradation as an exponential function (p < 0.01). All slope flows are laminar; Reynolds and Froude numbers decrease as a function of vegetation coverage exponentially and linearly (p < 0.01), respectively, and are positively correlated with slope. Flow resistance increases with increasing vegetation coverage and decreasing slope, and vegetation coverage and slope are significant factors affecting flow resistance (p < 0.05). Runoff shear stress was found to range from 1.71 to 5.27 N m−2 in the study area and is positively correlated with vegetation coverage and slope, with a much greater influence of slope than vegetation coverage (p < 0.05). Based on the Pearson correlation and grey correlation method analysis, we concluded that runoff rate, flow velocity, Reynolds number and the Froude number can all describe the hydraulic erosion state under the action of soil erosion on slopes. The Reynolds number was tentatively judged to be the best hydrodynamic parameter to describe the soil erosion process. We conclude that developing degraded bald patches reduces flow resistance and increases surface runoff capacity and soil erodibility by reducing vegetation coverage. The reasonable control of rodent activity can effectively combat erosion on degraded bald patches.

1. Introduction

Soil erosion has become a major ecological and environmental problem worldwide, occurring to varying degrees in all regions except permafrost areas [1]. The Yellow River source area is the main flow-producing and water-conserving area in the upper reaches of the Yellow River in China, and one of the most extraordinary and fragile areas of the Qinghai–Tibet Plateau ecosystem [2,3]. As this region’s most important coverage type, alpine meadows account for about 80% of the Yellow River source area. Since the 1970s, the degradation of meadow vegetation in the Yellow River source area has been intensifying yearly [4,5,6], with degraded meadow area accounting for as much as 25–46% of the available area. The heavily degraded area accounts for 26.79% of the total degraded area, and some of the meadows have even degraded into bare secondary land, i.e., black soil banks [7,8]. Soil erosion not only exacerbates meadow degradation and functional ecosystem failure in the area [9] but also threatens the stability and ecological sustainability of the entire alpine meadow, with a considerable negative impact on the production and livelihood of local pastoralists and ecological vegetation restoration and management [10].
Due to the unique geographical environment of the Yellow River source area, the alpine meadow ecosystem has long been weak in terms of self-healing. The recovery process is prolonged [11]. Under the influence of climate change, livestock production, and human activities, some of the meadow surfaces nurture and form degraded bald patches in large-scale areas [12,13]. Small patches in the degradation stage further deteriorate and expand under the action of surrounding toxic grasses, solar radiation, and superficial erosion, which eventually cause spatial dynamic changes in soil characteristics and plant communities [14,15], with the effect of intensifying meadow degradation, accelerating soil erosion, and nutrient loss [16,17,18]. In addition, plateau zokors (Eospalax baileyi) and plateau pika (Ochotona curzoniae) are abundant in the Yellow River source area [19]. As essential sources of biological disturbance in alpine meadow ecosystems, their digging and gnawing behaviors not only have a significant impact on vegetation and soil [20,21,22], but the loose mounds formed by their mounding can also directly form secondary bald patches of bare ground, as well as provide material sources for soil erosion [23,24,25]. Many scholars have shown that meadow degradation is closely related to the degree of development of bald patches, and soil erosion after meadow degradation positively influences further soil erosion and meadow degradation [26,27,28]. The need to enhance and optimize the soil and water conservation function of the alpine meadow ecosystem from the perspective of ecological, production and living functions has become an urgent problem in the region.
Soil erosion, which is characterized by flow and sand production, is an essential component of complex land surface hydrological ecosystems that is closely related to precipitation, vegetation, topography, soil and climate [29,30,31,32,33]. Precipitation is the main controlling factor of water erosion; about 60% of rainfall runoff and 90% of soil erosion occur during periods of concentrated rainfall [34], while large areas of soil erosion worldwide are caused by heavy or extreme rainfall events [35]. In the Yellow River source area, due to limited rainfall and vegetation carrying capacity [36], meadow degradation can increase the patchiness of vegetation distribution by reducing vegetation coverage and type [37,38], which stimulates more intense soil erosion. Erosion has been shown not to occur in healthy meadow areas [39], and soil erosion capacity is significantly increased in degraded areas disturbed by rodents [40]. Soil loss decreases linearly or as a power function of vegetation coverage and increases linearly or as an exponential function of slope [41,42]. In addition, many scholars believe that surface runoff can affect the soil erosion process and its spatial distribution by changing the hydrodynamic characteristics. For example, Li et al. [43] showed that a decrease in scrub grass coverage can cause a decrease in runoff resistance and an increase in runoff flow velocity and runoff power, which, in turn, can have a driving effect on soil erosion. Sun et al. [44] reported that the Reynolds number increased and the resistance coefficient decreased with increasing slope gradient on forested, litter-covered slopes; the Reynolds number is the best hydrodynamic parameter to characterize the soil erosion process. In summary, despite the progress of research on soil erosion and the mechanism of its hydrodynamic characteristics, the current results of a large number of indoor simulations cannot be directly applied to the alpine meadows of the Yellow River source, where degraded bald patches are commonly developed against the background of continuous ecological degradation and the prevalence of heavy seasonal rainfall. In addition, the role of vegetation restoration succession in soil erosion and its hydrodynamic mechanisms has not received much attention. Few studies have been conducted to quantify the soil erosion status of degraded bald patches by combining hydrodynamic characteristics. On the other hand, the results of indoor simulation-based studies may not truly reflect the effect of meadow degradation on soil erosion. Therefore, a comprehensive comparison of the influence of the degree of degraded bald patch development on runoff sediment and the regulation of hydrodynamic characteristics is warranted.
In this study, we attempt to fill the abovementioned knowledge gaps and clarify the soil erosion regularities and hydrodynamic characteristics under different patterns of vegetation coverage and slope. The specific objectives are (1) to reveal the soil erosion patterns of different degraded bald patches; (2) to clarify the changes in hydrodynamic characteristics of different degraded bald patches; (3) to establish the relationship between soil erosion of degraded bald patches and their hydrodynamic characteristics; and (4) to explore the influence of rodent activity on the development and soil erosion of degraded bald patches.

2. Materials and Methods

2.1. Study Area

The study area is located in Henan County, Qinghai Province (34°48′ N, 101°34′ E), which belongs to the alpine meadow area of the Yellow River source, with an average altitude of about 3600 m above sea level (Figure 1). The area has a typical plateau continental climate, with an average annual temperature of −1.3–1.6 °C and an annual precipitation of 597.1–615.5 mm. Heavy rainfall mainly concentrated in July–August of each year is characterized by a short duration, a limited occurrence range and suddenness [45]. The main meadow type is alpine dwarf tarragon meadows. The dominant species of grasses include Kobresia humilis, Kobresia. capillifolia and Kobresia. pygmaea. The soil type in the study area is Humic cambisols according to the WRB soil type classification; the detailed soil properties and their grain size composition are shown in Table 1.
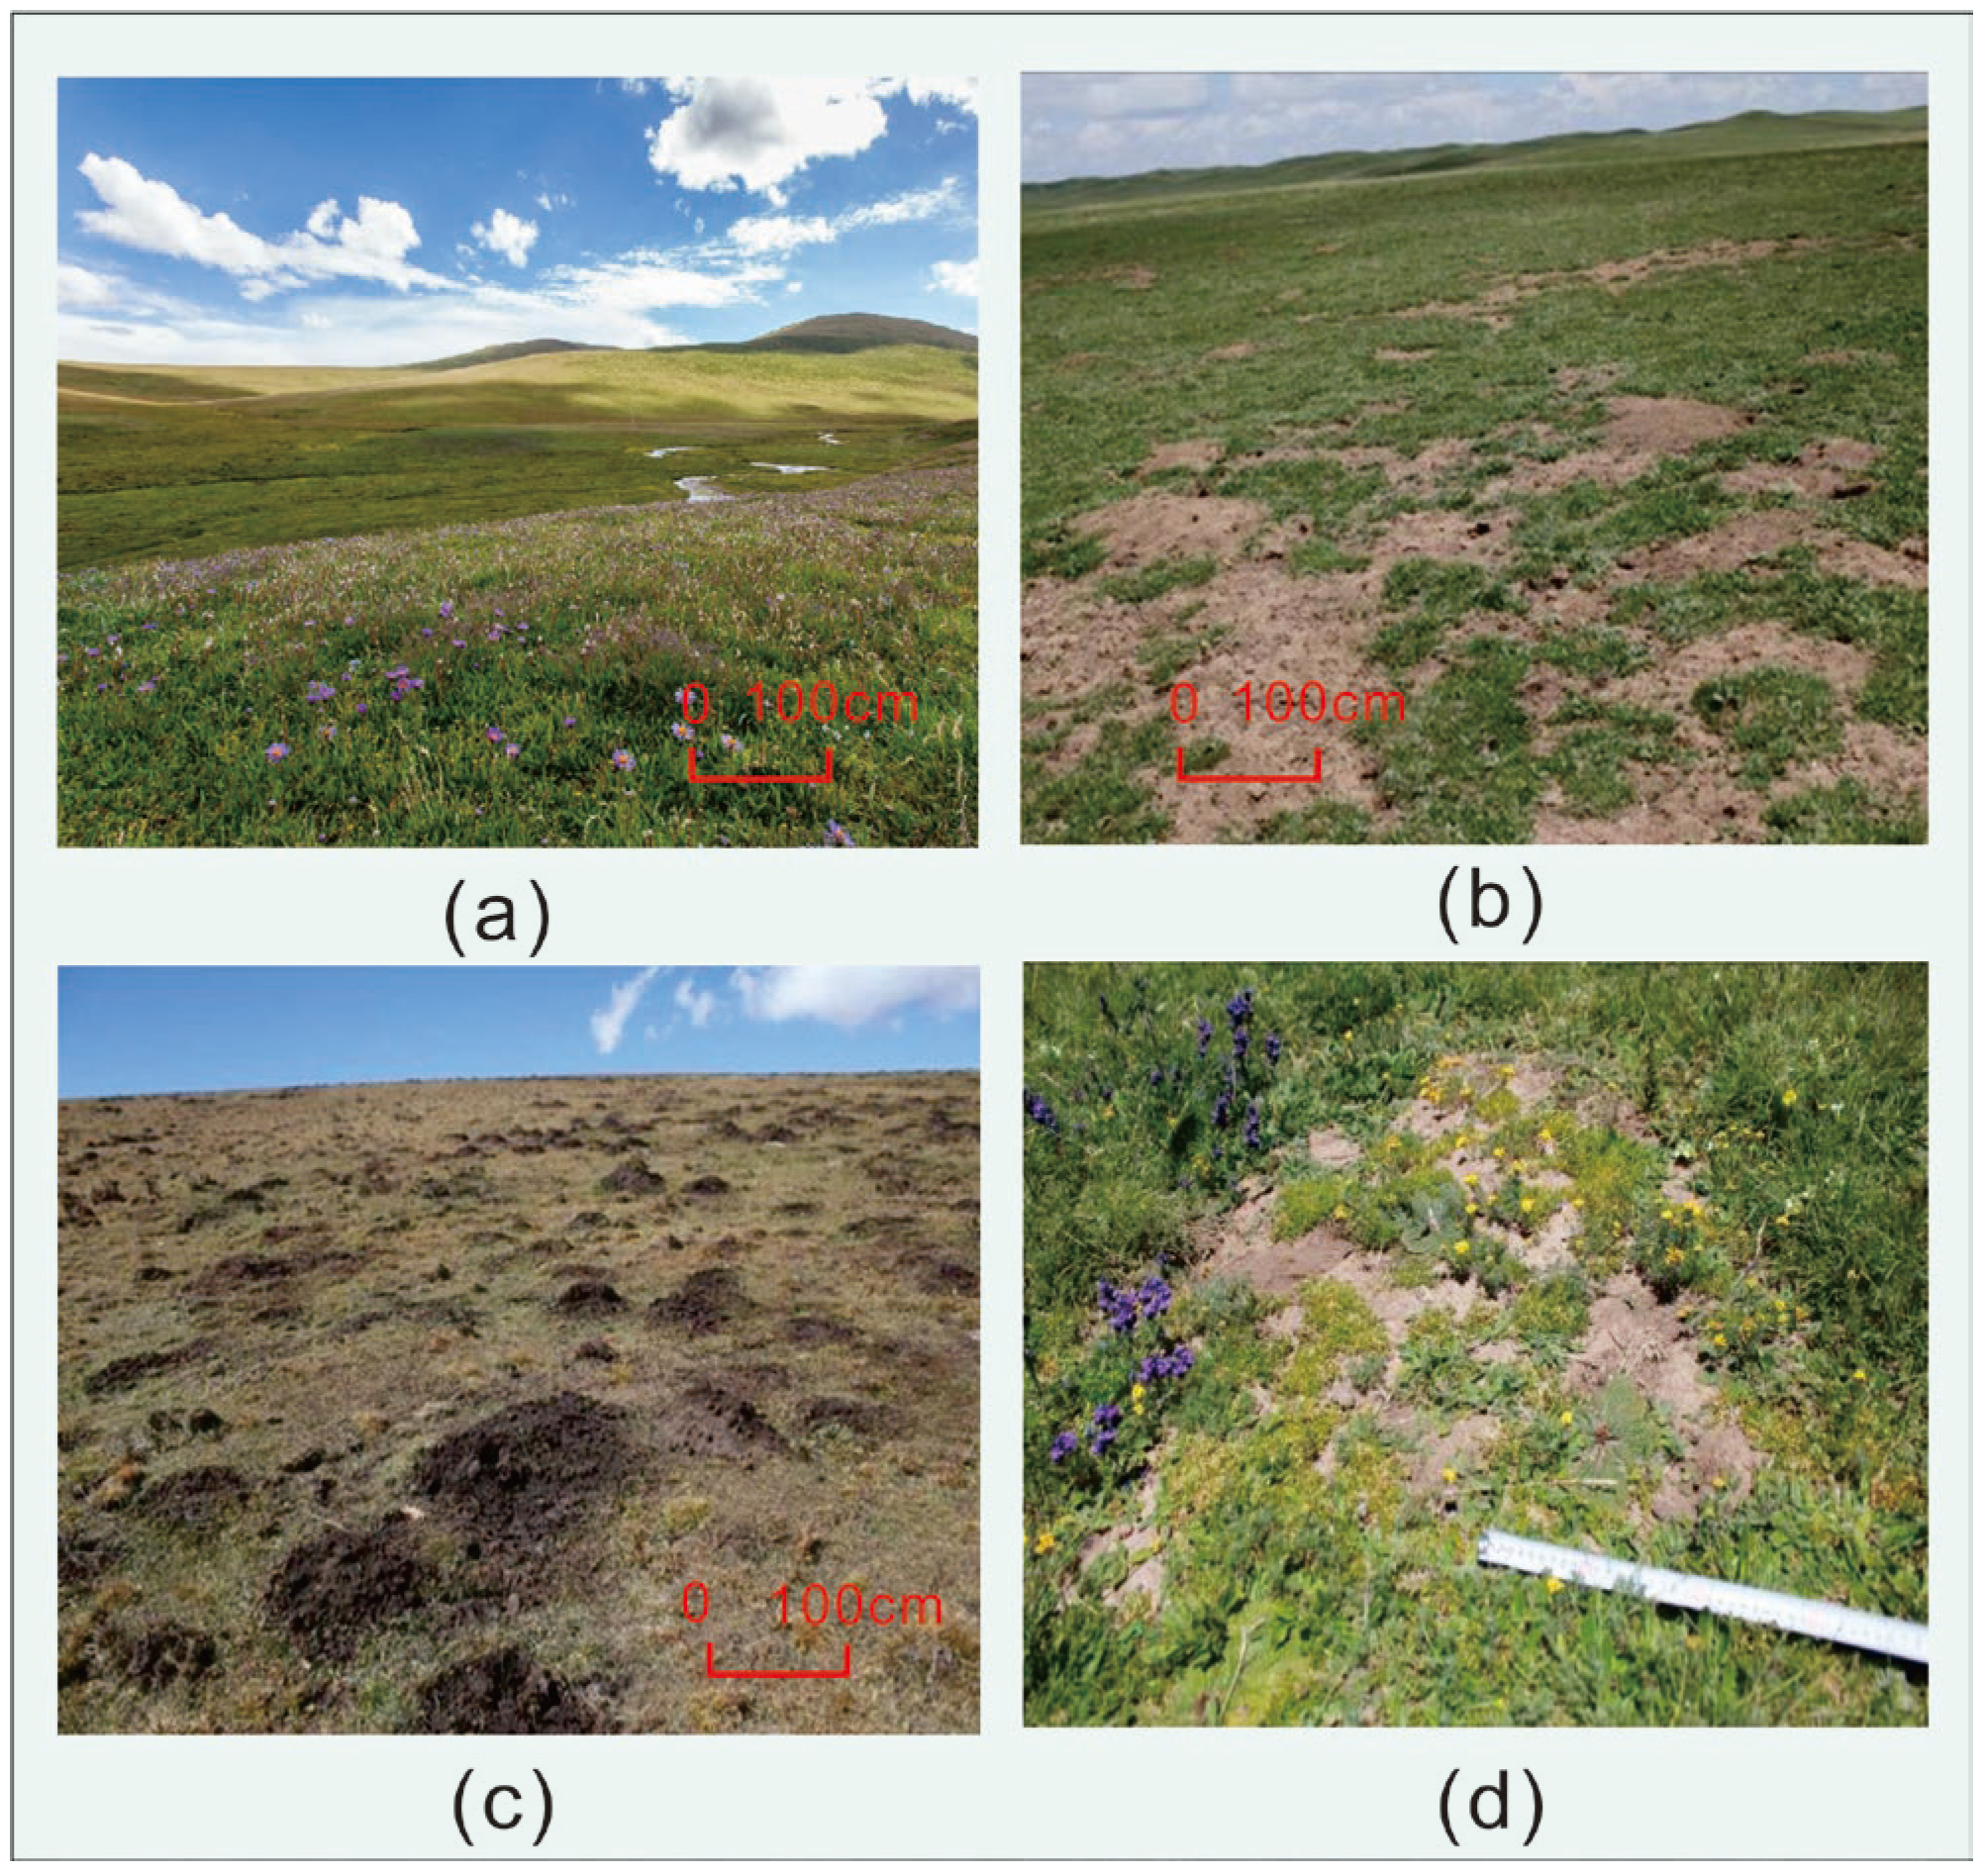
Compared to healthy meadow areas (Figure 2a), vegetation and soil degradation in the study area has been significantly affected by climate, livestock production and rodent activity over a long time, resulting in a large scale of degraded bald patches (Figure 2b). In addition, a high density of zokor mounds was found in the study area (Figure 2c), which were caused by the digging and gnawing of plateau zokors. The zokor mounds not only directly destroy the original soil structure and vegetation community characteristics of the meadow (Figure 2d), but also harm the meadow ecology and soil conservation under the impact of superficial erosion.

2.2. Experimental Design and Methods

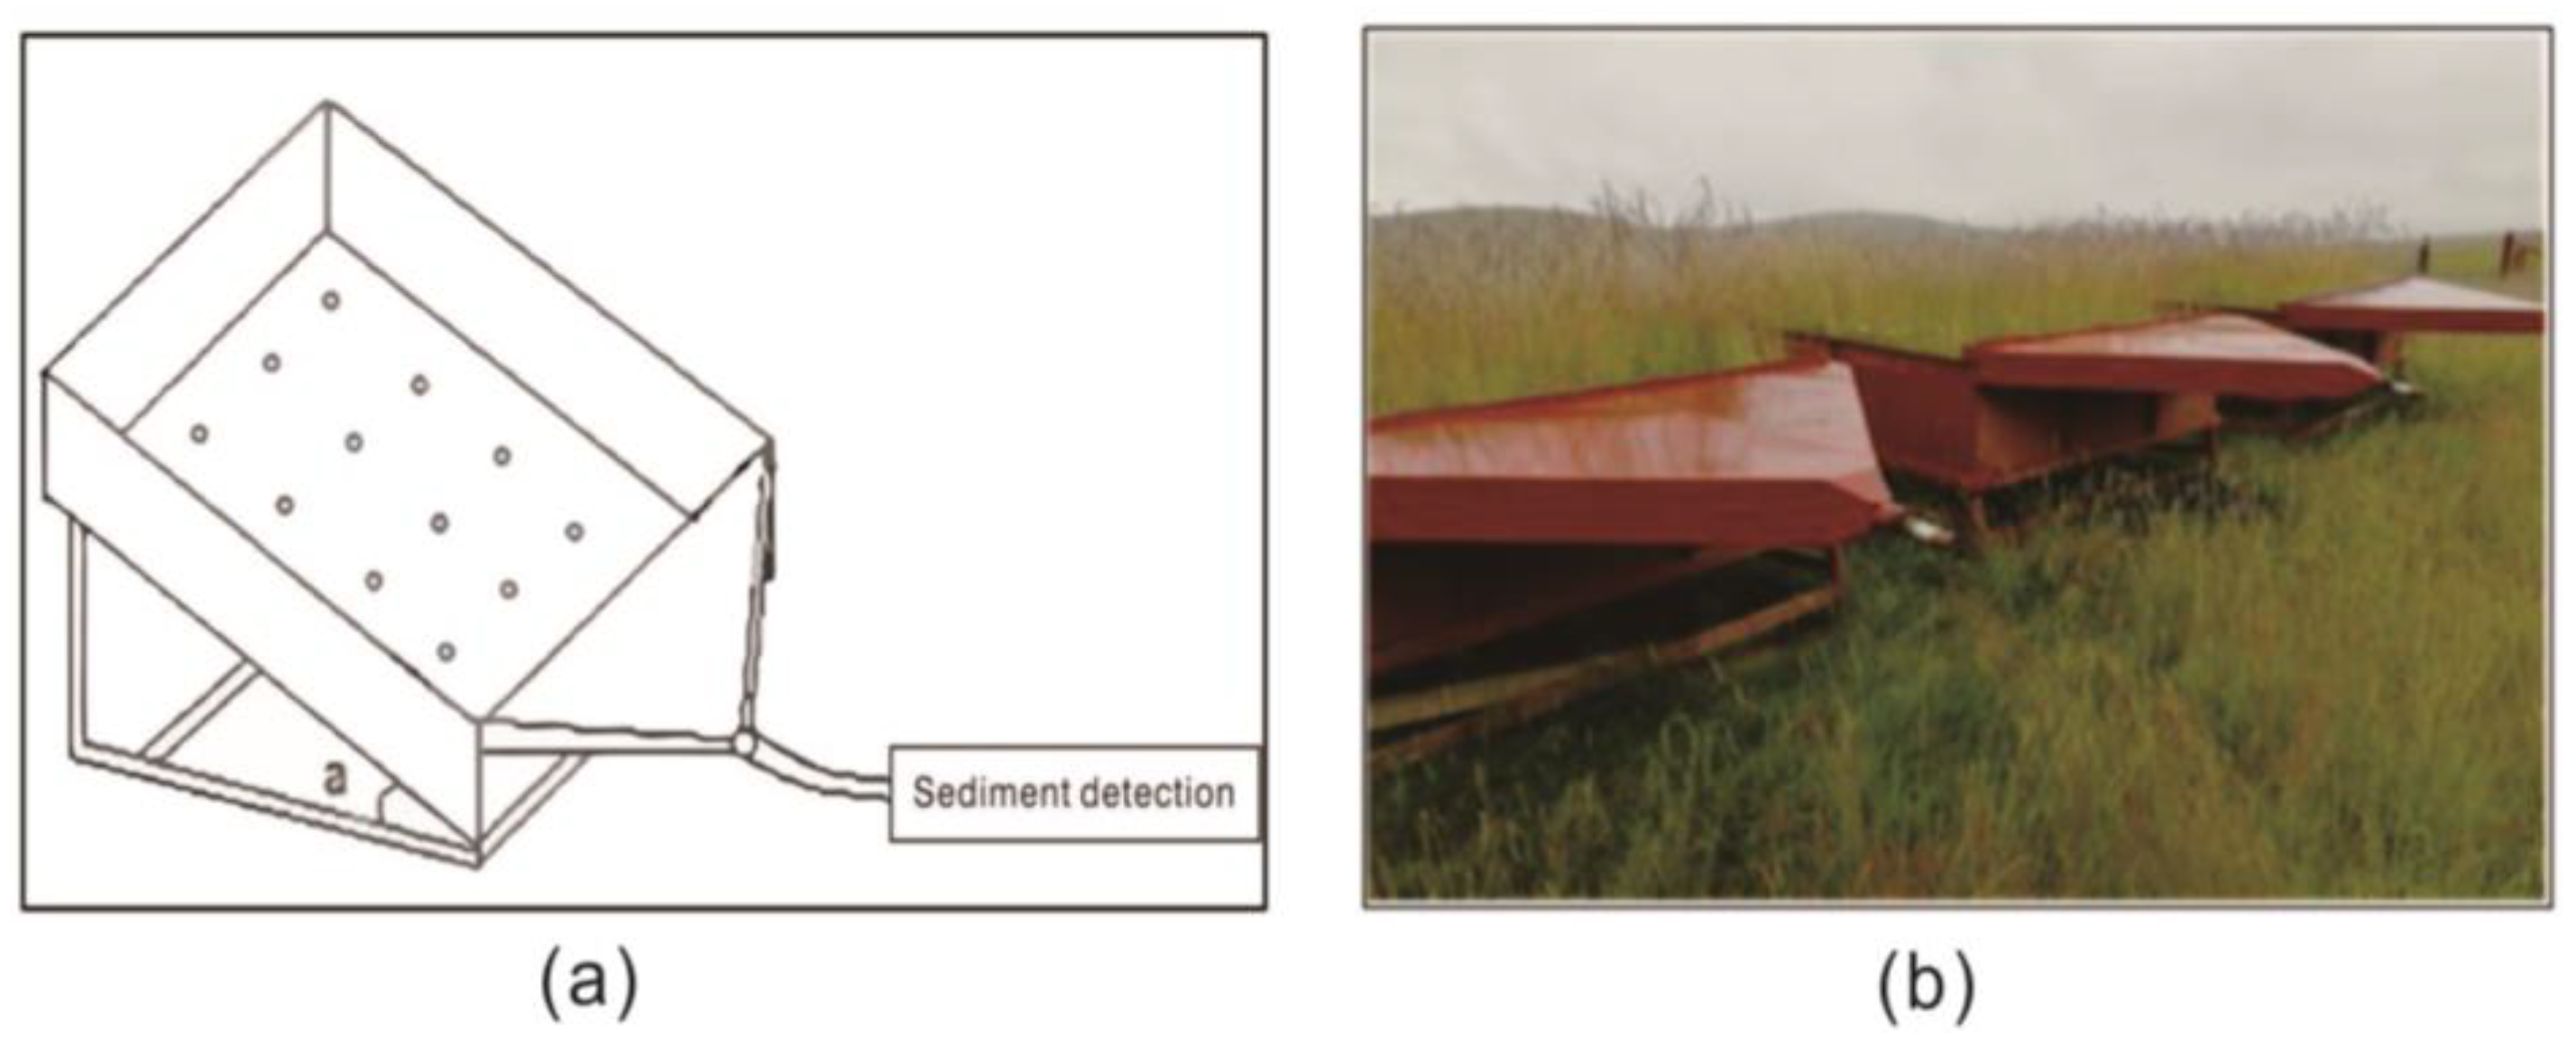
This experiment was focused on the erosion effect of precipitation scour on different degraded bald patch soils. Nine removable water erosion test boxes were set up in the field site during the preparation phase of the experiment, three of which were in one group and three in one replicate group (Figure 3a). The test boxes were 3 m long, 1.5 m wide and 0.5 m deep, and the slopes were designed to be 10°, 20° and 30°, respectively. Natural drainage holes were set at the bottom of the box, “V” shaped converging sediment inflow holes were set at the front to collect and test the sediment runoff. All tests were completed in the water erosion test chamber, and the test soils were selected from the original healthy meadow soils with vegetation root–soil structures that had been sealed for many years in the study area. In June 2020, 0.5 m × 0.5 m × 0.5 m in situ meadow squares were cut on-site in the field. These in situ squares were sequentially laid into the corresponding test boxes, and the side joints were manually repaired to make a complete test site. Then, the meadow squares were left in the field for a long time to grow naturally (Figure 3b), and the corresponding water erosion tests were conducted after the joints between the meadow squares in all the test boxes were completely healed, and the vegetation coverage reached 95% or more.
Degraded bald patches in the Yellow River source area, created by rodent activity, are prone to more serious soil erosion problems under the influence of superficial erosion. However, soil erosion hardly occurs when the meadow vegetation coverage exceeds 90%. In addition to investigating the severely degraded meadow caused by frequent rodent activities, we investigated zokor mounds, secondary patches of bare ground formed by the destruction of soil structure, and the burial and death of vegetation caused by the activity of plateau zokors. Therefore, according to the experimental requirements and the actual degradation of the meadow, the vegetation coverage in the water erosion test chamber was controlled from 0% to 90%. The degraded patches were artificially simulated on the surface of the healthy meadow in the water erosion test box so that the vegetation coverage was 90%, 70%, 50%, 30% and 10%, as well as zokor mound bare ground. Artificially simulated degraded patches were used to avoid disturbing the natural growth of the surrounding vegetation and the soil structure of the meadow topsoil, as well as to control the vegetation coverage levels to the greatest extent possible, according to the requirements of the test treatment. Mound soil was selected from fresh a mound formed by plateau zokor activity, which was cut from the bottom and placed on the surface of the meadow soil in the test box without destroying the soil structure. First, a hydraulic erosion test was conducted at different slopes in the test boxes with 90% vegetation coverage and repeated three times. After one week, the patch area was artificially simulated to reduce the coverage to 70%; then, the same hydraulic erosion tests were carried out. A complete set of water erosion tests were completed successively during July–August 2022.
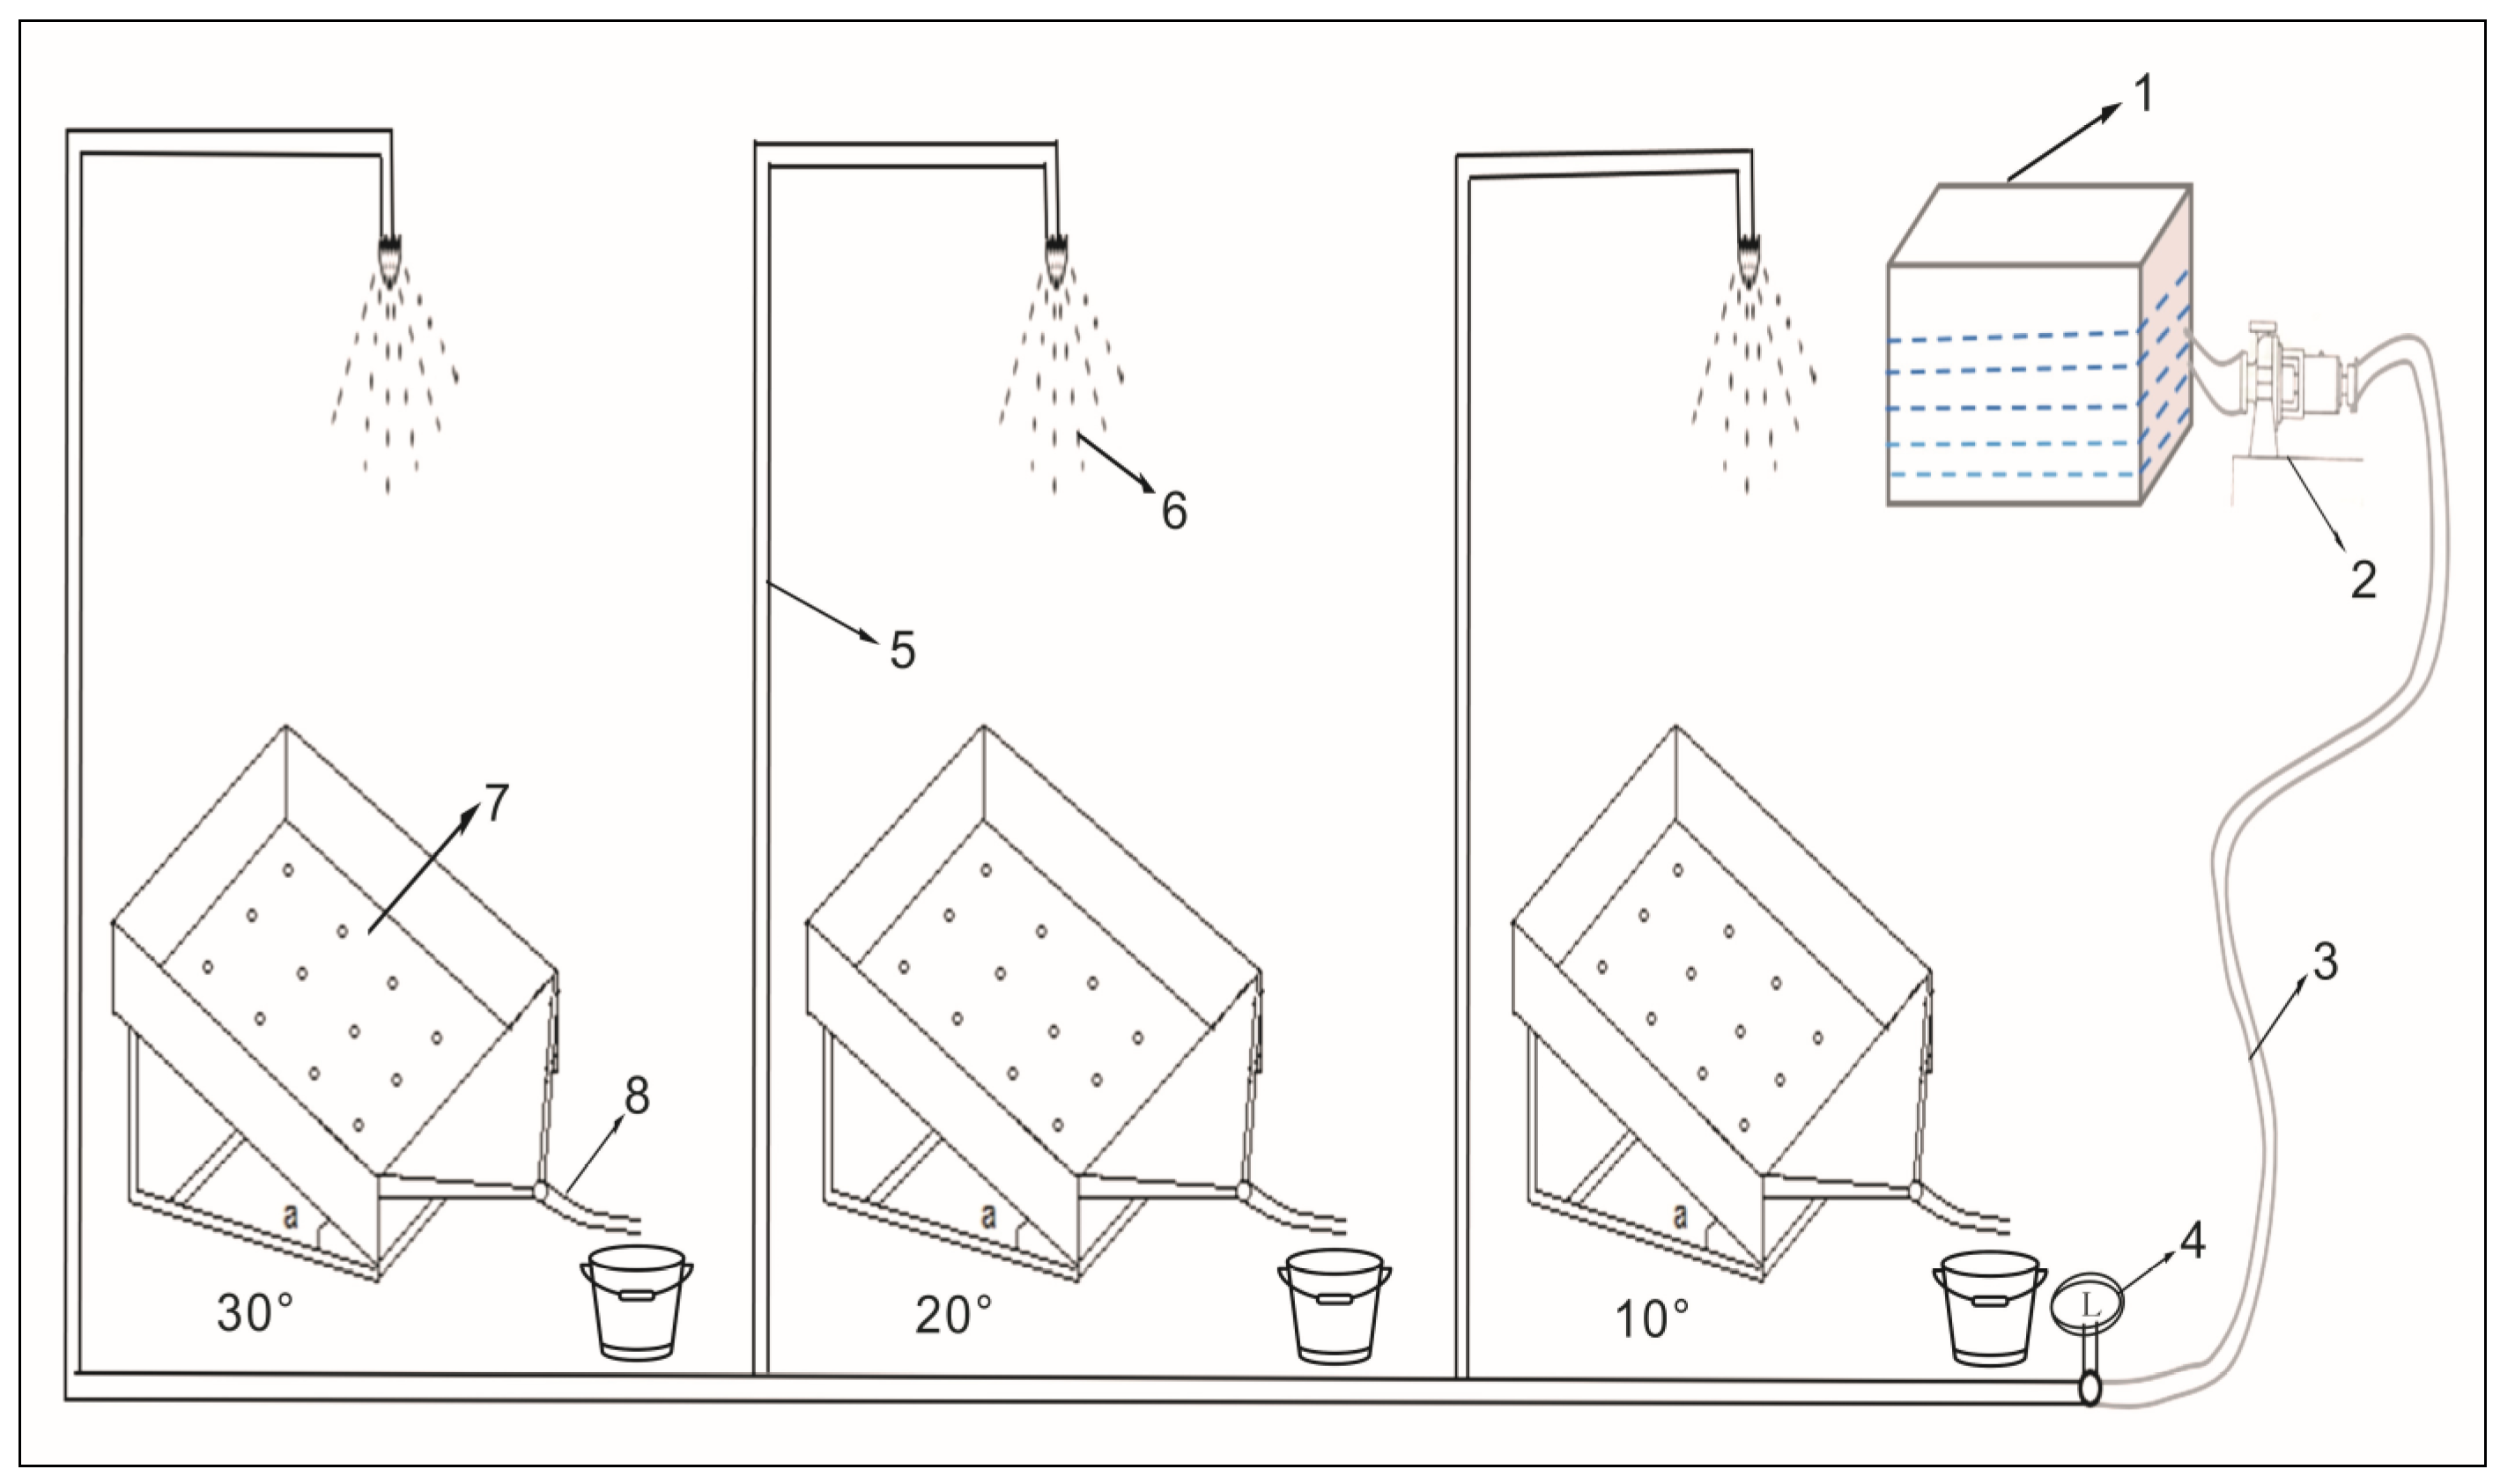
The soil water erosion test was carried out using a field portable artificial rainfall simulation device composed of solid umbrella nozzles, a water supply tank, a pump, a rainfall intensity regulator, water pipelines, water guide pipes, runoff sediment inflow holes, etc. (Figure 4). The distance of the three nozzles from the meadow surface was 3 m. The effective diameter of precipitation is 3 m, the rainfall intensity regulator could control the rainfall intensity from 0 to 60 mm h−1, and the simulation accuracy was ±0.5 mm min−1. According to the meteorological data and test requirement for strong rainfall as recorded in the study area in recent years, the average rainfall intensity of this series of tests was set to 30 mm h−1. Considering the effect of natural wind on raindrop direction and raindrop kinetic energy, the test was conducted using a tarp to enclose the periphery of the treatment plot.
In the test, the duration was recorded when runoff started to appear from the runoff sediment inflow hole. The rainfall calendar was set at 60 min, and the runoff and sediment were collected in containers every 5 min. The collected water samples were returned to the laboratory for sediment separation by sedimentation and filtration and dried in an oven at 105 °C to determine the soil loss and runoff volume per unit time per unit of area, i.e., soil erosion rate and runoff rate, respectively. In addition, the runoff velocity, runoff width and water temperature were measured separately for each slope at the same time interval. The runoff velocity was measured by the tracer method using dye (KMnO4). Three sections of 0.5 m, 1.5 m and 2.5 m were set from the top to the bottom of the slope, and the length of the measurement area was set to 0.5 m. The average value of the flow velocity at different sections was taken as the real-time runoff velocity at that moment.

2.3. Data Testing and Analysis

Indicators representing different hydrodynamic characteristics of slope surface flow were selected to accurately describe the relationship between soil erosion and its hydrodynamic characteristics on degraded bald patches.
The average flow velocity (m s−1) is the product of the surface flow velocity of slope runoff and its correction factor [46].
v = α v s
where v is the average flow velocity (m s−1), vs. is the measured surface velocity of slope runoff (m s−1), α is the correction factor, the laminar flow is taken as 0.67, the transition flow is taken as 0.7, and the turbulent flow is taken as 0.8 [47].
Because of the shallow water depth of the thin water flow section on the slope, the direct measurement may produce large errors, so the following formula was chosen to calculate the average water depth of the slope flows [46].
h = Q v · B · T
where h is the average runoff depth (mm), Q is the runoff volume generated per unit time (m3), B is the runoff width (m) and T is the runoff time (s).
The Reynolds number (Re) and Froude number (Fr) reflect the flow state of slope flow. Re is the ratio of inertial force to viscous force, and Re = 500 is the critical value of laminar and turbulent flow. Fr is the ratio of inertial force to gravity, Fr < 1 indicates the occurrence of subcritical flow and Fr > 1 indicates the occurrence of supercritical flow. The specific calculation formula is as follows [46]:
R e = v · R v 0
F r = v g · h
where Re and Fr are dimensionless numbers; R is the hydraulic radius, which is approximated by the runoff depth h (m); v0 is the kinematic viscosity (m2 s−1), and g is the gravitational acceleration (9.8 m s−2).
The Darcy–Weisbach resistance coefficient (f) and Manning roughness coefficient (n) were used to represent the resistance along the slope flow [46]:
f = 8 · g · R · J v 2
n = R 2 / 3 · J 1 / 2 v
where f and n are dimensionless numbers, and J is the hydraulic energy slope (m m−1) calculated as the sine value of slope gradient.
Runoff shear stress is the runoff force that causes the transport of soil particles and is calculated as follows [46].
τ = γ · R · J
where τ is the runoff shear stress (N m−2), γ is the water gravity (N m−3) and J is the same as defined above.
In this study, Microsoft Excel 2019 software (Version: 2203 Build 16.0.15028.20218) was used for data statistics and analysis, drawing corresponding graphs, etc. IBM SPSS Statistics 26.0 software was used for correlation and statistical analysis between total soil loss, erosion rate and hydrodynamic parameters in different degraded bald patches.

3. Results

3.1. Soil Water Erosion Patterns in Different Degraded Bald Patches

3.1.1. Soil Loss Status of Different Degraded Bald Patches

As shown in Figure 5, during the entire rainfall duration (60 min), the total soil loss was reduced by 80.74%, 48.26% and 22.05% with 90%, 50% and 10% vegetation coverage degraded bald patches compared to zokor mound bare ground, respectively, when the slope was 20°. Different coverage levels had an effect on soil loss from degraded bald patches, and the total soil loss increased as a multiplicative power function with decreasing vegetation coverage (p < 0.05). When the slope increased from 10° to 30°, the total soil loss increased by 1.77, 1.86, 1.73, 1.92, 1.60 and 1.71 times for 90%, 70%, 50%, 30% and 10% vegetation coverage of degraded bald patches and zokor mound bare ground, respectively. A positive linear correlation was observed between total soil loss and slope, i.e., the steeper the slope, the more serious the rainfall-induced soil loss phenomenon. Analysis showed that the total soil loss from bald patches differed significantly (p < 0.05) among different vegetation coverage on the same slopes, except for the total soil loss of 90% vegetation coverage (p < 0.05), whereas the total soil loss of all other types of bald spots showed highly significant differences (p < 0.01). This result indicates that vegetation coverage and slope are significant factors affecting soil loss status.

3.1.2. Soil Erosion Processes on Different Degraded Bald Patches

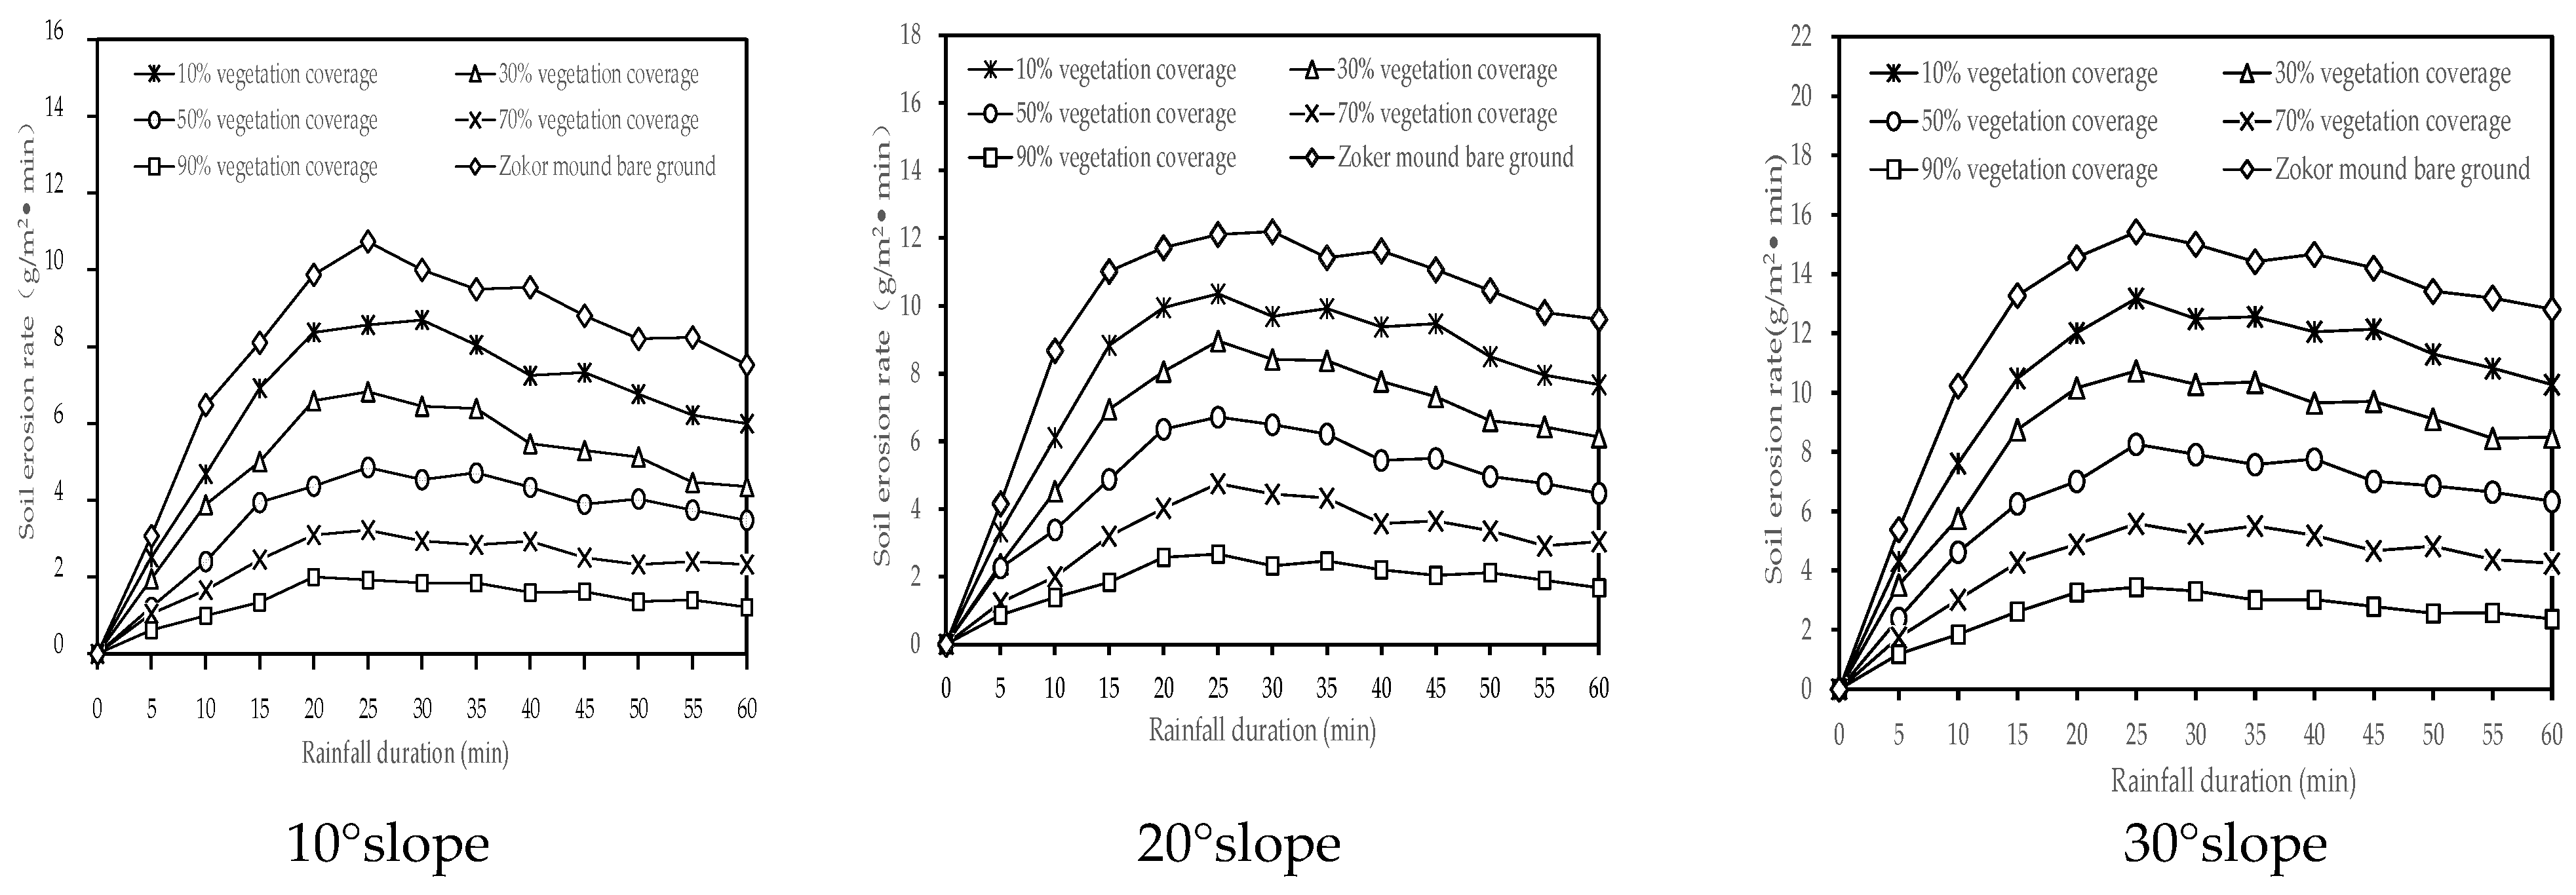
At a rainfall intensity of 30 mm h−1, soil erosion began to occur after 2 min of continuous rainfall, regardless of the slope; however, this phenomenon was delayed in the test plots with more than 50% vegetation coverage, with soil erosion occurring after 7.4 min of rainfall. The soil erosion rate variation curves of degraded bald patches differed significantly under different vegetation coverages on the same slope (Figure 6). When the slope was 10°, the soil erosion rates varied from 0.62 to 3.23 g m−2 min−1 for degraded bald patches with 90% and 70% vegetation coverage and from 1.21 to 6.82 g m−2 min−1 for degraded bald patches with 50% and 30% vegetation coverage, whereas the soil erosion rates varied from 2.52 to 10.74 g m−2 min−1 for degraded bald patches with 10% vegetation coverage and zokor mound bare ground. In addition, when the slope increased to 20° and 30°, the variation range of soil erosion rate of zokor mound bare ground increased to 4.16–12.20 g m−2 min−1 and 5.39–15.42 g m−2 min−1, respectively, and the variation of soil erosion rate increased significantly (p < 0.05) with the slope for the remaining degraded bald patches. In general, the soil erosion process was divided into two stages: a sharp rise at the beginning of rainfall and a gentle decline at the end of rainfall; the soil erosion rate reached its peak after about 25 min of continuous rainfall. Furthermore, compared with zokor mound bare ground, vegetation coverage can significantly reduce the growing trend of the first stage and the fluctuation amplitude of the second stage; this effect becomes more obvious as the level of vegetation coverage and slope increases.

3.1.3. Surface Runoff Characteristics of Different Degraded Bald Patches

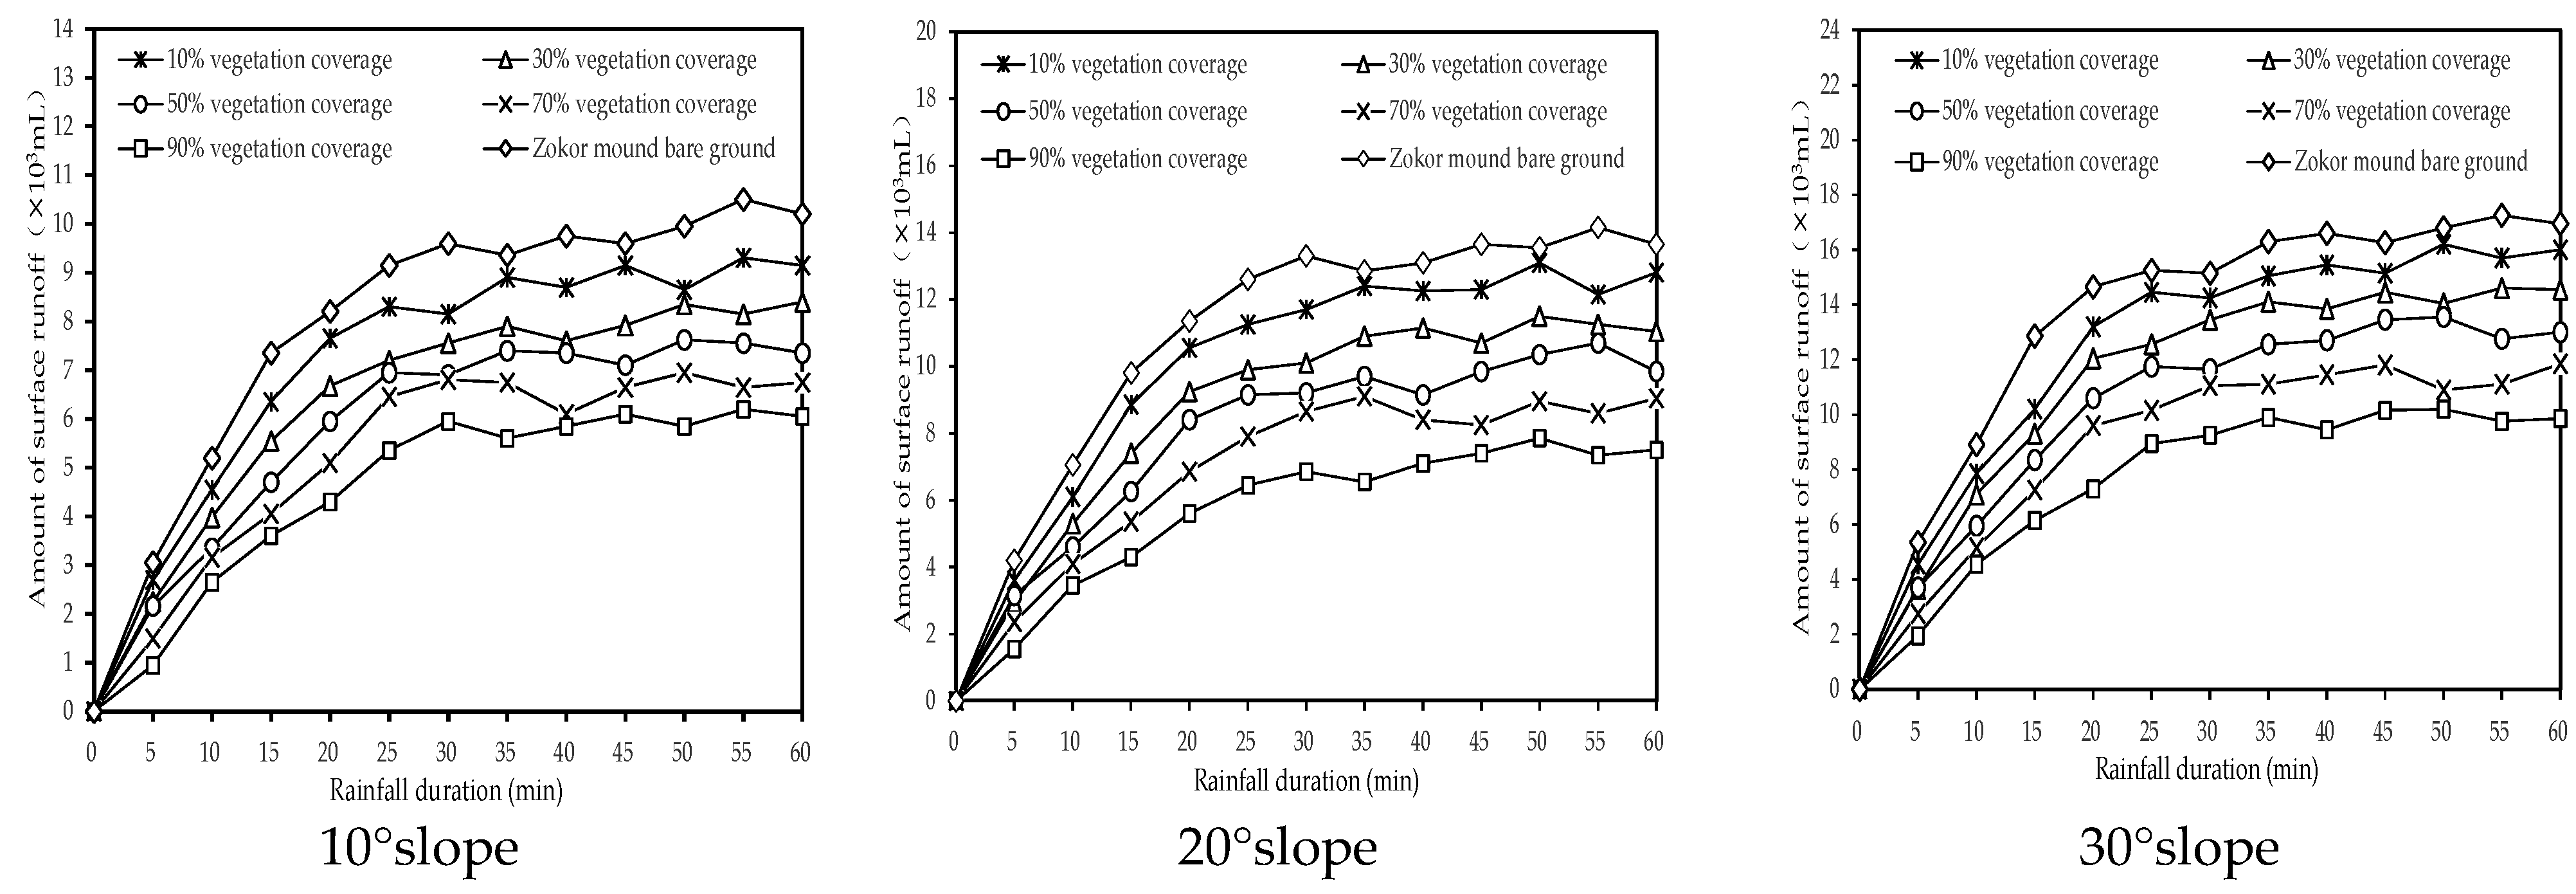
Soil erosion depends to some extent on the transport capacity of surface runoff. The relationship of surface runoff volume with vegetation coverage and the slope is consistent with the soil erosion rate, i.e., it increases with decreasing vegetation coverage and increasing slope (Figure 7). When the slope was 20°, the total runoff volume was 93.54%, 38.76% and 9.60% lower in the degraded bald patches with 90%, 50% and 10% vegetation coverage than in the zokor mound bare ground, respectively. When the slope was increased from 20° to 30°, the total runoff volume increased by 35.44%, 29.54%, 24.40%, and 23.73% for the 90%, 50% and 10% vegetation coverage degraded bald patches and zokor mound bare ground, respectively. Furthermore, the surface runoff volume of different types of bald patches was always exhibited a significant increasing phase (p < 0.05) during the first 25 min of continuous rainfall; however, when the runoff volume changed after 25 min of rainfall, the volume tended to stabilize and fluctuate. We believed that vegetation coverage can weaken the credibility of soil particles on the meadow surface by reducing the surface runoff; the steeper the slope, the more the rainwater converging on the surface is stimulated by the inertial force to stimulate the runoff phenomenon, and the ability of the runoff to carry and transport sediment is significantly enhanced under the effect of continuous high-intensity runoff scouring.

3.1.4. Relationship between Soil Erosion and the Degree of Meadow Degradation

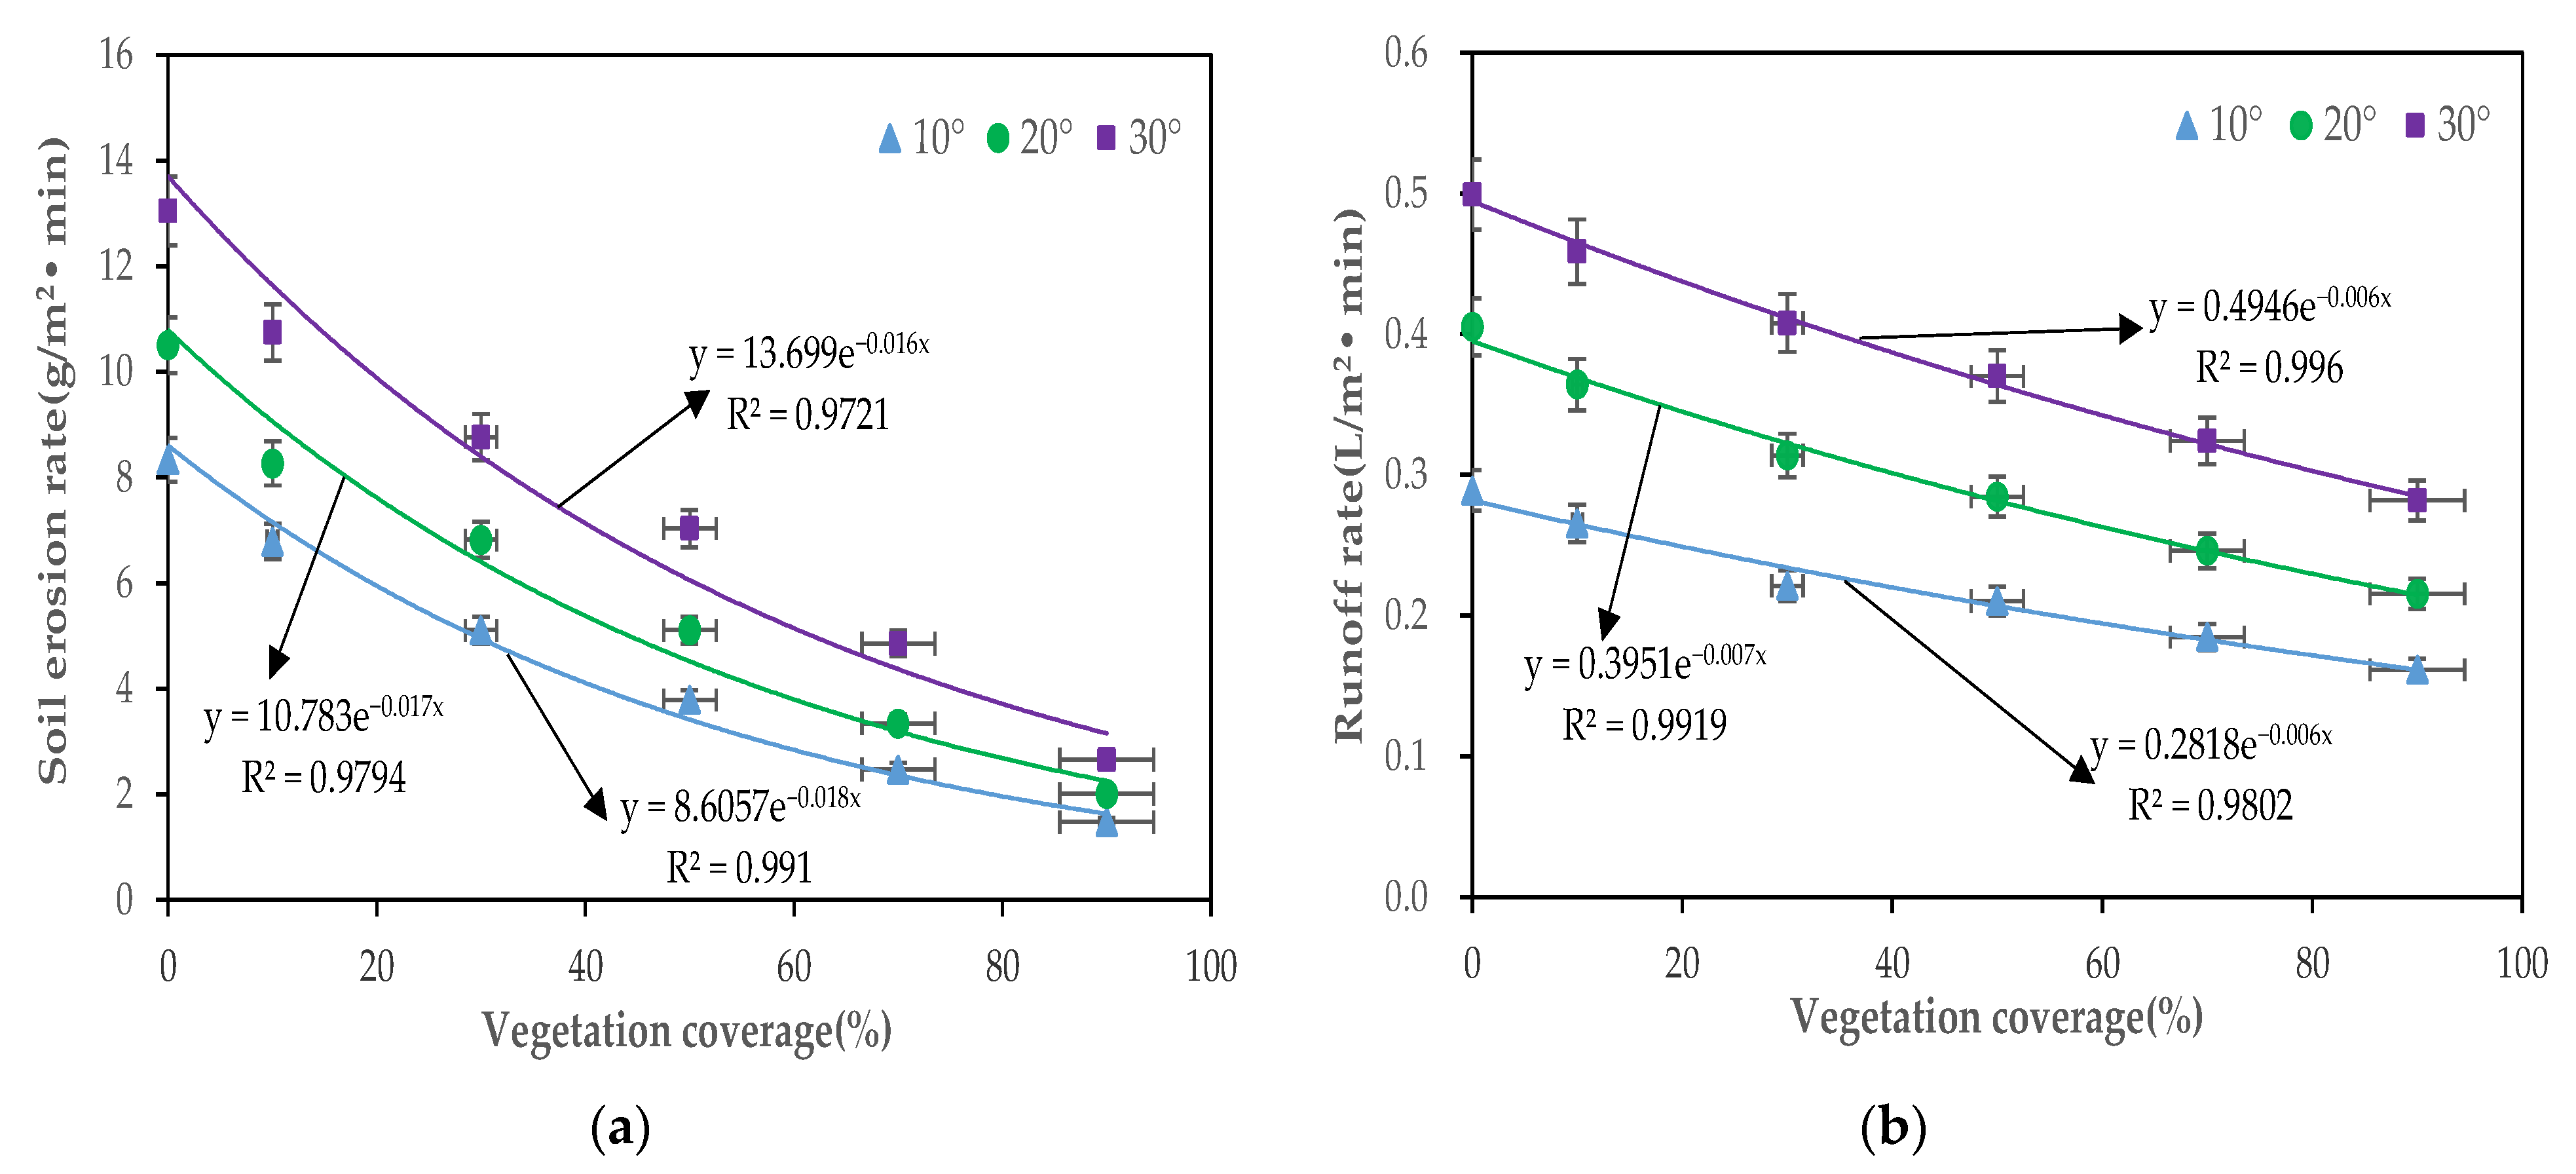
Figure 8 shows the relationship between runoff and soil erosion on the slope of different degraded bald patches and the degree of meadow degradation; the soil erosion rate and runoff rate are negatively correlated with vegetation coverage as an exponential function of y = ae−bx (p < 0.01) and increases with an increase in slope. Where a can be used as a sensitivity parameter to reflect the degree of runoff and sand production in degraded bald patches, a higher value of a indicates that the degree of soil runoff and sand production in degraded meadows is more serious.

3.2. Hydrodynamic Characteristics of Different Degraded Bald Patches

3.2.1. Flow Regime

The Reynolds number (Re) characterizes the flow pattern of slope flow, and a critical value of Re = 500 is used to discern whether the slope flow is laminar or turbulent. The results of this test showed that the ranges of Re were 37.70–87.29, 46.63–93.73 and 53.69–114.89 for 10°, 20° and 30° slopes, respectively, and all the slope flows under different test treatments were of laminar type according to the discrimination basis of open channel flow (Table 2). The Froude number (Fr) characterizes the flow state of the slope surface flow and is defined as turbulent flow when Fr > 1, critical flow when Fr = 1, and slow flow when Fr < 1. The range of Fr in this experiment was 0.161–0.413 (none exceeded 1), so all slope flows were judged as slow flows. The results of statistical analysis showed that both Re and Fr of degraded bald patches under different vegetation coverage and slope combination patterns were significantly different (p < 0.05). Re and vegetation coverage under the same slope was positively correlated as an exponential function (p < 0.01). In contrast, Fr and vegetation coverage were both linearly positively correlated (p < 0.01), both producing certain increments with increasing slopes (Table 3). This result shows that slope and vegetation coverage are important factors affecting the flow pattern of slope surface flow.

3.2.2. Runoff Resistance

Slope flow is inevitably affected by resistance during the flow process, and both the Darcy–Weisbach resistance coefficient (f) and the Manning roughness coefficient (n) can reflect the magnitude of resistance generated when flowing along the slope. As shown in Table 2, both f and n increase with an increase in vegetation coverage under different test treatments but decrease with an increase in slope. The range of f and n for different vegetation coverage treatments was 25.27–77.43 and 0.196–0.337, respectively, for the 10° slope, while the range of f and n decreased to 14.97–54.04 and 0.156–0.296, respectively, when the slope was increased to 30°. Statistical analysis revealed that f and n were significantly different (p < 0.05) under different experimental treatments, and were significantly affected by coverage and slope (two-way ANOVA, p < 0.05). Furthermore, both f and n increased exponentially as a function of vegetation coverage (p < 0.01) and decreased as a function of slope (Table 3), indirectly reflecting that vegetation coverage is less effective in suppressing slope flow on steeper slopes.

3.2.3. Runoff Shear Stress

Runoff shear stress (τ) is the main driving force that separates and transports soil particles from the ground surface. In this study, the values of τ ranged from 1.71–4.05 N m−2, 2.34–4.74 N m−2 and 2.61–5.27 N m−2 for different vegetation coverage at 10°, 20° and 30° slopes, respectively (Table 2). The τ was positively correlated with vegetation coverage as a linear function at the same slope (p< 0.01) and increased significantly when the slope increased under the same vegetation coverage (Table 3). In addition, the results of the analysis show that τ was significantly different (p < 0.05) among slopes with different vegetation coverages and a highly significant difference (p < 0.01) among slopes with the same vegetation coverage. Vegetation coverage and slope are important surface factors influencing τ; the effect of slope on τ was much greater than that of one vegetation coverage (two-way ANOVA, p < 0.05).

3.3. Relationship between Soil Erosion and Hydrodynamic Characteristics of Bald Patches with Different Degrees of Degradation

3.3.1. Regression Equation of the Soil Erosion Rate and Hydrodynamic Parameters

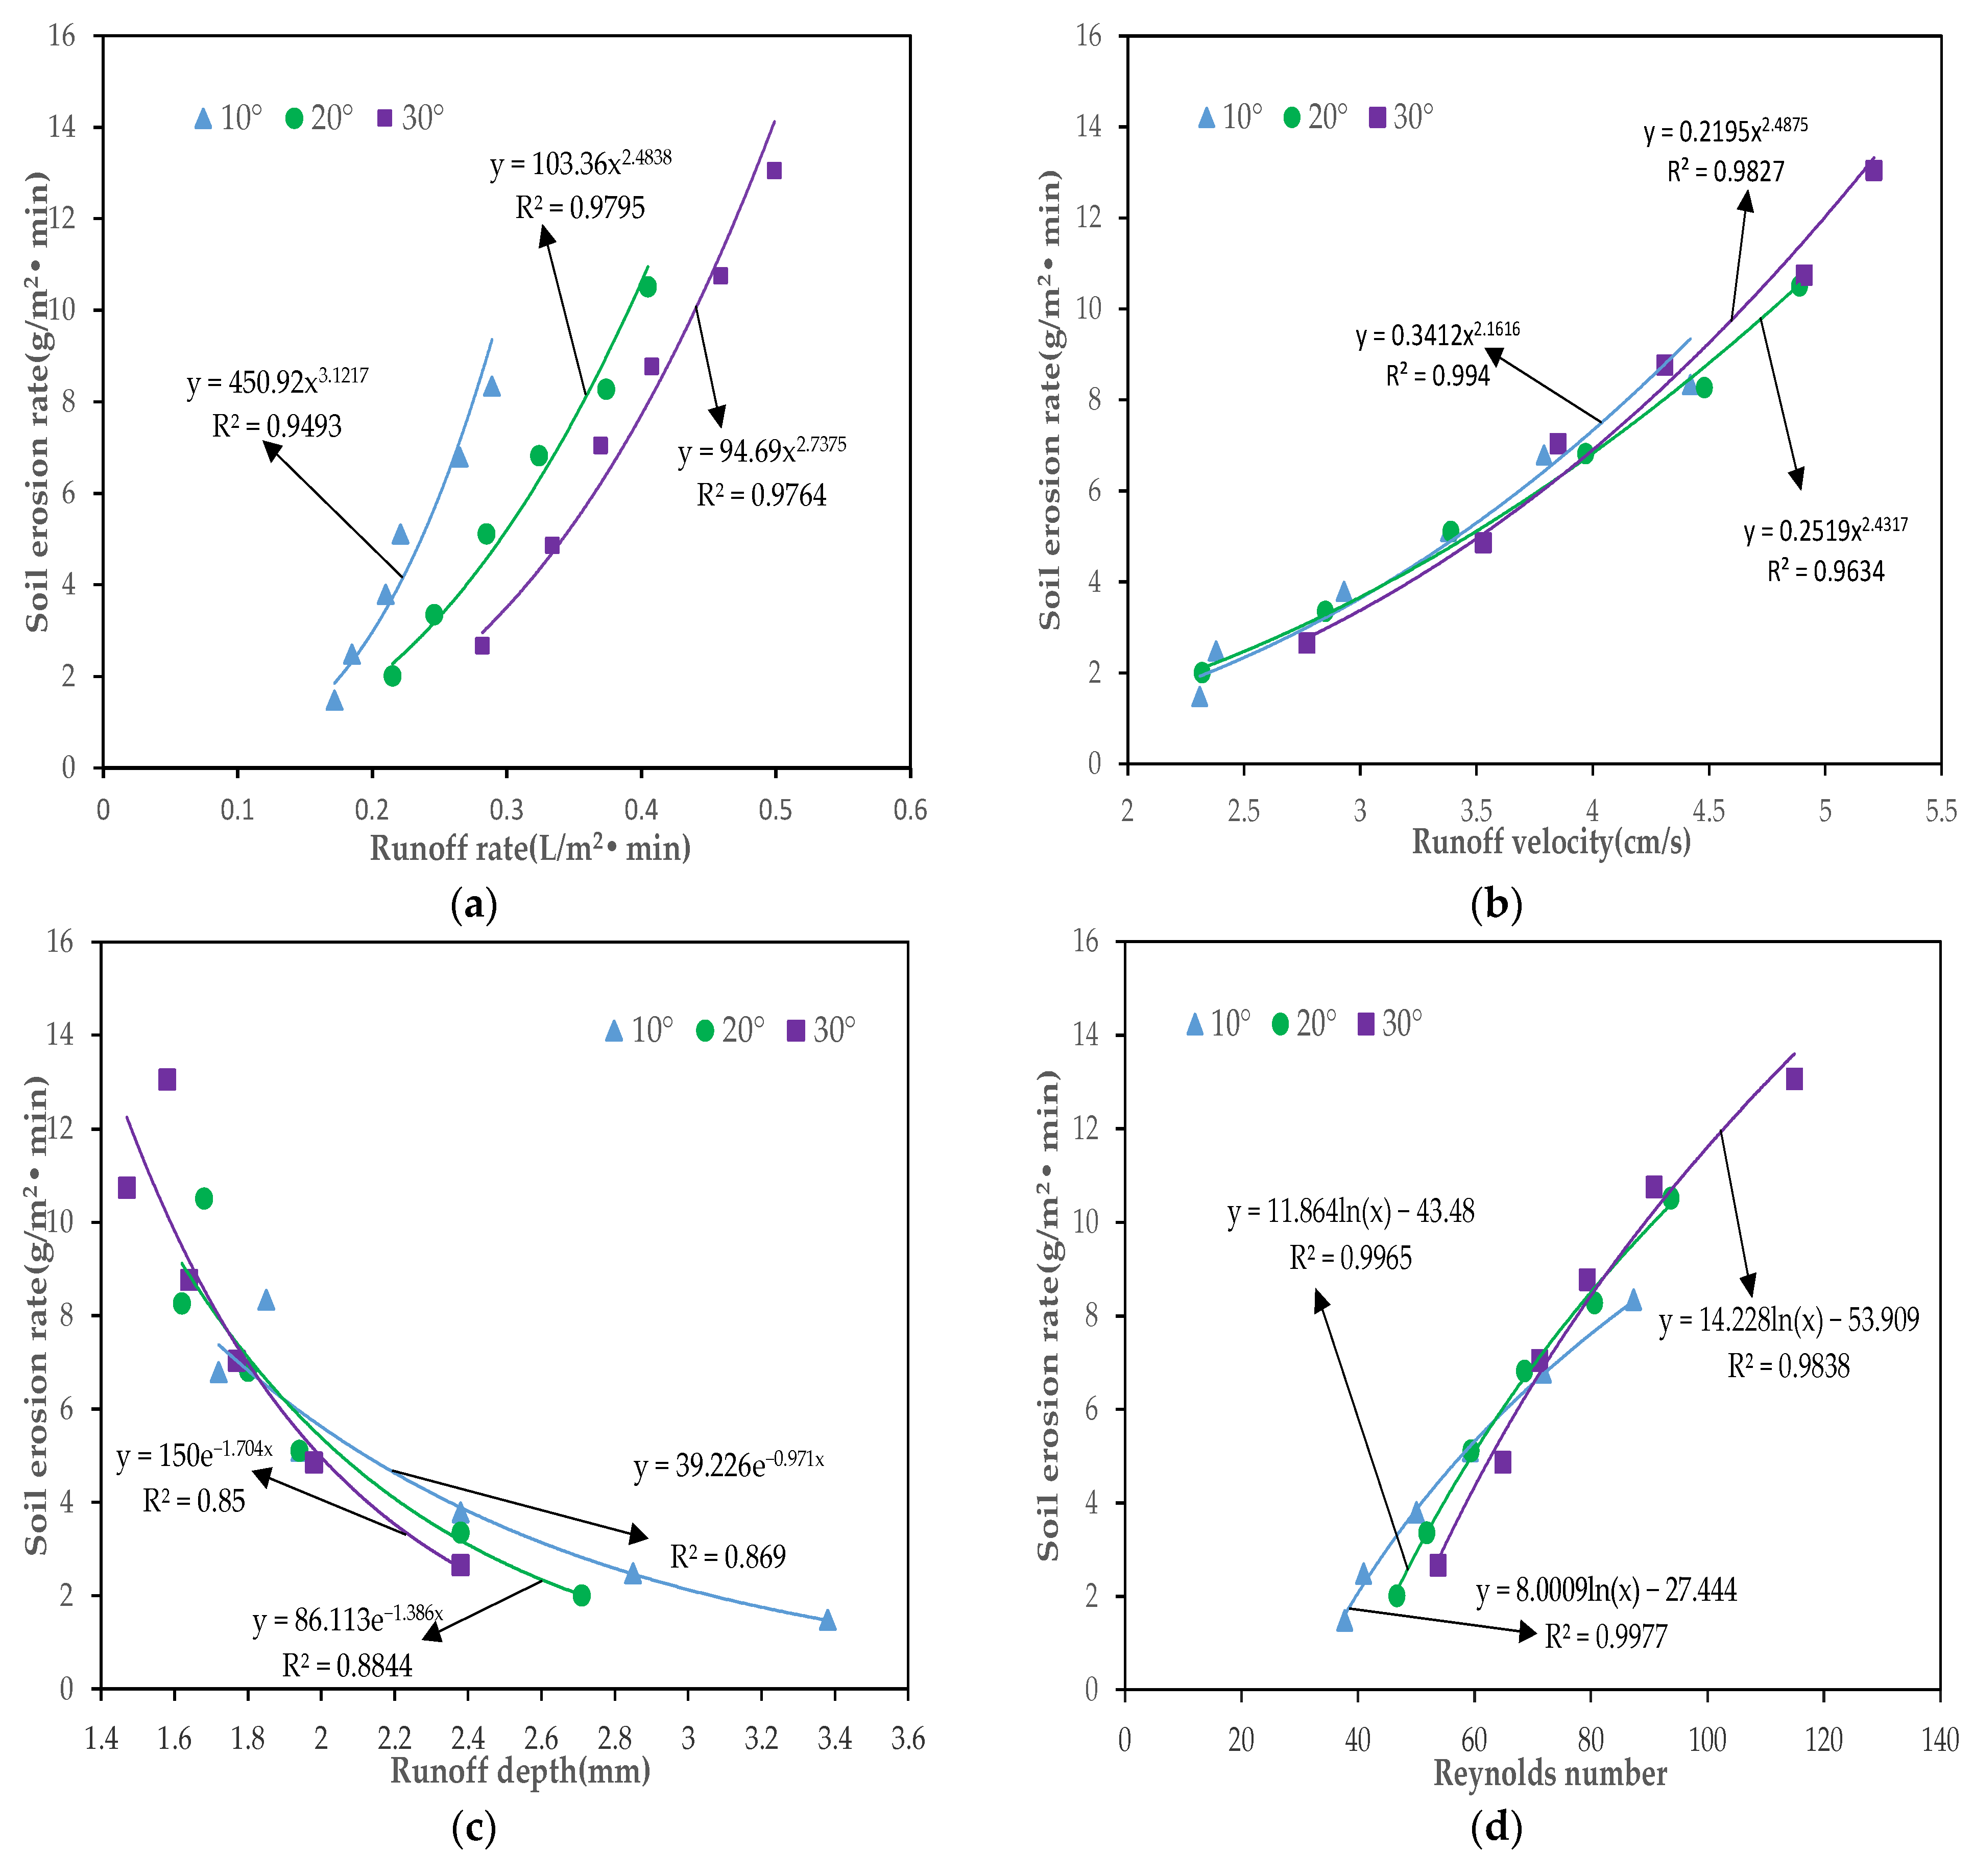
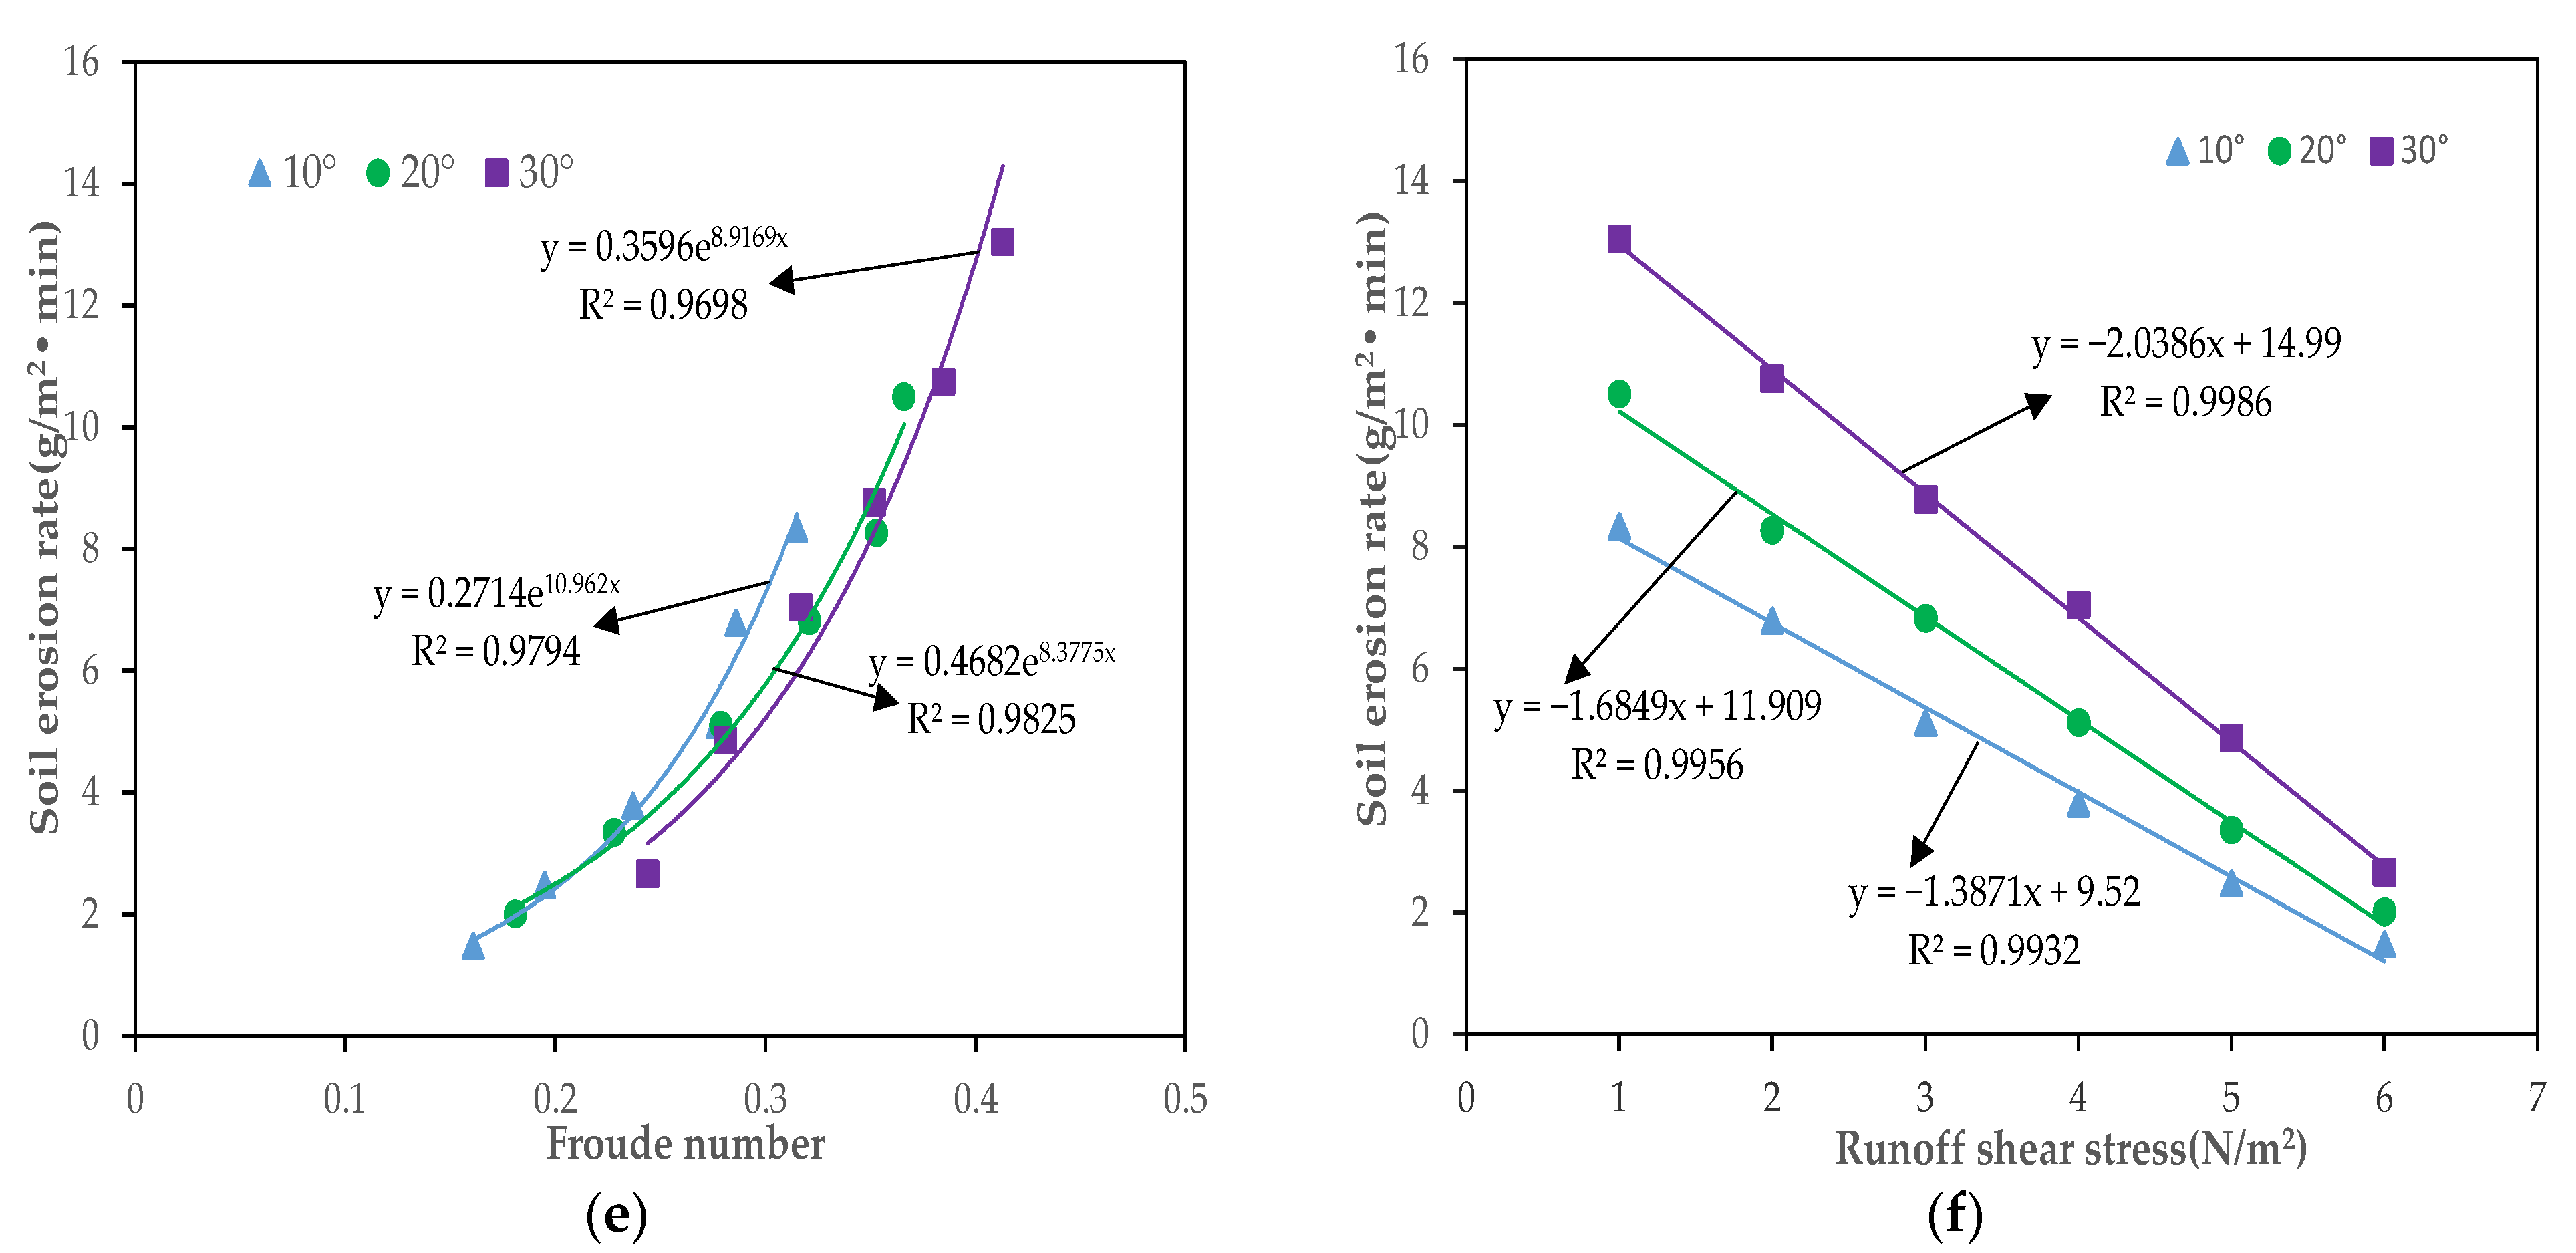
The regression equation between the average soil erosion rate and the average hydrodynamic parameters in bald patches with different degradation degrees was established (Figure 9). We found that the soil erosion rate was positively correlated with the runoff rate and runoff velocity as a power function (p < 0.01), the Reynolds number as a logarithmic function (p < 0.01), the Froude number as an exponential function (p < 0.01), the runoff depth as a negative exponential function (p <0.01), and a negative linear function with runoff shear stress (p < 0.01). However, no significant regular changes were observed with Darcy–Weisbach resistance and the Manning roughness coefficient.

3.3.2. Correlation Analysis of Soil Erosion Rate and Hydrodynamic Parameters

The results of the grey correlation analysis show that the correlation between RSE and each hydrodynamic parameter at different slopes was relatively obvious, among which RR, v, Re, and Fr had the highest correlation with RSE, with correlation values above 0.776, whereas VC, h, n, f and τ had the lowest correlation with RSE, with correlation values ranging from 0.497 to 0.673 (Table 4). Furthermore, the RSE showed highly significant positive correlations with RR, V, Re and Fr; highly significant negative correlations with VC and τ; and significant negative correlations with h, f, and n (Table 4). The results of the analysis indicate that there is a certain interaction between soil erosion and its hydrodynamic characteristics in degraded bald patches of alpine meadows; specifically, the reduction in vegetation coverage can significantly enhance the slope runoff capacity, and active surface runoff leads to the increased occurrence of soil erosion by promoting changes in hydrodynamic characteristics; this effect is more serious in steeper slopes.

4. Discussion

4.1. Comparison with Existing Similar Studies

Both vegetation coverage and slope are essential factors in determining soil erosion status and surface runoff characteristics. In this study, the range of values for the total soil loss in zokor mound bare ground was 433.70—739.94 g m−2 h−1. In contrast, Hou et al. [48] studied soil loss in cantharis meadows in northern China under the same rainfall intensity and found that the soil loss rates in bare meadows at 0°, 10° and 20° slopes were 58.84 g m−2 h−1, 102.38 g m−2 h−1 and 139.16 g m−2 h−1, respectively. In contrast, our result reflects the mechanical damage to meadow soil by rodent activity and the accumulation of large numbers of zokor mounds, which can increase soil erosion. In addition, the total soil loss was 80.88%, 51.06% and 23.36% lower in the degraded bald patches, with 90%, 50% and 10% vegetation coverage under a slope 30° more than zokor mound bare ground in this study, respectively. Our study shows that meadow vegetation contributes significantly to the erosion resistance of degraded bald patch soils, despite the steeper slope. Our result is in agreement with the research of He et al. [41], Shen et al. [42], and Wu et al. [49], who studied slopes with different vegetation coverages. The soil erosion rate peaked after about 25 min of continuous rainfall (Figure 6), whereas Sun et al. [50] concluded that the peak soil erosion rate of grassland with different numbers of patches occurred after about 20 min of rainfall under a 90 mm h−1 rainfall intensity. The analysis suggested that that result might be related to the soil, vegetation and topographic conditions in the test area on the one hand and mainly influenced by the rainfall characteristics on the other hand, i.e., higher rainfall intensity could complete the transport and loss of erodible soil particles in a shorter time by enhancing the scouring and erosion capacity of runoff, resulting in the peak soil erosion rate occurring sooner. Surface runoff is the primary driver of soil erosion on slopes. The runoff volume in this study showed a trend of a sharp increase followed by steady fluctuation with rainfall duration (Figure 7). This result is in agreement with the results reported by Li et al. [25], who studied alpine meadow sagebrush soils under different rainfall intensities; however, compared with this literature, only water erosion experiments under 30 mm h−1 rainfall intensity were conducted in the present study. Additional research on soil water erosion patterns of degraded alpine meadow bald patches under different rainfall intensities is warranted. The hydrodynamic characteristics of slope surfaces are an important area reflecting soil erosion processes. We concluded that runoff rate, flow velocity, the Reynolds number and Froude number can all describe the state of hydraulic erosion under soil erosion on slopes based on a combination of correlation and regression analysis, and tentatively determined that the Reynolds number is the most suitable hydrodynamic parameter to describe the soil erosion process. Our result is in agreement with the results reported by Sun et al. [44], who studied littered forested slopes. However, flow velocity, runoff shear stress and runoff power have also been suggested as suitable hydrodynamic parameters to describe the soil erosion process [51,52]. Our analysis shows that in addition to vegetation coverage and slope, differences in test methods, coverage characteristics and soil properties in different studies may have led to different results in understanding the interaction between slope flow hydrodynamic characteristics and soil hydrodynamic erosion processes. Further validation is needed regarding whether other hydrodynamic parameters accurately describe the soil hydro–erosion process. The interaction between soil erosion and hydrodynamic parameters is a possible direction for further investigation and research in the future, which may be influenced by factors such as vegetation landscape patterns, topographic micro-geomorphology and rainfall characteristics.

4.2. Effect of Vegetation Coverage and Slope on Hydrodynamic Characteristics

The processes by which vegetation coverage and slope gradient influence the hydrodynamic characteristics of slope flow are extremely complex. A correct understanding of their relationships at different scales can contribute to our understanding of soil erosion mechanisms. In the present study, we found that the Reynolds number and Froude number increase with a decrease in vegetation coverage and an increase in slope. By comparing the change of flow velocity under different vegetation coverages with the same slope (Table 3), we found that the flow velocity decreases exponentially with the vegetation coverage (p < 0.01). A decrease in flow velocity can directly affect the rapid and slow state of slope flow, resulting in a laminar state; reducing the turbulence of water flow. When the slope is steeper, the rainwater is subject to inertial force, resulting in active surface runoff by the higher runoff volume, the stronger the runoff capacity and the faster the flow velocity, which can significantly increase the Reynolds number and Froude number in the slope flow. Vegetation and slope are important surface characteristics that determine the magnitude of flow resistance. The Darcy–Weisbach resistance coefficient and the Manning roughness coefficient increase exponentially as a function of vegetation coverage and decrease linearly as a function of slope (Table 3). This phenomenon is mainly attributed to the fact that the slope flow under vegetation coverage can increase the flow resistance by increasing the energy consumption of water flow; the shapes of vegetation and the superposition effect of tree groups are both important influencing factors [53]. The slope affects the flow resistance, mainly by changing the runoff energy, i.e., the higher the slope, the higher the runoff energy; therefore, a driving effect under slope flow can significantly reduce the flow resistance. According to the analysis results, although the flow resistance is determined by the combined effect of vegetation coverage and slope, the inhibitory effect of vegetation is limited when the slope reaches a certain level. The runoff shear stress increases with an increase in vegetation coverage and slope, and we believed that when the vegetation coverage increases, the surface runoff continuously converges into a fine ditch cut along the ditch wall due to the enhanced infiltration capacity of rainfall, which, combined with the inhibitory and interception effects of vegetation, eventually leads to an increase in runoff depth and runoff shear stress, which is consistent with the views of Zhao et al. [54] and Zhang et al. [55]. In contrast, the effect of slope on runoff shear stress depends on the combined change of runoff depth and slope; an increase in slope can produce a certain increment in both flow velocity and flow rate in slope surface flow, resulting in a decrease in runoff depth. However, the contribution of runoff depth to the reduction in runoff shear stress is much smaller than the contribution of increasing slope to the increase in runoff shear stress (Table 2), which leads to an increase in runoff shear stress when the slope is steeper.

4.3. Implications of This Study for Sustainable Management of Meadow Ecosystems

The importance of vegetation for meadow degradation and soil erosion is self-evident. Many previous studies have provided a theoretical basis for the role of meadow vegetation in ecological protection and soil conservation [56,57]. This level of understanding provides a solid foundation for the sustainable management of meadow ecosystems [58,59]. However, the lack of understanding of the hydrodynamic mechanisms of soil erosion in degraded bald patches has led to deficiencies in the integrated assessment of sustainable management of alpine meadow ecosystems. Our study addresses this issue by incorporating the changes in soil erosion status and hydrodynamic characteristics under different vegetation coverage and slope combination forms. The results show that vegetation coverage and slope affect the soil erosion and hydrodynamic characteristics of degraded bald patches differently. The positive and negative correlation regions between soil erosion rate and hydrodynamic parameters were found to be interspersed, indirectly confirming the existence of an interaction between the two. This result is consistent with the findings of Ding et al. [60], Li et al. [61], and Yang et al. [62], with implications for the in-depth understanding of the soil hydraulic erosion mechanism and the interpretation of the soil sand production process on slopes. In addition, in terms of the amount of sand produced by slope erosion flow, significant differences were recorded (p < 0.05) between degraded bald patches under different vegetation coverage and slope combinations. To a certain extent, this indicates that the restoration of vegetation with a certain degree of coverage in alpine meadow areas alone may not be sufficient to inhibit soil erosion and further meadow degradation. Furthermore, soil erosion characteristics and hydrodynamic mechanisms must be integrated to enhance the conservation function of meadow vegetation soil and water. We suggest that vegetation restoration should be implemented by integrating different vegetation coverage and slope combinations to achieve sustainable management of meadow ecosystems in the Yellow River source area, rather than relying solely on vegetation type or coverage. In addition, highland rodent activity is an active factor in meadow degradation and soil erosion; the burrowing and gnawing behaviors of these animals seriously damage meadow ecosystems, especially in July and August every year, which is the concurrent period of heavy rainfall and concentrated mound creation by rodents, which can directly cause severe soil and water conservation and ecological environment management problems. Therefore, controlling the rodent population and mound density is also essential to promote the sustainable management of meadow ecosystems while restoring vegetation growth in degraded bald patches of alpine meadows.

5. Conclusions

In this study, rainfall erosion experiments were carried out under different vegetation coverage and slope combination patterns. The main findings are as follows:
  • Vegetation coverage and slope are significant factors affecting soil erosion in degraded bald patches, and soil erosion and runoff rates increase exponentially as a result of meadow degradation (p < 0.01). Rodent activity can increase soil erosion compared to vegetated slopes;
  • All slope flows are laminar, with Reynolds and Froude numbers decreasing exponentially and linearly, respectively, as a function of vegetation coverage (p < 0.01), both of which are positively correlated with slope gradients. The Darcy–Weisbach resistance and Manning roughness coefficients were found to be larger on densely vegetated and gently sloping surfaces and significantly affected by vegetation coverage and slope; (p < 0.05). Runoff shear stress is positively correlated with vegetation coverage and slope, with a greater effect on the slope than vegetation coverage (p < 0.05);
  • The relationship between soil erosion rate and flow velocity, Reynolds number, Froude number, and runoff shear stress can be described by power, logarithmic, exponential and linear functions, respectively (p < 0.01). Based on the Pearson correlation and grey correlation analysis results, we tentatively determined that the Reynolds number is the most suitable hydrodynamic parameter to describe the soil erosion process.
This study shows that rodent activity has exacerbated the formation of degraded bald patches, resulting in a dramatic reduction of meadow vegetation coverage, a reduction of slope runoff resistance, and an increase in surface runoff capacity and soil erosion rate. In order to effectively control soil erosion, we recommend that the ecological restoration of meadows in degraded bald patches should be carried out in conjunction with consideration of slope flow hydrodynamic characteristics and soil erosion mechanisms and that the intensity of rodent activity should be moderately controlled.

Author Contributions

Conceptualization, W.C.; Visualization, Y.L.; Supervision, X.H. Field investigations were a joint effort of S.T., G.L., J.Z., H.Z. (Hui Zhai) and J.L. Later, H.Z. (Haili Zhu) and Y.L. were responsible for field data collection and analysis, S.T. and G.L. wrote the manuscript, J.L. and X.L. contributed to both the review and editing of the manuscript. All authors have read and agreed to the published version of the manuscript.

Funding

This study was supported by the Basic Research Project of Qinghai Provincial Science and Technology Department (2021-ZJ-701) and the National Natural Science Foundation of China (U21A20191, 41662023, 42161068).

Institutional Review Board Statement

Not applicable.

Informed Consent Statement

Not applicable.

Data Availability Statement

Not applicable.

Acknowledgments

The authors thank the undergraduate students C.J., Y.L. and Y.L. for being responsible for field data collection; S.Y. from Auckland University for the insightful revision of the original manuscript and constructive guidance and valuable help; and the anonymous reviewers and editors for their valuable comments and guidance, which made significant contributions to the improvement of this paper.

Conflicts of Interest

The authors declare no conflict of interest.

References

  1. Flanagan, D.C.; Ascough, J.C., II; Nieber, J.L.; Misra, D.; Douglas-Mankin, K.R. Advances in Soil Erosion Research: Processes, Measurement, and Modeling. Trans. ASABE 2013, 56, 455–463. [Google Scholar] [CrossRef]
  2. Li, Q.; Yang, M.X.; Wan, G.N.; Wang, X.J. Spatial and temporal precipitation variability in the source region of the Yellow River. Environ. Earth Sci. 2016, 75, 594–602. [Google Scholar] [CrossRef]
  3. Wang, X.Y.; Yang, T.; Yong, B.; Valentina, K.; Shi, P.F.; Li, Z.Y.; Zhou, X.D. Impacts of climate change on flow regime and sequential threats to riverine ecosystem in the source region of the Yellow River. Environ. Earth Sci. 2018, 77, 465. [Google Scholar] [CrossRef]
  4. Lu, Z.B.; Song, Q.; Zhao, J.Y.; Wang, S.R. Prediction and Evaluation of Ecosystem Service Value Based on Land Use of the Yellow River Source Area. Sustainability 2022, 15, 687. [Google Scholar] [CrossRef]
  5. Jin, J.L.; Wang, G.Q.; Zhang, J.Y.; Yang, Q.L.; Liu, C.S.; Liu, Y.L.; Bao, Z.X.; He, R.M. Impacts of climate change on hydrology in the Yellow River source region, China. J. Water Clim. Chang. 2020, 11, 916–930. [Google Scholar] [CrossRef]
  6. Chen, Q.; Lu, Q.S.; Gao, Z.Q. Changes in Herdsmen’s Pastoral Behaviour Triggered by Rangeland Degradation in the Source Region of the Yellow River, Qinghai-Tibetan Plateau. Outlook Agric. 2015, 44, 81–87. [Google Scholar] [CrossRef]
  7. Yi, X.S.; Li, G.S.; Yin, Y.Y. The impacts of grassland vegetation degradation on soil hydrological and ecological effects in the source region of the Yellow River—A case study in Junmuchang region of Maqin country. Procedia Environ. Sci. 2012, 13, 967–981. [Google Scholar] [CrossRef]
  8. Li, X.L.; Zhang, Y.P.; Yan, H.R.; Salahou, M.K. Watershed-level spatial pattern of degraded alpine meadow and its key influencing factors in the Yellow River Source Zone of West China. Ecol. Indic. 2023, 146, 109865. [Google Scholar] [CrossRef]
  9. Brierley, G.; Li, X.L.; Fryirs, K.; Gao, J.; Shi, Y.; Preey, G.L.W.; Cullum, C. Degradation and recovery of alpine meadow catenas in the source zone of the Yellow River, Western China. J. Mt. Sci. 2022, 19, 2487–2505. [Google Scholar] [CrossRef]
  10. Li, Y.; Li, J.J.; Steven, A.K.; Huang, Z.G.; Yu, H.Q.; Zhang, Q.W. Livestock grazing significantly accelerates soil erosion more than climate change in Qinghai-Tibet Plateau: Evidenced from 137Cs and 210Pbex measurements. Agric. Ecosyst. Environ. 2019, 285, 106643. [Google Scholar] [CrossRef]
  11. Du, C.J.; Jing, J.; Shen, Y.; Liu, H.X.; Gao, Y.H. Short-term grazing exclusion improved topsoil conditions and plant characteristics in degraded alpine grasslands. Ecol. Indic. 2018, 108, 105680. [Google Scholar] [CrossRef]
  12. Li, X.L.; Gao, J.; Zhang, J. Natural and anthropogenic influences on the spatiotemporal change of degraded meadows in southern Qinghai Province, West China:1976–2015. Appl. Geogr. 2018, 97, 176–183. [Google Scholar] [CrossRef]
  13. Zhang, Y.; Ganjurjav, H.; Dong, S.K.; Gao, Q.Z. Excessive plant compensatory growth: A potential endogenous driver of meadow degradation on the Qinghai-Tibetan Plateau. Ecosyst. Health Sustain. 2020, 6, 1816500. [Google Scholar] [CrossRef]
  14. Li, G.R.; Li, X.L.; Li, J.F.; Chen, W.T.; Zhu, H.L.; Hu, X.S.; Zhou, H.K.; Sun, H.Q. Effects of degradation severity on the physical, chemical and mechanical properties of topsoil in alpine meadow on the Qinghai-Tibet Plateau, west China. Catena 2019, 187, 104370. [Google Scholar] [CrossRef]
  15. Che, R.X.; Wang, Y.F.; Li, K.X.; Xu, Z.H.; Hu, J.M.; Wang, F.; Rui, Y.C.; Li, L.F.; Pang, Z.; Cui, X.Y. Degraded patch formation significantly changed microbial community composition in alpine meadow soils. Soil Tillage Res. 2018, 195, 104426. [Google Scholar] [CrossRef]
  16. Lu, Y.X.; Li, X.B.; Dang, D.L.; Dou, H.S.; Wang, K.; Gong, J.R.; Wang, H.; Liu, S.L. A Perspective on the Impact of Grassland Degradation on Ecosystem Services for the Purpose of Sustainable Management. Remote Sens. 2022, 14, 5120. [Google Scholar] [CrossRef]
  17. Liu, S.L.; Zhang, Y.Q.; Cheng, F.Y.; Hou, X.Y.; Zhao, S. Response of Grassland Degradation to Drought at Different Time-Scales in Qinghai Province: Spatio-Temporal Characteristics, Correlation, and Implications. Remote Sens. 2017, 9, 1329. [Google Scholar] [CrossRef]
  18. Ma, L.; Yao, Z.S.; Zheng, X.H.; Zhang, H.; Wang, K.; Zhu, B.; Wang, R.; Zhang, W.; Liu, C.Y. Increasing grassland degradation stimulates the non-growing season CO2 emissions from an alpine meadow on the Qinghai-Tibetan Plateau. Environ. Sci. Pollut. Res. Int. 2018, 25, 26576–26591. [Google Scholar] [CrossRef]
  19. Pang, X.P.; Guo, Z.G. Plateau pika disturbances alter plant productivity and soil nutrients in alpine meadows of the Qinghai-Tibetan Plateau, China. Rangel. J. 2017, 39, 133–144. [Google Scholar] [CrossRef]
  20. Wu, R.X.; Chai, Q.; Zhang, J.Q.; Zhong, M.Y.; Liu, Y.H.; Wei, X.T.; Pan, D.; Shao, X.Q. Impacts of burrows and mounds formed by plateau rodents on plant species diversity on the Qinghai-Tibetan Plateau. Rangel. J. 2015, 37, 117. [Google Scholar] [CrossRef]
  21. Li, J.X.; Li, X.L.; Gao, J.; Shi, Y.; Ma, G.L.; Ka, Z.C.R. Influences of pika and simulated grazing disturbances on bare patches of alpine meadow in the Yellow River Source Zone. J. Mt. Sci. 2021, 18, 1307–1320. [Google Scholar] [CrossRef]
  22. Chen, Y.Y.; Yang, H.; Bao, G.S.; Pang, X.P.; Guo, Z.G. Effect of the presence of plateau pikas on the ecosystem services of alpine meadows. Biogeosciences 2022, 19, 4521–4532. [Google Scholar] [CrossRef]
  23. Wei, X.X.; Guo, Z.G. Effect of Plateau Pika Disturbance on Plant Aboveground Biomass of Alpine Meadows at Two Different Scales. Plants 2022, 11, 2266. [Google Scholar] [CrossRef]
  24. Yu, H.L.; Fan, J.W.; Li, Y.Z.; Shi, W.J. Effects of Myospalax baileyi disturbance on plant community at alpine meadow in Three Rivers Headwater Region, China. J. Appl. Ecol. 2018, 29, 1902–1910. [Google Scholar]
  25. Li, G.R.; Li, X.L.; Li, J.F.; Chen, W.T.; Zhu, H.L.; Zhao, J.Y.; Hu, X.S. Influences of Plateau Zokor Burrowing on Soil Erosion and Nutrient Loss in Alpine Meadows in the Yellow River Source Zone of West China. Water 2019, 11, 2258. [Google Scholar] [CrossRef]
  26. Li, J.Y. Evaluation of Soil and Water Conservation Function in Dingxi City, Upper Yellow River Basin. Water 2022, 14, 2919. [Google Scholar] [CrossRef]
  27. Jiang, X.J.; Zhu, X.; Yuan, Z.Q.; Li, X.G.; Liu, W.J.; Zakari, S. Lateral flow between bald and vegetation patches induces the degradation of alpine meadow in Qinghai-Tibetan Plateau. Sci. Total Environ. 2021, 751, 142338. [Google Scholar] [CrossRef]
  28. Liu, B.Y.; Xie, Y.; Li, Z.G.; Liang, Y.; Zhang, W.B.; Fu, S.; Yin, S.Q.; Wei, X.; Zhang, K.L.; Wang, Z.Q.; et al. The assessment of soil loss by water erosion in China. Int. Soil Water Conserv. Res. 2020, 8, 430–439. [Google Scholar] [CrossRef]
  29. Zhang, C.; Zhou, A.F.; Zhang, H.X.; Zhang, Q.; Zhang, X.N.; Sun, H.L.; Zhao, C. Soil Erosion in Relation to Climate Change and Vegetation Coverage over the Past 2000 years as inferred from the Tianchi lake in the Chinese Loess Plateau. J. Asian Earth Sci. 2019, 180, 103850. [Google Scholar] [CrossRef]
  30. Dugan, I.; Bogunovic, I.; Pereira, P. Soil management and seasonality impact on soil properties and soil erosion in steep vineyards of north-western Croatia. J. Hydrol. Hydromech. 2023, 71, 91–99. [Google Scholar] [CrossRef]
  31. Ali, A.A.; Alabbadi, A.M.; Jabbar, F.K.; Alzahrani, H.; Hamad, S. Predicting Soil Erosion Rate at Transboundary Sub-Watersheds in Ali Al-Gharbi, Southern Iraq, Using RUSLE-Based GIS Model. Sustainability 2023, 15, 1776. [Google Scholar] [CrossRef]
  32. Wang, Y.X.; Ran, L.S.; Fang, N.F.; Shi, Z.H. Aggregate stability and associated organic carbon and nitrogen as affected by soil erosion and vegetation rehabilitation on the Loess Plateau. Catena 2018, 167, 257–265. [Google Scholar] [CrossRef]
  33. Lu, W.J.; Wang, W.G.; Shao, Q.X.; Yu, Z.B.; Hao, Z.C.; Xing, W.Q.; Yong, B.; Li, J.X. Hydrological projections of future climate change over the source region of Yellow River and Yangtze River in the Tibetan Plateau: A comprehensive assessment by coupling RegCM4 and VIC model. Hydrol. Process. 2018, 32, 2096–2117. [Google Scholar] [CrossRef]
  34. Yan, D.; Lai, Z.H.; Ji, G.X. Using Budyko-Type Equations for Separating the Impacts of Climate and Vegetation Change on Runoff in the Source Area of the Yellow River. Water 2020, 12, 3418. [Google Scholar] [CrossRef]
  35. Han, Y.P.; Chen, Z.T.; Xiao, H. Projection in Extreme Climate Events and uncertainty analysis in the Source Area of the Yellow River for the Next Three Decades. IOP Conf. Ser. Earth Environ. Sci. 2018, 199, 022024. [Google Scholar] [CrossRef]
  36. Iqbal, M.; Wen, J.; Wang, S.P.; Tian, H.; Adnan, M. Variations of precipitation characteristics during the period 1960–2014 in the Source Region of the Yellow River, China. J. Arid Land 2018, 10, 388–401. [Google Scholar] [CrossRef]
  37. Xie, X.Q.; Wang, X.K.; Wang, Z.F.; Lin, H.; Xie, H.L.; Shi, Z.Y.; Hu, X.T.; Liu, X.Z. Influence of Landscape Pattern Evolution on Soil Conservation in a Red Soil Hilly Watershed of Southern China. Sustainability 2023, 15, 1612. [Google Scholar] [CrossRef]
  38. Qian, D.W.; Du, Y.G.; Li, Q.; Guo, X.W.; Fan, B.; Cao, G.M. Impacts of alpine shrub-meadow degradation on its ecosystem services and spatial patterns in Qinghai-Tibetan Plateau. Ecol. Indic. 2022, 135, 108541. [Google Scholar] [CrossRef]
  39. Samarin, M.; Zweifel, L.; Roth, V.; Alewell, C. Identifying Soil Erosion Processes in Alpine Grasslands on Aerial Imagery with a U-Net Convolutional Neural Network. Remote Sens. 2020, 12, 4149. [Google Scholar] [CrossRef]
  40. Chen, M.Y.; Ma, L.; Shao, M.A.; Wei, X.R.; Jia, Y.H.; Sun, S.C.; Zhang, Q.Y.; Li, T.C.; Yang, X.; Gan, M. Chinese zokor (Myospalax fontanierii) excavating activities lessen runoff but facilitate soil erosion—A simulation experiment. Catena 2021, 202, 105248. [Google Scholar] [CrossRef]
  41. He, Z.M.; Xiao, P.Q.; Yu, X.X.; Hao, S.L.; Jia, G.D.; Yang, C.X. A Field Study for the Effects of Grass Coverage, Rainfall Intensity and Slope Length on Soil Erosion in the Loess Plateau, China. Water 2022, 14, 2142. [Google Scholar] [CrossRef]
  42. Shen, H.O.; Ma, R.M.; Ye, Q.; Feng, J.; Wang, J.H. Impacts of Corn Straw Coverage and Slope Gradient on Soil Erosion and Sediment Size Distributions in the Mollisol Region, NE China. Eurasian Soil Sci. 2021, 54, 2000. [Google Scholar] [CrossRef]
  43. Li, X.; Zhang, Y.F.; Ji, X.D.; Strauss, P.; Zhang, Z.Q. Effects of shrub-grass coverage on the hillslope overland flow and soil erosion under simulated rainfall. Environ. Res. 2022, 214, 113774. [Google Scholar] [CrossRef]
  44. Sun, J.M.; Fan, D.X.; Yu, X.X.; Li, H.Z. Hydraulic characteristics of varying slope gradients, rainfall intensities and litter coverage on vegetated slopes. Hydrol. Res. 2018, 49, 506–516. [Google Scholar] [CrossRef]
  45. Jiang, P.; Yu, Z.B.; Yuan, F.F.; Acharya, K. The Multi-Scale Temporal Variability of Extreme Precipitation in the Source Region of the Yellow River. Water 2019, 11, 92. [Google Scholar] [CrossRef]
  46. Zhao, Q.; Li, D.; Zhuo, M.; Guo, T.; Liao, Y.; Xie, Z.J.S.E.R.; Assessment, R. Effects of rainfall intensity and slope gradient on erosion characteristics of the red soil slope. Stoch. Environ. Res. Risk Assess. 2015, 29, 609–621. [Google Scholar] [CrossRef]
  47. An, J.; Zheng, F.; Lu, J.; Li, G. Investigating the Role of Raindrop Impact on Hydrodynamic Mechanism of Soil Erosion Under Simulated Rainfall Conditions. Soil Sci. 2012, 177, 517–526. [Google Scholar] [CrossRef]
  48. Hou, G.R.; Bi, H.X.; Huo, Y.M.; Wei, X.Y.; Zhu, Y.J.; Wang, X.X.; Liao, W.C. Determining the optimal vegetation coverage for controlling soil erosion in Cynodon dactylon grassland in North China. J. Clean. Prod. 2020, 244, 118771. [Google Scholar] [CrossRef]
  49. Wu, G.L.; Liu, Y.F.; Cui, Z.; Liu, Y.; Shi, Z.H.; Yin, R.; Kardol, P. Trade-off between vegetation type, soil erosion control and surface water in global semi-arid regions: A meta-analysis. J. Appl. Ecol. 2020, 57, 875–885. [Google Scholar] [CrossRef]
  50. Sun, R.X.; Ma, L.; Zhang, S.H.; Yu, Y.; Shen, M.S.; Zhang, H.B.; Wang, D.S.; Yang, Y.B.; Zhang, J.A.; Zhang, Y.Z.; et al. Study on Landscape Patches Influencing Hillslope Erosion Processes and Flow Hydrodynamics in the Loess Plateau of Western Shanxi Province, China. Water 2020, 12, 3201. [Google Scholar] [CrossRef]
  51. Yuan, H.D.; Xin, Z.B.; Jiang, Q.L.; Yu, X.X.; Fan, D.X. Slope erosion and its hydrodynamic characteristic of Cinnamon soil under continuous rainfull. Soil Water Conserv. 2020, 34, 14–20+30. [Google Scholar]
  52. Bai, Y.; Kang, H.L.; Wang, W.L.; Su, H.; Li, J.M.; Ma, C.Y. Characteristics of gully topography and sediment on the platform-steep slope system of spoil dump. Agric. Eng. 2022, 38, 81–90. [Google Scholar]
  53. Pan, C.Z.; Shangguan, Z.P. Runoff hydraulic characteristics and sediment generation in sloped grassplots under simulated rainfall conditions. J. Hydrol. 2006, 331, 178–185. [Google Scholar] [CrossRef]
  54. Zhao, Q.H.; Zhang, Y.F.; Xu, S.S.; Ji, X.Y.; Wang, S.Q.; Ding, S.Y. Relationships between Riparian Vegetation Pattern and the Hydraulic Characteristics of Upslope Runoff. Sustainability 2019, 11, 2966. [Google Scholar] [CrossRef]
  55. Zhang, S.Y.; Liang, Z.Q.; Xie, Z.Y.; Zhuo, M.N.; Liao, Y.S.; Guo, T.L.; Li, D.Q. Mechanisms of grass in slope erosion control in red soil region of southern China. J. Soil Water Conserv. 2016, 30, 1–5. [Google Scholar]
  56. Xu, Y.D.; Dong, S.K.; Shen, H.; Xiao, J.N.; Li, S.; Gao, X.X.; Wu, S.N. Degradation significantly decreased the ecosystem multifunctionality of three alpine grasslands: Evidences from a large-scale survey on the Qinghai-Tibetan Plateau. J. Mt. Sci. 2021, 18, 357–366. [Google Scholar] [CrossRef]
  57. Rana, S.; Cheng, X.N.; Wu, Y.F.; Hu, C.W.; Jemin, R.S.; Liu, Z.; Wang, Y.M.; Cai, Q.F.; Geng, X.D.; Guo, X.M.; et al. Evaluation of soil and water conservation function in the Wugong mountain meadow based on the comprehensive index method. Heliyon 2022, 8, e11867. [Google Scholar] [CrossRef]
  58. Liu, L.L.; Wei, C.; Shao, Q.Q.; Huang, L.; He, T. Characteristics of Land Use/Cover and Macroscopic Ecological Changes in the Headwaters of the Yangtze River and of the Yellow River over the Past 30 Years. Sustainability 2016, 8, 237. [Google Scholar] [CrossRef]
  59. Gu, X.Y.; Jia, Z.R.; Yang, Y.Y.; Wu, D.S.; Li, J.P. Research on Dynamic Rotational Grazing Assignment Model based on Grass Resource Leveling. Procedia Comput. Sci. 2019, 162, 696–703. [Google Scholar]
  60. Ding, W.F.; Li, M. Effects of grass coverage and distribution patterns on erosion and overland flow hydraulic characteristics. Environ. Earth Sci. 2016, 75, 477. [Google Scholar] [CrossRef]
  61. Li, C.J.; Pan, C.Z. Overland runoff erosion dynamics on steep slopes with forages under field simulated rainfall and inflow. Hydrol. Process. 2020, 34, 1794–1809. [Google Scholar] [CrossRef]
  62. Yang, S.; Gao, Z.L.; Li, Y.H.; Niu, Y.B.; Su, Y.; Wang, K. Erosion control of hedgerows under soils affected by disturbed soil accumulation in the slopes of loess plateau, China. Catena 2019, 181, 104079. [Google Scholar] [CrossRef]
Figure 1. Geographical location of the study area.
Sustainability 15 08165 g001
Figure 2. Photographs taken in the study area from different perspectives: (a) healthy meadow; (b) degenerated bald patches; (c) zokor mounds; (d) surface characteristics of zokor mounds in the vegetation succession stage.
Sustainability 15 08165 g002
Figure 3. (a) Schematic diagram of water corrosion test box; (b) growth of vegetation in a single group of water erosion test boxes.
Sustainability 15 08165 g003
Figure 4. Schematic diagram of the field simulation rainfall device. Note: 1. water supply tank; 2. water pump; 3. transmission pipe; 4. rainfall intensity regulator; 5. guide pipe; 6. rainfall nozzle; 7. water erosion test box; 8. runoff sediment inflow hole; α is the slope.
Sustainability 15 08165 g004
Figure 5. Comparison of total soil loss from degraded bald patches under different vegetation coverages and slopes. Note: different capital letters indicate significant differences between different slopes with the same vegetation coverage (p < 0.05), and different lowercase letters indicate significant differences between different vegetation coverages on the same slope (p < 0.05).
Sustainability 15 08165 g005
Figure 6. Changes in soil erosion rate of degraded bald patches under different vegetation coverages and slopes.
Sustainability 15 08165 g006
Figure 7. Variation of runoff volume with rainfall time under different vegetation coverages and slopes.
Sustainability 15 08165 g007
Figure 8. (a) Relationship between soil erosion rate and vegetation coverage; (b) relationship between runoff rate and vegetation coverage.
Sustainability 15 08165 g008
Figure 9. (a) Relationship between the soil erosion rate and the runoff rate. (b) Relationship between the soil erosion rate and the runoff velocity. (c) Relationship between the soil erosion rate and the runoff depth. (d) Relationship between the soil erosion rate and the Froude number. (e) Relationship between the soil erosion rate and the Reynolds number. (f) Relationship between the soil erosion rate and the runoff shear stress.
Sustainability 15 08165 g009aSustainability 15 08165 g009b
Table 1. Basic characteristics of degraded meadow soils and the distribution of soil particle size classes.
Degraded Meadow TypesMoisture ContentDensityPorosityFirmnessCohesionLess Than a Certain Soil Particle Size (%)
(%)(g m−3)(%)(kPa)(kPa)d < 2 mmd < 0.5 mmd < 0.075 mm
Degraded bald patches15.16 ± 2.081.51 ± 0.1511.38 ± 0.1425.6 ± 2.3826.61 ± 3.2475.2648.978.15
Zokor mound bare ground9.35 ± 1.751.43 ± 0.1114.34 ± 0.1610.21 ± 2.1512.56 ± 1.1288.7959.728.88
Table 2. Hydrodynamic characteristics of degraded bald patches under different vegetation coverages and slopes.
Slope
(°)
Vegetation
Coverage (%)
Flow Velocity
(v, cm s−1)
Runoff Depth
(h, mm)
Reynolds Number
(Re)
Froude Number (Fr)Darcy–Weisbach Resistance (f)Manning Roughness (n)Flow Shear Stress (τ, N m−2)
10°04.42 ± 0.17 Ca1.85 ± 0.21 Ade87.29 ± 29.83 BCa0.315 ± 0.060 Ca25.27 ± 6.58 Ae0.211 ± 0.046 Ade1.71 ± 1.07 Cf
10%3.79 ± 0.20 Cb1.72 ± 0.12 Ae71.82 ± 24.27 Cb0.286 ± 0.054 Cb29.52 ± 8.28 Ae0.196 ± 0.039 Ae2.32 ± 0.98 Ce
30%3.38 ± 0.22 Cc1.94 ± 0.22 Ad59.23 ± 22.60 Cc0.277 ± 0.053 Cbc44.78 ± 13.95 Ac 0.233 ± 0.056 Ad2.67 ± 0.99 Cd
50%2.93 ± 0.18 Cd2.38 ± 0.23 Ac50.01 ± 19.80 Cd0.237 ± 0.050 Cd36.24 ± 11.09 Ad0.258 ± 0.063 Ac3.56 ± 1.04 Cc
70%2.38 ± 0.22 Ce2.85 ± 0.31 Ab40.96 ± 17.48 Ce0.195 ± 0.040 Ce56.77 ± 17.44 Ab0.292 ± 0.071 Ab3.92 ± 1.05 Cab
90%2.31 ± 0.20 BCf3.38 ± 0.25 Aa37.70 ± 16.53 Ce0.161 ± 0.032 BCf77.43 ± 26.35 Aa0.337 ± 0.090 Aa4.05 ± 1.11 Ca
20°04.89 ± 0.24 Ba1.68 ± 0.15 Be93.73 ± 32.78 Ba0.366 ± 0.078 Ba23.25 ± 5.40 ABde0.187 ± 0.038 Be2.34 ± 2.07 Bf
10%4.48 ± 0.28 Bb1.62 ± 0.17 Ade80.60 ± 29.50 Bb0.353 ± 0.063 Bab22.17 ± 5.90 Be0.188 ± 0.034 ABe2.98 ± 1.82 Be
30%3.97 ± 0.25 Bc1.80 ± 0.19 ABd68.53 ± 26.11 Bc0.321 ± 0.065 Bc28.72 ± 7.61 Bd0.208 ± 0.043 Bd3.42 ± 1.95 Bd
50%3.39 ± 0.24 Bd1.94 ± 0.18 Bc59.35 ± 24.57 Bd0.279 ± 0.060 Bd39.32 ± 10.49 ABc0.239 ± 0.051 Bc4.08 ± 1.96 Bc
70%2.85 ± 0.24 Be2.38 ± 0.24 Bb51.78 ± 20.33 Bde0.228 ± 0.054 Be51.08 ± 17.17 ABb0.297 ± 0.068 Ab4.48 ± 2.23 Bb
90%2.32 ± 0.28 Bf2.71 ± 0.12 Ba46.63 ± 19.93 ABef0.181 ± 0.040 Bf63.05 ± 25.36 Ba0.313 ± 0.080 Ba4.74 ± 2.23 Ba
30°05.21 ± 0.24 Aa1.58 ± 0.10 Bd114.89 ± 34.60 Aa0.413 ± 0.084 Aa20.81 ± 3.70 Bcd0.171 ± 0.029 BCd2.61 ± 2.73 Af
10%4.81 ± 0.23 Ab1.47 ± 0.18 ABd90.80 ± 30.06 Ab0.385 ± 0.087 Ab18.97 ± 4.3 BCd0.156 ± 0.031 Ce3.24 ± 2.92 Ae
30%4.31 ± 0.23 Ac1.64 ± 0.15 Bcd79.36 ± 29.42 Ac0.352 ± 0.091 Ac21.02 ± 5.28 Ccd0.168 ± 0.035 Cde3.77 ± 3.16 Ad
50%3.85 ± 0.23 Ad1.77 ± 0.14 Cc71.16 ± 27.35 Acd0.317 ± 0.081 Ad26.86 ± 7.64 Cc0.201 ± 0.044 Cc4.34 ± 3.19 Ac
70%3.53 ± 0.25 Ae1.98 ± 0.20 Cb64.84 ± 23.96 Ad0.281 ± 0.073 Ae39.74 ± 11.11 Cb0.243 ± 0.052 Bb4.68 ± 3.33 Ab
90%2.77 ± 0.21 Af2.38 ± 0.26 Ca53.69 ± 31.78 Ae0.244 ± 0.068 Af54.05 ± 15.48 Ca0.296 ± 0.063 Ca5.27 ± 3.45 Aa
Note: the data in the table represent averages ± standard error (SE). Different capital letters indicate significant differences between different slopes with the same vegetation coverage (p < 0.05), and different lowercase letters indicate significant differences between different vegetation coverages with the same slope (p < 0.05).
Table 3. Relationship between vegetation coverage and hydrodynamic parameters at different slopes.
Hydrodynamic ParametersVegetation Coverage (%)
10°20°30°
Flow velocity (v, m s−1)y = 4.2189e−0.007x (R2 = 0.9726)y = 4.9502e−0.008x (R2 = 0.9938)y = 5.2721e−0.007x (R2 = 0.9833)
Reynolds number(Re)y = 81.165e−0.009x (R2 = 0.9709)y = 88.789e−0.008x (R2 = 0.9778)y = 104.66e−0.007x (R2 = 0.9278)
Froude number(Fr)y = −0.0017x + 0.3146 (R2 = 0.9796)y = −0.0018x + 0.4081 (R2 = 0.9976)y = −0.0021x + 0.3746 (R2 = 0.9900)
Darcy–Weisbach resistance coefficient(n)y = 26.143e0.0113x (R2 = 0.9021)y = 21.158e0.0122x (R2 = 0.9911)y = 17.387e0.0114x (R2 = 0.9396)
Manning roughness coefficient(n)y = 0.1972e0.0057x (R2 = 0.9695)y = 0.1742e0.0077x (R2 = 0.9608)y = 0.1514e0.0067x (R2 = 0.9236)
Runoff shear stress(τ, N m−2)y = 0.0264x + 1.9382 (R2 = 0.9447)y = 0.026x + 2.5893 (R2 = 0.9628)y = 0.0276x + 2.8333 (R2 = 0.9781)
Note: x: vegetation coverage; y: hydrodynamic parameters.
Table 4. Correlation analysis of the soil erosion rate and hydrodynamic parameters.
Slope(°)SDVCRRvhReFrfnτ
10°Grey correlation 0.4970.7760.8120.6150.8440.7960.6400.6380.599
Pearson correlation−0.998 **0.993 **0.994 **−0.914 *0.993 **0.971 **−0.895 *−0.931 **−0.987 **
Sig.(2-tailed)0000.01100.0010.0160.0070
20°Grey correlation 0.5080.8300.8480.6580.8420.840.5900.6380.636
Pearson correlation−0.989 **0.997 **0.994 **−0.916 *0.993 **0.974 **−0.946 **−0.917 *−0.996 **
Sig.(2-tailed)0000.0100.0010.0040.010
30°Grey correlation 0.5090.8190.8280.6730.8450.8160.6120.6460.647
Pearson correlation−0.994 **0.998 **0.992 **−0.910 *0.974 **0.998 **−0.901 *−0.905 *−0.997 **
Sig.(2-tailed)0000.0120.00100.0140.0130
Note: all values in the table are based on the mean analysis of each parameter. VC = vegetation coverage, RSE = soil erosion rate, RR = runoff rate, v = runoff velocity, h = runoff depth, Re = Reynolds number, Fr = Froude number, f = Darcy–Weisbach resistance coefficient, n = Manning roughness coefficient, τ = runoff shear. Different asterisks indicate statistically significant differences; ** indicates a highly significant correlation (p < 0.01); * indicates a significant correlation (p < 0.05).
Disclaimer/Publisher’s Note: The statements, opinions and data contained in all publications are solely those of the individual author(s) and contributor(s) and not of MDPI and/or the editor(s). MDPI and/or the editor(s) disclaim responsibility for any injury to people or property resulting from any ideas, methods, instructions or products referred to in the content.