Article

Connected Vehicles and Digital Infrastructures: A Framework for Assessing the Port Efficiency

by
Orlando Marco Belcore
,
Massimo Di Gangi
and
Antonio Polimeni
*
Department of Engineering, University of Messina, 98166 Messina, Italy
*
Author to whom correspondence should be addressed.
Sustainability 2023, 15(10), 8168; https://doi.org/10.3390/su15108168
Submission received: 13 April 2023 / Revised: 12 May 2023 / Accepted: 16 May 2023 / Published: 17 May 2023
(This article belongs to the Special Issue Looking Back, Looking Ahead: Vehicle Sharing and Sustainability)

Abstract

:
In logistics and freight distribution, scheduling and cost efficiency are two crucial issues for transportation companies that look with favour at the innovation introduced by Intelligent Transportation Systems (ITS). Moreover, an infrastructure level of service, safety and environmental defence are important for planners and public administrations. In this sense, terminal capacity and landside operations at the maritime infrastructure represent an interesting task for the community. Thus, this paper contributes to the research by: (i) proposing a generic framework for the integration of autonomous and connected vehicles with physical infrastructures; (ii) evaluating the opportunity to manage traffic arrivals according to vehicles’ priority and testing the effects of the introduction of a buffer zone outside the maritime port; (iii) improving efficiency and security within the terminal area by reducing waiting time and avoiding interference between flows. Moreover, the proposal for a discrete-event simulation model to assess terminal capacity in a ro-ro terminal is presented. Therefore, the paper contributes to some critical aspects towards sustainable development. First, regarding policy measures and actions, it proposes a valuable tool to assess what-if scenarios. Secondly, it represents a step forward in the process of smart corridor design for freight vehicles; in fact, it proposes a tool for managing landside operations at maritime ports and focuses on intervention in solving specific barriers and bottlenecks for freight who cross a ro-ro terminal daily. Furthermore, it offers a viable solution for managing connected vehicles in a context where full automation still needs to be achieved. The results evidenced the framework’s capability to deal with the traffic demand, thus improving the efficiency of the terminal landside operations.

1. Introduction

Since the spread of the e-market, consumers’ behaviours have widely changed, thus influencing traffic freight flows [1,2,3]. Concerning freight logistics, a declared objective of the European Community regards the transfer of 30% of road and combined road–rail freight to short sea shipping [4]. Moreover [5], a competitive advantage emerged in using maritime services instead of the road for freight flows. Thus, disruption management for freight flows became a critical issue in our economies. In this sense, the maritime infrastructure and operations efficiency within the terminal area represents a crucial point in logistics corridors for the ro-ro terminals. Ro-ro traffic activities and maritime port operations represent an interesting field of research for freight distribution and passenger mobility. In 2021 in Italy [6], ro-ro terminals accounted for 6,299,321 units (trucks and semi-trailers), with an increase of 23% compared to 2020 (5,113,112 units) and 11% compared to 2019 (5,618,282 units); in this sense the integration between physical and digital infrastructure as well as the management system of the port results of interest in optimizing freight distribution.
Ordinary disruptions may be caused by interfering operations, traffic conditions or other events. Deviation from the fixed scheduling causes consumer dissatisfaction and affects infrastructure efficiency. Moreover, truck companies are susceptible to delays, and this sensitivity increases when fleets and cargoes have to deal with perishable products. Transportation companies look favourably to innovation introduced by automated vehicle fleets and coordination and control introduced by connectivity [7]. On the other side, operators and public administration who deal with the impacts of distributive logistics (pollution, traffic jams, accidents, safety and security, level of services) must maintain active corridors, also offering satisfactory development conditions to the area. In light of this evidence, as directive 2010/40/EU and the “5G Action Plan” indicated, technological innovations derived from connectivity and information open the path for integrating new mobility solutions in every transport sector. Moreover, developing the latest Advanced Driver Assist Systems (ADAS) generation signed the path toward on-road vehicle automation or full automation [8,9]. In accordance with the Society of Automobile Engineers (SAE) standards, SAE J3016 [10], the automated vehicles classification includes five levels. Levels 1 and 2 provide some support features for driving; on the contrary, a system capable of performing the entire dynamic driving task comprises classes 3 up to 5. Vehicles autonomously drive at levels four and five, taking over human actions. The progressive introduction of driver assistance and automated vehicles will favour the development of a digital infrastructure capable of interacting with users and operators. In the smart road domain, the intention is to develop a dedicated short-range communication system (DSCR) for the full implementation of digitization through communication protocols, such as Vehicle-to-Vehicle (V2V) and Vehicle-to-Infrastructure (V2I), thus improving traffic safety, convenience and energy efficiency [11,12]. Communication among vehicles vouches for awareness, platooning strategy for trailer trucks and heavy goods vehicles and cooperative manoeuvres. On the other hand, communication with infrastructure enables information, instructions and negotiation [13]. The best departure time, optimal route, flow regulation, optimal speed and density can be managed, also delivering information on the best time to recharge in accordance with the timetable and log way trips [14]. Thus, in general, connected vehicles (automated and connected) have the potential to increase infrastructure capacity and harmonize traffic conditions.
This paper defines a further step towards integrating communication systems and digital technologies into physical infrastructures. It specifically deals with traffic conditions in a maritime port that offers high-frequency services. It points out how physical infrastructures may benefit from communication and control protocols and real-time monitoring offered by cloud edge systems, thus letting public administration and terminal operators achieve greater efficiency and reducing direct and side effects connected with ordinary flow disruptions. The proposed solution, by performing a discrete-event simulation, reproduced landside activities that are carried out in a maritime port and suggested the benefits, in a long-term perspective, derived by the integration of a semi-automated and centralized management system as a flexible tool for forecasting and management, thus regulating arrivals and reducing waiting time inside the infrastructure. This work contributes by proposing a general framework for regulation and planning to monitor the system, prevent congestion. It does not only rely on infrastructural interventions, but also includes coordination in transport logistics as the primary solution to congestion and inefficiencies reduction, thus further meeting the goals for less consumption of land and financial resources. However, a direct assessment of costs is out of the scope of this work which is mainly aimed at improving the performance of landside operations at the terminal.
Resuming, the purposes of paper consist in:
  • proposing a generic architecture to integrate information technology into physical infrastructures;
  • suggesting a generic framework to deal with incoming demand at the terminal infrastructure;
  • testing a solution to improve terminal efficiency operations on the landside;
  • testing the capability of the system to deal with the demand using synthetic performance indicators;
  • studying a valuable tactical solution to manage both automated/connected and traditional vehicles.
The structure of the paper includes a section (Section 2) dedicated to the most relevant literature in the field of simulation and optimization for port terminal operations. Section 3 is dedicated to the proposed framework; Section 4 focuses on results obtained from the pilot test; and Section 5 discusses the main findings connected with the output from the model and enhances future development.

2. Literature Review

The necessity to move to full automation in freight logistics is higher than in passengers to limit the power force and costs and achieve better performance on time and numbers of deliveries. In the future, automation will represent the standard among all carriers [7]. Consequently, autonomous commercial vehicles such as trucks are expected to be available before autonomous cars for individuals; therefore, autonomous driving in the maritime terminal is expected to materialize soon [15]. Nevertheless, this expectation could be delayed, and approximation may suffer from different degrees of market penetration. The 100% full automation still represents a far-distant future. Till today, close to a mind-off transition period, concepts of integrating autonomous freight vehicles into traffic systems require separated traffic lines, free route choice or fixed paths in mixed traffic conditions [16]. Furthermore, safety issues must be quoted as one of the most questioned spots regarding acceptance rates for connectivity. Ports, cities and authorities have a role in developing the context where autonomous and connected vehicles may operate. Then [16], main challenges to be tackled concern infrastructural requirements, regulations, data protection and communication protocols.
The context of maritime terminals has interested many researchers who focused on several approaches to test and increase performance at the terminal. The approaches vary for the analytical method and the degree of granularity, however discrete-event simulation (DES), in general, has always represented a popular approach among researchers [17], and many studies focus on its application in solving phenomena related to the management of maritime terminals. In the field of ro-ro terminals (albeit in a much smaller way), discrete-event simulation has been of interest to a wider audience of researchers who dealt with the management of landside and seaside arrivals; to optimize scheduling and allocations problems so long as in a ro-ro terminal, trailer trucks and vehicles cannot usually be stacked for limited spaces and due to the nature of the trips and freight on board. Preston et al. [18] by means of DES, tested the residual capacity in the e-roll-on-roll-off ferry port located in Dover (UK). The simulation approach was used to organize what-if scenarios under the hypothesis of ordinary disruptions and increasing demand. As KPI, the author utilized both queue time at the gate and pollutant emissions. Iannone et al. [19] assessed the impact of managerial decisions about loading, unloading and storage allocation. They conducted a discrete-event simulation assessing for each alternative the economic impact of each alternative and pollutant emissions. Kaceli [20] used simulation in the contest of a ro-ro terminal to predict planning scenarios and determine the necessary infrastructural needs. Even more, as stated by Ozkan et al. [21], ro-ro terminal operations specifically needed a focus on timetable coordination and scheduling, thus integrating different levels of communication. As a consequence of this, at least three variables of interest resulted: the number of trucks arriving at terminals, the distance between terminals and Ro-Ro ship capacity. Abourraja et al. [22,23] discussed the problem of flexibility in decision-making in the context of a ro-ro terminal. In it, they proposed a generic framework to be used as a tool for specific decision support models at the terminal. The assessing method was addressed utilizing different KPIs, such as workload, time and distance. Park et al. [24] proposed an automated solution with the use of Automatic Guided Vehicles (AVG) for a ro-ro terminal. The model analyzed the economic benefits of introducing AVGs, thus assessing the achieved level of productivity. Varying the number of available AVGs, the queue time was used as KPI to optimize the number of vehicles and average waiting time. Muravev et al. [25] mainly focused on DES as an operative tool to test the effectiveness of the proposed solution. They modelled the operation for a ro-ro terminal using two different software packages (Arena and AnyLogic) and considered model scalability. Finally, Sharif et al. [26] focused their work on environmental sustainability linked to the queuing time at the maritime port. The experimental analyses were carried out by means of an agent-based approach to reproduce daily activities in the terminal areas. Output stated that live information and operation coordination and routing info might reduce the effects of congestion. Parola and Sciomachen [27] focused on logistics chain sustainability and evaluated the performance of a multimodal container port. The simulation problem was implemented with the aim of measuring congestion phenomena in the road and rail network. Coordination among the different stakeholders resulted in being the main goal to pursue to favour a modal re-equilibrium, whereas van Vianen et al. [28], considering the case of intermodal transport, developed a DES model to schedule stackers’ operations (for example, assigning the stacker to a ship or to a train). Handling and operative time were used as KPI to assess the achieved performance with a specific layout solution.
On the other hand, container ports, in general, have always represented the most interesting field of application due to the higher level of transport demand and daily operation. In this sense, truck control arrivals and the management of yard slot allocations were widely debated among academics. For example, Jovanocic [29] designed a TAS in the context of two container ports (Los Angels and Seattle (USA). A scheduling problem is defined in it, and the corresponding integer programming model is developed from the truck driver’s perspective to increase user satisfaction. Similarly, Azab et al. [30] developed a TAS to achieve a higher level of workload. The proposed algorithm evaluated the best truck arrivals schedule to minimize the total costs of both the terminal and the trucking companies. Performances were tested by measuring truck turnaround time and length of queues. Furthermore, Neagoe et al. [31] used a DES, developed in Python, to simulate and to assess the introduction of a TAS in a container port located in Australia. As output, the impacts of congestion (truck queue and emissions), also concerning the increasing of terminal activities, were measured. The performance indicators were multiple (truck turn-around times, waiting times, turnaround time reliability and engine idling emissions). Nadi et al. [32] introduced an advisory-based time slot management system (TSMS) to control truck arrivals. In it, discrete choice modelling is used to analyze the expectations and preferences of the truck operating companies. Then stated preferences are used to shift track arrival in the off-peak period. The DES is applied to assess the effectiveness of the designed TSMS. Srisurin et al. [33] simulated daily activities within the terminal area to assess terminal capacity in terms of handling, allocation and where house options. Performance was tested under six scenarios whose nature varies from tactical measures to planning policies and solutions. A further detail of granularity was of interest to Schoroer et al. [34], who developed an Inter Terminal Transport system in the terminal of Rotterdam accounting for different solutions and machines. Both priority and first-in-first-out (FIFO) strategies were tested during the simulation, and mean delay per ride was used as KPI to test the effectiveness of the configuration.
Infrastructural planning and terminal capacity are crucial topics, and several researchers focused on productivity. Rusca et al. [35] utilized discrete-event simulation for investigating performance in a container port through berthing capacity and for operative planning of logistic processes under different arrivals flows. Carteni and De Luca [36] addressed port container performance through simulation of the handling activities. Results validation was carried out for short- and long-term planning horizons by evaluating local and global performance indicators. Cimpeanu et al. [37] introduced DES to predict and evaluate long-term planning performance by assessing berth occupancy and financial costs of the investment for a container port in Ireland. Finally, Li et al. [38] dealt with the disruption for both land and sea-side. The resilience of the terminal is addressed in terms of total truck waiting time and idling emissions. DES was conducted to test achieved performance in terms of sensitivity analysis, whereas Alvarez et al. [39] obtained progressive planning and decisions on how to allocate berth space by assessing the potential benefits of new berthing policies. The DES was used to model the environment and subsystem characteristics, operations and performance indicators (for the land-side equipment, contractual agreements and associated penalties and berthing policies). Triska et al. [40] also dealt with port capacity assessment. The simulation was carried out with the Monte Carlo technique and tested in a DES model. The authors studied economic and operational criteria for the port capacity (berths, storage slots and truck gates). The gate performance and the optimum number of the server were at the basis of the works developed by Guan and Liu [41,42]. The paper applied a multi-server queuing model to analyze marine terminal gate congestion and an optimization model was developed to balance gate operation costs and truckers’ waiting time. The introduction for a truck appointment system resulted as the best option to introduce.
An agent-based approach at the basis of the planning and capacity of the system for both Assumma and Vitetta [43] who simulated loading and unloading operations and Fleming et al. [44] who focused on pooled queue strategies. Finally, concerning traffic at the maritime port, several researchers focus on TAS only simulating terminal process recurring to the Genetic Algorithm (GA) and the Queue theory [45,46,47,48,49].
Table 1 synthetically reports main feature of the previous work concerning performance and simulation methods for both ro-ro and container terminals.

3. Architecture and Operational Framework

3.1. Development of a General Architecture

Overall, in a long-term perspective, the general architecture presented in the following paragraphs should be considered as a management tool at the services of the public administration and terminal operators to manage ordinary processes and emergencies [50,51]. The architecture is therefore designed to manage four specific aspects such as priority and negotiation, routing info, gate info and yard occupation as follows:
  • the transport companies send their daily plan to the terminal operator, pointing out the nature of the freight (dangerous, perishable, general merchandise, ...); they have to confirm the number of trucks, the platoon scheme, the desired shipping company and the naval service to board on;
  • vehicles receive routing information from smart road devices installed in the corridors and the terminal cloud system through a communication protocol, the same reports about traffic conditions around the infrastructure, queue estimation in the buffer area, vessel approaching and final direction;
  • the planned route, the next vessel berthing and available space are stored in the system; moreover, to avoid long waiting, the system coordinates approaching and manoeuvres as well corridors assignment;
  • the terminal area is provided with a stable cloud monitoring system equipped with roadside units and an optimization traffic control system that enables communication highlighting yard occupation (of the buffer area) and the number of vehicles waiting for the embankment.
As a primary step towards this integration, this paper focuses on developing an operational framework to manage arrivals in the terminal whose primary aim is to improve the efficiency of landside operation to reduce waiting time in the system.

3.2. Operation Framework

The terminal environment may be described through its physical and information flows and considering the operational decision dimension. The port represents the kernel, a smart-port infrastructure able to communicate with upcoming vehicles’ fleets and vessels by utilizing short-range units (SRU) and a cloud monitor system. Thus, to monitor traffic conditions, the comprehensive architecture will imply the presence of SRU in main roads and nearby areas; as well as at the terminal area. Information will be delivered through messages concerning routing info (corridors to the gate) and speed advice based on current traffic conditions and queue length at the terminal.
The general framework is reported in Figure 1; in it, the whole system is represented by sharing between two subsystems: the external buffer zone, and the port terminal wherein the cloud monitoring systems operate and manage operations. Vehicles approaching the terminal area follow information from variable message signals and traffic controls along the ramps. Once the terminal ramps are approached, the registration operations start with diverting flows distinguishing into traditional vehicles and autonomous and connected vehicles. Assuming that the autonomous and connected vehicles booked the service in advance, they are addressed to a dedicated corridor (corridor A). After the check-in gate, automated/connected vehicles move along the corridor until an internal buffer where they wait to embark (vehicles in this area are embarked first). Note that the term corridor is broadly used; it refers generically to several lanes leading to different check-in gates. Then, the general idea is that after completing the checking operation, each vehicle is assigned to a specific corridor by employing a set of variable message signals, thus preventing it from mixing with other flows. The automated/connected fleets must arrange their work plans at least a day before; confirming the plan allows them to have the services booked in advance and be served with priority approaching the terminal area. Concerning the traditional vehicles, they are addressed to a buffer zone: if the service has been pre-booked, the vehicles stop in the corridor B waiting to be called for embark. If not (not-booked), they have to queue up to book the naval service. Then they pass to corridor B and wait for the call. Buffer zones are configured as waiting areas. A buffer zone lets the terminal operator organise platoons with priorities. During these phases, convoys receive information on the following stages of operations and can check the boarding; variable messages send them instructions on approaching routes in the terminal, and electronic signals offer the operator to organise flows with no interference. After check-in, the traditional vehicles move in the terminal (in the assigned corridor), and a percentage of them will be directed to the security controls area. Then they queue up to wait for boarding. Through communication, the cloud system provides the carriers with information on traffic conditions in the corridor, terminal buffer area and service operations status. At each stage, information from the land-side and sea-side will be updated to determine each subsystem’s status. On the sea-side, the communication system lets to know the approaching manoeuvres for the vessel. Once the berthing process ends, the unloading phases start and on the land-side the first group of incoming vehicles is stored in the yard area, ready to receive the green light to reach the vessel. The priority queue (vehicles in the internal buffer) starts the embankment. Outside the terminal, vehicles stored in the buffer zone receive the signal to pass through the gate and proceed along the assigned corridor.

4. Simulation Test

4.1. General Approach

The maritime terminal represents an extremely complex environment, mostly due to the uncertainty of the variables involved, such as vehicle arrivals and fluctuation in demand, coordination of the shipping companies, as well as interference with the urban traffic in the nearby area. The general approach introduced here, through the discrete-event simulation, addresses the critical issues related to port operations. It represents a general approach in modelling system operations by simulating activities over time. Vehicles arriving at the terminal represent the demand for service, vessels the available maritime resources and the buffer area and yard the landside resources where to organize queues in which the different vehicles wait before performing their next activity. Once an activity occurs, the systems proceed to a new status, and the different entities’ positions are updated. The proposed tool seeks to simulate the impacts of priority regulation, figuring out the introduction of automated vehicles. Moreover, it represents a general architecture for a decision-making tool in maritime terminals. The following description represents the case study of ordinary day-by-day decision planning and tries to minimize the waiting time of vehicles before embarking and the number of vehicles waiting in the area. Furthermore, the tool tests the effect of introducing an external buffer zone whose main scope is organizing platoons according to priority and reducing the number of waiters in the inner area, thus preventing congestion phenomena and interference between flows.

4.2. Case Study

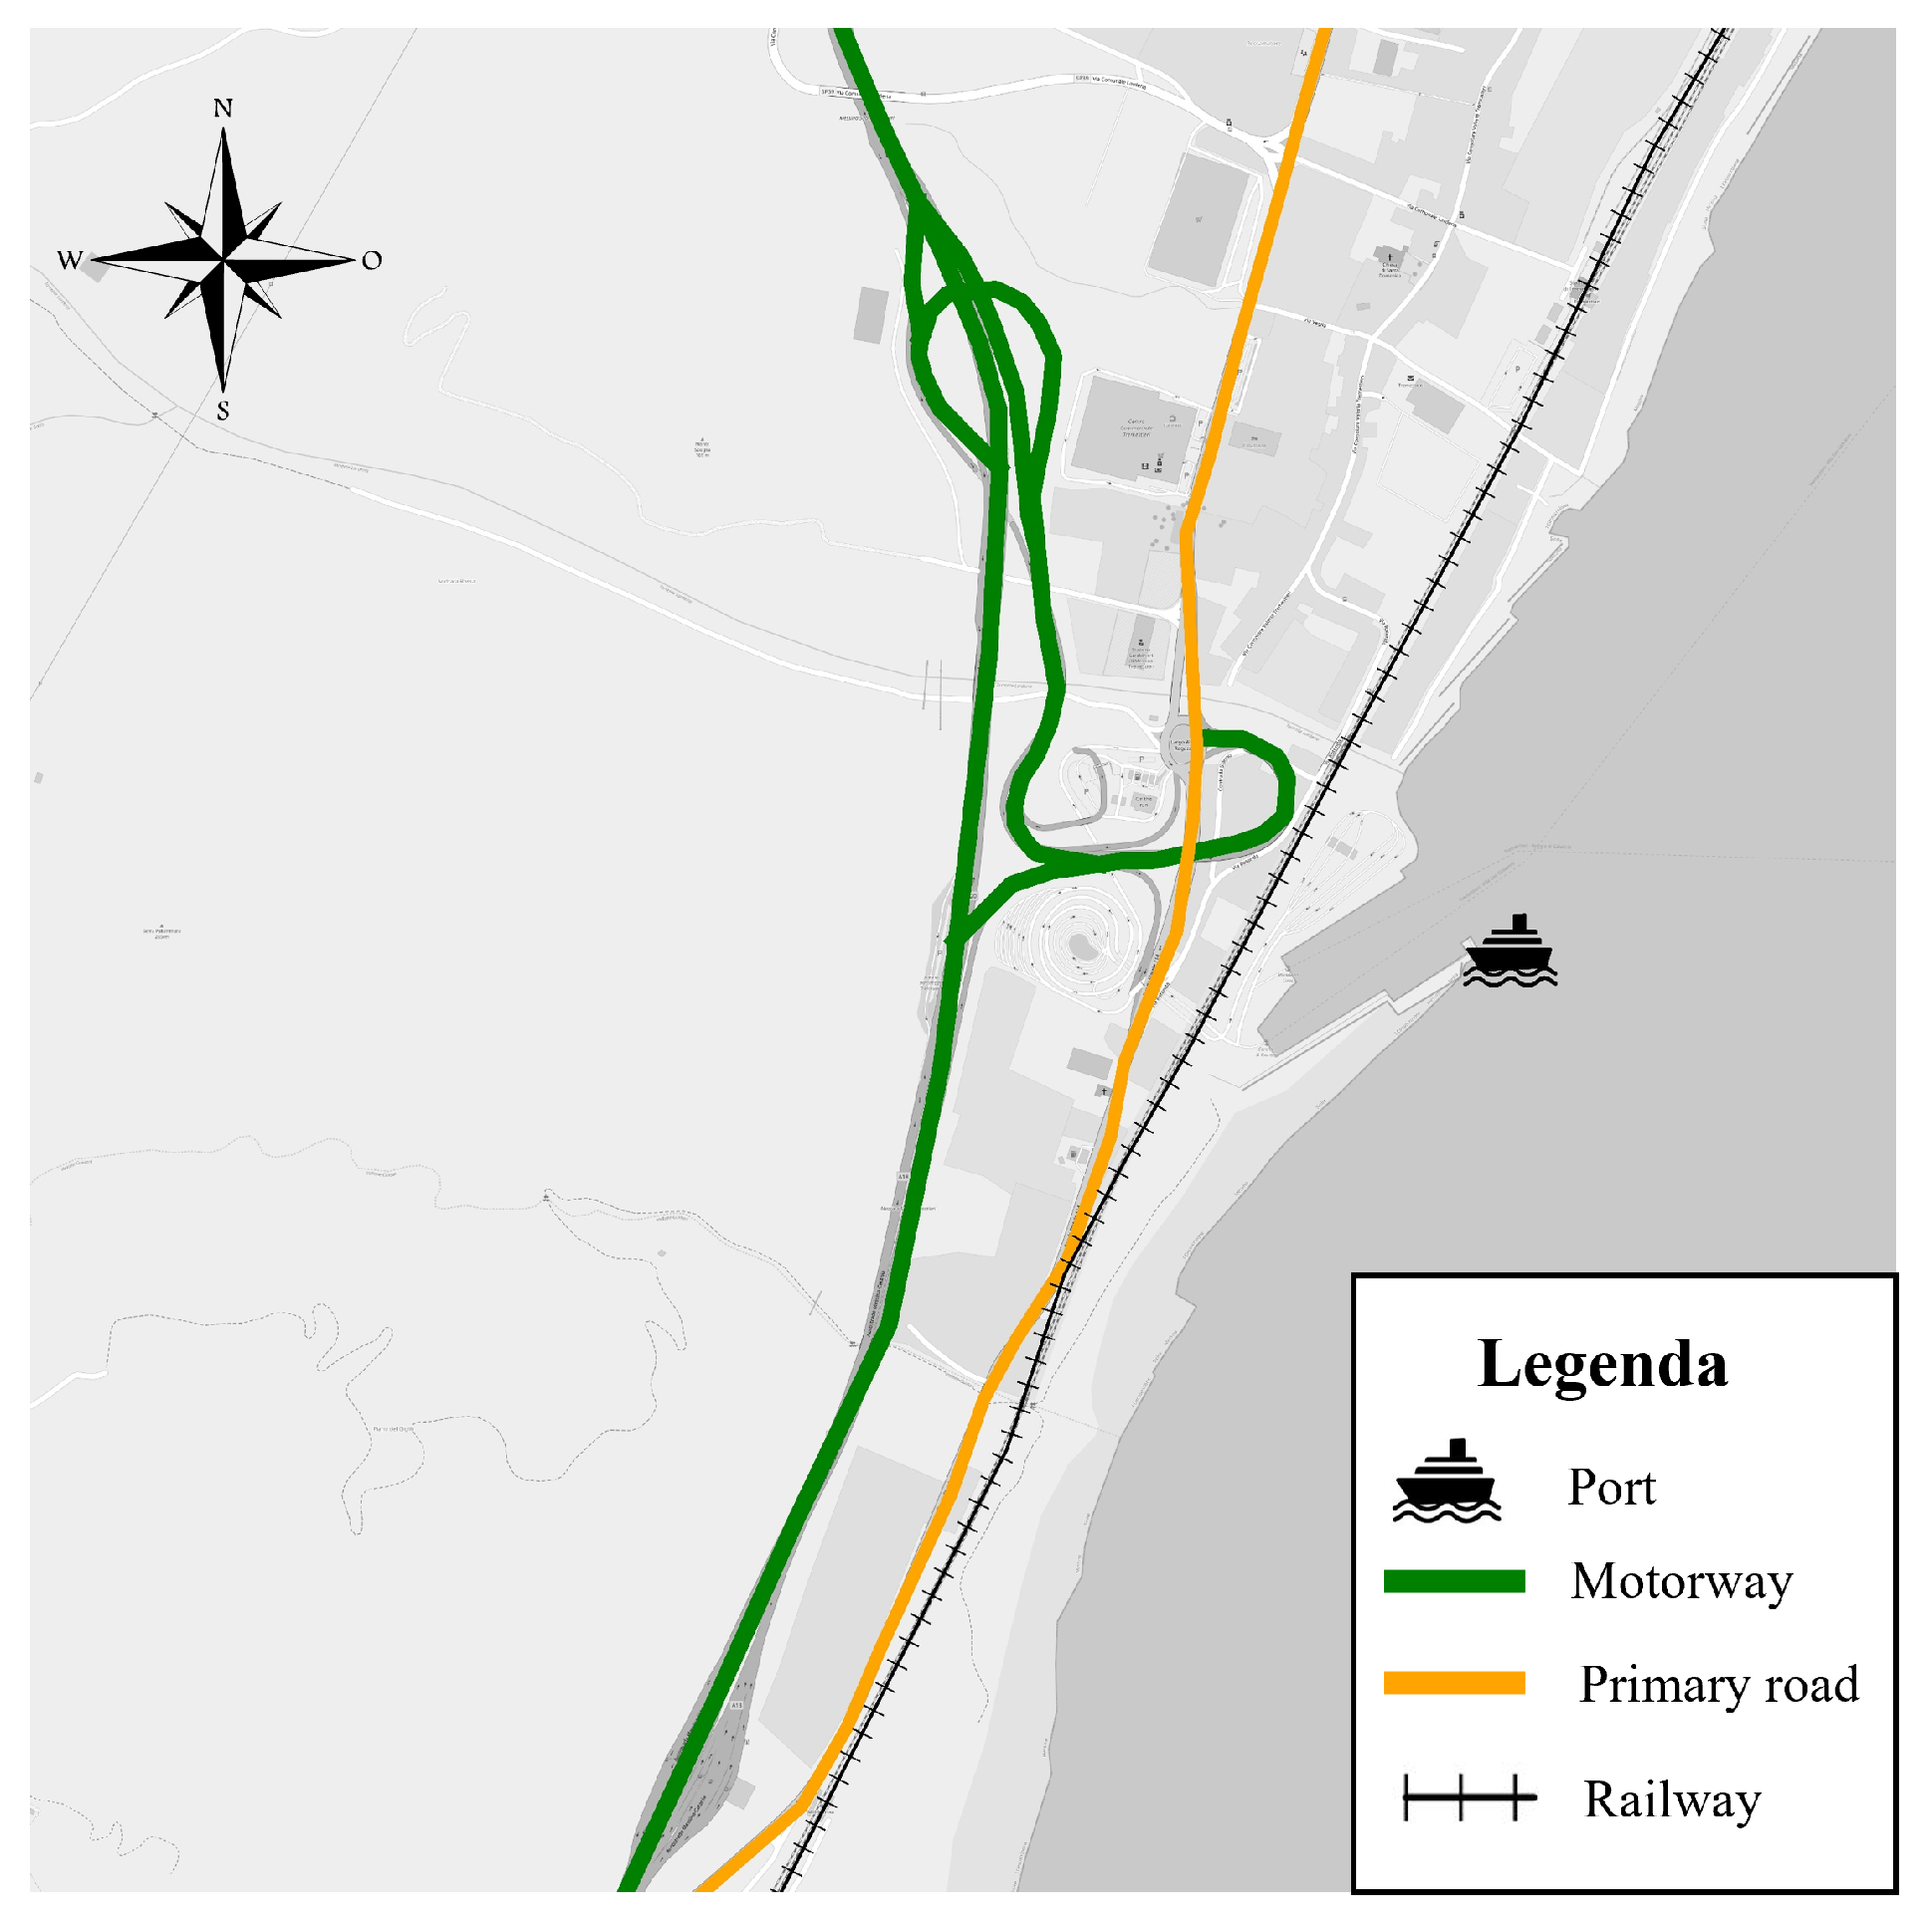
The terminal area considered in this application is the port of Messina-Tremestieri, a port in Sicily Island (Southern Italy) included in the TEN-T comprehensive network. Such a port provides high-frequency services between Sicily and Italy, allowing the continuity of the travel of vehicles (the reader considers that the use of a vessel is the only mode to link the island with the rest of the country). The terminal area is located on the city’s northern border, connected with the motorway and the primary road (Figure 2). It handles trail trucks, heavy freight vehicles and passengers. About 90% of freight arrives and departs from Sicily through its maritime terminals, and the area of Messina-Tremestieri covers a rate equal to 29% [6]. Beyond its logistics relevance in the economy of the areas, the terminal, since 2006, has been permitted to reduce heavy traffic crossing the inner area of Messina.

4.3. Experimental Analysis

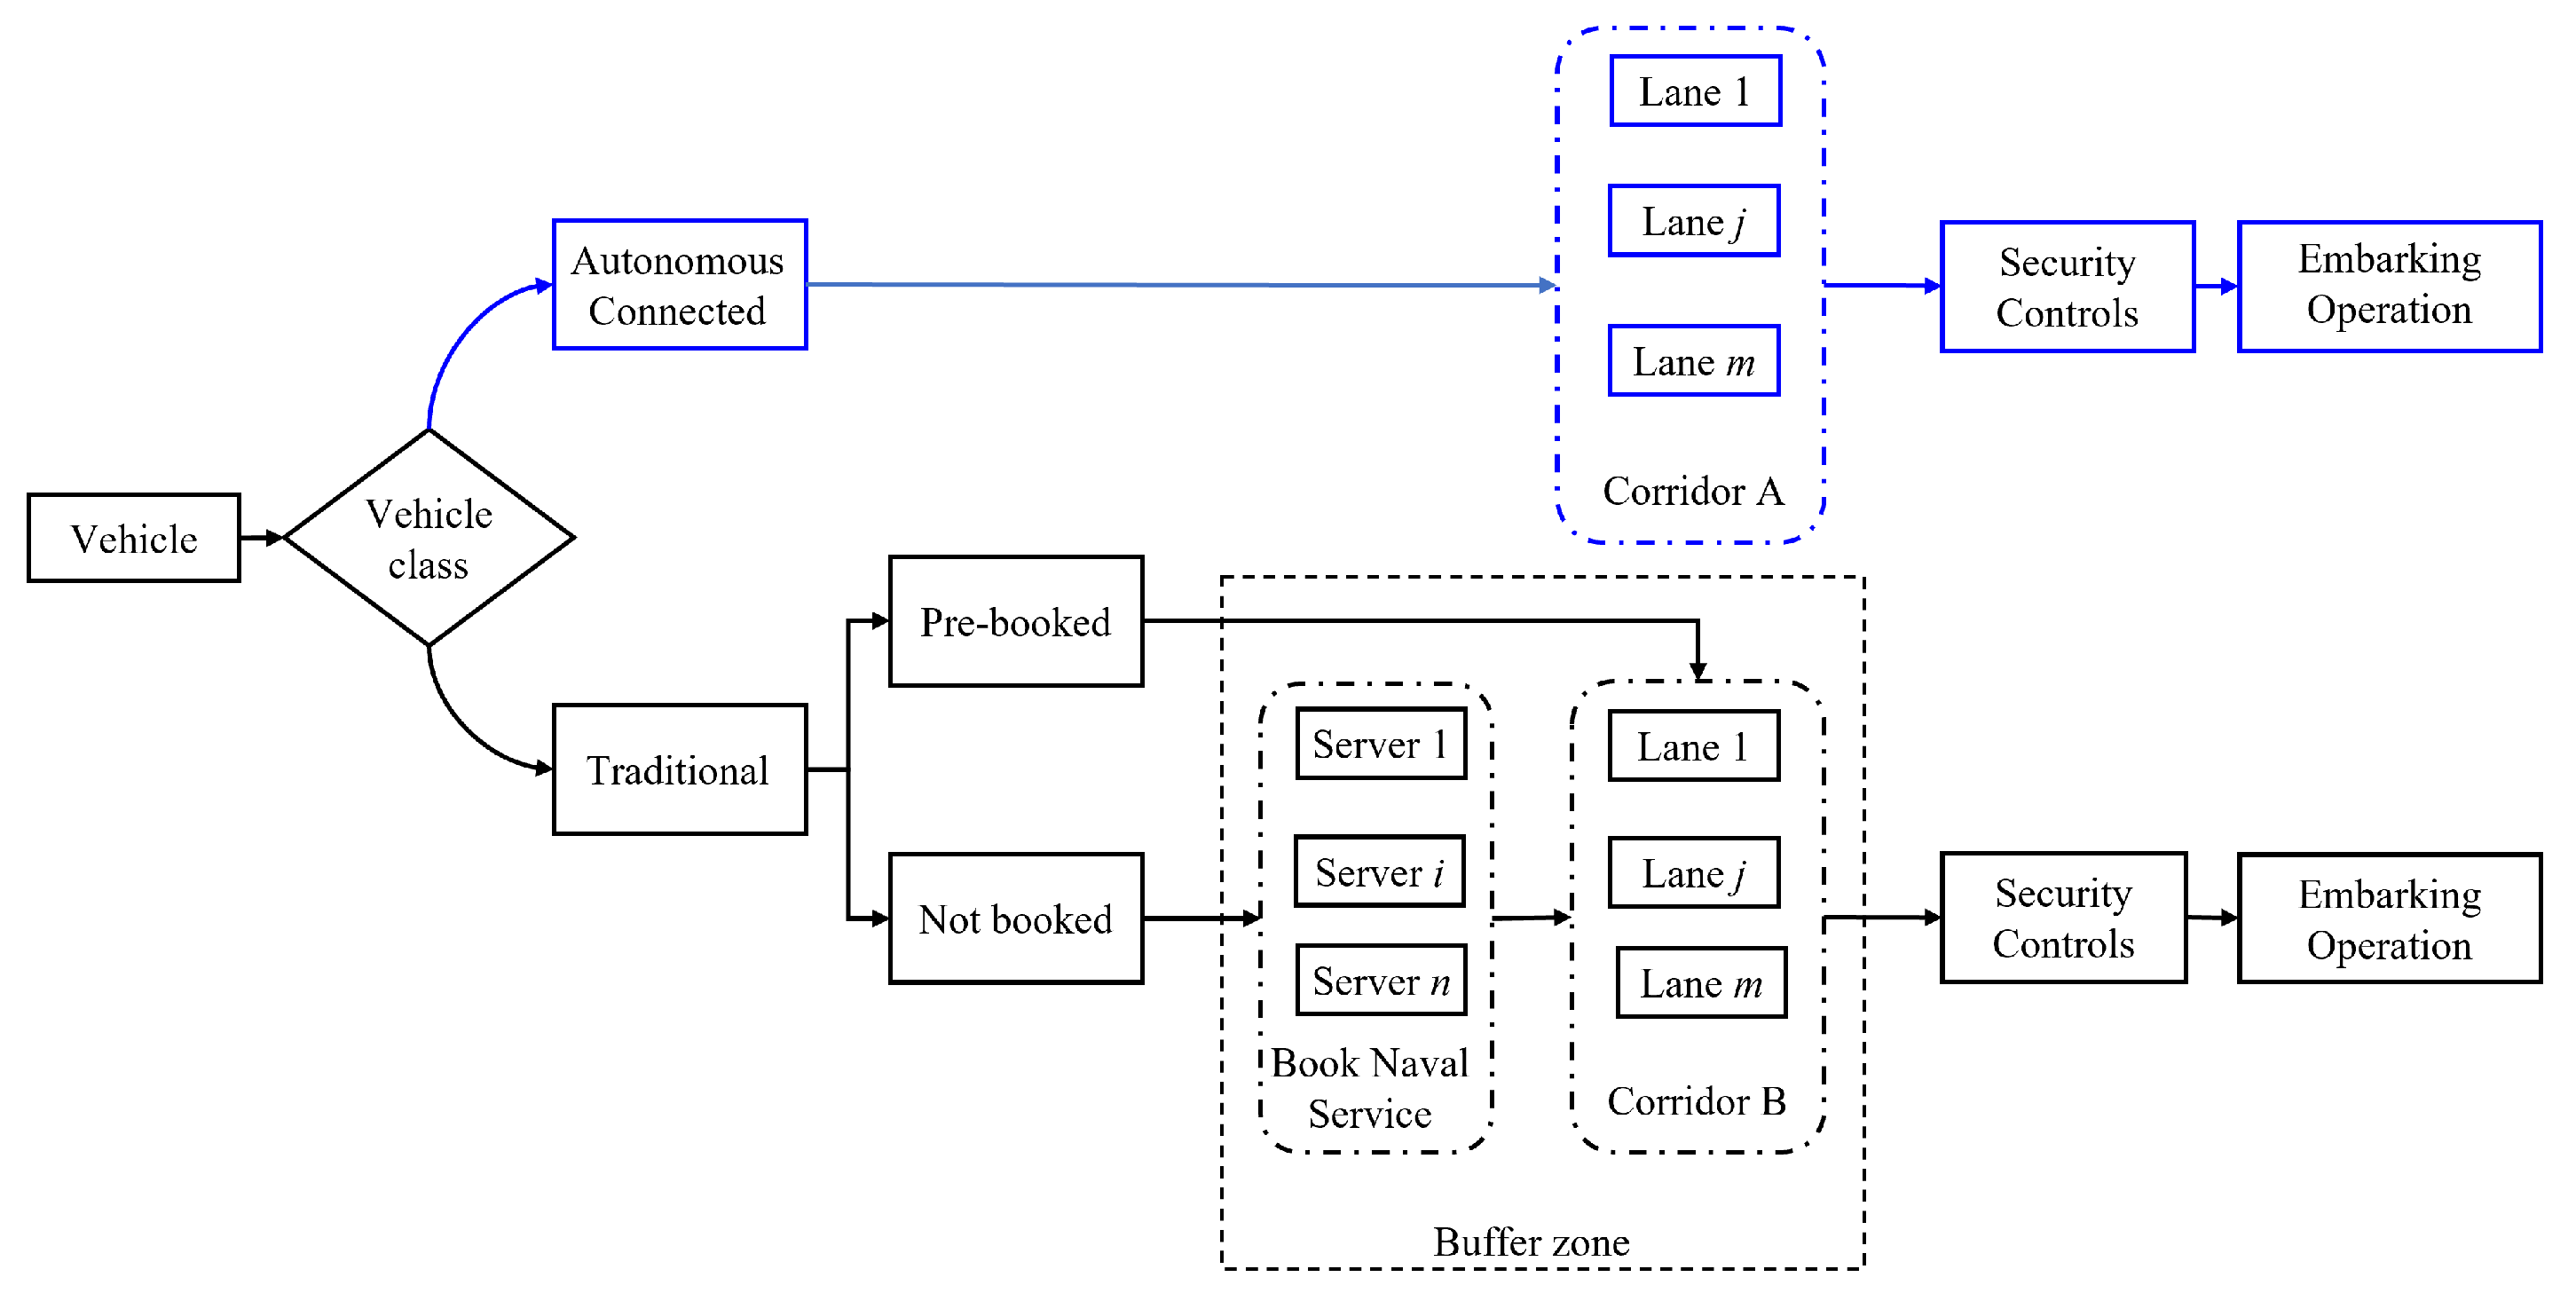
A discrete-event simulation lets the analyst simulate what-if scenarios under different traffic conditions to test the efficiency of tactical solutions and prevent congestion phenomena affecting the terminal. Figure 3 represents the synthetic scheme of operations for a vehicle arriving at the terminal. The flow diagram depicts the main steps into the system, such as registration and priority class assignment, and subsequently go through different paths before leaving the terminal area.
A generic vehicle approaching the port passes through an approach corridor equipped with automatic number plate recognition (ANPR) sensors. Therefore, the system matches in the archive if the incoming vehicle has already confirmed its presence and, in the affirmative case, classifies it as autonomous/connected; otherwise, it is identified as a traditional vehicle. The former proceeds to the inner area of the terminal (in an established lane of the corridor A following variable message) and, according to security controls, it continues up to the internal buffer area ready for the embarking operation. Inside the buffer zone, traditional vehicles were further differentiated in pre-booked and not booked. The first subgroup directly reaches the first available slot in the queuing lanes in the corridor B. Non-booked vehicles have to choose (according to FIFO regulation) a server for ticket operation, reserving their slot in the first available vessel. Once the ticket operation is completed, they reach the proper lane, waiting to be called in the inner area of the terminal for embarking operation (after eventual security controls). Once vehicles are organized in groups, they receive information on the next step and path to the embarking area.
The key performance indicators chosen in our simulation foresee, for different vehicles class, the average time needed to be ready for the embarking operation. Further analysis on the average waiting time in the system (for vehicle class) also lets us know the average number of arrivals served on the first available vessel. The simulation approach required the definition for the distribution of the arrival at the terminal area. Since the last quarter of 2021, a stable smart edge cloud system has been installed, for five consecutive months, to evaluate arrivals distribution and type of vehicles [52]. From the collected data it emerged that the Poisson distribution adequately approximates the incoming vehicles. Security controls rate and the mean ticket time were also derived from direct interviews with the terminal operator. The simulation run lasted 8 hours, representing the terminal conditions in the afternoon peak period. Different market penetration rates (a maximum value equal to 30% with respect to the total arrival) were fixed for the automated and connected vehicles.
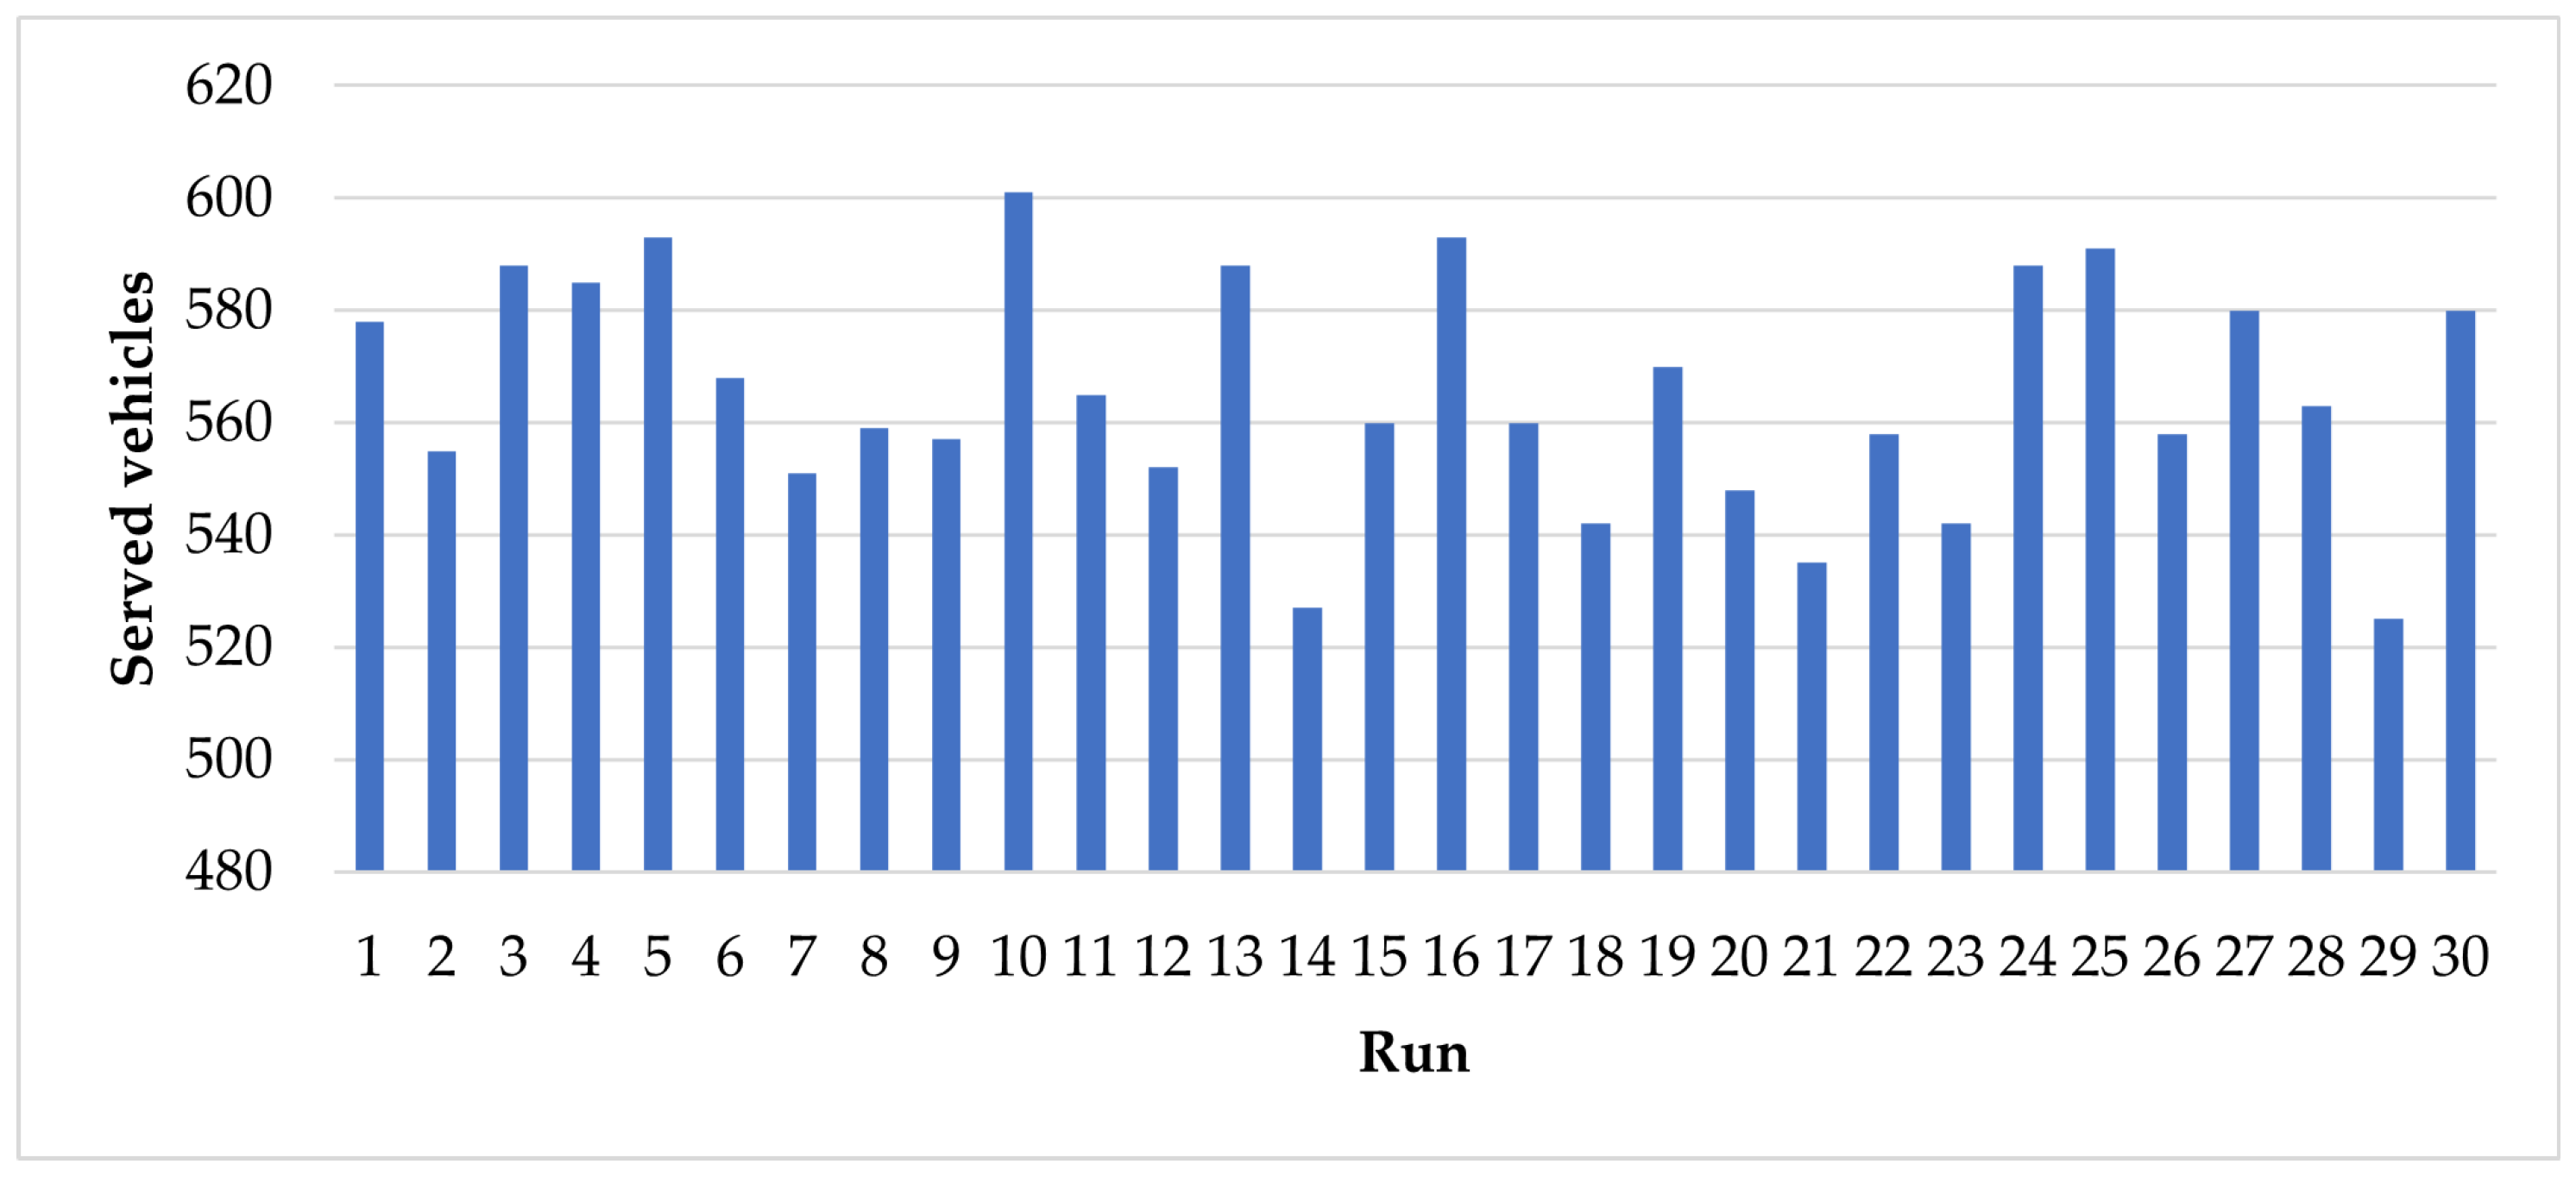
Since the procedure is stochastic, in the same experiment multiple runs were performed to obtain the average performance of the system. In the experiment reported in this section, the system achieved an average served number of 560 vehicles, Figure 4 reports the total amount of vehicles served at each run. The achieved results demonstrate that the number of vehicles that can be served is higher than observed [52]. This shows that, with the proposed procedure, the terminal would be able to handle more arrivals than observed.
Collected data also stated how, at least once a week in the terminal area, a queue phenomenon involving more than 50 vehicles is observed [52]. The implementation of the proposed framework could lead to a reduction of the queue. In fact, in our simulation, the embarking performance guarantees that most of the vehicles are served. Table 2 reports the average waiting corresponding to a specific priority class of vehicles. The reported values take into account, for each vehicle, the time spent in the system as the difference between the registration time (at the terminal gate) and the loading operations on the vessel.
In Tremestieri, during the afternoon peak period, the shipping companies offer at least three different vessels each hour; for this reason, the evaluated time reported in Table 2 is in line with the expectations to embark on the first available vessel, only vehicles with lower priority have to wait around 30 minutes to embark on the next vessel.
Table 3 reports the average waiting time spent queuing in the buffer areas by the different vehicle classes.
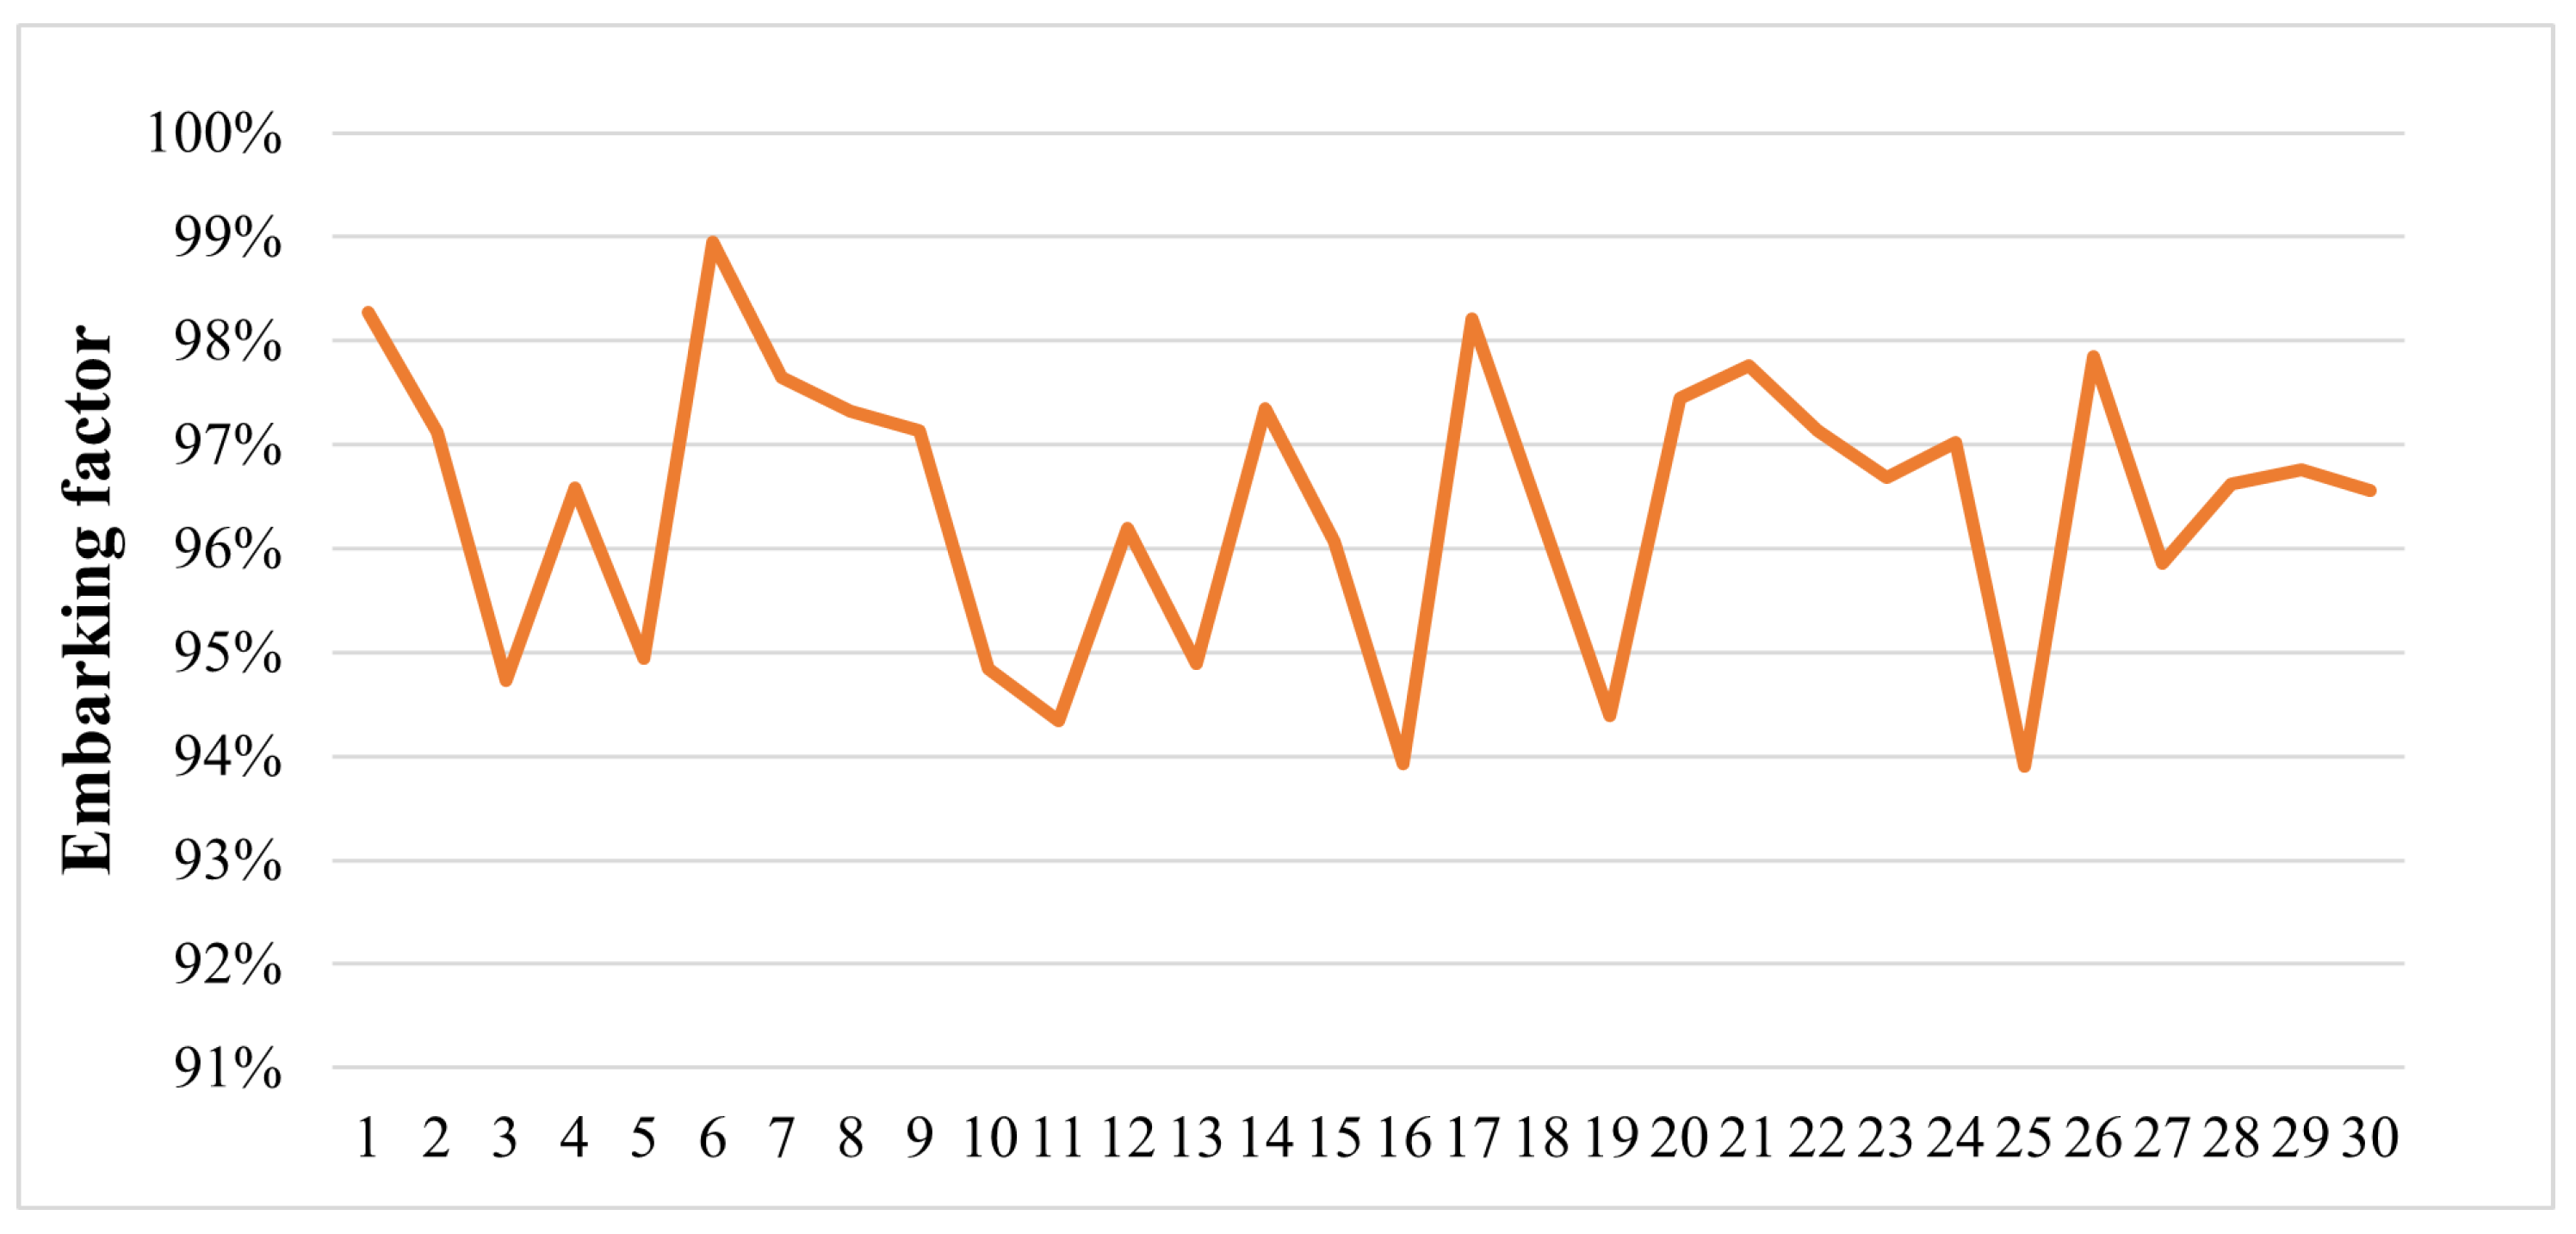
Following the framework reported in Figure 3, automated vehicles are served and stored in the internal buffer; thus, vehicles only have to wait for the embarking operations. The average waiting time in the system is around 16 minutes for pre-booked vehicles that have priority to be embarked on the first available vessel. Ordinary arrivals have to wait in the buffer for more than 20 minutes before being admitted to the inner part of the terminal. As reported in Figure 5, embarking performance is promising, and the level of performance achieved through the simulation, considering two dedicated servers for ticketing, is sufficient to satisfy the incoming vehicles’ requests.
Figure 5 reports the average efficiency ratio simulated in the multiple runs.
The embarking factor achieved in the simulation assesses how most vehicles can address the objective to be served on board at the first available vessel; rarely, some vehicles belonging to the lower priority class need to wait for the upcoming service. The simulated embarking factor is stable, along with the multiple runs and lower performance capabilities associated with higher traffic volumes exceeding 15–20% the current traffic conditions at the terminal. Generally, the embarking factor never goes below 94%, ensuring that the buffer area and corridors are always considered clear and ready for harboring incoming vehicles.
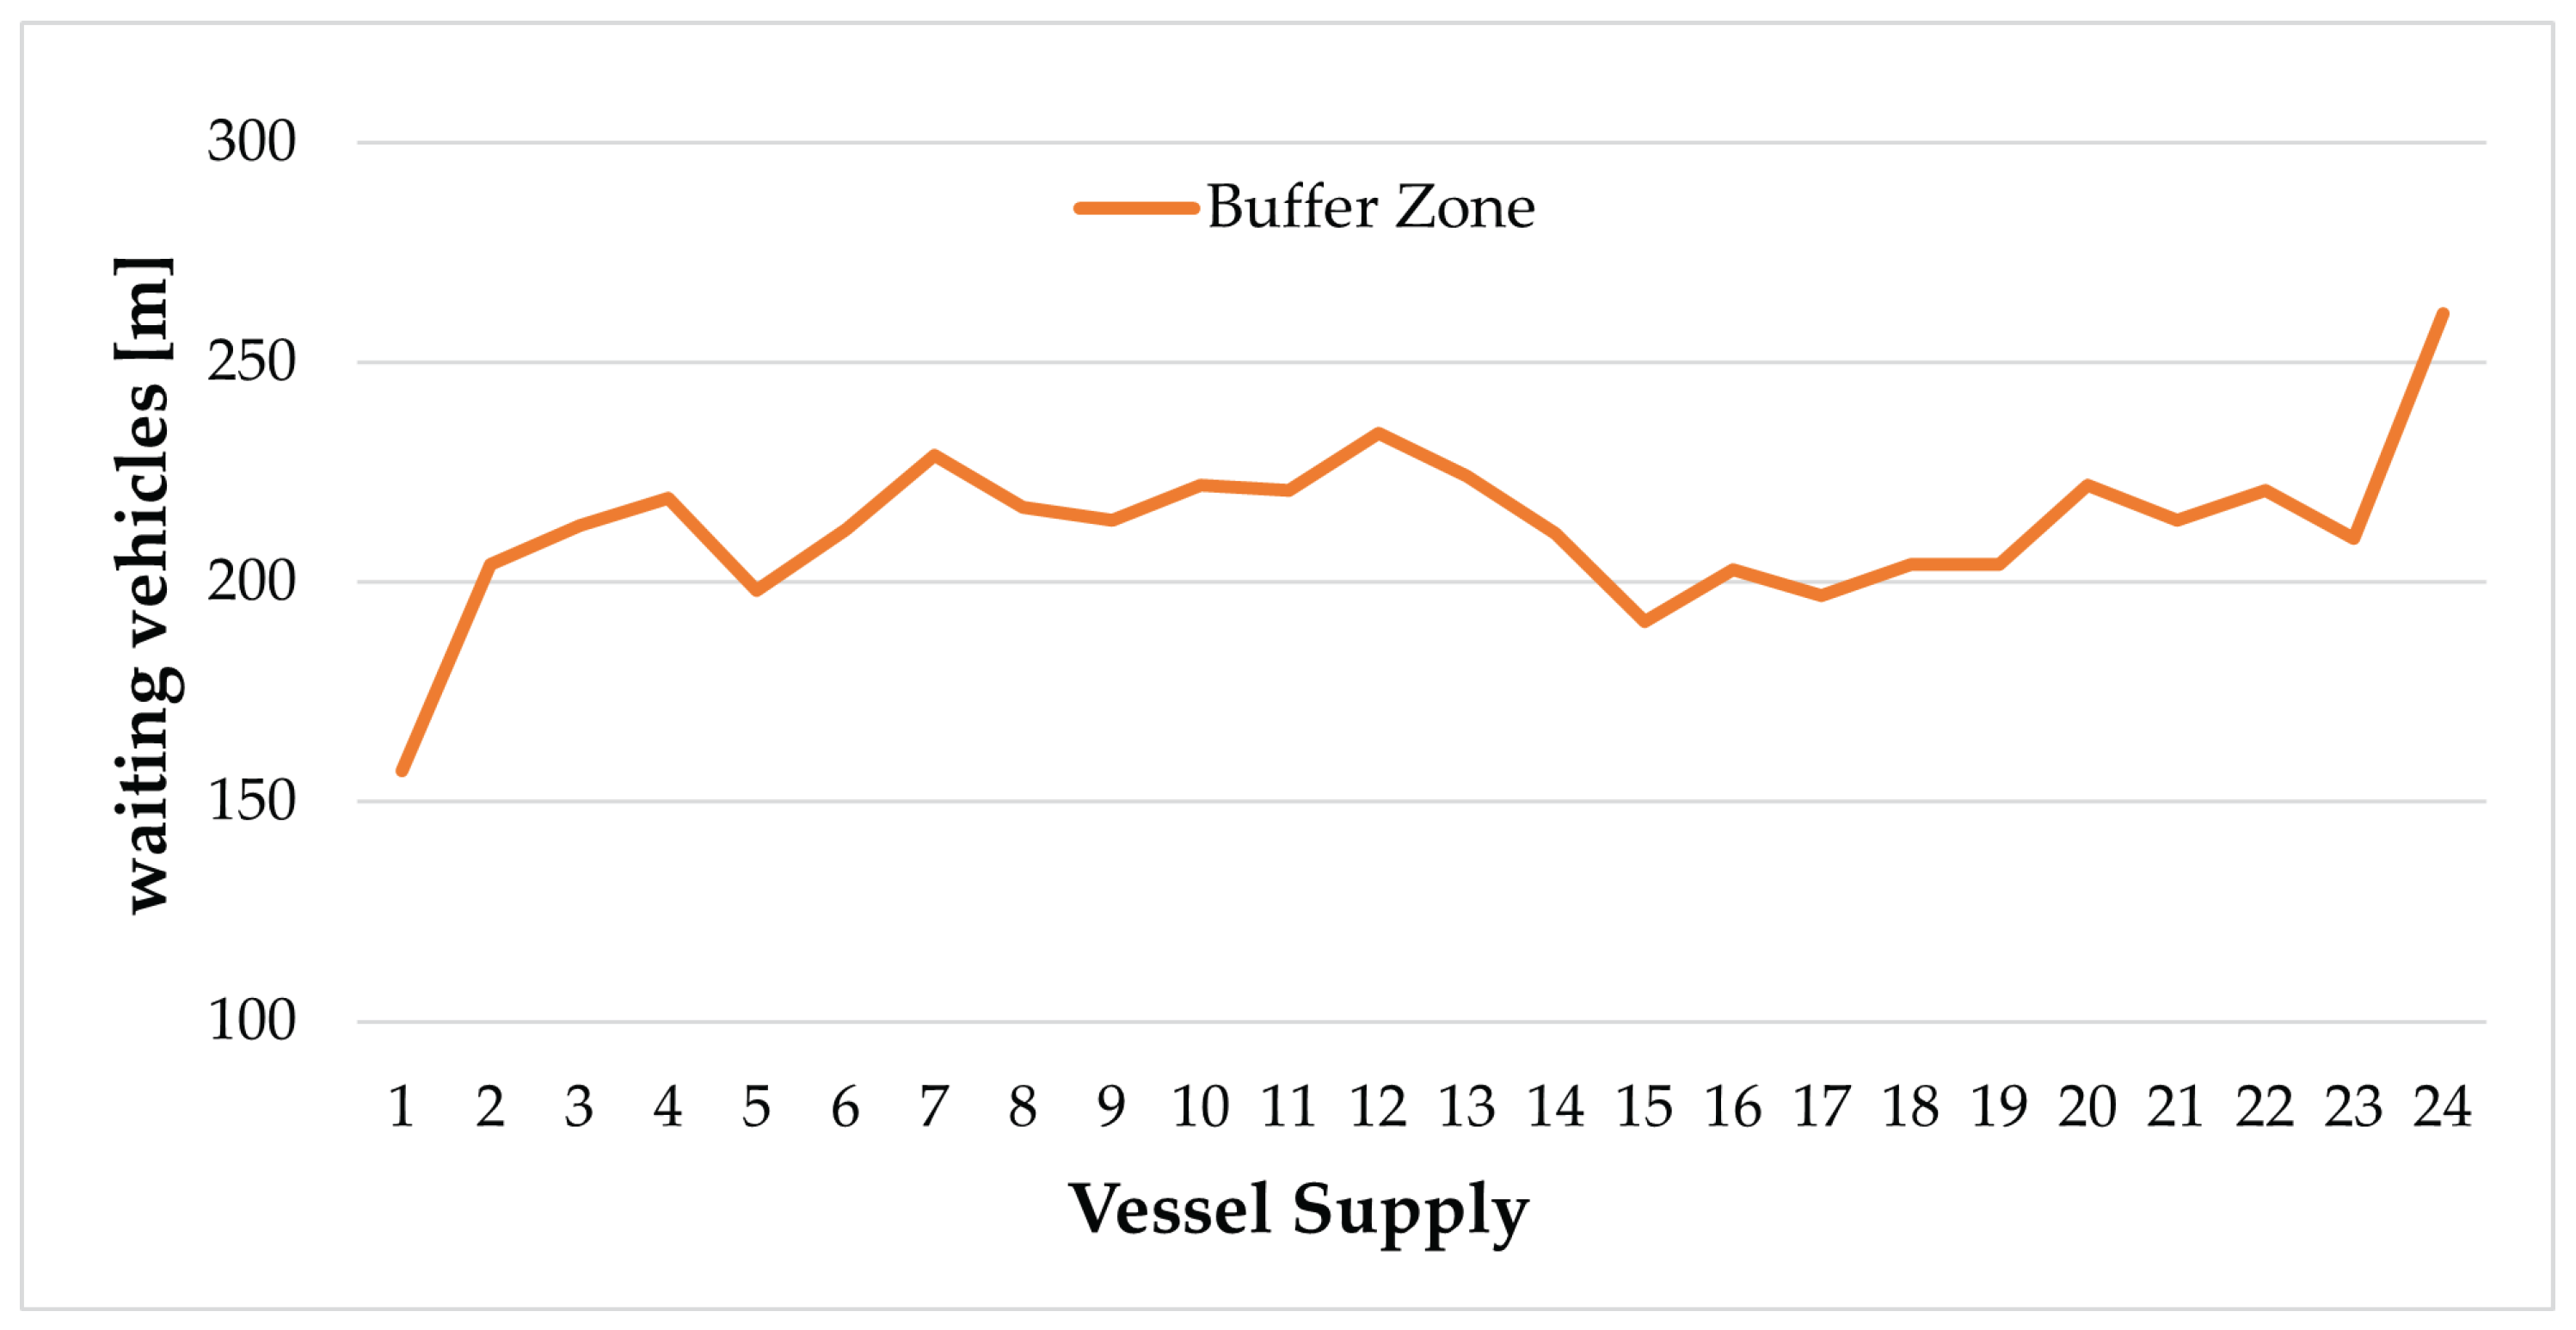
Finally, according to the current vehicle class distribution, it is also possible to foresee the hypothetical system’s evolution by highlighting the average number of vehicles dwelling in the buffer areas for each scheduled vessel departure (a total amount of 25 vessels departures during the eight hours). For the supply, it is assumed that that the loading capacity of a vessel is the number of lane meters of cargo available. Thus, for the demand, the total length of the waiting vehicles has been chosen as a proxy for the number of vehicles. It offers a direct evaluation of the effective length of the queue of vehicles waiting for the embarking operations. Figure 6 reports vehicles’ average occupancy, expressed in metres, waiting in the external buffer zone to be called for the embarking operation.
Figure 7 reports the average length of automated/connected vehicles waiting in the inner part of the terminal before the embarking operation.
The reported values represent the average value for the multiple runs; the limited length of both queues ensures that traffic conditions in the terminal areas are always under control and the supply is sufficient to meet the demand for services. The internal and external buffer areas do not have overcrowding. The total length of vehicles waiting rarely exceeds the embarking capacity of the vessel.
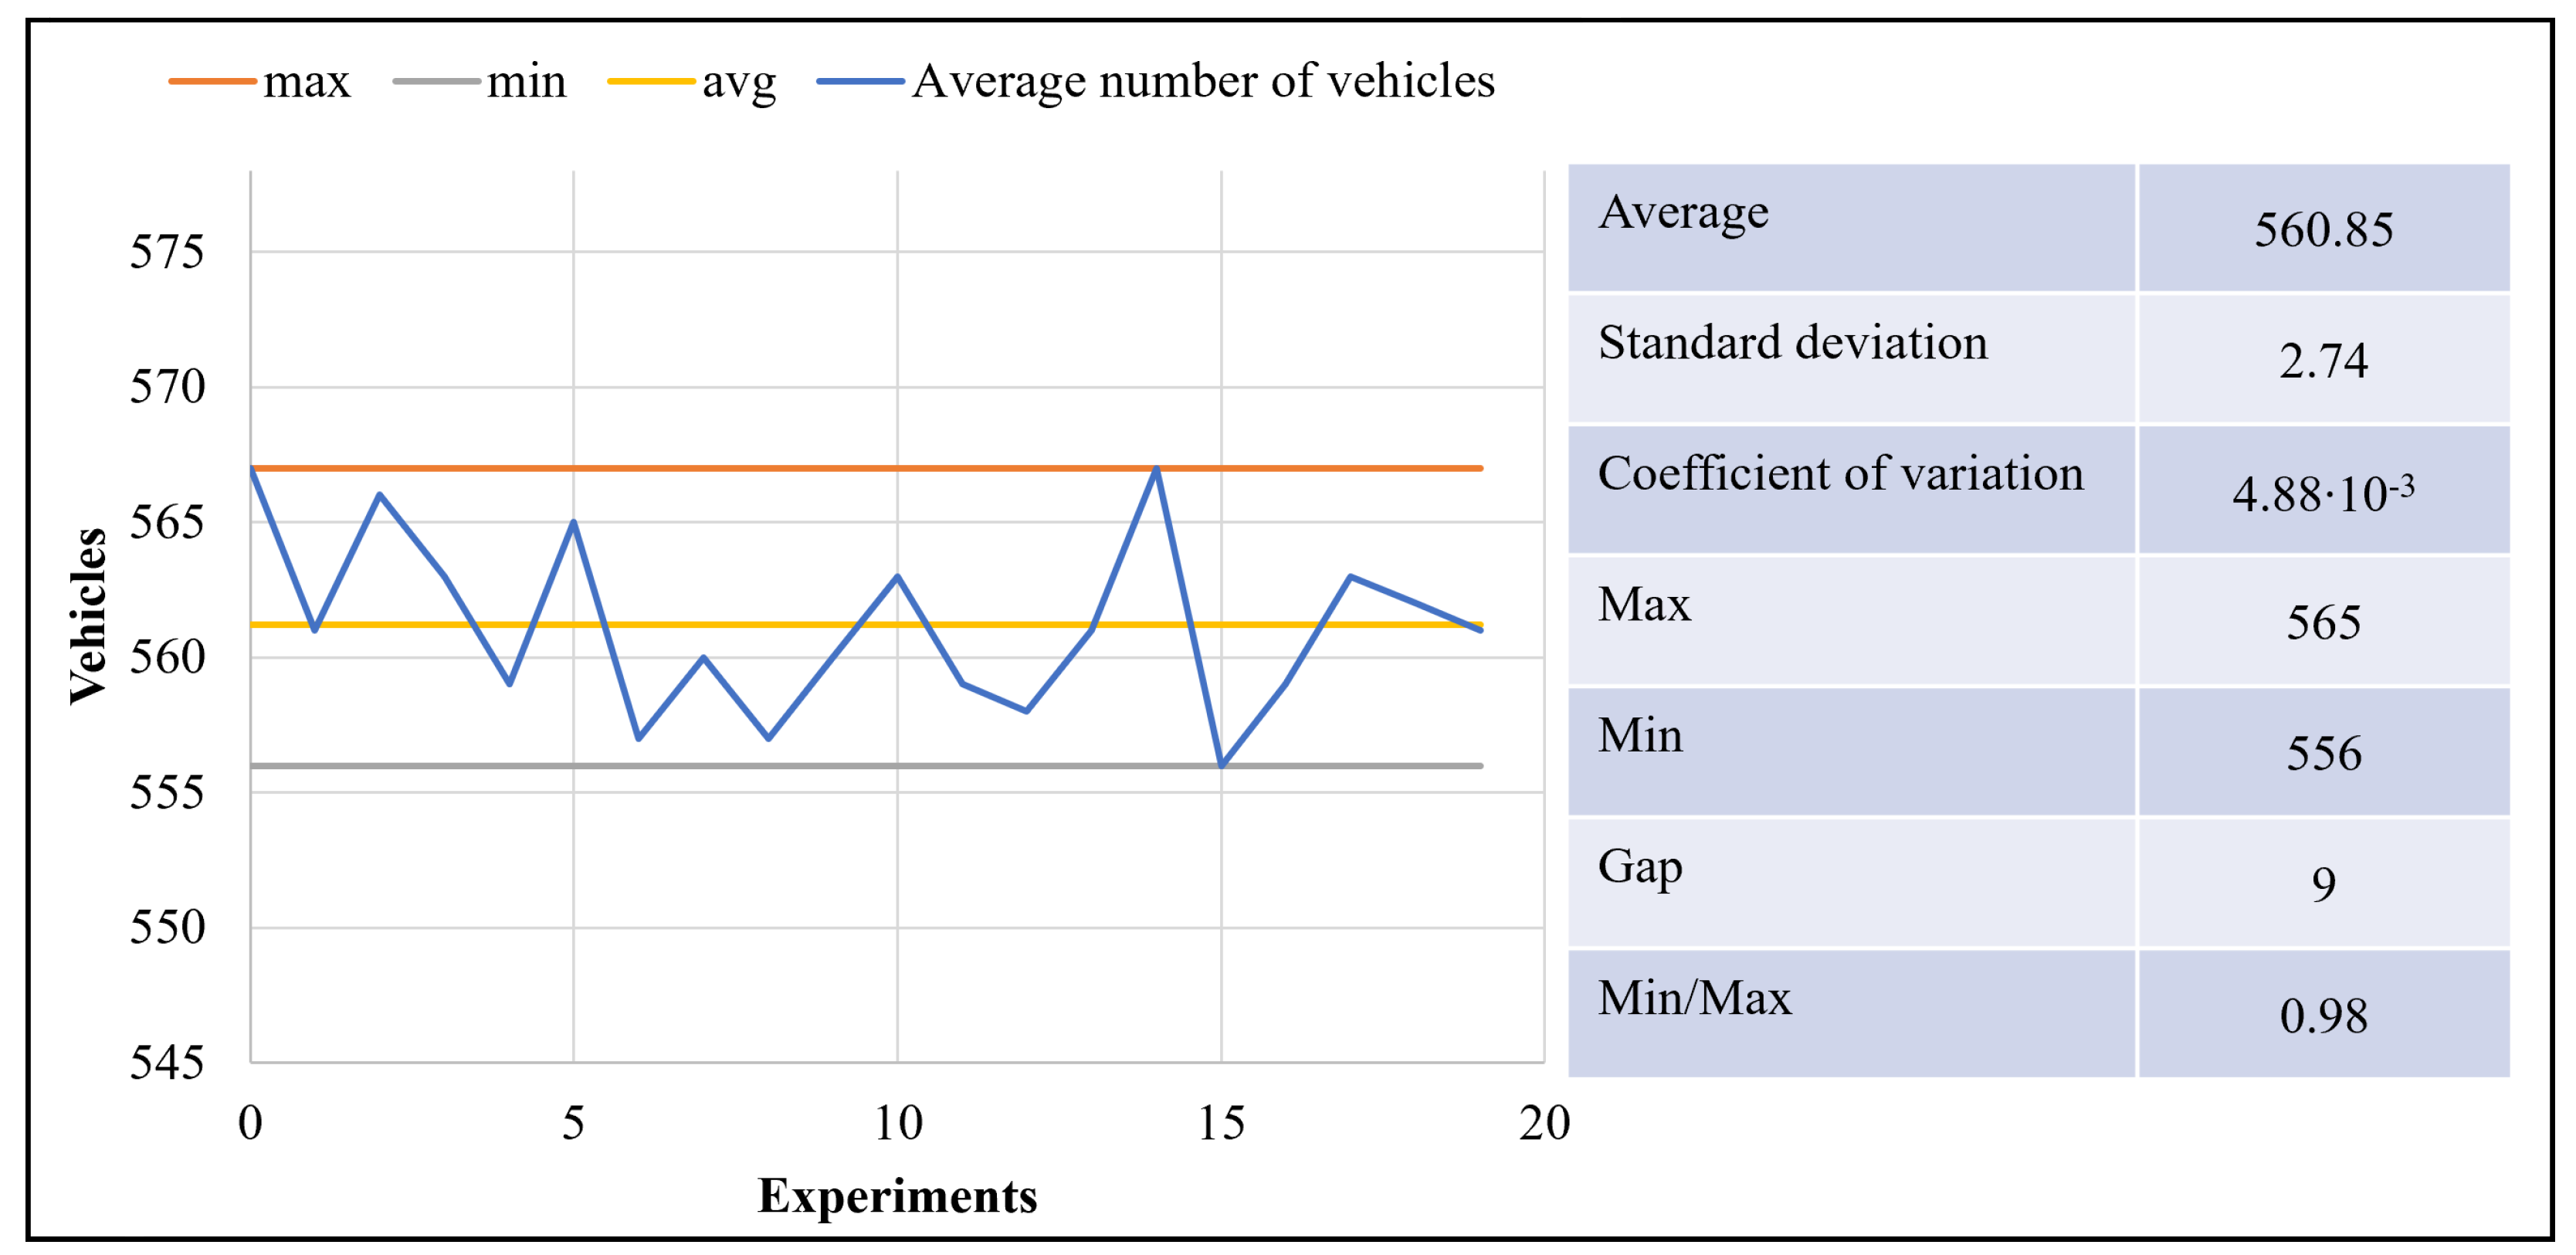
This approach has been designed to be as general as possible, in order to ensure its applicability in different contexts. As the procedure is stochastic, there is no certainty that different experiments will give the same result. However, the results will be very close to each other. Figure 8 shows how different experiments (in this case, 20 different experiments) have given a result, in terms of vehicles served, which oscillates in a range of less than nine vehicles (in a simulation time of 8 hours, thus the variation is slightly higher than a vehicle per hour), with an average value of 560.85 vehicles. Of course, this test can also be performed for the number of waiting vehicles or for the embarking factor.

5. Discussion

The general framework described in this paper, exploiting the discrete-event simulation, contributed to the research by focusing on the importance of efficiency in critical infrastructure such as a maritime terminal and highlights the importance of digitization for physical infrastructure, thus representing a valid tool in supporting the decision process. In more detail in this paper, a case study on managing landside operations at the maritime terminal of Messina-Tremestieri has been illustrated to demonstrate how the proposed modelling framework can simulate daily traffic conditions, taking into account the effects of the introduction of automated/connected vehicles.
As stated, it moved from previous direct observations in the terminal areas. Its main scope was to evaluate the possibility of improving port efficiency using regulation strategies and new planning solutions, thus reducing the cyclical queue phenomena observed during on-field analyses. The highlighted benefits reside in the reduction of the total in-time system. Consequently, overall transportation time and related costs can be reduced.
The simulation was run multiple times to test the system’s capability to deal with variable traffic conditions over the 8 hours of the peak period. These multiple simulations measured the number of served vehicles, the average in time-system for the different vehicles with different priority classes, and the effective loading request on vessels, representing a proxy for the average occupancy rate for the buffer area. The discrete-event approach allowed the simulation of vehicles’ arrivals in the terminal area and addressed incoming flows by organizing priorities. The framework included a buffer zone to be used as a basin for traditional vehicles to prevent overcrowding of the yard area. Concerning the automated vehicles, the proposed procedure assigns them a dedicated corridor and a high priority. The performances achieved through simulation are promising; embarking factors showed that the solution is stable. Most vehicles were embarked on the desired vessel. The cumulative number of served vehicles is higher than the values observed so far by the monitoring system, so we can assume that the proposed framework offers good performance. Furthermore, the simulated regulation will enable the terminal operator to serve an additional surplus of traffic. Introducing the pre-booking system for autonomous vehicles helps manage access at the terminal, taking into account the residual capacity to embark on vessels. Regulation strategy based on priority class and reservation to specific naval services resulted in an adequate solution for embarking vehicles on the first available vessel, thus reducing waiting time in the terminal area. Introducing a buffer zone outside the terminal helpfully reduced long queues in the inner areas.
Thus, it achieved a twofold objective. First, in line with the intervention proposal planned by the public administration, the proposed scenario assessed the effect of introducing an external buffer zone and a new regulation for the operations within the terminal area. The achieved performances were tested by using as key performance indicators the total time in the system and the embarking factor on vessels, thus highlighting the possibility of reducing the ordinary disruption and low performance at the maritime barrier that, as stated, represents a crucial node for the area’s economy. Finally, the further value of this study resides in the field of sustainability for both users and logistics operators who could benefit from more precise regulation and certainty of operations at the terminal, thus avoiding long waiting. Through reservation and negotiation for the higher priority classes of freight vehicles, the proposed framework also remarked on the benefits of introducing an advisory based arrival system to foresee and control the incoming presences at the terminal. The implementation of the proposed framework contributes to the field of sustainable transportation (as recognized by United Nations in proposing the goal number 11, a sustainable transport system plays a primary role in the sustainable development) providing a decision support system to mitigate effects due to queues (reducing pollutant emissions and noise) and to increase efficiency of maritime transport by optimizing the load level of the vessels.
The proposed model used a breakdown of vehicle classes that are in line with the current arrivals (estimated by the on-field survey): a limitation of this study is that no further analyses have been conducted on future demand scenarios. Neither has a study on innovation regarding the vessel supply been performed, and cargoes refer to the on-service vessels. A further simplification of the study resides in seaside approximation: in fact, in our solutions the values of the supply are derived by daily scheduling, whereas the stochastic nature of vessel arrivals would require a specific seaside model for berth allocation.
This research is a primary step towards a general solution for integrated infrastructure management for the ro-ro terminals. Finally, such predisposition would activate the possibility of managing traffic volumes, offering the opportunity to communicate with the fleets and redirect them towards favourable routes, simultaneously reducing the potential conflicts between the different traffic components (with a consequent reduction of the risk of accidents). Possible future developments rely on extending the model to include the scheduled vessel service variability and to develop an economic evaluation of the benefits achieved in terms of transportation costs, product delivery time and energy use.

Author Contributions

Conceptualization, O.M.B., A.P. and M.D.G.; methodology, O.M.B. and A.P.; software, O.M.B.; validation, A.P. and M.D.G.; formal analysis, O.M.B.; investigation, O.M.B.; resources, O.M.B.; data curation, O.M.B.; writing—original draft preparation, O.M.B.; writing—review and editing, O.M.B. and A.P.; visualization, A.P. and M.D.G.; supervision, M.D.G. All authors have read and agreed to the published version of the manuscript.

Funding

This research received no external funding.

Institutional Review Board Statement

Not applicable.

Informed Consent Statement

Not applicable.

Data Availability Statement

Not applicable.

Acknowledgments

The authors wish to thank the Autorità Portuale dello Stretto di Messina for supporting the project.

Conflicts of Interest

The authors declare no conflict of interest.

Abbreviations

The following abbreviations are used in this manuscript:
ANPRAutomatic Number Plate Recognition
AVGAutomatic Guided Vehicles
ADASAdvanced Driver Assist Systems
DESDiscrete-Event Simulation
DSCRDedicated Short-Range Communication
FIFOFirst-In-First-Out
GAGenetic Algorithm
ITSIntelligent Transportation Systems
KPIKey Performance Indicator
SAESociety of Automobile Engineers
TASTruck Arrival System
TEN-TTrans European Transport Network
TSMSTime Slot Management System
V2IVehicle-to-Infrastructure
V2VVehicle-to-Vehicle

References

  1. Comi, A.; Nuzzolo, A. Exploring the relationships between e-shopping attitudes and urban freight transport. Transp. Res. Procedia 2016, 12, 399–412. [Google Scholar] [CrossRef]
  2. Nogueira, G.P.M.; de Assis Rangel, J.J.; Croce, P.R.; Peixoto, T.A. The environmental impact of fast delivery B2C e-commerce in outbound logistics operations: A simulation approach. Clean. Logist. Supply Chain 2022, 5, 100070. [Google Scholar] [CrossRef]
  3. Di Gangi, M.; Polimeni, A.; Belcore, O.M. Freight Distribution in Small Islands: Integration between Naval Services and Parcel Lockers. Sustainability 2023, 15, 7535. [Google Scholar] [CrossRef]
  4. European Commission. Roadmap to a Single European Transport Area—Towards a Competitive and Resource Efficient Transport System, EUR-Lex 2011, 52011DC0144. Available online: https://eur-lex.europa.eu/LexUriServ/LexUriServ.do?uri=COM:2011:0144:FIN:en:PDF (accessed on 3 April 2023).
  5. Comi, A.; Polimeni, A. Assessing the Potential of Short Sea Shipping and the Benefits in Terms of External Costs: Application to the Mediterranean Basin. Sustainability 2020, 12, 5383. [Google Scholar] [CrossRef]
  6. Assoporti. L’Italia dei Porti. 2022. Available online: https://www.assoporti.it (accessed on 17 May 2023).
  7. Kim, E.; Kim, Y.; Park, J. The Necessity of Introducing Autonomous Trucks in Logistics 4.0. Sustainability 2022, 14, 3978. [Google Scholar] [CrossRef]
  8. Shaout, A.; Colella, D.; Awad, S. Advanced Driver Assistance Systems - Past, present and future. In Proceedings of the 2011 Seventh International Computer Engineering Conference (ICENCO’2011), Cairo, Egypt, 27–28 December 2011; pp. 72–82. [Google Scholar] [CrossRef]
  9. Kukkala, V.K.; Tunnell, J.; Pasricha, S.; Bradley, T. Advanced Driver-Assistance Systems: A Path Toward Autonomous Vehicles. IEEE Consum. Electron. Mag. 2018, 7, 18–25. [Google Scholar] [CrossRef]
  10. SAE International. Taxonomy and Definitions for Terms Related to Driving Automation Systems for On-Road Motor Vehicles; SAE International: Warrendale, PA, USA, 2021. [Google Scholar]
  11. Pereira, A.M.; Anany, H.; Přibyl, O.; Přikryl, J. Automated vehicles in smart urban environment: A review. In Proceedings of the 2017 Smart City Symposium Prague (SCSP), Prague, Czech Republic, 25–26 May 2017; pp. 1–8. [Google Scholar]
  12. Guanetti, J.; Kim, Y.; Borrelli, F. Control of connected and automated vehicles: State of the art and future challenges. Annu. Rev. Control 2018, 45, 18–40. [Google Scholar] [CrossRef]
  13. Di Salvo, R.; Galletta, A.; Belcore, O.M.; Villari, M. Modeling Users’ Performance: Predictive Analytics in an IoT Cloud Monitoring System. In Proceedings of the Service-Oriented and Cloud Computing: 8th IFIP WG 2.14 European Conference, ESOCC 2020, Heraklion, Crete, Greece, 28–30 September 2020; pp. 149–158. [Google Scholar]
  14. Shladover, S.E. Connected and automated vehicle systems: Introduction and overview. J. Intell. Transp. Syst. 2018, 22, 190–200. [Google Scholar] [CrossRef]
  15. Qin, K.; Wang, B.; Zhang, H.; Ma, W.; Yan, M.; Wang, X. Research on Application and Testing of Autonomous Driving in Ports; Technical Report; SAE International: Warrendale, PA, USA, 2020. [Google Scholar]
  16. Fiedler, R.; Bosse, C.; Gehlken, D.; Brümmerstedt, K.; Burmeister, H. Autonomous Vehicles’ Impact on Port Infrastructure Requirements; Fraunhofer Center for Maritime Logistics and Services CML: Hamburg, Germany, 2019. [Google Scholar]
  17. Fishman, G.S. Discrete-Event Simulation; Springer: New York, NY, USA, 2001. [Google Scholar] [CrossRef]
  18. Preston, G.C.; Horne, P.; Scaparra, M.P.; O’Hanley, J.R. Masterplanning at the Port of Dover: The use of discrete-event simulation in managing road traffic. Sustainability 2020, 12, 1067. [Google Scholar] [CrossRef]
  19. Iannone, R.; Miranda, S.; Prisco, L.; Riemma, S.; Sarno, D. Proposal for a flexible discrete event simulation model for assessing the daily operation decisions in a Ro–Ro terminal. Simul. Model. Pract. Theory 2016, 61, 28–46. [Google Scholar] [CrossRef]
  20. Keceli, Y. A simulation model for gate operations in multi-purpose cargo terminals. Marit. Policy Manag. 2016, 43, 945–958. [Google Scholar] [CrossRef]
  21. Özkan, E.D.; Nas, S.; Güler, N. Capacity analysis of Ro-Ro terminals by using simulation modeling method. Asian J. Shipp. Logist. 2016, 32, 139–147. [Google Scholar] [CrossRef]
  22. Abourraja, M.N.; Kringos, N.; Meijer, S. Exploiting simulation model potential in investigating handling capacity of Ro-Ro terminals: The case study of Norvik seaport. Simul. Model. Pract. Theory 2022, 117, 102513. [Google Scholar] [CrossRef]
  23. Abourraja, M.N.; Rouky, N.; Kornevs, M.; Meijer, S.; Kringos, N. A simulation-based decision support framework devoted to Ro-Ro terminals: Design, implementation and evaluation. Comput. Ind. Eng. 2023, 180, 109248. [Google Scholar] [CrossRef]
  24. Park, S.H.; Hwang, J.; Yun, S.; Kim, S. Automatic Guided Vehicles Introduction Impacts to Roll-On/Roll-Off Terminals: Simulation and Cost Model Analysis. J. Adv. Transp. 2022, 2022, 6062840. [Google Scholar] [CrossRef]
  25. Muravev, D.; Aksoy, S.; Rakhmangulov, A.; Aydogdu, Y.V. Comparing model development in discrete event simulation on Ro-Ro terminal example. Int. J. Logist. Syst. Manag. 2016, 24, 283–297. [Google Scholar]
  26. Sharif, O.; Huynh, N.; Vidal, J.M. Application of El Farol model for managing marine terminal gate congestion. Res. Transp. Econ. 2011, 32, 81–89. [Google Scholar] [CrossRef]
  27. Parola, F.; Sciomachen, A. Modal split evaluation of a maritime container terminal. Marit. Econ. Logist. 2009, 11, 77–97. [Google Scholar] [CrossRef]
  28. Van Vianen, T.; Ottjes, J.; Lodewijks, G. Simulation-based rescheduling of the stacker–reclaimer operation. J. Comput. Sci. 2015, 10, 149–154. [Google Scholar] [CrossRef]
  29. Jovanovic, R. Optimizing truck visits to container terminals with consideration of multiple drays of individual drivers. J. Optim. 2018, 2018, 5165124. [Google Scholar] [CrossRef]
  30. Azab, A.; Karam, A.; Eltawil, A. A simulation-based optimization approach for external trucks appointment scheduling in container terminals. Int. J. Model. Simul. 2020, 40, 321–338. [Google Scholar] [CrossRef]
  31. Neagoe, M.; Hvolby, H.H.; Taskhiri, M.S.; Turner, P. Using discrete-event simulation to compare congestion management initiatives at a port terminal. Simul. Model. Pract. Theory 2021, 112, 102362. [Google Scholar] [CrossRef]
  32. Nadi, A.; Nugteren, A.; Snelder, M.; van Lint, J.; Rezaei, J. Advisory-Based Time Slot Management System to Mitigate Waiting Time at Container Terminal Gates. Transp. Res. Rec. 2022, 2676, 656–669. [Google Scholar] [CrossRef]
  33. Srisurin, P.; Pimpanit, P.; Jarumaneeroj, P. Evaluating the long-term operational performance of a large-scale inland terminal: A discrete event simulation-based modeling approach. PLoS ONE 2022, 17, e0278649. [Google Scholar] [CrossRef]
  34. Schroër, H.J.; Corman, F.; Duinkerken, M.B.; Negenborn, R.R.; Lodewijks, G. Evaluation of inter terminal transport configurations at Rotterdam Maasvlakte using discrete event simulation. In Proceedings of the Winter Simulation Conference, Savannah, GA, USA, 7–10 December 2014; pp. 1771–1782. [Google Scholar] [CrossRef]
  35. Rusca, F.; Popa, M.; Rosca, E.; Rusca, A. Simulation model for maritime container terminal. Transp. Probl. 2018, 13, 47–54. [Google Scholar] [CrossRef]
  36. Cartenì, A.; de Luca, S. Tactical and strategic planning for a container terminal: Modelling issues within a discrete event simulation approach. Simul. Model. Pract. Theory 2012, 21, 123–145. [Google Scholar] [CrossRef]
  37. Cimpeanu, R.; Devine, M.T.; O’Brien, C. A simulation model for the management and expansion of extended port terminal operations. Transp. Res. Part E Logist. Transp. Rev. 2017, 98, 105–131. [Google Scholar] [CrossRef]
  38. Li, N.; Chen, G.; Govindan, K.; Jin, Z. Disruption management for truck appointment system at a container terminal: A green initiative. Transp. Res. Part D Transp. Environ. 2018, 61, 261–273. [Google Scholar] [CrossRef]
  39. Alvarez, J.F.; Longva, T.; Engebrethsen, E.S. A methodology to assess vessel berthing and speed optimization policies. Marit. Econ. Logist. 2010, 12, 327–346. [Google Scholar] [CrossRef]
  40. Triska, Y.; Frazzon, E.M.; Silva, V.M.D. Proposition of a simulation-based method for port capacity assessment and expansion planning. Simul. Model. Pract. Theory 2020, 103, 102098. [Google Scholar] [CrossRef]
  41. Guan, C.; Liu, R. Container terminal gate appointment system optimization. Marit. Econ. Logist. 2009, 11, 378–398. [Google Scholar] [CrossRef]
  42. Guan, C.Q.; Liu, R. Modeling gate congestion of marine container terminals, truck waiting cost, and optimization. Transp. Res. Rec. 2009, 2100, 58–67. [Google Scholar] [CrossRef]
  43. Assumma, V.; Vitetta, A. Microsimulation models in intermodal container terminals: Ordinary and perturbed conditions. In Proceedings of the 7th International Industrial Simulation Conference, Istanbul, Turkey, 13–16 July 2009; pp. 196–200. [Google Scholar]
  44. Fleming, M.; Huynh, N.; Xie, Y. Agent-based simulation tool for evaluating pooled queue performance at marine container terminals. Transp. Res. Rec. 2013, 2330, 103–112. [Google Scholar] [CrossRef]
  45. Chen, G.; Govindan, K.; Yang, Z. Managing truck arrivals with time windows to alleviate gate congestion at container terminals. Int. J. Prod. Econ. 2013, 141, 179–188. [Google Scholar] [CrossRef]
  46. Ambrosino, D.; Peirano, L. Truck Arrival Management At Maritime Container Terminals. ECMS 2016, 2016, 114–120. [Google Scholar]
  47. Minh, C.C.; Noi, N.V. Optimising truck arrival management and number of service gates at container terminals. Marit. Bus. Rev. 2023, 8, 18–31. [Google Scholar] [CrossRef]
  48. Minh, C.C.; Huynh, N. Optimal design of container terminal gate layout. Int. J. Shipp. Transp. Logist. 2017, 9, 640–650. [Google Scholar] [CrossRef]
  49. Yang, Z.; Chen, K.; Notteboom, T. Optimal design of container liner services: Interactions with the transport demand in ports. Marit. Econ. Logist. 2012, 14, 409–434. [Google Scholar] [CrossRef]
  50. Di Gangi, M.; Belcore, O.M. Risk reduction in transport system in emergency conditions: A framework for decision support systems. Saf. Secur. Eng. IX 2022, 206, 299. [Google Scholar] [CrossRef]
  51. Di Gangi, M.; Marco Belcore, O.; Polimeni, A. An Overview on Decision Support Systems for Risk Management in Emergency Conditions: Present, Past and Future Trends. Int. J. Transp. Dev. Integr. 2023, 7, 77–92. [Google Scholar] [CrossRef]
  52. De Vita, F.; Nocera, G.; Belcore, O.M.; Polimeni, A.; Longo, F.; Bruneo, D.; di Gangi, M. Traffic Condition Estimation at the Smart City Edge using Deep Learning: A Ro-Pax Terminal Case Study. In Proceedings of the 2022 IEEE International Smart Cities Conference (ISC2), Paphos, Cyprus, 26–29 September 2022; pp. 1–7. [Google Scholar] [CrossRef]
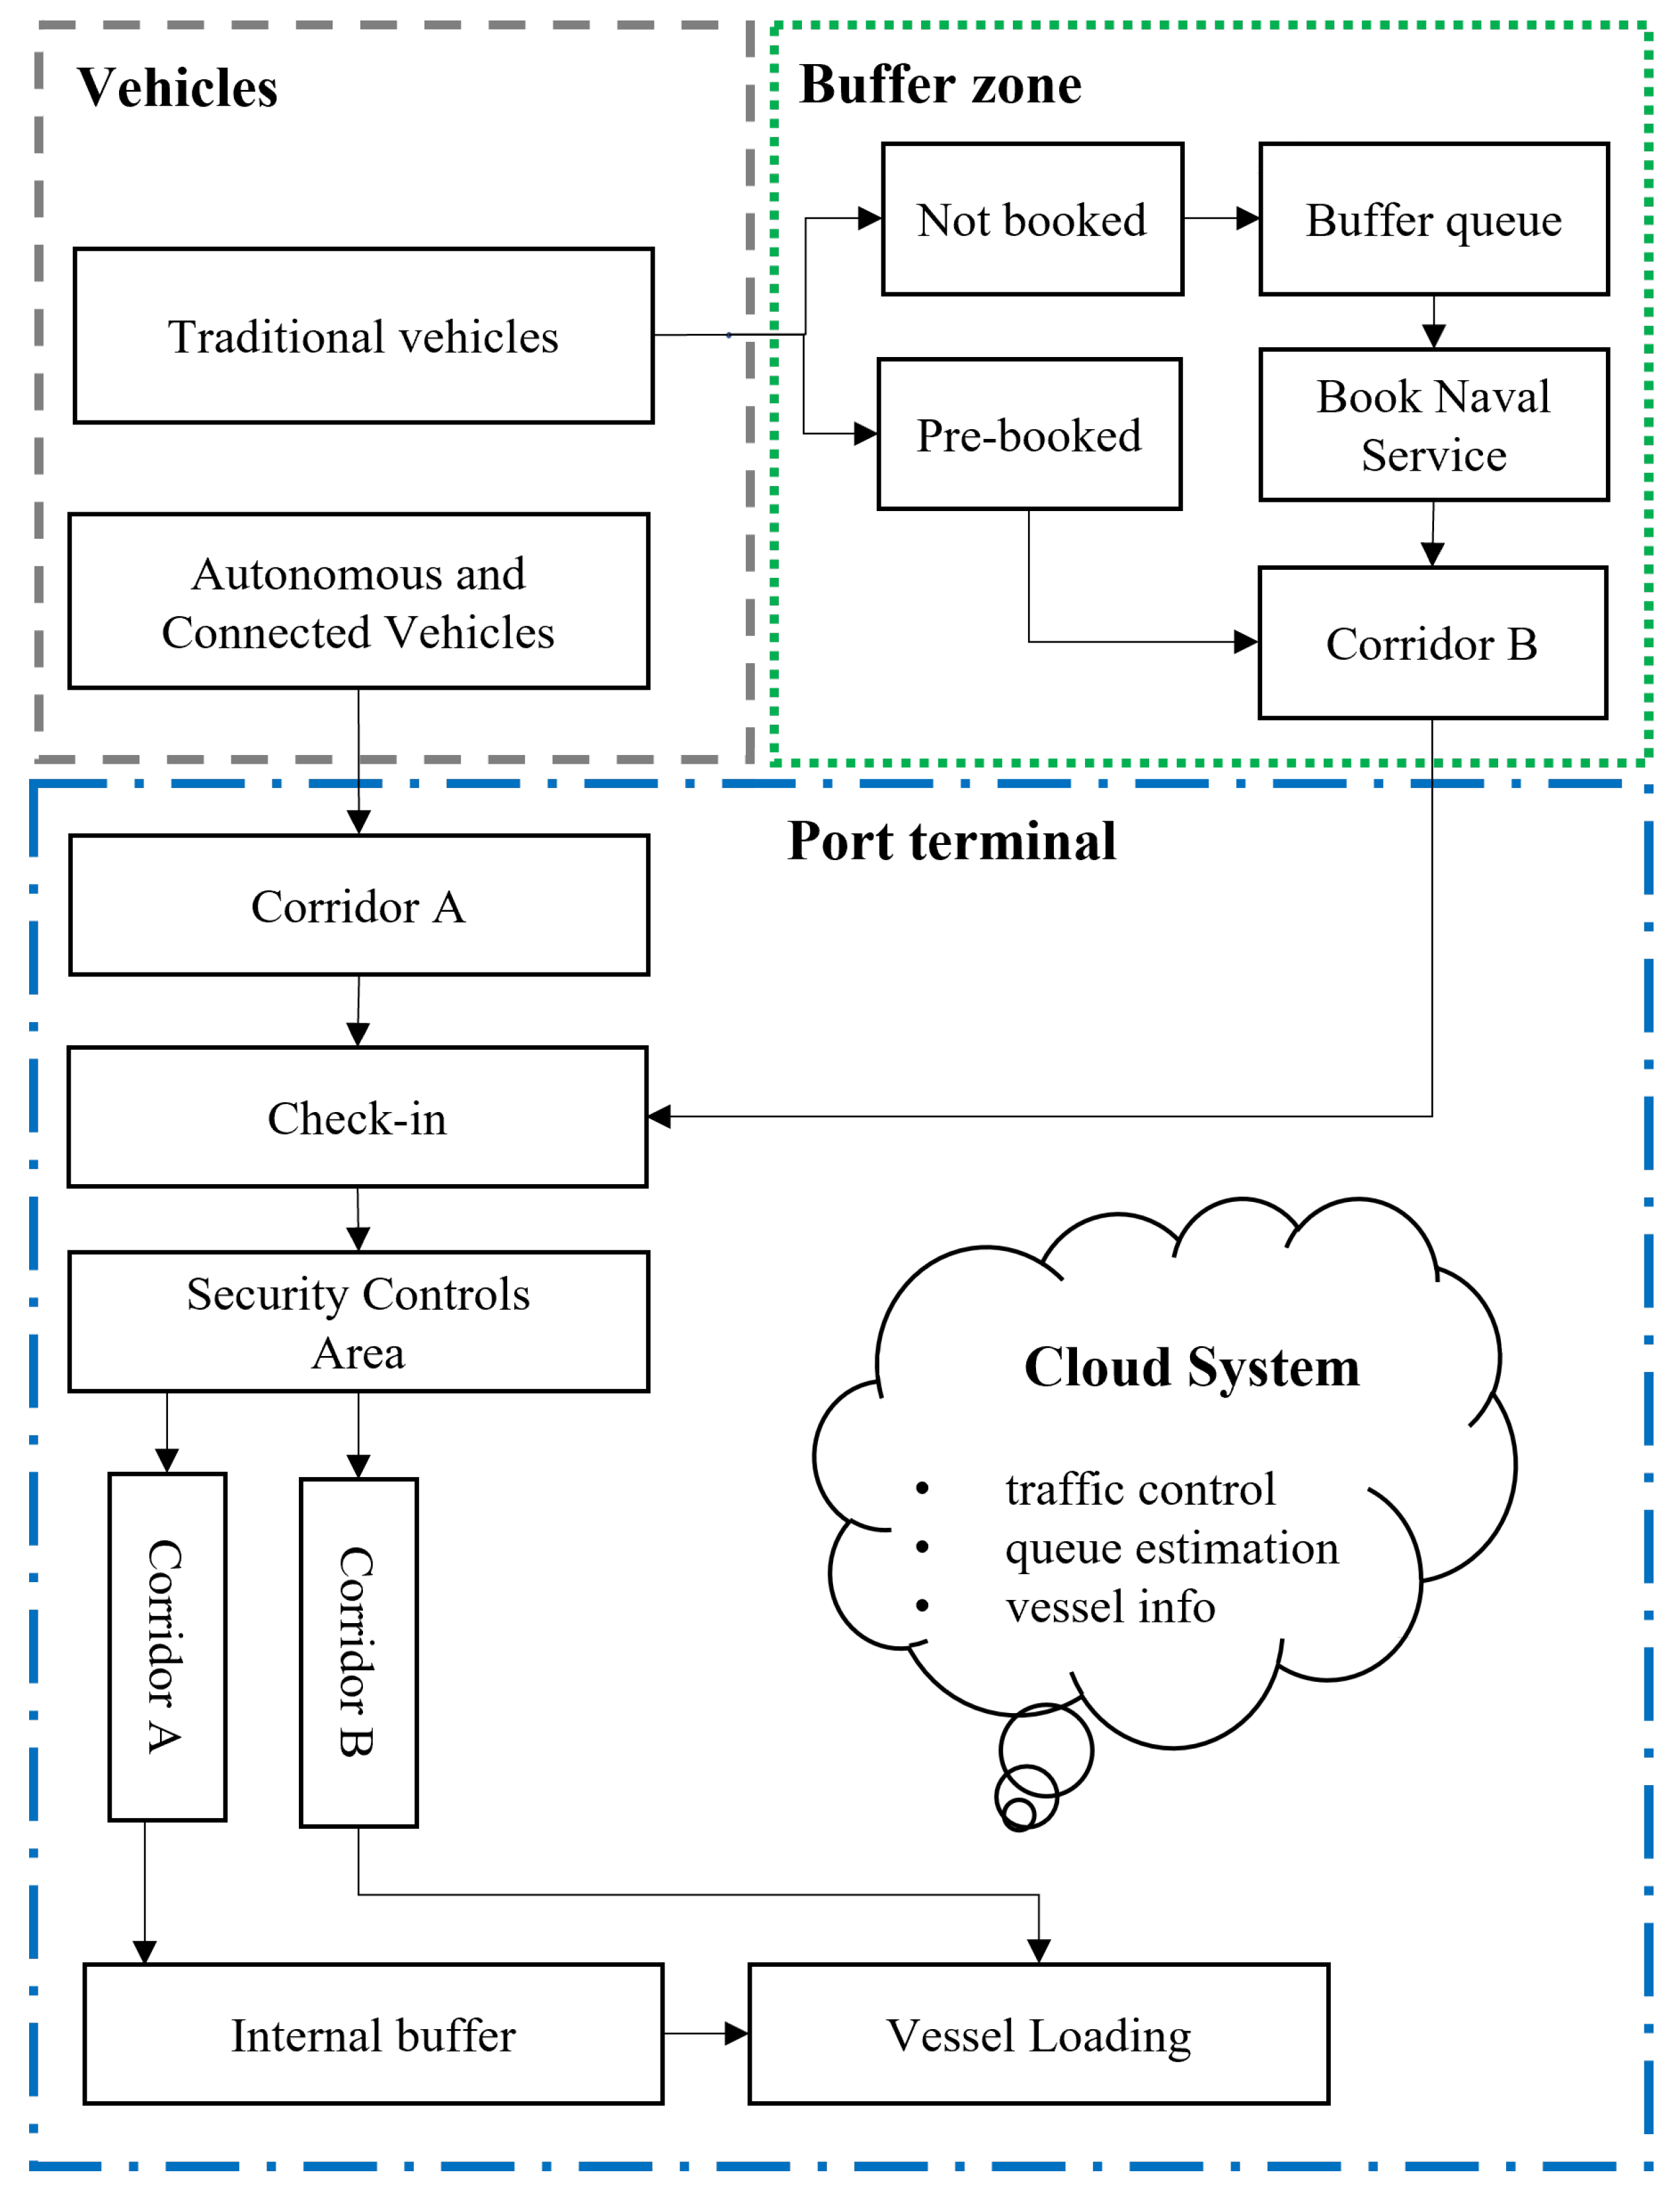
Figure 1. The context of a maritime port in an Intelligent Transport System (source: by the authors).
Sustainability 15 08168 g001
Figure 2. Aerial view of Tremestieri (Background map from OpenStreetMap).
Sustainability 15 08168 g002
Figure 3. Simplified scheme of the Port of Tremestieri (source: by the authors).
Sustainability 15 08168 g003
Figure 4. Number of vehicles served trough multiple runs (source: by the authors).
Sustainability 15 08168 g004
Figure 5. Simulating embarking factor at first available vessel (source: by the authors).
Sustainability 15 08168 g005
Figure 6. Simulating Buffer Zone mean occupancy (source: by the authors).
Sustainability 15 08168 g006
Figure 7. Simulating internal buffer mean occupancy (source: by the authors).
Sustainability 15 08168 g007
Figure 8. Stability test (source: by the authors).
Sustainability 15 08168 g008
Table 1. Classification of the literature review (source: by the authors).
PaperTerminalSimulation ApproachSoftwareModel Scope
Preston et al. [18]ro-roDESnot statedPlanning; Capacity
Iannone et al. [19]ro-roDESARENAPlanning Areas
Kaceli [20]ro-roDESARENAGate; Yard Capacity
Muravev et al. [25]ro-roDESARENA; AnyLogicScehduling; Capacity
Ozkan et al. [21]ro-roDESnot statedSched.; Coordination
Abourraja et al. [22,23]ro-roDESnot statedBert; Yard Capacity
Park et al. [24]ro-roDESnot statedAVGs Introduction
Sharif et al. [26]ro-roAgent-BasedNetLogoCapacity; Info
van Vianen et al. [28]Multi-ModalDESnot statedStackers operations
Parola and Sciomachen [27]Multi ModalDESWitnessCoord. Modal Shift
Jovanocic [29]ContainerDESnot statedTruck Arrivals System
Azab et al. [30]ContainerDESFlexSim CTTAS; Congestion
Neagoe et al. [31]ContainerDESPythonTAS; Handling
Nadi et al. [32]ContainerDESnot statedTSMS
Srisurin et al. [33]ContainerDESSIMIOSlot Allocation; Hand.
Schoroer et al. [34]ContainerDESDelphiInternal Transport
Rusca et al. [35]ContainerDESARENAPlanning; Capacity
Carteni and De Luca [36]ContainerDESWitnessPlanning; Capacity
Cimpeanu et al. [37]ContainerDESWitnessPlanning; Berth Occ.
Li et al. [38]ContainerDESnot statedBert; Yard Capacity
Alvarez et al. [39]ContainerDESC ++Bert; Yard Capacity
Triska et al. [40]ContainerMonte CarloMatLabBert; Gate; Storage
Guan and Liu [41,42]ContainerQueue Theorynot statedGate Capacity; Servers
Assumma and Vitetta [43]ContainerAgent-basedARENAPlanning
Fleming et al. [44]ContainerAgent-basedNetLogoPlanning; Capacity
Chen et al. [45]ContainerGenetic Algorithmnot statedTAS
Ambrosino and Peirano [46]ContainerLinear OptimizationC#TAS
Mihn et al. [47]ContainerGenetic Algorithmnot statedTAS
Minh and Huynh [48]ContainerGenetic Algorithmnot statedCongestion
Yang et al. [49]ContainerQueue Theorynot statedSlot Allocation; Waterway
Table 2. Mean time in system shared by priority classes (source: by the authors).
Scenario Outputs 1Automated/ConnectedPre-BookedNot Booked
Time in system (min)15’:00” ± 0’:50”22’:00” ± 1’:30”32’:00” ± 4’:45”
Served vehicles (n)169256136
1 The reported values refer to the mean values for the multiple runs.
Table 3. Mean waiting time into Buffer Areas (source: by the authors).
Scenario Outputs 1Automated/ConnectedPre-BookedNot Booked
Waiting Time12’:45”16’:24”22’:36”
1 The reported values refer to the average values for the multiple runs.
Disclaimer/Publisher’s Note: The statements, opinions and data contained in all publications are solely those of the individual author(s) and contributor(s) and not of MDPI and/or the editor(s). MDPI and/or the editor(s) disclaim responsibility for any injury to people or property resulting from any ideas, methods, instructions or products referred to in the content.