Article

Farmer Adoption of Climate-Smart Practices Is Driven by Farm Characteristics, Information Sources, and Practice Benefits and Challenges

1
California Climate Hub, United States Department of Agriculture (USDA), Davis, CA 95616, USA
2
Sustainable Food Systems, Princeton University, Princeton, NJ 08540, USA
3
California Sea Grant, University of California San Diego, La Jolla, CA 92093, USA
4
Department of Plant Sciences, University of California Davis, Davis, CA 95616, USA
*
Author to whom correspondence should be addressed.
Sustainability 2023, 15(10), 8083; https://doi.org/10.3390/su15108083
Submission received: 26 March 2023 / Revised: 28 April 2023 / Accepted: 3 May 2023 / Published: 16 May 2023
(This article belongs to the Special Issue Climate Change Mitigation and Adaptation in Sustainable Agriculture)

Abstract

:
Agriculture plays an important role in mitigation and adaptation to climate change. Yet, advances in climate-smart agriculture require a better understanding of farmer adoption. This exploratory paper uncovered differences that distinguish High, Moderate, and Low adopters of climate-smart practices. Our study utilized 952 in-person surveys of California farmers with a focus on mitigation and adaptation practices, along with farm characteristics, information sources, and practice benefits and challenges. Specifically, farmers with larger parcels were more likely to be High adopters, and farmers with access to only one water source were more likely to be Low adopters. There was no significant difference found between Moderate and High adopters’ use of any information sources. The ranking of different information sources changed between groups. Furthermore, there was no significant difference in the rate of Moderate and High adopters’ consideration of practice benefits. All groups identified practice uncertainty as the greatest challenge, with a significant difference between Moderate and High adopters. Our results demonstrate where differences occur between farmer adopter groups and by extension provide insights into where to target outreach efforts to promote the adoption of climate-smart practices in California agriculture.

1. Introduction

Agriculture is a substantial contributor to global climate change, with crops and livestock contributing over 11% of greenhouse gas emissions in the United States [1], and faces significant challenges in maintaining production under changing climate conditions [2]. Although crop-based production agriculture is not among the top contributors of greenhouse gas emissions to the atmosphere, it holds great promise in mitigating the adverse effects of climate change through improved nitrogen (N) management and carbon (C) sequestration. Thus, future agricultural systems will have to not only combat climate change through mitigation practices but also increase C storage through adaptation practices while continuing to feed a growing population in the face of climate impacts on food production. The need for both climate mitigation and adaptation actions across the agricultural sector is increasingly clear [3]. A key component of the effective integration of climate-smart agriculture strategies will be understanding both the drivers of and barriers to on-farm implementation that farmers face.
Climate mitigation and adaptation strategies will require simultaneous efforts that reduce emissions from agriculture, increase C sequestration on agricultural lands, and maintain or improve yields of food production. Because N is a key limiting nutrient in most soils, the use of N fertilizers has become ubiquitous across high-productivity agricultural systems over the past half-century, fueling substantial increases in food production. However, only about half of the N fertilizers applied to soils actually translate to the harvested product, while the other half may be lost to the environment through leaching to groundwater, where it contaminates drinking water supplies, or off-gassing, which can produce nitrous oxide (N2O), a powerful greenhouse gas with ~300 times the global warming potential of CO2. Thus, transitioning to climate-smart agriculture should involve practices that improve nutrient use efficiency (NUE), in order to reduce the amount of N2O emitted by cropland soils, while supporting efficient crop yields under changing climate conditions. A suite of management practices for achieving these goals are available, including practices that help to limit the over-use of N fertilizers, such as N budgeting, where N applications are tailored to fit N needs, and split N fertilizer applications, where nutrients are supplied to more closely match plant uptake and crop demand [4]. Carbon sequestration practices that have proven benefits for soil health provide further opportunity to reverse agricultural emissions and should be a part of the portfolio of practices being considered by farmers. Practices that promote soil carbon sequestration include the application of organic matter amendments to agricultural soils, which stimulates plant production and carbon sequestration via photosynthesis [5], and cover cropping, which similarly sequesters carbon in plant biomass and root exudates to the soil [6].
The appropriate combination of these practices to achieve desired mitigation and adaptation goals will vary across agricultural contexts and conditions [7,8] and require different degrees of investment and behavior changes by farmers [9,10]. Some management practices are more accessible (i.e., familiar, require less investment or system change), while others remain novel and more challenging to implement (i.e., costly, information-intensive, require operational transformation). A substantial body of research on farmer adoption behavior suggests a number of factors that can contribute to increased conservation practice adoption, including: access to information sources, positive attitudes towards conservation, higher education, larger farm sizes with access to greater capital, the recognition of co-benefits of practices (i.e., conservation and production), available market opportunities, history of past practice adoption, and positive social norms, such as the regional uptake of practice adoption [11,12,13,14]. The importance of each of these factors can vary greatly depending on the agricultural context and the specific management practice being adopted. For example, specific to the adoption of climate-smart agriculture practices, research has suggested that perceived capacity and self-efficacy [15], past experience with the effects of climate change [16], and beliefs that climate change is occurring and is attributable to human activity [17] are critical factors influencing adoption.
A widely recognized and often-applied theoretical framework in agricultural behavior change and adoption research is the Theory on Diffusion of Innovations [18], which describes how a new innovation is taken up by a specific population, where individuals differ in their timeliness of adopting new innovations, yielding “early” and “late” or High and Low adopters. Recent research leveraging this framework has begun to explore which of the aforementioned behavioral drivers generally thought to increase conservation practice adoption are significant drivers at different stages of an innovation’s adoption [19,20,21]. Understanding the characteristics that differentiate early versus late or High versus Low adopters, particularly on novel practices or suites of management practices, remains an open research question that requires context-specific, place-based studies. Developing improved understandings of the social and behavioral characteristics of early and late and/or High and Low adopter groups can provide insights for tailoring outreach to different farmers and developing intervention programs that effectively increase rates of adoption.
This exploratory paper aims to better understand the characteristics that distinguish High, Moderate, and Low adopters of climate-smart agriculture practices, leveraging survey data from 952 farmers across three regional water quality coalitions and diverse cropping systems in the Central Valley of California as a case study. The data presented and analyzed in this paper come from a larger research project focused on understanding farmers’ adoption of diverse suites of conservation practices, which focused on farmers’ behavioral motivations, barriers to adoption, access to information sources, and attitudes and beliefs regarding agricultural impacts on the environment [9,10,19]. This paper uniquely focuses on respondents’ adoption of four climate-smart practices including the mitigation practices of N budgeting and split fertilizer application and the adaptation practices of cover cropping and the use of organic matter amendments. Expanding these practices to California farms is of particular interest for their great promise of climate benefits, thus requiring a focused understanding of the behavioral factors that are likely to drive their adoption. Our analysis focuses on the differences between adoption groups in terms of farm characteristics, what benefits farmers perceive with each practice, the challenges that hinder further practice adoption, and where farmers source information.

2. Materials and Methods

2.1. Survey Approach

The survey data collection took place in the San Joaquin Valley, an area of California’s Central Valley that lies south of the Sacramento-San Joaquin River Delta. The region is dominated by irrigated agriculture, with a large diversity of perennial and annual crops in production. The survey data collection was conducted in-person at annual grower meetings hosted by regional watershed coalitions mandated to improve the conditions of water quality. The San Joaquin Delta and County Water Quality Coalition and East San Joaquin Water Quality Coalition in the North San Joaquin Valley, whose memberships includes over 7900 members, and the Southern San Joaquin Valley Management Practice Evaluation Program representing Water Quality Coalitions in the Southern San Joaquin Valley, whose membership is made up of over 10,700 members, were selected as regional partners for this survey effort. A description of the sampling approach was first described by Khalsa et al. [9] and summarized herein. A total of 16 in-person meetings were attended from January to April in 2017 and 2018, including 7 meetings in 2017 and 9 meetings in 2018. The mandatory nature of these meetings reduced the potential for selection bias, and care was taken to survey different geographical locations each year so as not to survey the same populations twice. In total, we received 952 usable responses. The meetings were attended by over 3100 farmers during both years for a survey response rate of 31% of meeting attendees.
In the design of the survey tool, we considered the context of the farming communities and regions. Many San Joaquin Valley farmers manage more than one parcel, and parcels may be noncontiguous. For this reason, the survey tool asked farmers to consider their largest, most important parcel. In the first section of the survey, farmers were asked to report characteristic information about the parcel, including crop type, parcel size, ownership, irrigation system, and water source. Crop type was measured categorically, including options for fruits, nuts, vegetables, and field crops. Parcel size was also measured categorically, with options for size of 1–20, 21–40, 41–100, and greater than 101 hectares. Options for ownership of the parcel included leasing or owning. Irrigation system options included sprinkler, drip microirrigation, flood, or furrow irrigation. Water source options for their parcel were either surface water including riparian rights, irrigation district water, or groundwater. In the second part of the survey, farmers were asked about the adoption of a host of climate-smart practices on the parcel during the last growing season. The practices included in this study analysis were (1) the use of an N budget, (2) split fertilizer application as mitigation practices, (3) the use of organic matter amendments (OMA), and (4) cover cropping as adaptation practices. Farmers were categorized as High, Moderate, and Low adopters, and Table 1 demonstrates the full breakdown of each category. Low adopters were those who adopted zero of the four practices, one practice overall, or one adaptation and one mitigation practice. Moderate adopters adopted both practices in the mitigation or adaptation or categories and in some cases also adopted one practice from the other category. High adopters were those who adopted all four practices, making them the strongest adopters.
Farmers were asked to identify information sources they use to learn more about conservation management practices, which included the county agricultural commissioner, the University of California cooperative extension, certified crop advisors, pest control advisors, water quality coalitions, resource conservation districts (RCD), industry associations, and grower peers. Furthermore, we asked in general about the benefits associated with adoption, including: nutrient use efficiency, water savings, soil health, adaptation to drought, extreme precipitation and/or extreme temperature, regulatory relief, and improvement in yield and/or crop quality. Finally, for each individual practice, farmers were asked about the challenges associated with adopting the practice, including: cost, labor requirements, the need for supplies, requirement for technical expertise, the lack of practice efficacy, and practice uncertainty. Practice uncertainty is defined herein as farmers being unaware of the challenges associated with a particular practice.

2.2. Data Analysis and Statistics

The objective of the descriptive data analysis was to characterize differences in the perceived benefits, challenges, and information sources accessed by farmers falling into the High, Moderate, and Low adopter groups. Farmers were characterized as belonging High, Moderate, and Low climate-smart adopter groups according to the criteria outlined in Table 1 below. The adoption of each practice was considered as a binary variable (0 for non-adoption and 1 for adoption). The farm size, ownership, irrigation system, and water source were all simplified into two-group comparison factors (e.g., parcels less than or equal to 20 hectares versus those greater than 20 hectares; leased versus owned; flood or furrow irrigation only versus pressurized sprinkler or drip microirrigation; and groundwater only versus surface water). All practice challenges and benefits were coded as indicated or not by the farmer for each practice. Lastly, each individual information source was coded as indicated or not by the farmer. Challenges were listed for each individual practice, and benefits and information sources were listed for general use without association with specific practices. Farmers were given the option to select all that apply for challenges, benefits, and information sources. Kruskal–Wallis t tests were used to test for significant differences between climate-smart adopter groups for each of the farm characteristics, challenges, benefits, and information sources. Dunn tests were used for mean separation as a post hoc analysis. All statistical analyses and model rendering were carried out in STATA 15.1 (StataCorp LLC, College Station, TX, USA).

3. Results

3.1. Adopter Groups

The 952 farmers surveyed in this work broke out into High, Moderate, and Low adopter groups. High, Moderate, and Low adopters totaled 204, 432, and 316 responses or 21.4, 45.4, and 33.2% of the total farmers surveyed, respectively. All farmers in the High adopter group reported adopting both mitigation practices of the use of an N budget and split application and both adaptation practices of the use of organic matter amendments and cover cropping, for a total of four practices. The largest segment of the Moderate adopter group included 234 farmers adopting both mitigation practices and one of the adaptation practices for a total of three practices. The largest segment of the Low adopter group included 133 farmers adopting either one mitigation or one adaptation practice for a total of one practice. The adoption of both adaptation practices and no mitigation practices in the Moderate adopter group totaling 16 farmers was the smallest segment of any group.

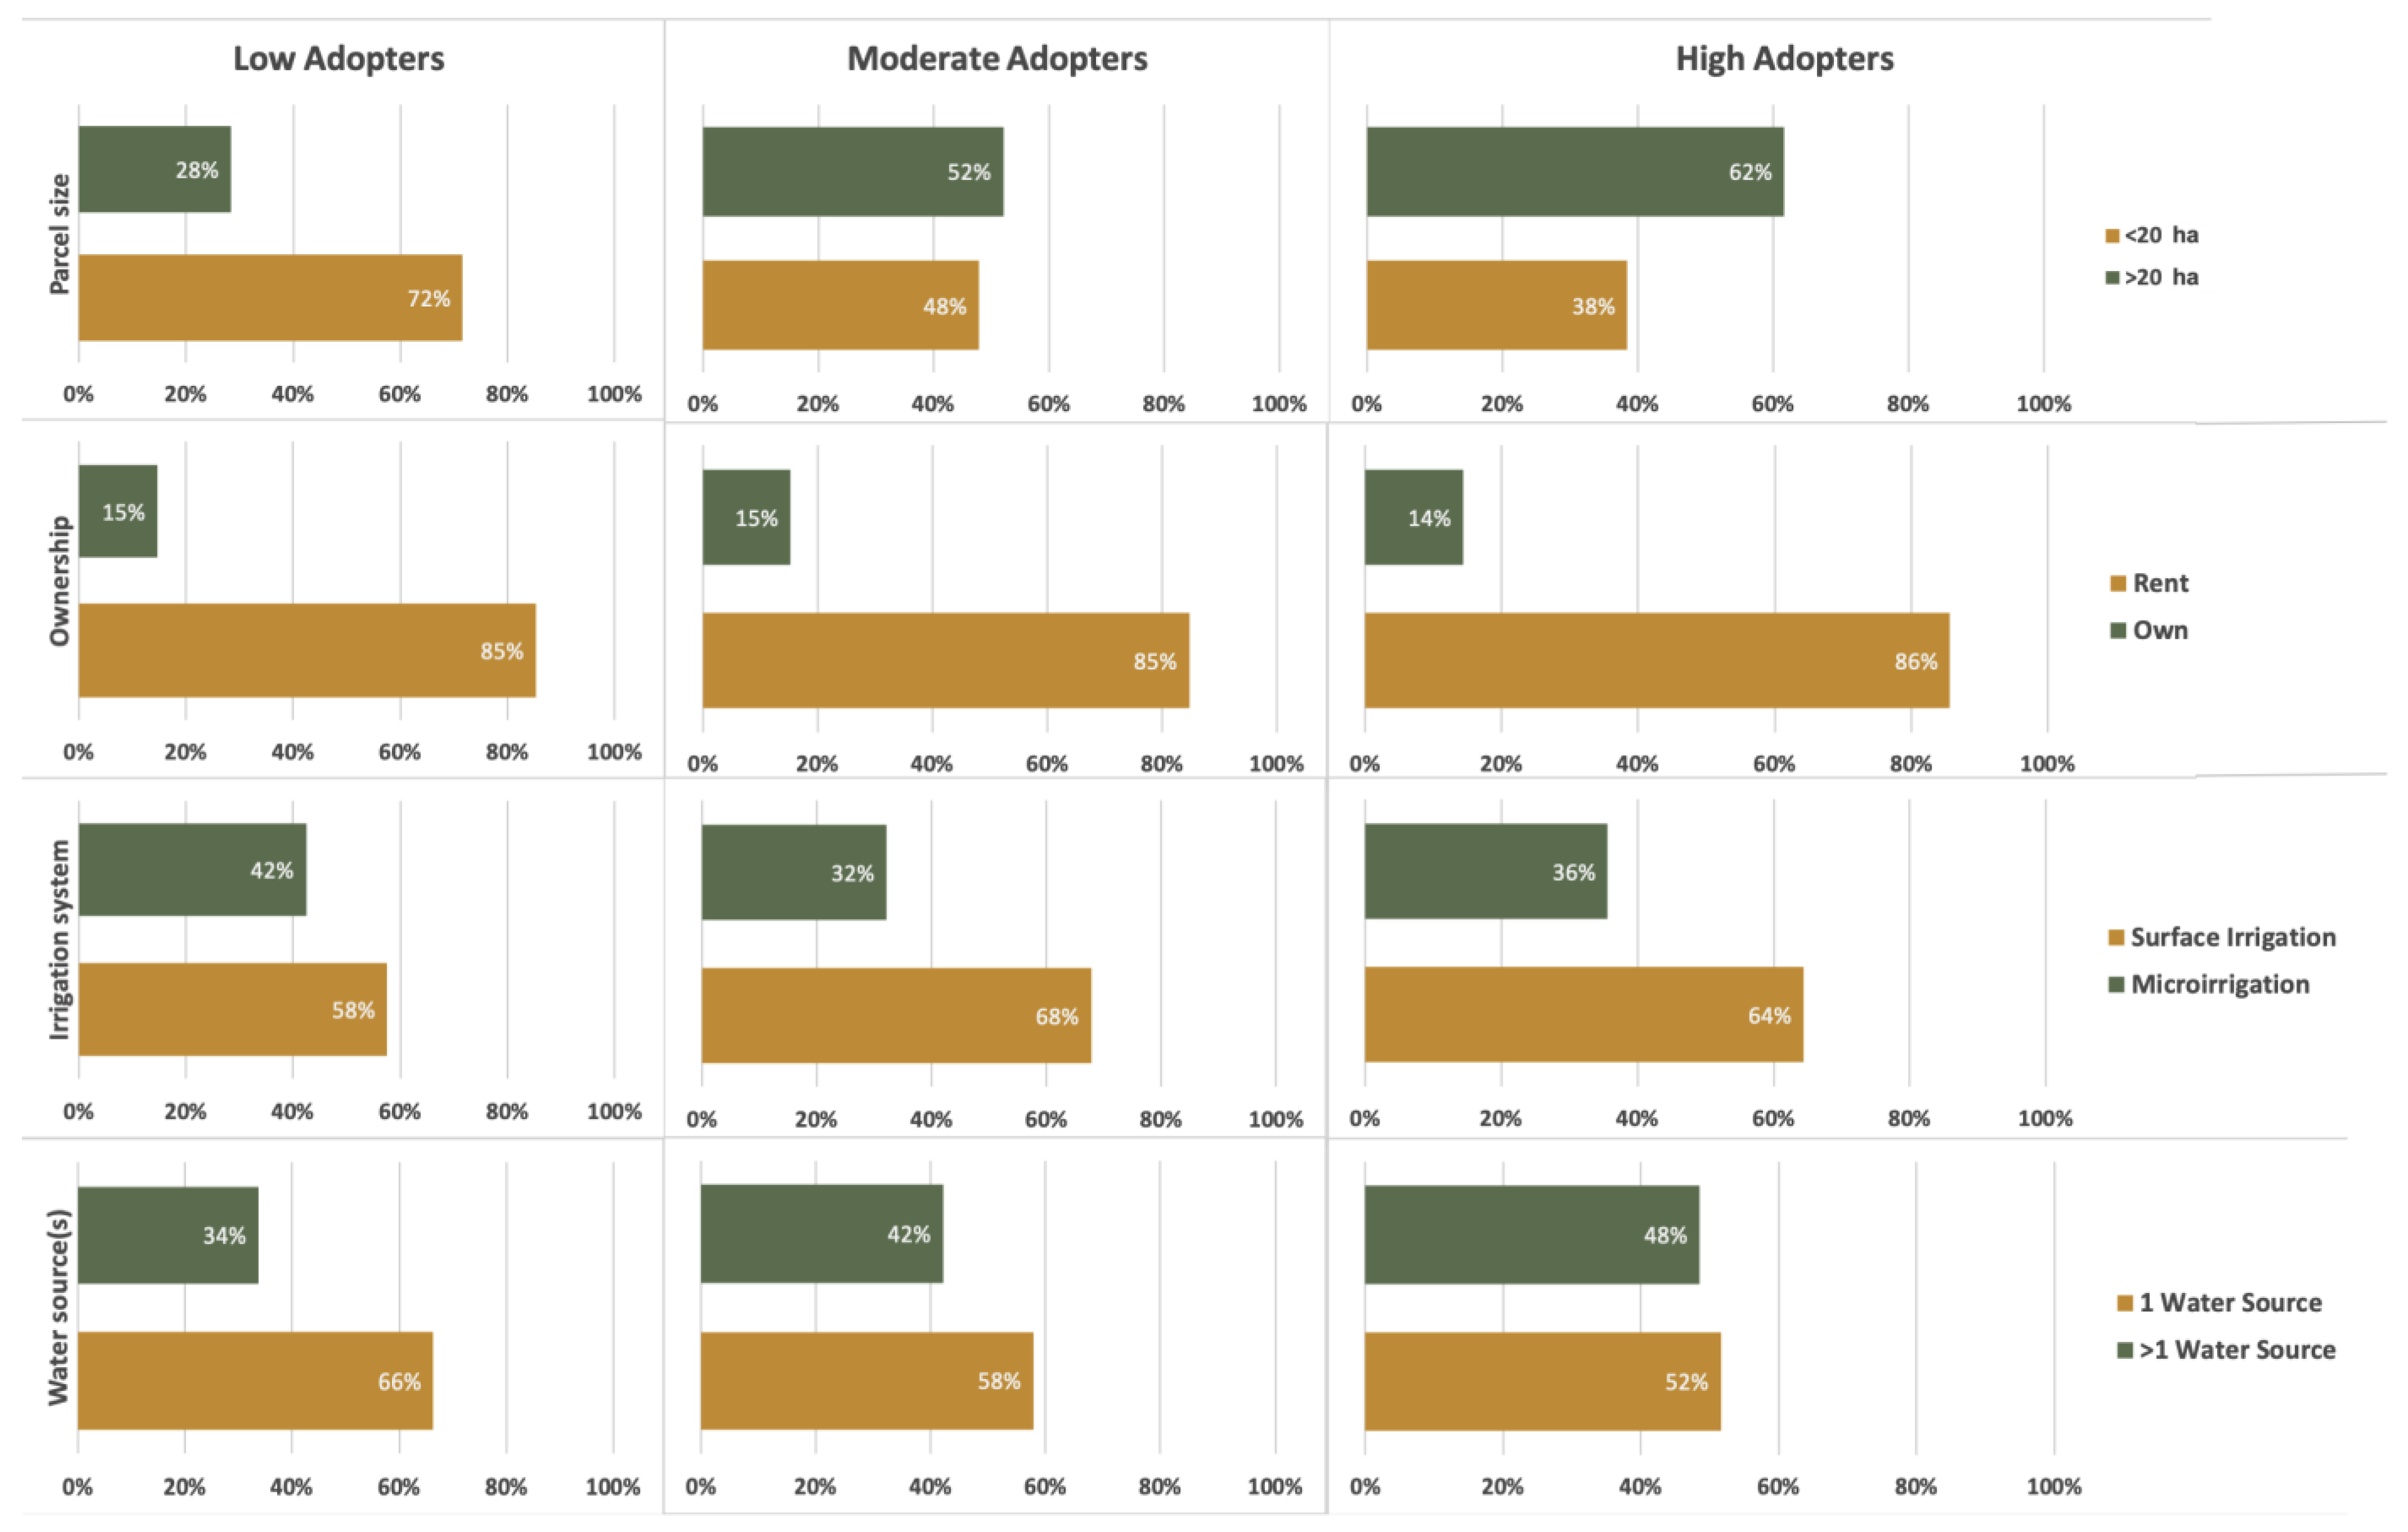
3.2. Farm Characteristics

We examined four main farm characteristics: farm size (<20 ha or >20 ha), ownership (i.e., whether the property is owned or rented), irrigation source (micro or surface), and the number of water sources (1 or >1). Figure 1 shows the percentage breakdown of all groups’ farm characteristics, grouped by adoption group. We found significant statistical differences between the High, Moderate, and Low adopters’ farm characteristics except in the instance of owning versus renting (p = 0.946; Table 2). Specifically, we found that farmers with larger parcels were more likely to fall into the High adopter group, indicating that farm size may positively predict the adoption of climate-smart practices. Furthermore, farmers with access to only one water source were more likely to fall into the Low adopter group, indicating that greater water source diversity may positively predict the adoption of climate-smart practices.

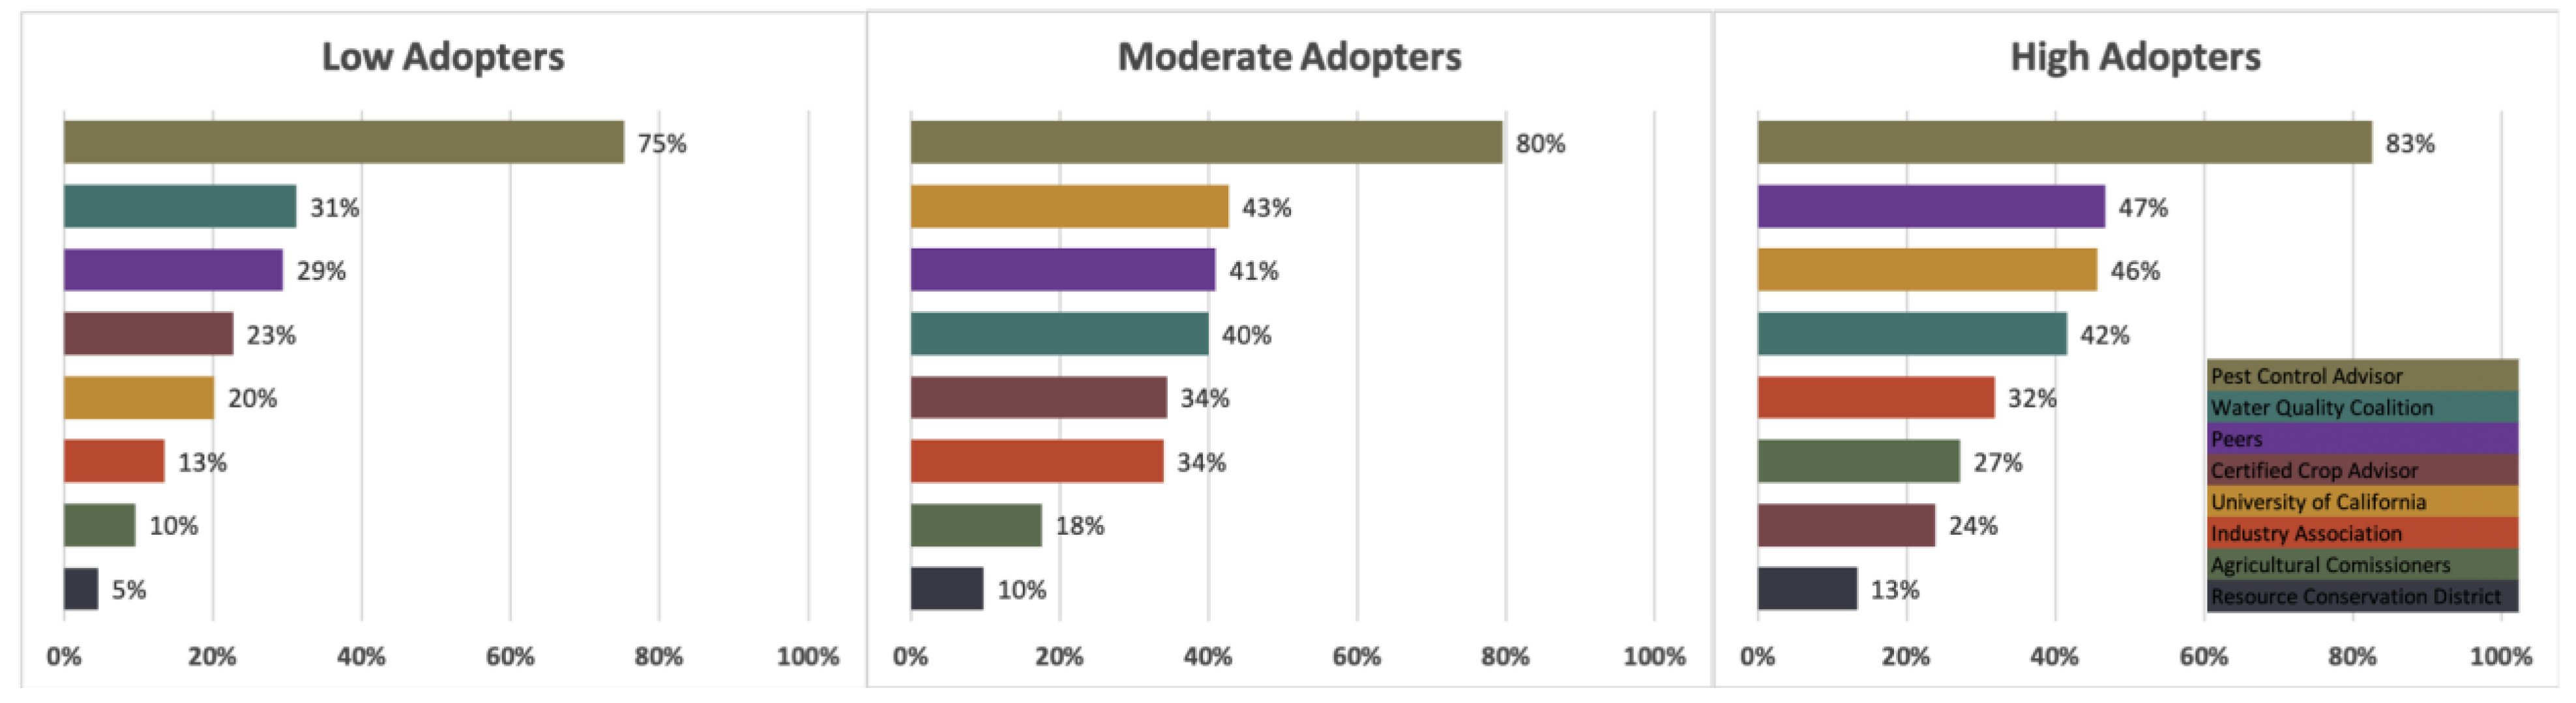
3.3. Information Sources

There was no statistically significant difference found between Moderate and High adopters’ use of any information sources, except regarding their usage of agricultural commissioners, where High adopters were found to utilize the source at a higher statistical significant rate than Moderate adopters (p = 0.002; Table 2). This similarity suggests information networks are not a differentiating characteristic between the Moderate and High adopter groups. Low adopters identified the water quality coalition as the second-most utilized information source at 31% (Figure 2). Here, we found Low adopters to utilize this source at a lower statistically significant rate than both Moderate adopters (p = 0.010) and High adopters (p = 0.011; Table 2). While the percentage of farmers who utilized water quality coalitions continued to grow throughout the Moderate and High adopter groups, its ranking went from second-highest to fourth-highest, falling below the University of California and grower peers (Figure 2).
We also found an interesting difference in rankings between groups regarding certified crop advisors and the University of California. Here, we see Low adopters rank certified crop advisors above the University of California, ranked third and fourth, respectively. However, as farmers become Moderate and High adopters, the University of California is ranked higher (second for Moderate adopters and third for High adopters), and certified crop advisors are ranked lower (fifth for Moderate adopters and seventh for High adopters). However, all groups ranked resource conservation districts last and pest control advisors first. While there was no statistically significant difference found between Low and Moderate adopters’ use of pest control advisors (p = 0.085), there was a statistically significant difference between Low and High adopters (p = 0.026; Table 2).

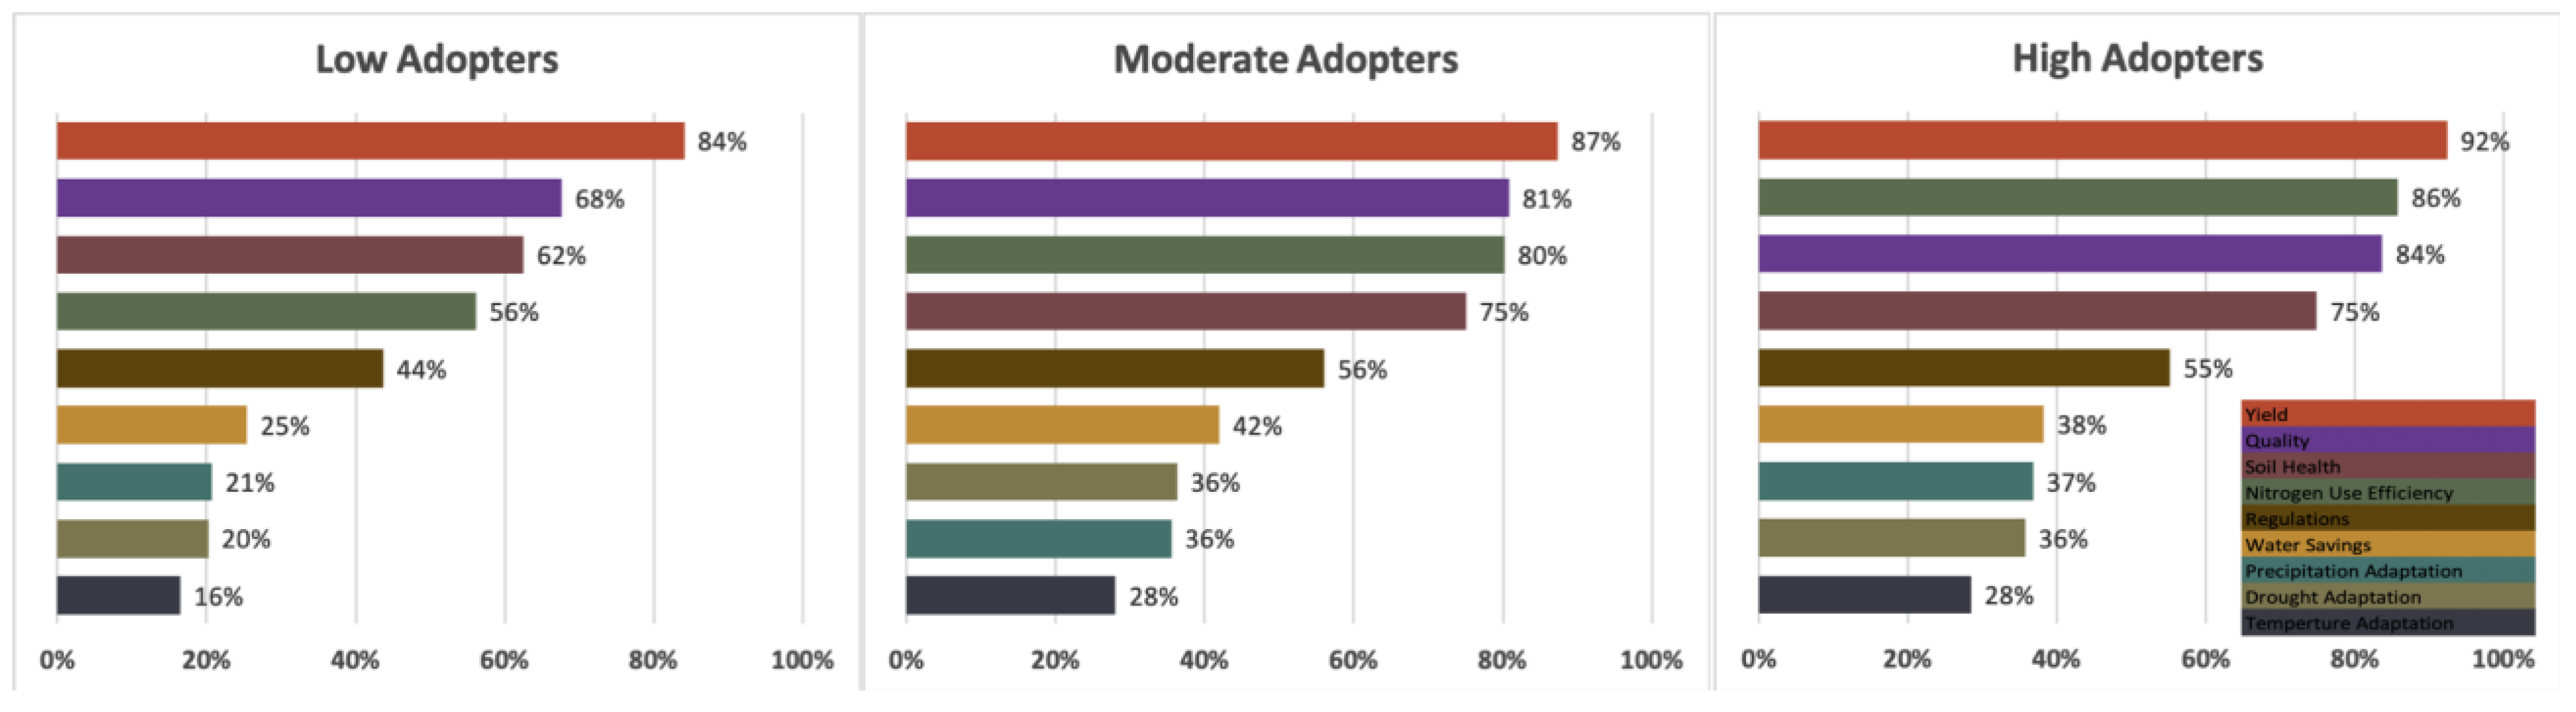
3.4. Practice Benefits

Just as with many of the information sources, we found there to be no statistically significant difference in the rate of Moderate and High adopters’ consideration of benefits of varying climate-smart practices (Table 2). Low adopters considered each benefit at a lower rate than all other groups. While yield is the highest ranked benefit identified by Low adopters (84%), they recognize yield to a lesser extent in comparison to High adopters at a statistically significant level (p = 0.006) (Table 2). Nonetheless, all groups ranked yield as their top-ranked benefit (Figure 3). The second highest-ranked benefit named by both Low and Moderate adopters was crop quality (86% and 81%, respectively); however, again, significantly fewer farmers in the Low adopter group named quality as a benefit when compared to farmers in the Moderate and High adopter groups (p =< 0.001; p =< 0.001 respectively). High adopters ranked nitrogen use efficiency second (86%), above crop quality (84%) (Figure 3). All groups ranked adaptation to temperature as the lowest (16%, 28%, and 28%, respectively; Figure 3).
Among all benefits, High adopters consistently identified benefits at a higher statistically significant rate than Low adopters, though we see no statistically significant difference between High and Moderate adopters. This suggests that greater adoption occurs among farmers who consider more benefits such as water savings, drought adaptation, precipitation adaptation, temperature adaptation, soil health, regulations, and quality.

3.5. Challenges

All groups identified practice uncertainty as the greatest challenge (58%, 60%, and 40%, respectively) (Figure 4), but while we found a greater statistical difference between Moderate and High adopters (p =< 0.001), we found no statistically significant difference between Low and Moderate adopters’ consideration of practice uncertainty as a challenge (p = 0.357; Table 2). All groups also ranked the need for supplies as the lowest challenge (17%, 11%, and 10%, respectively; Figure 4). Contrasting the statistical breakdown of the group’s highest-ranked challenge, here, we found no statistically significant difference between Moderate and High adopters’ consideration of the need for supplies as a challenge (p = 0.371), but Low adopters identified this challenge at a higher statistically significant rate than Moderate adopters (p = 0.032) and High adopters (p = 0.029) did (Table 2).
High adopters identified all challenges at a lower percentage rate compared to both Low and Moderate adopters (Figure 4). At the same time, High adopters ranked certain challenges far different than Low adopters. For example, Low adopters identified labor requirements at the second-lowest rate (20%), whereas High adopters identified it as the third-highest (28%) (Figure 4). Further, the lack of practice efficacy appears to be ranked lower as farmers move from Low to Moderate to High adopters (ranked second, third, and fourth, respectively) (Figure 4). High adopters selected two challenges equally at the highest rate, identifying both practice uncertainty and the cost of the practice at 40% (Figure 4). We found there to be no statistically significant difference between Moderate and High adopters’ consideration of challenges, with the exception of the uncertainty of efficacy (p = 0.005) (Table 2).

4. Discussion

The positive relationship between farm size and climate-smart practice adoption elucidated here is supported by existing research that shows a consistent trend in farm size supporting greater conservation practice adoption [12,22,23]. This relationship is attributable to increased access to capital and economies of scale that facilitate the distribution of costs and buffer against the risks associated with adopting new practices that may not see immediate returns on investment [23]. Prior work has also shown that California farmers with access to both groundwater and surface water resources are more likely to adopt more conservation-minded practices with respect to nitrogen management [9]. Although we do not differentiate between the type of water source here, we similarly show that farmers with access to only one water source are more frequently found in the Low adopter group, as compared to those with two or more water sources, who are more frequently found in the Medium and High adopter groups. Moreover, a greater proportion of Low adopters report the use of microirrigation than do Moderate and High adopters, and the use of this highly efficient method of water delivery has been previously shown to have a negative association with the adoption of cover crops [9]. These findings suggest that both water and soil conservation practices may co-vary and be influenced by the farm scale. Further, the wider use of microirrigation among Low adopters may speak to the challenges of having access to only a single water source in a state that experiences cyclical drought and the tendency for producers to make on-farm management decisions based on water as a limiting factor [24].
In addition to limiting factors such as water, numerous variables have been proposed as driving factors for farmer decision making and practice adoption [12,25]. When the benefits of adoption clearly outweigh the risks, farmers are more inclined to adopt a new practice [26], highlighting the importance of farmer accessibility to high-quality information. Our survey results show that Pest Control Advisors (PCAs) are by far the most frequently used information source among farmers, which is in line with a prior survey [27] that reported that 97% of surveyed California almond producers use PCAs. In California, PCAs are state-licensed professionals who can make on-the-ground recommendations for pest management and must certify farmers’ pesticide applications. The outsized rate of PCAs as information sources relative to other sources is likely due to this regulatory nature of pesticide application requirements in California, but the frequency of contact with PCAs also sheds light on an opportunity to leverage these information sources as trusted and relevant conduits to farmers as an effective means of encouraging climate-smart practice adoption.
Although peers and other technical service provider groups were less frequently listed as information sources across all adoption groups, we note that the higher relative usage of a variety of information sources among Moderate and High adopters is consistent with other studies [28,29]. That Low adopters less frequently use technical service providers as information sources highlights an opportunity for the technical service provider community to focus on outreach and educational programming efforts in support of farmer learning. Recent work by Wood et al. [19] has identified two stages of farmer learning that must occur in order for farmers to adopt new practices. The first stage involves “conceptual learning” and appears to be driven by variables such as stewardship attitudes and farmer awareness of agriculture’s environmental impact. This is followed by an “applied learning” stage, which is driven by informational support. These stages of learning expand on the diffusion of innovation theory that holds that social networks and communication channels can play an important role in moving individuals from Low to High adopter groups [18].
Our analysis illuminates how certain information sources, such as the University of California and industry associations, may serve an important role in moving farmers out of Low adopter groups into higher adopter groups. We posit that technical service providers from such organizations can facilitate two key steps to farmer learning that support and enable farmer adoption of climate-smart practices. First, technical service providers may support conceptual learning via programming to increase awareness of the impact of climate change on agriculture and the role of greenhouse gas generation from agriculture. Second, technical service providers may best support applied learning through information support that addresses the benefits of and barriers to practice adoption.
Programming on climate change science can support conceptual learning and may be warranted in light of recent work by Singh et al. [30], who showed that farmers with more information on climate change were more likely to have a positive view of adopting climate-informed practices. Likewise, Haden et al. [16] showed that while focusing on local climate impacts can be enough to motivate farmers to adopt adaptation practices, motivating the adoption of mitigation practices may require focusing on global climate impacts and the ability to contribute to global climate mitigation. Regarding applied learning, the results from this survey suggest that farmers in the High adopter group acknowledge a wider range of benefits, supporting the idea that through providing information that emphasizes multiple benefits, technical service providers may further motivate adoption. Likewise, technical service providers may motivate climate-smart practice adoption through addressing farmers’ commonly cited barriers through providing information or analytical support to reduce farmer uncertainty and show evidence of practice efficacy. For example, prior work suggests that field demonstrations and support of field trials may help reduce uncertainty around practice adoption [31]. These conceptual and applied programming approaches may be particularly important for motivating Low adopters, though the lower use of technical service providers beyond PCAs—particularly among Low adopters—may indicate that outreach efforts to build relationships and trust are required as a first step.
Still, we note that there is a difference between motivation and action in adopting climate-smart practices. An important counterexample to assuming that positive climate beliefs result in climate-smart agriculture behavior change was demonstrated by Niles et al. [15], who showed that positive attitudes toward climate change practices increased farmers’ intended adoption behaviors but were not enough to overcome barriers to adoption and result in actual practice adoption. In their research, Niles et al. [15] showed that perceived capacity and self-efficacy were more consistent predictors of both the intended and actual adoption of climate-smart practices. This is where technical service providers may step in again to support applied learning in a way that results in increased actual practice adoption. Technical advisors will need to communicate how farmers’ adoption of climate-smart practices will be effective in achieving climate adaptation and mitigation goals, as well as support farmers in overcoming the barriers to adoption associated with specific practices.

5. Conclusions

This paper uncovered differences in High, Moderate, and Low adopters of climate-smart agriculture practices. We found that farmers with larger parcels were more likely to be in the High adopter group, and farmers with access to only one water source were more likely to be in the Low adopter group. There was no statistically significant difference found between Moderate and High adopters’ use of any information source, and the ranking of information sources changed between the groups. We found there to be no significant difference in the rate of Moderate and High adopters’ consideration of benefits of climate-smart practices and a greater statistical difference between Moderate and High adopters, which suggests addressing uncertainty, and not emphasizing benefits, is the final barrier to the transition into the High adopter group. The results from this work demonstrate where there are differences between adopter groups, providing insights into where to target outreach efforts to promote the adoption of climate-smart practices. By extension, this work suggests that technical assistance providers should emphasize more practice benefits, address uncertainties, and develop incentive programs that overcome these barriers and are essential in ensuring climate-smart practices are inclusive of different farmers.

Author Contributions

D.J.: Conceptualization, Methodology, Formal Analysis, Data Curation, Writing—Original Draft, Writing—Review & Editing, Visualization; M.A.: Resources, Writing—Original Draft, Writing—Review & Editing, Funding Acquisition; L.E.P.: Writing—Original Draft, Writing—Review & Editing; J.R.: Conceptualization, Methodology, Data Curation, Writing—Original Draft, Writing—Review & Editing; S.M.O.: Conceptualization, Resources, Writing—Review & Editing, Funding Acquisition, Supervision, Project Administration; S.D.S.K.: Conceptualization, Resources, Methodology, Formal Analysis, Data Curation, Writing—Original Draft, Writing—Review & Editing, Funding Acquisition, Visualization, Supervision, Project Administration. All authors have read and agreed to the published version of the manuscript.

Funding

This work was funded by the California Department of Food and Agriculture Fertilizer Research and Education Program under award number 16-0620-SA-0 and supported by the John Muir Center of the Environment’s Working Lands Innovation Center at UC Davis.

Institutional Review Board Statement

This project was granted exempt status by the University of California IRB under approval number 1009676-6.

Acknowledgments

We appreciate the support from multiple California agriculture stakeholders for supporting this work, Mark Lubell and Patrick Brown for conceptualizing the initial work, and Benjamin Houlton and Whendee Silver for leading the Working Lands Innovation Center. We are grateful to our funders for their support.

Conflicts of Interest

The authors declare no conflict of interest.

References

  1. EPA. Inventory of U.S. Greenhouse Gas Emissions and Sinks; EPA: Washington, DC, USA, 2022.
  2. Ray, D.K.; West, P.C.; Clark, M.; Gerber, J.S.; Prishchepov, A.V.; Chatterjee, S. Climate change has likely already affected global food production. PLoS ONE 2019, 14, e0217148. [Google Scholar] [CrossRef] [PubMed]
  3. Pörtner, H.O.; Roberts, D.C.; Adams, H.; Adler, C.; Aldunce, P.; Ali, E.; Begum, R.A.; Betts, R.; Kerr, R.B.; Ibrahim, Z.Z.; et al. Food, fibre, and other ecosystem products. In Climate Change 2022: Impacts, Adaptation and Vulnerability; Contribution of Working Group II to the Sixth Assessment Report of the Intergovernmental Panel on Climate Change; Cambridge University Press: Cambridge, UK; New York, NY, USA, 2022; pp. 713–906. [Google Scholar]
  4. Alva, A.K.; Paramasivam, S.; Fares, A.; Delgado, J.A.; Mattos, D., Jr.; Sajwan, K. Nitrogen and Irrigation Management Practices to Improve Nitrogen Uptake Efficiencyand Minimize Leaching Losses. J. Crop Improv. 2006, 15, 369–420. [Google Scholar] [CrossRef]
  5. Baisden, W.T.; Amundson, R.; Cook, A.C.; Brenner, D.L. Turnover and storage of C and N in five density fractions from California annual grassland surface soils. Glob. Biogeochem. Cycles 2002, 16, 64-1–64-16. [Google Scholar] [CrossRef]
  6. Mutegi, J.K.; Petersen, B.M.; Munkholm, L.J. Carbon turnover and sequestration potential of fodder radish cover crop. Soil Use Manag. 2013, 29, 191–198. [Google Scholar] [CrossRef]
  7. Teshager, A.D.; Gassman, P.W.; Secchi, S.; Schoof, J.T. Simulation of targeted pollutant-mitigation-strategies to reduce nitrate and sediment hotspots in agricultural watershed. Sci. Total Environ. 2017, 607–608, 1188–1200. [Google Scholar] [CrossRef]
  8. McLellan, E.L.; Cassman, K.G.; Eagle, A.J.; Woodbury, P.B.; Sela, S.; Tonitto, C.; Marjerison, R.D.; Van Es, H.M. The Nitrogen Balancing Act: Tracking the Environmental Performance of Food Production. BioScience 2018, 68, 194–203. [Google Scholar] [CrossRef]
  9. Khalsa, S.D.S.; Rudnick, J.; Lubell, M.N.; Sears, M.; Brown, P.H. Linking agronomic and knowledge barriers to adoption of conservation practices for nitrogen management. Front. Agron. 2022, 4. [Google Scholar] [CrossRef]
  10. Rudnick, J.M.; Lubell, M.; Khalsa, S.D.S.; Tatge, S.; Wood, L.; Sears, M.; Brown, P.H. A farms systems approach to the adoption of sustainable nitrogen management practices in California. Agric. Hum. Values 2021, 38, 783–801. [Google Scholar] [CrossRef]
  11. Reimer, A.P.; Denny, R.C.H.; Stuart, D. The impact of federal and state conservation programs on farmer nitrogen management. Environ. Manag. 2018, 62, 694–708. [Google Scholar] [CrossRef]
  12. Prokopy, L.S.; Floress, K.; Arbuckle, J.; Church, S.; Eanes, F.; Gao, Y.; Gramig, B.; Ranjan, P.; Singh, A. Adoption of agricultural conservation practices in the United States: Evidence from 35 years of quantitative literature. J. Soil Water Conserv. 2019, 74, 520. [Google Scholar] [CrossRef]
  13. Ranjan, P.; Church, S.P.; Floress, K.; Prokopy, L.S. Synthesizing conservation motivations and barriers: What have qe learned from qualitative studies of farmers’ behaviors in the United States? Soc. Nat. Resour. 2019, 32, 1171–1199. [Google Scholar] [CrossRef]
  14. Yoder, L.; Ward, A.S.; Dalrymple, K.; Spak, S.; Lave, R. An analysis of conservation practice adoption studies in agricultural human-natural systems. J. Environ. Manag. 2019, 236, 490–498. [Google Scholar] [CrossRef] [PubMed]
  15. Niles, M.T.; Brown, M.; Dynes, R. Farmer’s intended and actual adoption of climate change mitigation and adaptation strategies. Clim. Chang. 2016, 135, 277–295. [Google Scholar] [CrossRef]
  16. Haden, V.R.; Niles, M.T.; Lubell, M.; Perlman, J.; Jackson, L.E. Global and local concerns: What attitudes and beliefs motivate farmers to mitigate and adapt to climate change? PLoS ONE 2012, 7, e52882. [Google Scholar] [CrossRef]
  17. Arbuckle, J.G.; Prokopy, L.S.; Haigh, T.; Hobbs, J.; Knoot, T.G.; Knutson, C.L.; Loy, A.; Mase, A.S.; McGuire, J.; Morton, L.W.; et al. Climate change beliefs, concerns, and attitudes toward adaptation and mitigation among farmers in the Midwestern United States. Clim. Chang. 2013, 117, 943–950. [Google Scholar] [CrossRef]
  18. Rogers, E.M. Diffusion of Innovations, 5th ed.; Simon and Schuster: New York, NY, USA, 2003. [Google Scholar]
  19. Wood, L.; Lubell, M.; Rudnick, J.; Khalsa, S.D.S.; Sears, M.; Brown, P.H. Mandatory information-based policy tools facilitate California farmers’ learning about nitrogen management. Land Use Policy 2022, 114, 105923. [Google Scholar] [CrossRef]
  20. Beetstra, M.A.; Wilson, R.S.; Doidge, M. Conservation behavior over time: Examining a Midwestern farmer sample. Land Use Policy 2022, 115, 106002. [Google Scholar] [CrossRef]
  21. Doran, E.M.; Doidge, M.; Aytur, S.; Wilson, R.S. Understanding farmers’ conservation behavior over time: A longitudinal application of the transtheoretical model of behavior change. J. Environ. Manag. 2022, 323, 116136. [Google Scholar] [CrossRef]
  22. Prokopy, L.S.; Floress, K.; Klotthor-Weinkauf, D.; Baumgart-Getz, A. Determinants of agricultural best management practice adoption: Evidence from the literature. J. Soil Water Conserv. 2008, 63, 300–311. [Google Scholar] [CrossRef]
  23. Baumgart-Getz, A.; Prokopy, L.S.; Floress, K. Why farmers adopt best management practice in the United States: A meta-analysis of the adoption literature. J. Environ. Manag. 2012, 96, 17–25. [Google Scholar] [CrossRef]
  24. Niles, M.T.; Lubell, M.; Brown, M. How limiting factors drive agricultural adaptation to climate change. Agric. Ecosyst. Environ. 2015, 200, 178–185. [Google Scholar] [CrossRef]
  25. Liu, T.; Bruins, R.J.F.; Heberling, M.T. Factors Influencing Farmers’ Adoption of Best Management Practices: A Review and Synthesis. Sustainability 2018, 10, 432. [Google Scholar] [CrossRef]
  26. Lubell, M.; Hillis, V.; Hoffman, M. Innovation, cooperation, and the perceived benefits and costs of sustainable agriculture practices. Ecol. Soc. 2011, 16, 23–35. [Google Scholar] [CrossRef]
  27. Brodt, S.; Zalom, F.; Krebill-Prather, R.; Bentley, W.; Pickel, C.; Connell, J.; Wilhoit, L.; Gibbs, M. Almond growers rely on pest control advisers for integrated pest management. Calif. Agric. 2005, 59, 242–248. [Google Scholar] [CrossRef]
  28. Arbuckle, J.G.; Morton, L.W.; Hobbs, J. Understanding Farmer Perspectives on Climate Change Adaptation and Mitigation: The Roles of Trust in Sources of Climate Information, Climate Change Beliefs, and Perceived Risk. Environ. Behav. 2015, 47, 205–234. [Google Scholar] [CrossRef] [PubMed]
  29. Prokopy, L.S.; Carlton, J.S.; Arbuckle, J.G.; Haigh, T.; Lemos, M.C.; Mase, A.S.; Babin, N.; Dunn, M.; Andresen, J.; Power, R.; et al. Extension′s role in disseminating information about climate change to agricultural stakeholders in the United States. Clim. Chang. 2015, 130, 261–272. [Google Scholar] [CrossRef]
  30. Singh, A.S.; Eanes, F.; Prokopy, L.S. Climate change uncertainty among American farmers: An examination of multi-dimensional uncertainty and attitudes towards agricultural adaptation to climate change. Clim. Chang. 2020, 162, 1047–1064. [Google Scholar] [CrossRef]
  31. Pannell, D.; Zilberman, D. Understanding Adoption of Innovations and Behavior Change to Improve Agricultural Policy. Appl. Econ. Perspect. Policy 2020, 42, 3–7. [Google Scholar] [CrossRef]
Figure 1. Farm characteristics for High, Moderate, and Low adopter groups by the parcel size, ownership, irrigation system, and water source(s).
Sustainability 15 08083 g001
Figure 2. Information sources identified by color for Low (n = 282), Moderate (n = 410), and High (n = 195) adopters ranked from their highest used to least used source. Respondents were able to select more than one information source.
Sustainability 15 08083 g002
Figure 3. Benefits considered by color for Low (n = 212), Moderate (n = 363), and High (n = 182) adopters ranked from those they consider the most to those they consider the least when determining whether or not to adopt climate-smart practices. Respondents were able to select more than one benefit.
Sustainability 15 08083 g003
Figure 4. Challenges reported by color for Low (n = 146), Moderate (n = 298), and High (n = 159) adopters of climate-smart practices, ranked from most considered to least considered. Respondents were able to select more than one challenge.
Sustainability 15 08083 g004
Table 1. Farmers were grouped into the High, Moderate, and Low adopter groups. Each row can have ✓, (✓), or a combination of both symbols. The ✓ represents a practice that was adopted, and (✓) represents one of the practices that may have been adopted to reach the total number of practices needed per row. The total practices number is indicated on the far left of each row. Mitigation practices included the use of a nitrogen (N) budget and split fertilizer application, and adaptation practices included the use of organic matter amendments (OMA) and cover cropping.
MitigationAdaptation
FarmersN BudgetSplit AppOMACover CropPractices
Low94 0
Low133(✓)(✓)(✓)(✓)1
Low18 (✓)(✓)2
Low71 (✓)(✓)2
Moderate137 2
Moderate16 2
Moderate234(✓)(✓)3
Moderate45(✓)(✓)3
High2044
Table 2. Kruskal–Wallis t tests with significant differences (p < 0.05) between climate-smart adopter groups are shown in italics. Farm characteristics include parcel size, ownership, irrigation system, and water source(s). Information sources include the agricultural commissioner, University of California, certified crop advisor (CCA), pest control advisor (PCA), water quality coalition, resource conservation district (RCD), industry association, and peers. Practice challenges are the cost of the practice, labor requirement, lack of supplies, need for technical knowlesge, lack of practice efficacy, and uncertainty. Practice benefits are the nitrogen use efficiency (NUE), water savings, soil health, drought, precipitation and temperature adaptation, regulatory relief, yield, and quality. Significance represents a differeence between one or more of the High, Moderate, or Low adopter groups.
Farm Characteristics
Parcel SizeOwnershipIrrigation SystemWater Sources
<0.0010.9460.0180.004
Information Sources
CommissionerU of CaliforniaCCAPCAWater QualityRCDIndustryPeers
<0.001<0.0010.0030.1360.0270.003<0.001<0.001
Challenges
CostLaborSuppliesKnowledgeEfficacyUncertainty
0.1620.1100.1090.0010.005<0.001
Benefits
NUEWaterSoil HealthDroughtPrecipitationTemperatureRegulatoryYieldQuality
<0.001<0.0010.003<0.001<0.0010.0040.0110.0430.0001
Disclaimer/Publisher’s Note: The statements, opinions and data contained in all publications are solely those of the individual author(s) and contributor(s) and not of MDPI and/or the editor(s). MDPI and/or the editor(s) disclaim responsibility for any injury to people or property resulting from any ideas, methods, instructions or products referred to in the content.

