Article

Spatial Analysis of Tertiary Industry Evolution Based on Gravity Model: A Case of Central Plains Economic Region in China

School of Information Engineering, Henan Institute of Science and Technology, Xinxiang 453003, China
*
Author to whom correspondence should be addressed.
Sustainability 2023, 15(10), 7989; https://doi.org/10.3390/su15107989
Submission received: 11 April 2023 / Revised: 11 May 2023 / Accepted: 12 May 2023 / Published: 13 May 2023

Abstract

:
The service and knowledge economy has emerged as the primary drivers of national economic growth, with the tertiary industry leading the way. To promote growth in the central plain region and achieve structural convergence of industries for sustainable, rapid, and healthy economic development, conducting a spatial structural analysis of the evolution of the industrial structure is essential. However, traditional statistical analysis needs to keep pace with the dynamic and non-linear relationships within and outside industries. In this paper, we propose a novel spatial analysis method based on the gravity model to examine the tertiary industry in China’s central plains economic region (CPER). By analyzing statistical data from 2018 to 2022, our results reveal that the economic linkage intensity (F-value) of the tertiary industry in CPER has increased over the years. Specifically, F-values for the high-end, general, and other service industries are 2815, 9882, and 14,826, respectively. The network density (D-value) indicates a single-core structure, with D-values of 0.71, 0.74, and 0.82 for high-end, general, and other service industries. Our findings suggest that the economic linkage network of the tertiary industry in CPER has matured, with solid industry integration and convergence of the regional financial industry structure. There is a high correlation (p < 0.01) among various network structures in the service industry, and a stable and cohesive subgroup with multicentre characteristics is beginning to emerge. These findings provide valuable insights for the development of the tertiary industry in CPER during the later stage of the 14th Five-Year Plan in China.

1. Introduction

The central plains economic region (CPER) encompasses various sectors, including modern service industries, logistics, information technology, etc. It is officially defined as an economic area centered around the Zhengzhou metropolitan area, covering the entire Henan province and its surrounding areas [1]. CPER serves as a national demonstration zone for coordinated development. The tertiary industry, or service industry, represents a vital component of the national economy, characterized by high levels of innovation, accumulation, and knowledge. Spatial analysis of the tertiary sector entails monitoring regional development through the distribution and interplay of factors such as population and industry at the municipal scale.
We aim to optimize resource allocation on a larger scale by analyzing the spatial structure evolution of the CPER, amplifying the radiative driving effect, and supporting the growth of each city within the economic zone. This approach significantly increases industry competitiveness and improves factor agglomeration and carrying capacity. To investigate whether the gravity model and correlation analysis method can effectively analyze the evolution of industrial spatial structure. The following hypotheses have been proposed:
Hypothesis 1.
The gravity model method proposed in this paper can effectively analyze industrial structures’ spatial evolution by measuring regional node correlation strength. This hypothesis is based on the flexibility of the model in terms of accessibility, population, GDP, and overall strength, and its ability to provide optimal solutions. Furthermore, the model can capture the interaction between multiple variables, leading to a more comprehensive understanding of the dynamics of industrial spatial patterns.
Hypothesis 2.
Once the model is established, UciNet can be used to conduct a spatial pattern distribution analysis of the industrial division of labor in terms of cohesive subgroups, network density, and kernel density of each service industry. This hypothesis is based on the notion that combining the gravity model with these techniques can provide a completer and more nuanced picture of the spatial distribution of industrial activities and their evolution over time.
This paper explores the evolution of the industry within the region, taking into account both temporal and spatial aspects. The exploration facilitates the development of relevant policies to promote coordinated regional growth. Furthermore, valuable insights for industrial development during the final stages of the 14th Five-Year Plan are provided by the research. With a specific focus on the tertiary industry, an innovative spatial analysis approach based on the gravity model is introduced. A case study of the tertiary industry in CPER is conducted as part of this approach. Statistical data from 30 prefecture-level cities are evaluated using cohesive subgroups, core-periphery analysis, network density, and kernel density techniques. The contributions of this work are as follows:
(1)
A pioneering evolution analysis of spatial structure is developed, rooted in the economic gravity model. This method is based on a thorough evaluation of the evolution of industrial divisions in both time and space within the region.
(2)
Condensed subgroup analysis, core-edge analysis, network density evaluation, and kernel density estimation techniques are employed to estimate the economic connection intensity (F-value) and network density (D-value) of the tertiary industry in CPER. The analysis explores the evolution of internal groups, intercity connections, industrial correlations, and the significance of the core belt in the region.
(3)
To enable a multi-dimensional analysis that accurately reflects the non-linear, non-smooth, and dynamic relationships present within the tertiary industry in CPER, a subgroup map and a heat map of core-edge distribution are created. These visual representations enhance the understanding of the complex relationships within the industry.
The remainder of the paper is organized as follows. Section 2 describes the related work. Section 3 presents the data sources and analysis methods. A multifaceted analysis is carried out in Section 4. In addition, Section 5 summarizes this paper.

2. Literature Review

2.1. Progress in Spatial Structure Evolution

Regional spatial structure is a critical development aspect, and scholars have contributed significantly to this field. For instance, PERROUX [2] proposed the theory of regional growth poles from an economic perspective, which has been influential. Zhu [3] introduced a core-edge model based on urban system formation and development simulation to explain the evolution of regional economic and spatial structures. Liu [4] used artificial intelligence to explore the possibility of alleviating the locking effect of the spatial structure at the core while maximizing the effect of the industry-space scale and cooperation capability in studying river valley cities in northwest China. Shi [5] constructed a system of indicators of coupled urbanization coordination to analyze the characteristics of the core of localization and regional coupling and coordination, providing a comprehensive understanding of the dynamics of regional spatial structures. Chen [6] examined the spatial network structure and regional interaction from the perspective of cohesive subgroups, concluding that different cohesive subgroups had strengthened interactions with some degree of self-stability. Meanwhile, Cheng [7] constructed a collaborative development network in China and analyzed the temporal evolution characteristics of the coordinated development pattern from different perspectives.
Zhang [8] studied urban clusters and network density in the spatial structure evolution of the Yangtze River Delta Urban Network using social network analysis, providing insight into the network dynamics of regional spatial structures. Marc [9] analysed the growth and expansion of population density and road networks from the perspectives of network and population density, concluding that the density distribution declined exponentially from the core region. Finally, Dong [10] used kernel density estimation to analyze the evolutionary characteristics of the new district of Kambasha, identifying its major spatial expansion and clustering characteristics towards the water body. Furthermore, Zhao [11] used kernel density and GEO detector models to study the spatial distribution and dynamic evolution of urbanization of the population in the upper reaches of the Yellow River, providing information on the population dynamics of regional spatial structures.
Transformation of industrial structures is a critical driver of economic development, and the evolution of spatial patterns is a crucial aspect of this process [12]. Desmet [13] proposed the theory of spatial development and investigated the evolutionary process of the tertiary industry from spatial dispersion to aggregation, providing information on the dynamics of industrial spatial patterns. Cao [14] analyzed the spatial structure and pattern of the economy in Gansu Province using ArcView software, revealing a unipolar core economic structure centered in Lanzhou and providing information on regional economic dynamics. Li [15] used kernel density analysis to model the evolution of the tertiary industry spatial system and proposed suggestions for its change, providing a practical framework for industrial spatial planning. Zhong et al. [16] suggested that the development of the tertiary sector is related to domestic demand and people’s welfare and examined the impact of population density on the service industry, providing insights into the social and economic dynamics of industrial spatial patterns.
Yu [17] explored the spatial distribution pattern of the tertiary sector in the Yangtze River Delta region through an exploratory spatial data analysis method, providing a comprehensive understanding of the regional industrial spatial patterns. Guan [18] used a spatial SDM model to study spatial economic growth and the effects of border spillover of service industries in the Beijing-Tianjin-Hebei area, offering a quantitative framework for analyzing the spatial dynamics of industrial patterns. Liu [19] examined the transfer of productive service industries and spatial structural changes in the Beijing-Tianjin-Hebei area from 2000 to 2014, providing a longitudinal perspective on the dynamics of industrial spatial patterns. Chen et al. [20,21,22] analyzed the tertiary industry’s competitive advantages and disadvantages, spatial structure status, and resource allocation status through a deviation-share spatial structure model. They proposed a spatial layout scheme, providing insights into optimizing industrial spatial structures. Finally, Cui [23] investigated the spatial differentiation characteristics of the productive service industry in the Yangtze River Delta region using the coefficient of divergence and the Gini coefficient, providing insights into the regional dynamics of industrial spatial patterns.
These studies offer essential insights into regional and industrial spatial structure dynamics. They provide a variety of perspectives and approaches to analyzing these structures, including economic, artificial intelligence, social network analysis, and kernel density estimation. These insights can inform policy-making and industrial planning, ultimately contributing to the sustainable development of regions and industries.

2.2. Advances in the Gravity Model

Louis [24] proposed gravity models for trip distribution considering spatial correlations, leading to improved explanatory and predictive power in transportation system planning. Kincses [25] described the spatial structure of Europe using spatial moving averages and dual-dimensional regression analysis based on gravity models, revealing a banana-shaped core area of EU countries and providing insight into the spatial dynamics of regional development. Wang [26] introduced a dual gravity model that estimates the fractal dimension of traffic networks and spatial flow patterns, facilitating the analysis of the spatial structure and dynamics of traffic networks and flows. Muhammad [27] used the gravity model to study the tertiary industry’s clustering pattern and industrial construction in the spatial dimension, providing insights into the dynamics of spatial industry patterns. Li [28] improved the method for determining the gravitational model’s comprehensive polycentric strength and distance parameters, enabling the quantitative calculation of the polycentric strength and analysis of the spatial pattern of urban polycentric structures.
Xiong [29] used the gravitational model to investigate the evolution of the spatial link pattern of the Chang-Zhu-Tan urban agglomeration, revealing the characteristics of spatial development of the area and providing a scientific basis to optimise the spatial structure of the urban agglomeration and promote regional economic and social development. Ge [30] used an improved spatial gravity model and analyzed the spatial pattern of economic linkage evolution among the three major central city metropolitan areas in the Yellow River basin. They found that the economic linkage networks of the three urban areas are increasingly complex and generally form a spatial agglomeration structure with the central city as the high-value radiation center, providing insights into the regional dynamics of economic and spatial patterns. Li [31] proposed that collaborative development in Beijing-Tianjin-Hebei requires the formation of a polycentric spatial structure of urban agglomeration based on influence variables in the gravitational model and the development experience of the Yangtze River Delta and the Guangdong-Hong Kong-Macao Greater Bay Area urban agglomerations, providing practical guidance for regional spatial planning. In general, these scholars have made valuable contributions to understanding the dynamics of gravity models and their applications in various fields, providing a foundation for further research in this area.

2.3. Challenges and Opportunities

From an economic perspective, the scholars mentioned above used growth pole theory, core-edge model, spatial development theory, deviation share spatial structure model, and other single aspects to explore the lock-in effect, stability, spatial aggregation, and other elements. However, these studies needed more comprehensive methods and analyzed intercity correlation, internal industry development, internal group changes, and other factors. To address these limitations, a new method of analysis of spatial structure evolution, the gravity model, is proposed in this research.
The gravity model is a flexible and valuable tool for quantitative analyses of urban economic associations. It can be tailored to various research directions, such as accessibility, population, gross domestic product (GDP), and overall strength, and can provide optimal solutions. However, using a single gravity model to calculate the strength of economic ties to study the spatial-temporal evolution of a network may lead to partial defect. It is necessary to consider the interaction between multiple variables. Additionally, existing analyses of the evolution of spatial structure often rely solely on core-edge models, spatial diffusion theory, and kernel density analysis, which may overlook important factors such as the development status of industries within the region, changes in industrial cohesion groups, and the study of the industrial division of labor.
This paper proposes a novel spatial analysis method that combines the gravity model with cohesive subgroups, core-edge, network density, and kernel density techniques to examine regional spatial economic linkages, aggregation and dispersion patterns, network integration, and industrial structure convergence. This approach provides a more comprehensive understanding of the dynamics of industrial spatial patterns and can lead to more informed spatial planning and policy-making. However, more research is needed to refine this approach and explore its potential in different contexts.

3. Methodology

3.1. Data Source

The CPER, as defined in the central plain city cluster development plan, comprises 30 cities in total, including 18 prefecture-level cities in Henan Province, three in Shanxi Province, two in Hebei Province, two in Shandong Province and five cities in Anhui Province, as shown in Table 1.
This study focusses on the transportation network system of the 30 cities at the prefecture level within the CPER, a strategically significant region endowed with abundant natural resources, such as coal, iron, oil, natural gas, gold and other minerals. It also has a surplus of hydro energy resources, with numerous rivers and lakes. Moreover, the CPER boasts an extensive transportation network that includes several railways, roads, highways, and air routes catering to the demands of economic development. The study analyzed high-speed railways, expressways, national roads and provincial roads with speeds of 200 km/h, 100 km/h, 80 km/h and 60 km/h, respectively, operating in accordance with Chinese national standards. In this paper, the time distance matrix is established by using the cost of starting point to destination (od). The connection parameters respectively take into account the transportation length, speed, transportation cost, connectivity, intersection turning and other factors. The time distance of each city is calculated according to the above factors, and the shortest distance between any two nodes is analyzed. Data on tertiary industry employment and GDP were primarily sourced from the National Bureau of Statistics and the corresponding provincial and municipal bureaus to investigate the region’s economic activities.
We adopt the latest national economic classification of industries (GB/T 4754-2017) [32] to improve precision, issued by the National Bureau of Statistics in 2018. The classification divides the tertiary sector into three categories, namely, advanced services, general services, and other services. To facilitate the analysis, the 14 sectors are grouped into three primary industry divisions based on their respective positions in the industrial value chain, as presented in Table 2.

3.2. Model and Tools

3.2.1. Gravitational Model

This paper utilizes the gravity model to investigate regional economic associations among cities in the CPER, which captures the diffraction ability of the financial core region to the surrounding towns and the receptivity of the surrounding areas to the core region’s radiation ability. The employed persons, gross domestic product, and comprehensive strength index of the two cities are critical indicators to quantify these associations. To address attribute and regional disparities and improve data precision, this study employs normalized standard deviation to preprocess the measured data and obtain normalized traditional deviation values, as shown in (1):
Y i = x i min x i max x i min x i
where x i represents the data index, max x i is the maximum value of x i , min x i is the minimum value of x i .
We first apply the discrete coefficient method to assign weights to the index to obtain the comprehensive strength index for each evaluation indicator in all regions, as shown in (2).
C j = j x j
where, j , x j represent the standard deviation and mean value of j , respectively.
Next, we weight the evaluation indicators using (3) and calculate the comprehensive strength index Z for each evaluation indicator across all regions using (4):
W j = C j j = 1 n C j
Z = ( Z i j ) m n
After calculating the comprehensive strength index for each city, the overall comprehensive strength index Z i can be obtained using (5) in a passive voice construction. Subsequently, the estimated comprehensive strength index of the towns can be used in the linkage intensity formula to derive the linkage intensity values F i j between the two cities, as illustrated in (6) using a passive voice construction.
Z i = j = 1 n Z i j
F i j = K P i × V i × Z i P j × V j × Z j D i j 2
D i j = 1 ( 1 / ( D h s r s d / V ) + 1 / ( D e w s d / V ) + 1 / ( D n h s d / V ) + 1 / ( D p h s d / V ) )
By calculating, the time distance matrix can be obtained as in (8):
D i j = ( D 11 D 1 j D i 1 D i j )
where, K is the gravitational coefficient, usually 1. P indicates tertiary sector employment in the region. V i and V j represent the regional tertiary GDP. Z is the overall strength index of the two cities. D i j is the shortest travel time between two cities. D h s r s d , D e w s d , D n h s d , D p h s d Respectively represent high-speed railways, expressways, national highways, provincial highways shortest path. V is the velocity, in units of k m / h .

3.2.2. Analytical Tools

(1)
The cohesive subgroup analysis
The cohesive subgroup analysis method utilizes a distance metric to cluster data points based on similarity. This algorithm constructs a clustering structure by iteratively merging the most similar data points.
Each point is considered a separate sub-cluster, such as X = x 1 , x 2 , , x n , where x i denotes the data point. The point is then viewed as an initial subgroup C i = x i . The distance matrix D i j represents the distance measured between x i and x j . Next, we merge the most similar subgroups C i and C j to form a new distance matrix D i j , k = f ( D i , k , D j , k ) , where f means the merging strategy function.
Repeat the steps mentioned above until a predetermined number of clusters is reached or all data points are incorporated into a single sub-cluster. The resulting clustering structure is illustrated as a tree diagram, where each node denotes a subcluster, and the leaf nodes correspond to individual data points. The higher nodes in the tree represent larger clusters, while the lower nodes represent increasingly similar data points.
(2)
The core edge analysis
Core-edge analysis is a clustering algorithm that aims to distinguish between core and edge data points, based on their proximity to other data points.
Given the dataset as X = x 1 , x 2 , , x n , where x i is the data point. Let the distance metric function be D i s t ( x i , x j ) , the radius is r , and the number of neighbor points is min p t s . We treat each issue as unvisited. Next, for each point p , calculate its distance to other matters and find the set N p of all neighboring points, i.e., N p = x i | D i s t ( x i , p ) < r . If N p min p t s , mark p as a core point and add all neighboring points to the same cluster.
If a point p is not identified as a core point but is still within the neighborhood of at least one core point, it is considered an edge point and will be assigned to the same cluster as the core point. The algorithm iterates through all points until all have been visited. Unmarked points are classified as noise points.
(3)
Network density analysis
The network density analysis method is a valuable tool for studying the structure of a network, enabling us to gain insights into the connections and interactions between individual nodes. This technique quantifies the density of a network by tallying the number of connections between nodes, with higher-density regions indicating more closely linked nodes. Mathematically, the formula for network density analysis can be expressed in (9):
D = i = 1 n j = 1 n d ( i , j ) N ( N 1 )
where N represents the number of city nodes in the network, and d ( i , j ) represents the number of links between all nodes.
(4)
Kernel density analysis
Kernel density analysis is vital to identify agglomeration areas in polycentric urban structures. It enables continuous simulation of the distribution density of spatial point or line elements and effectively reveals agglomeration areas of various components. The method utilizes a moving cell to estimate the density of the distribution of points or lines, creating a detailed simulation of their distribution. This visualization technique helps identify the spatial clustering of network nodes and provides a clear picture of the distribution of hotspots.
Let the sample points be x 1 , x 2 , , x n . Then the kernel density is calculated, as shown in (10):
D e n s i t y = 1 ( r ) 2 i = 1 n [ 3 π P o p i ( 1 ( D i s t i r ) 2 ) 2 ] ,           D i s t i < r
where i = 1 n is the input. If the points are located within a radius of the position ( x , y ) , only the topics that fall within the radius will be included in the sum. P o p i represents the field value of point i , which is optional. D i s t i means the distance between node i and location ( x , y ) . r defines the kernel density bandwidth, essentially the search radius. A smaller radius will result in higher- or low-value regions, making it suitable for local aggregation. On the other hand, using a larger radius will result in smoother kernel density contours, which is ideal for global scale aggregation.

4. Data Analysis

4.1. Basic Development Status

The CPER, which comprises regions in Henan, Shandong, Hebei, Shanxi, and Anhui provinces, exhibits distinct socioeconomic development characteristics. The advanced service industry’s GDP has grown since 2018, particularly in Zhengzhou, with the most rapid development momentum from 1691.67 to 2782.02, followed by Luoyang with 510.95 to 725.81. However, some areas of low development still exist, such as Bozhou, Jincheng, Yuncheng, and other places, as shown in Table 3.
Zhengzhou is still experiencing rapid development, followed by Luoyang, Nanyang, Kaifeng, and other cities as shown in Table 4. However, Jiyuan, Yincheng, Hebi, and other places must catch up in their development due to a shortage of resources, such as talent and industry, and are primarily dependent on the surrounding regions for growth.
Zhengzhou is still experiencing the fastest development, followed by Luoyang, Nanyang, Kaifeng, and other cities. However, Jiyuan, Huaibei, Bozhou, and other places must catch up in their development due to a need for more resources such as talent, knowledge, and economic support, as shown in Table 5.
As revealed in the table above, although the GDP of the tertiary industry has demonstrated steady growth in recent years, the level of development varies significantly among cities. In 2020, the total GDP of the tertiary sector in the CPER exceeded 3.9 trillion Yuan, accounting for more than 55% of the regional GDP. In particular, Zhengzhou and Luoyang have been the main drivers of tertiary sector GDP growth in the region. However, tertiary GDP growth in other cities, such as Hebi, Sanmenxia, has been relatively slow, with only about a 1% growth rate. Figure 1 illustrates the GDP development of the three service sectors from 2018 to 2022.
The employment-population of each city has generally shown an increasing trend. However, the employment population has generally decreased due to the sudden epidemic outbreak at the end of 2019. Despite this trend, the employment-population of Zhengzhou has continued to increase slightly from 2018 to 2022, as shown in Table 6.
According to Table 7, the employed population in different cities of the CPER has shown varying trends from 2018 to 2022. Despite the challenges posed by the epidemic in recent years, some cities have managed to maintain steady employment growth, while others have experienced declines. Specifically, the employed population in Zhengzhou and Xinxiang has continued to increase slightly during the epidemic, with Zhengzhou showing a more significant increase than Xinxiang. However, the employed population in the Bozhou and Suzhou general service industry has been declining since 2018, and the decline has become more severe during the epidemic period. It is worth noting that various factors, including economic structure, industry layout, and policy support, influence each city’s employment situation. Therefore, it is crucial to analyze and understand the reasons behind the trends observed in Table 7 to inform future employment strategies and policies.
Table 8 indicates that the employment population in different cities of the CPER has exhibited varying trends. Specifically, the employment-population in Zhengzhou and Xinxiang has increased slightly, albeit in a limited range. On the other hand, Liaocheng and Huaibei have experienced a decrease in the employee population. Meanwhile, Jiyuan, Xingtai, Hebi, and other cities have struggled with low levels of employment and population.
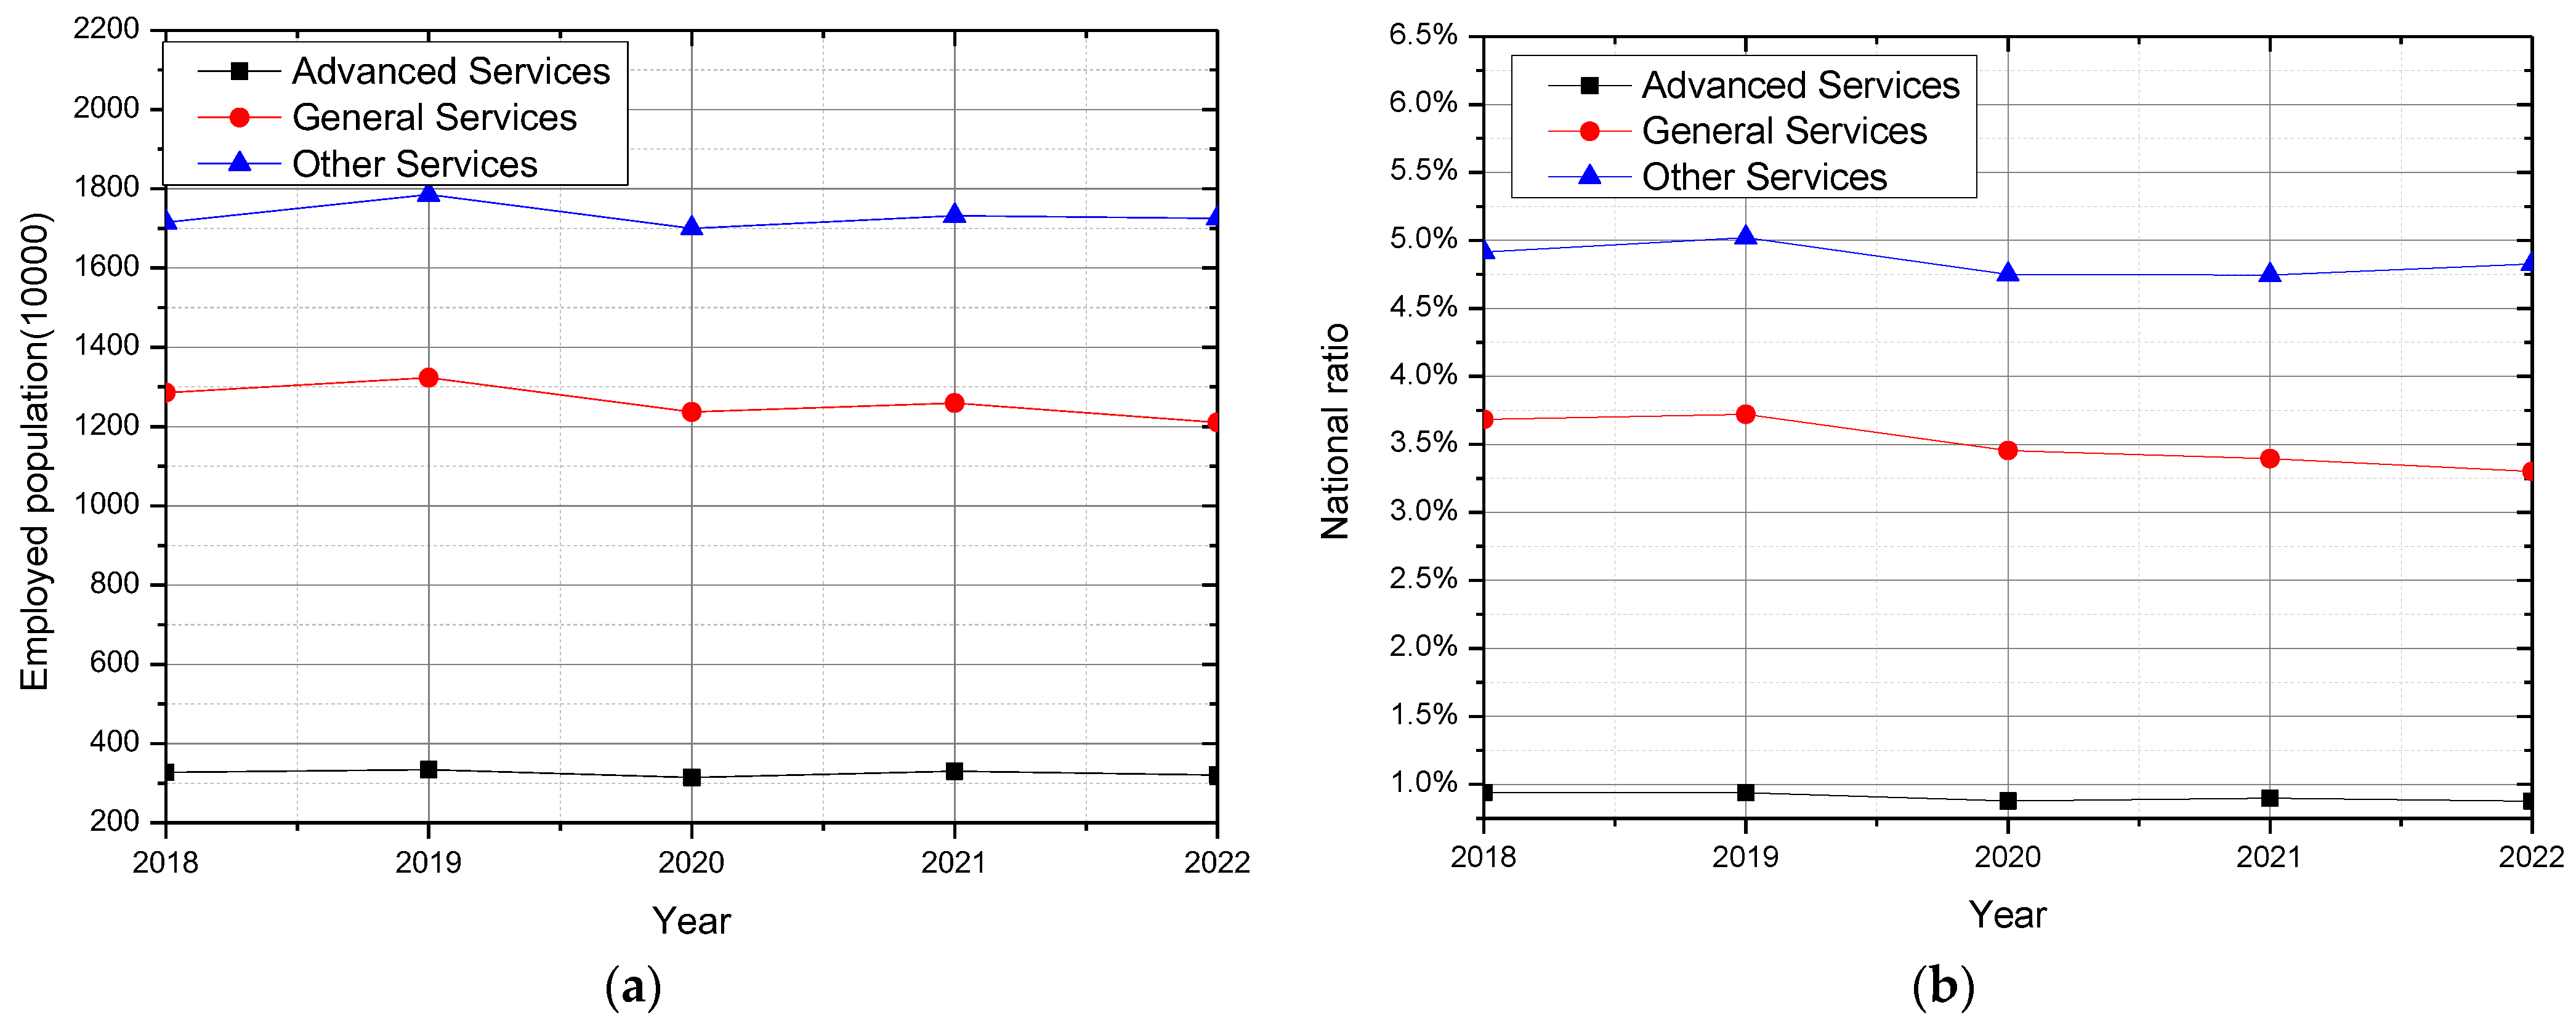
Figure 2 presents the employed population trends in China. Statistics indicate an overall downward trend, with a slight increase in 2021. The employment figures in senior, general, and other services decreased from 334, 1323, and 1785 to 321, 1210, and 1769, respectively, in early 2020. The COVID-19 pandemic severely impacted offline industries, such as retail, transportation, accommodation, food services, and education, starting in late 2019. This led to this decline. As a result, the unemployment rate increased from 5.1% in 2019 to 5.7% in 2022. Regarding the total output rate of the tertiary sector, the per capita output rates of the three major service industries increased from 21.88%, 8.38%, and 9.39% in 2018 to 37.42%, 12.5%, and 13.3% in 2022, respectively. In particular, the advanced service industry exhibited a higher per capita output growth rate than the other two.
The growth of tertiary industries in the CPER was uneven, with other services increasing faster than advanced services from 2018 to 2022. Meanwhile, general services experienced moderate growth. However, the overall efficiency of the GDP per capita output in each industry was low, indicating a lag in action and a gap compared to the national economic growth rate.

4.2. Analysis of the Strength of Regional Economic Ties

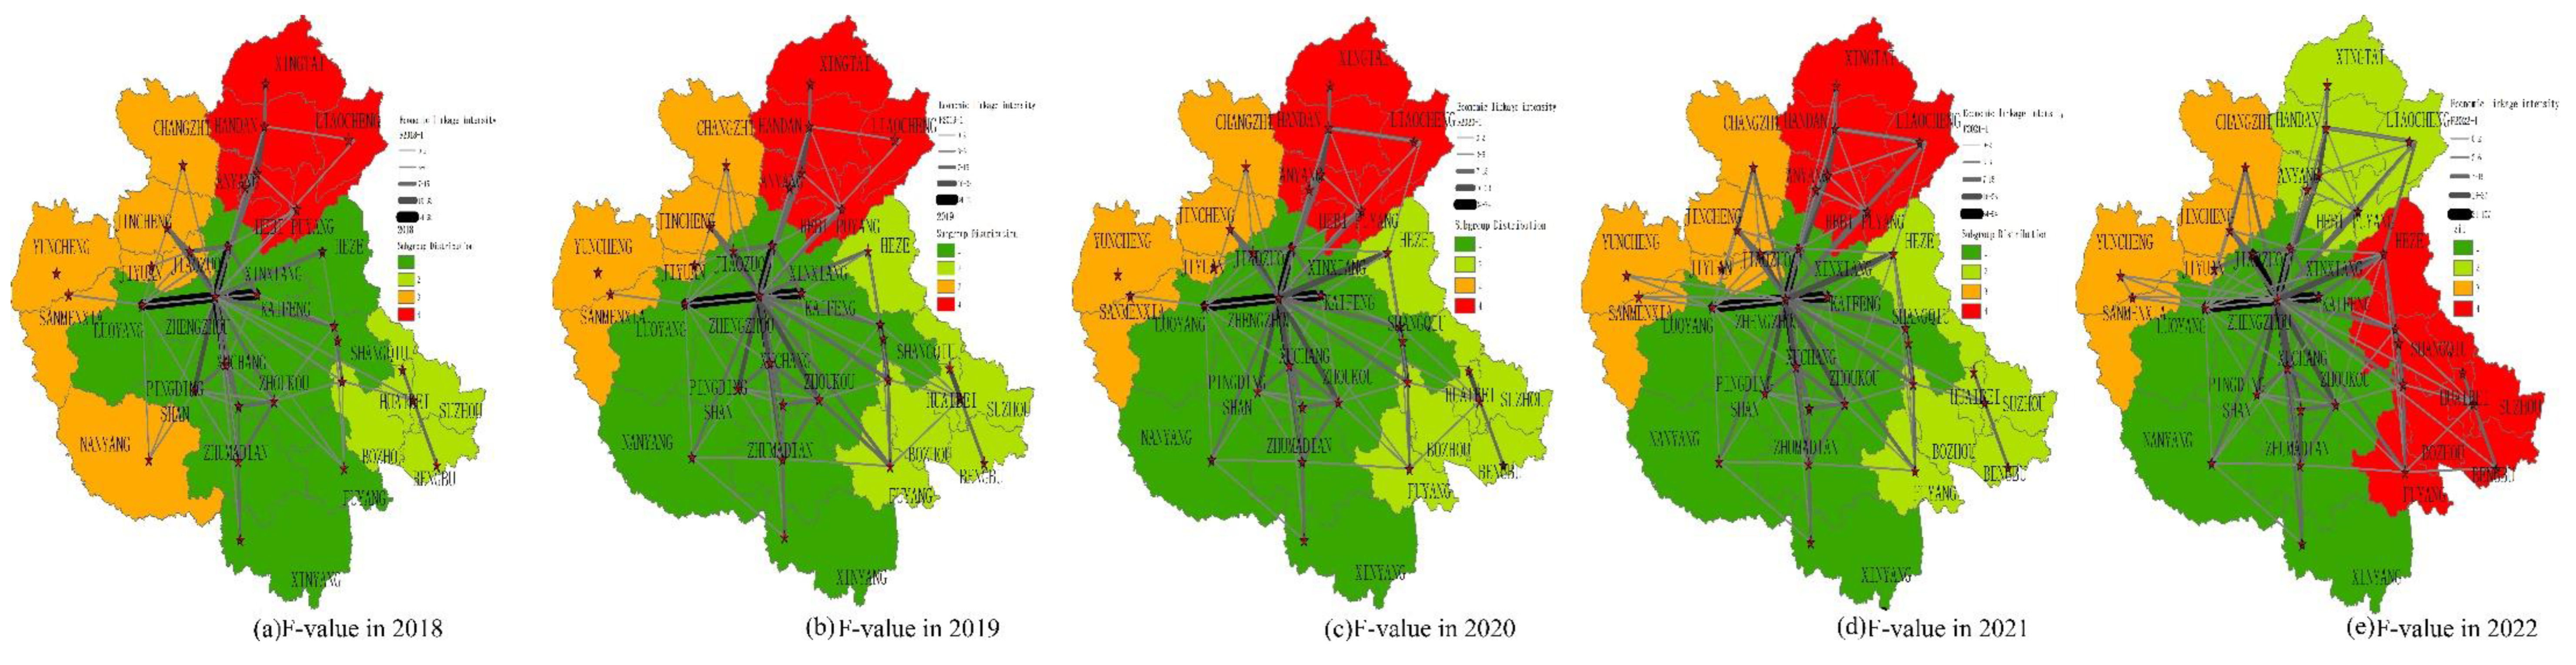
We have investigated the strength of interregional economic ties and changes in the characteristics of tertiary industry cohesive groups in CPER, as well as revealing the evolution pattern of network ties within urban agglomerations. Firstly, we utilized a modified gravity model to compute the tertiary industry economic linkage network strength matrix and obtained average threshold values of linkage strength for each sub-category (2.4, 8.9, and 12.9). The data were then transformed into a raster format using ArcGIS to generate an economic linkage network map. Second, the economic linkage data was binarized and a hierarchical clustering analysis was performed on the status of the tertiary industry clusters in the CPER using the UCINET tool. Finally, we derived a regional economic intensity subgroup map using ArcMap, where line thickness denotes the strength of economic linkage between regions, and different ribbon colors represent different subgroups. Its ribbon distribution indicates that connections between nodes in the range are stronger than connections between the range and other nodes.
We find that the development of tertiary industries in the CPER exhibits uneven growth, with the slow development of advanced services, moderate growth of general services, and rapid development of other services. Furthermore, GDP per capita output efficiency is low, indicating a lag in action and a gap compared to the overall national economic growth rate. In addition, the condensation subgroup analysis method is used to obtain the classification tree and correlation coefficient matrix with the maximum segmentation depth and the number of clustering iterations as indicators. Each branch in the tree indicates the similarity between groups, and the closer the distance between data points contained in each path, the higher the similarity.
The economic regionalization of Central Plains is divided into four subgroups represented by different color bands, determined by the length of the path which varies according to the distance between different groups. The longer the length, the lower the similarity between the corresponding two groups.
The first cohesive subgroup is shown in dark green, with Zhengzhou as the core region expanding from south to north. It has the lowest similarity among the cities with the largest overall distance, but the strongest correlation between transportation, talent, knowledge and other resources and economy, making it the most core region. The second cohesive subgroup is represented by the light green region, composed mainly of Suzhou, Huaibei and other places. The inner cities are transferred from west to east, reducing the number of inner cities. The distance between cities is getting closer, and the similarity between inner cities is high, but the internal economic connection is weak. The third cohesive subgroup is located in the orange region, represented by Yuncheng and Sanmenxia. It has the fewest inner cities, the highest similarity between cities, but the lowest economic connection. The fourth cohesive subgroup is represented by the red region, mainly Handan and Xingtai. Its internal economic relations are weaker than the first subgroup but higher than the third and fourth subgroups. The similarity of its inner cities is also higher. However, for the general service industry, more cities in Handan and other regions cause the similarity between cities to decrease, resulting in a shift in the subgroups of color bands.
Figure 3 shows the strengthening of the regional economic intensity subgroup of the advanced service industry, with an increasing trend in network density from 2018 to 2022. However, the trend could be more significant. The overall cohesive subgroup zoning evolution characteristics of the advanced service industry indicate a high degree of consistency, with only Nanyang and Jiaozuo merging into the southern subgroup with Zhengzhou as the core in 2019, and Heze and Fuyang integrating into the marginal eastern subgroup with Cebu as the core.
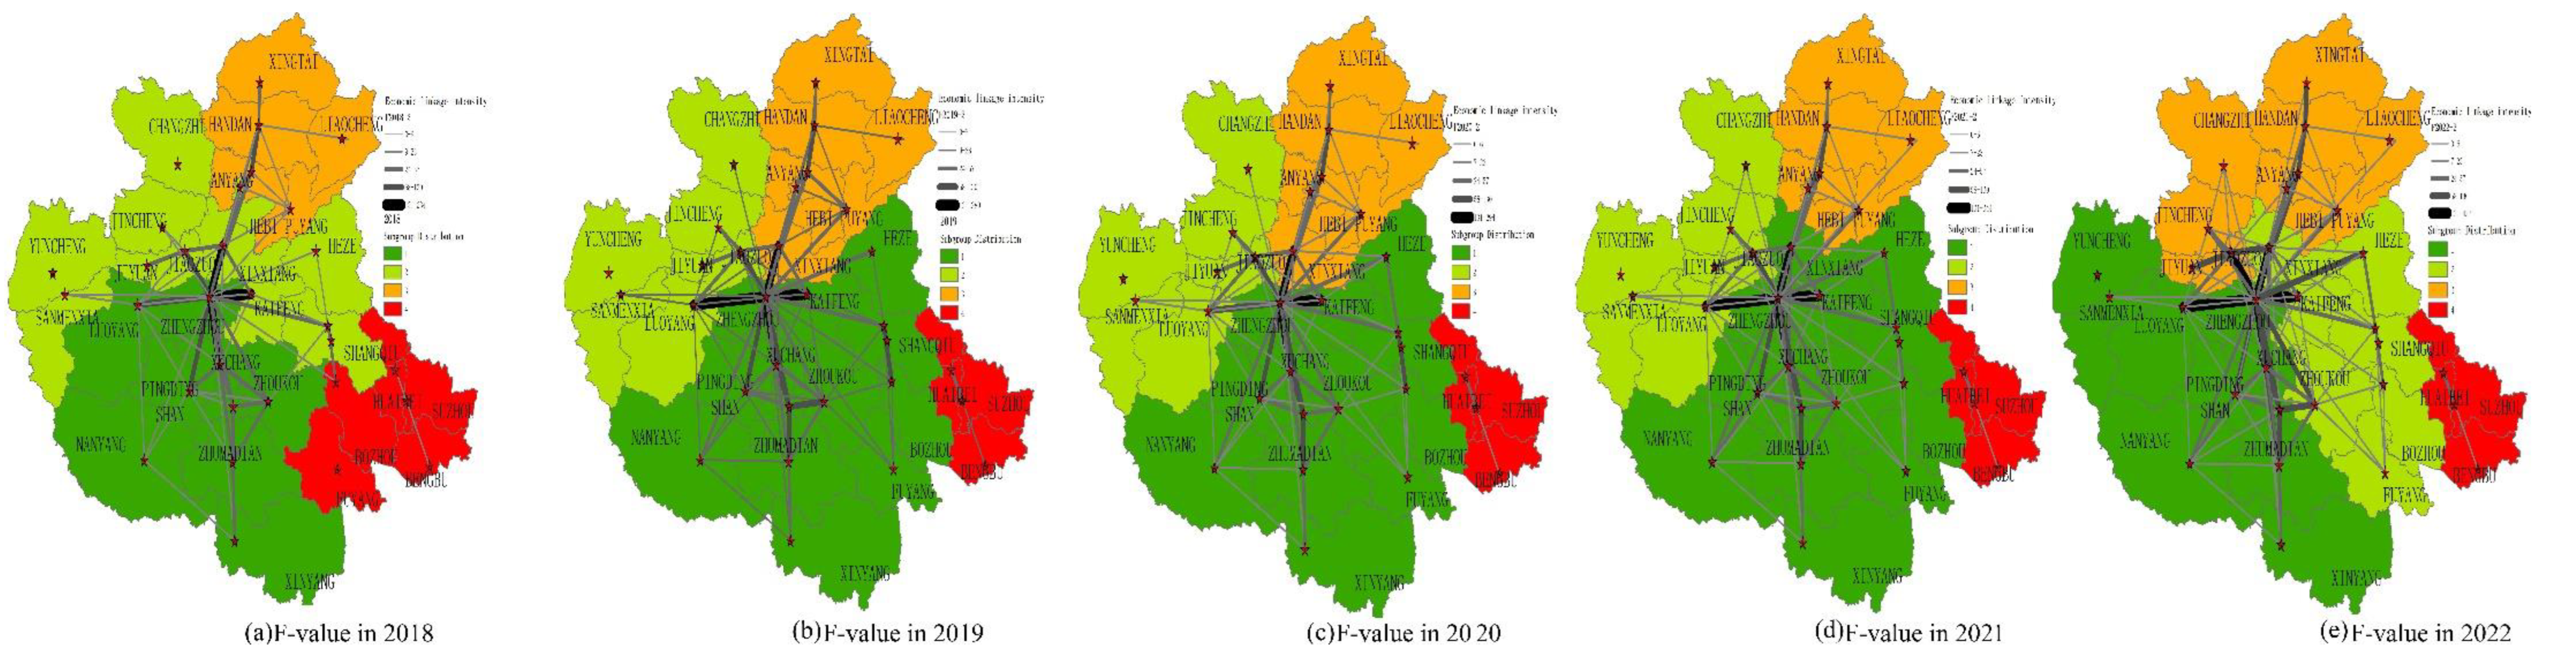
Figure 4 illustrates the growing trend in the regional economic intensity of the general service industry, with a significantly improved network structure and enhanced regional accessibility. The center of gravity of the public service industry has shifted from the north to the south, with Shangqiu, Heze, Kaifeng, and Xinxiang gradually integrating into the industrial linkage central region. Similarly, 
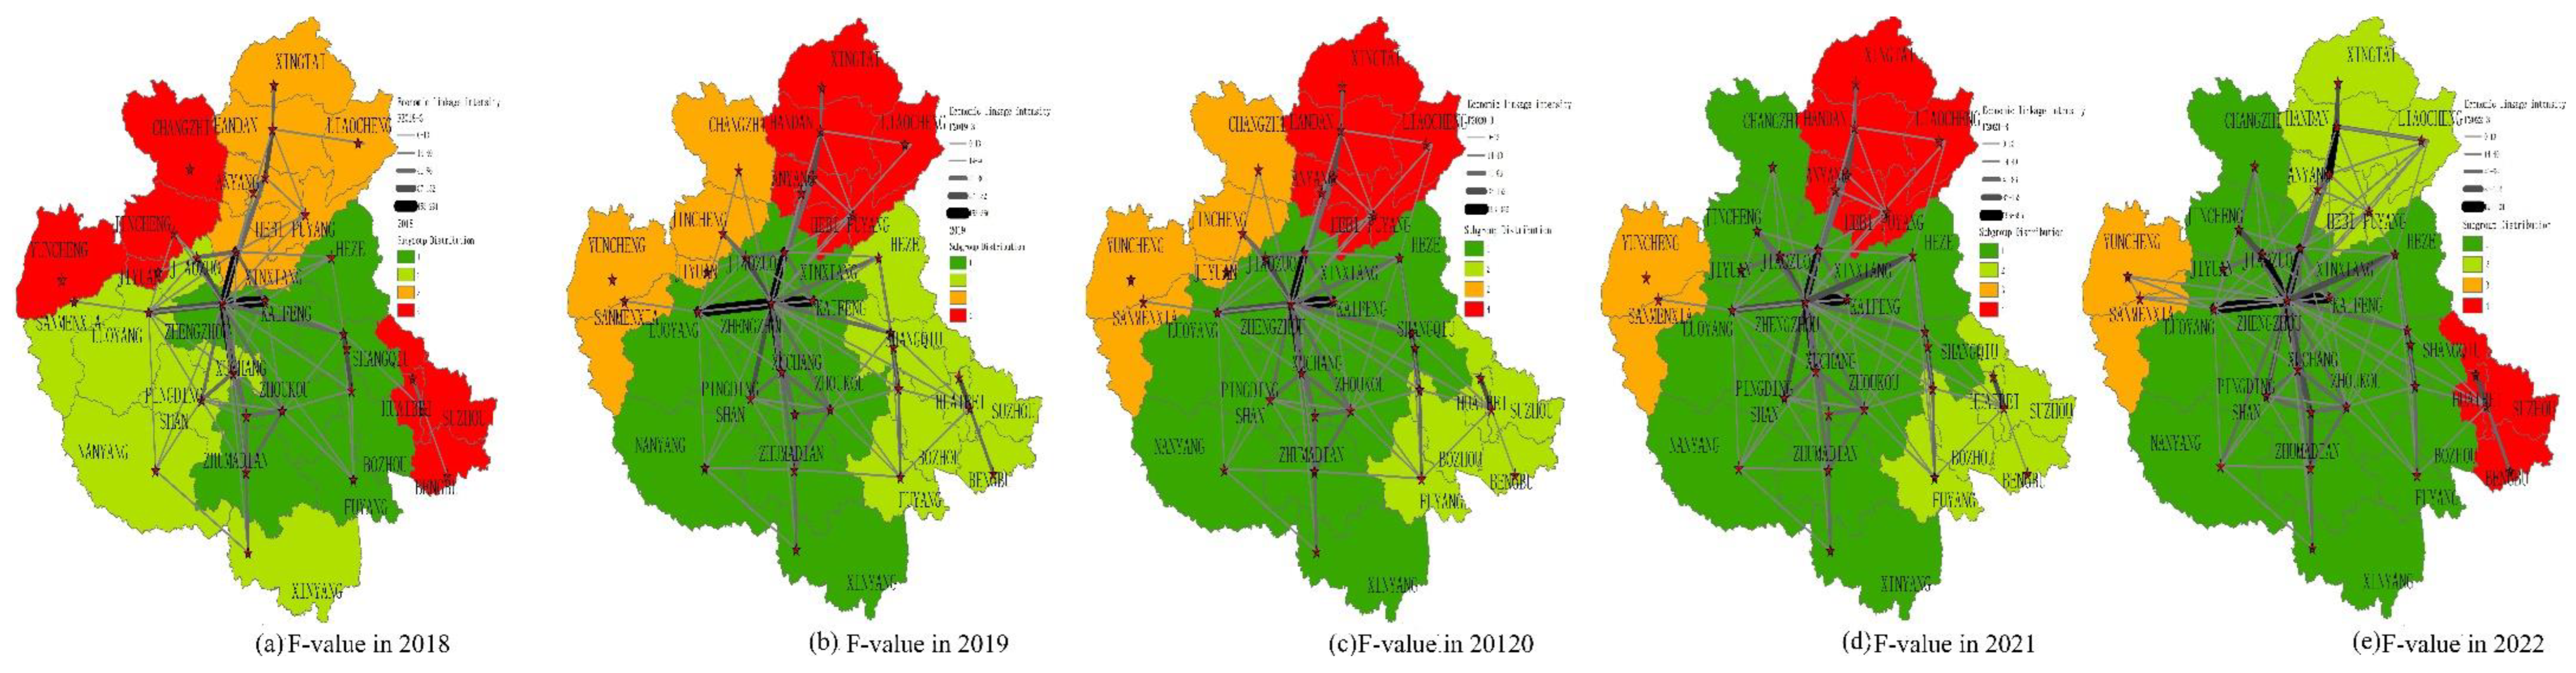
Figure 5 shows that the development of the other service industry network is consistent with the other two service industries. The cohesive subgroup demonstrates that the core area of economic linkage has shifted from the east-west to the south, with Jiaozuo, Luoyang, Shangqiu and Nanyang gradually integrating into the central region.
We calculate the tertiary sector’s overall linkage intensity and network density from 2018 to 2022 for further analyze the agglomeration and connectivity of the overall network of the tertiary industry. Table 9 summarizes the results, showing that the sum of intensity of the tertiary industry continuously expanded from 1632, 6102, and 8822 to 2815, 9882, and 14,826 over five years. The total sum of the linkage of the other service industries changed the most and developed the fastest, while the sum of the intensity of the advanced service industry changed the slowest.
To further examine the concentration and interconnectedness of the overall tertiary industry network, we conducted an analysis on the overall linkage intensity and network density from 2018 to 2022. After assessing the network’s overall density, the findings presented in Table 10 reveal an increase in the overall density of the tertiary industry network during this period. Specifically, the values have risen from 0.159, 0.145, and 0.162 to 0.205, 0.214, and 0.244, respectively. It is worth noting that the network density of the advanced service industry is significantly lower compared to the other two sectors. Furthermore, the network density of the remaining service industries displays the most substantial changes.
We normalize and calculate the overall network density to ensure accurate data analysis and facilitate network variability analysis. The results are presented in Table 11, which indicates a gradual increase in the absolute variability of the network density from 2018 to 2022. The density of the economic linkage network of the tertiary industry expanded rapidly in 2022, driven by the growth of the economic linkage network of other service industries. However, efforts are needed to catch up with the development of the economic linkage network of advanced service industries. In particular, the normalized value of the network density of the tertiary industry exhibited a trend of further expansion, indicating that the network density of the tertiary sector is likely to continue to grow.
A Pearson correlation analysis was conducted on the centrality of the tertiary industry in the CPER from 2018–2022. The results are presented in Table 12. The study reveals that the correlation between the centrality of advanced, general and other service industries initially increases and decreases. The coefficient gradually increases from 93.56% and 96.00% to 96.00% and 99.64% before reducing to 89.32% and 96.41%. The correlation between the general and other service industries shows fluctuating growth due to repeated epidemics. These findings indicate that the network connectivity of the CPER has been dramatically enhanced with rapid economic development, and the degree of correlation between industries remains strong, demonstrating a positive correlation phenomenon. The characteristics of industrial integration also remain significant.

4.3. The Evolution Analysis of Labor Division in Tertiary Industry

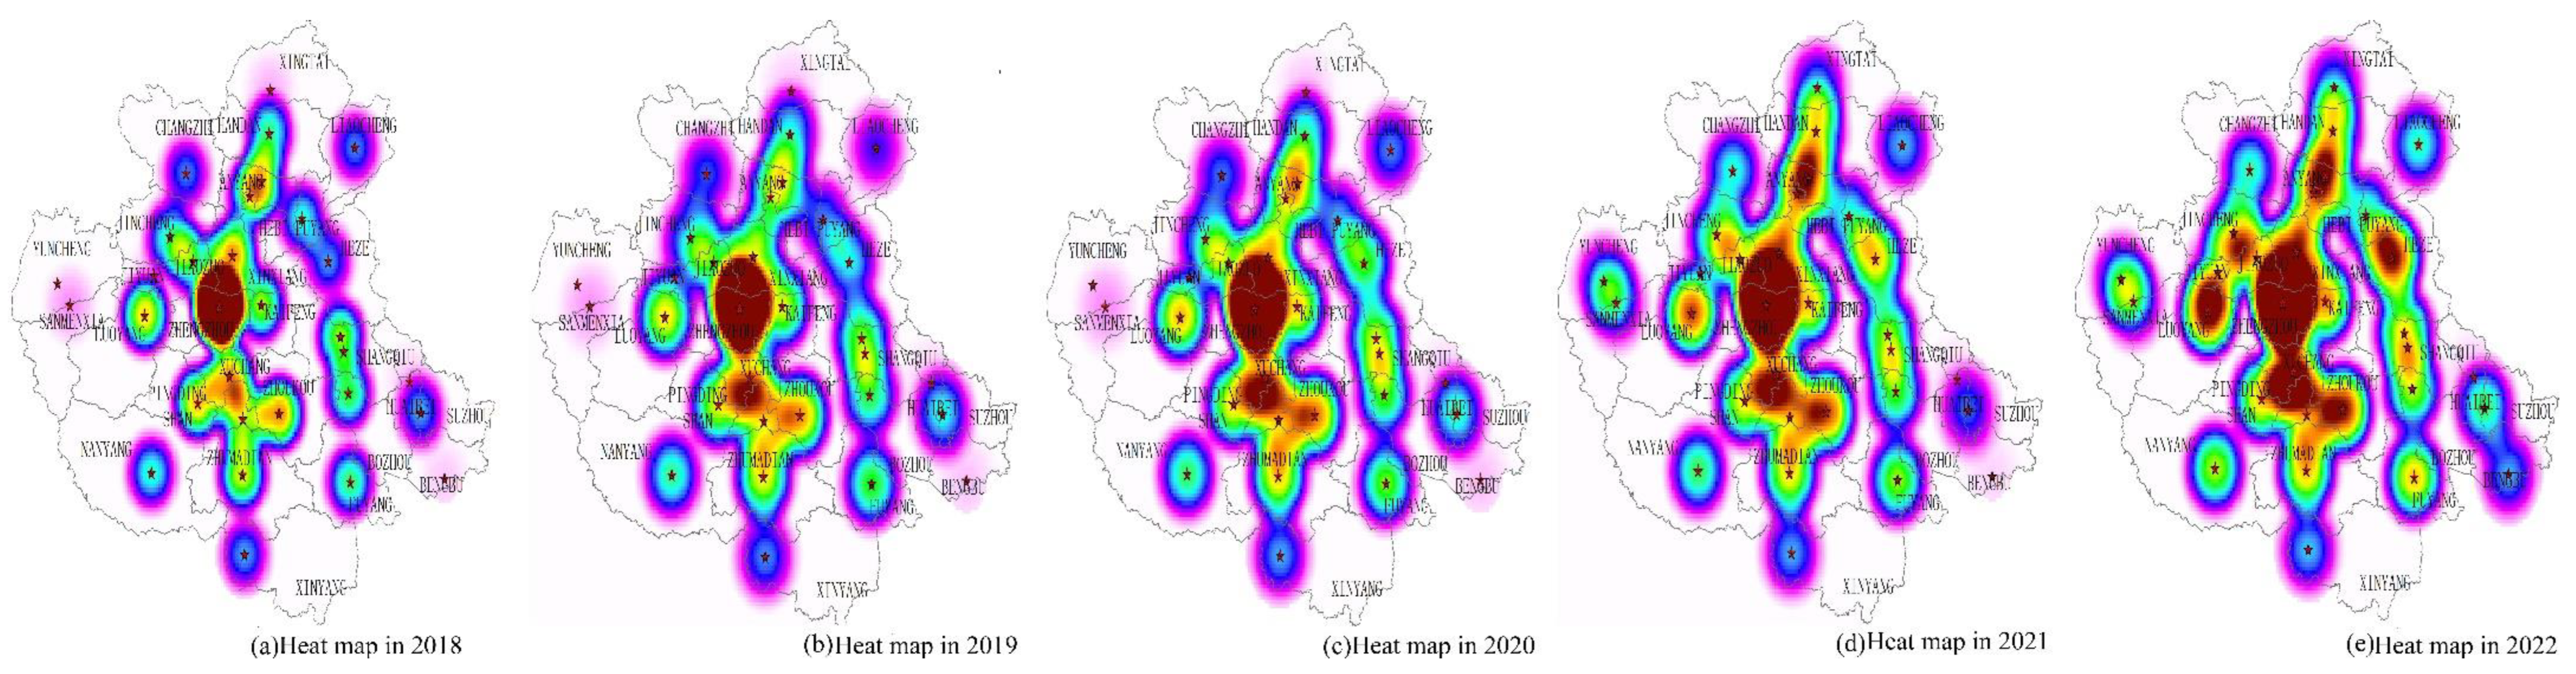
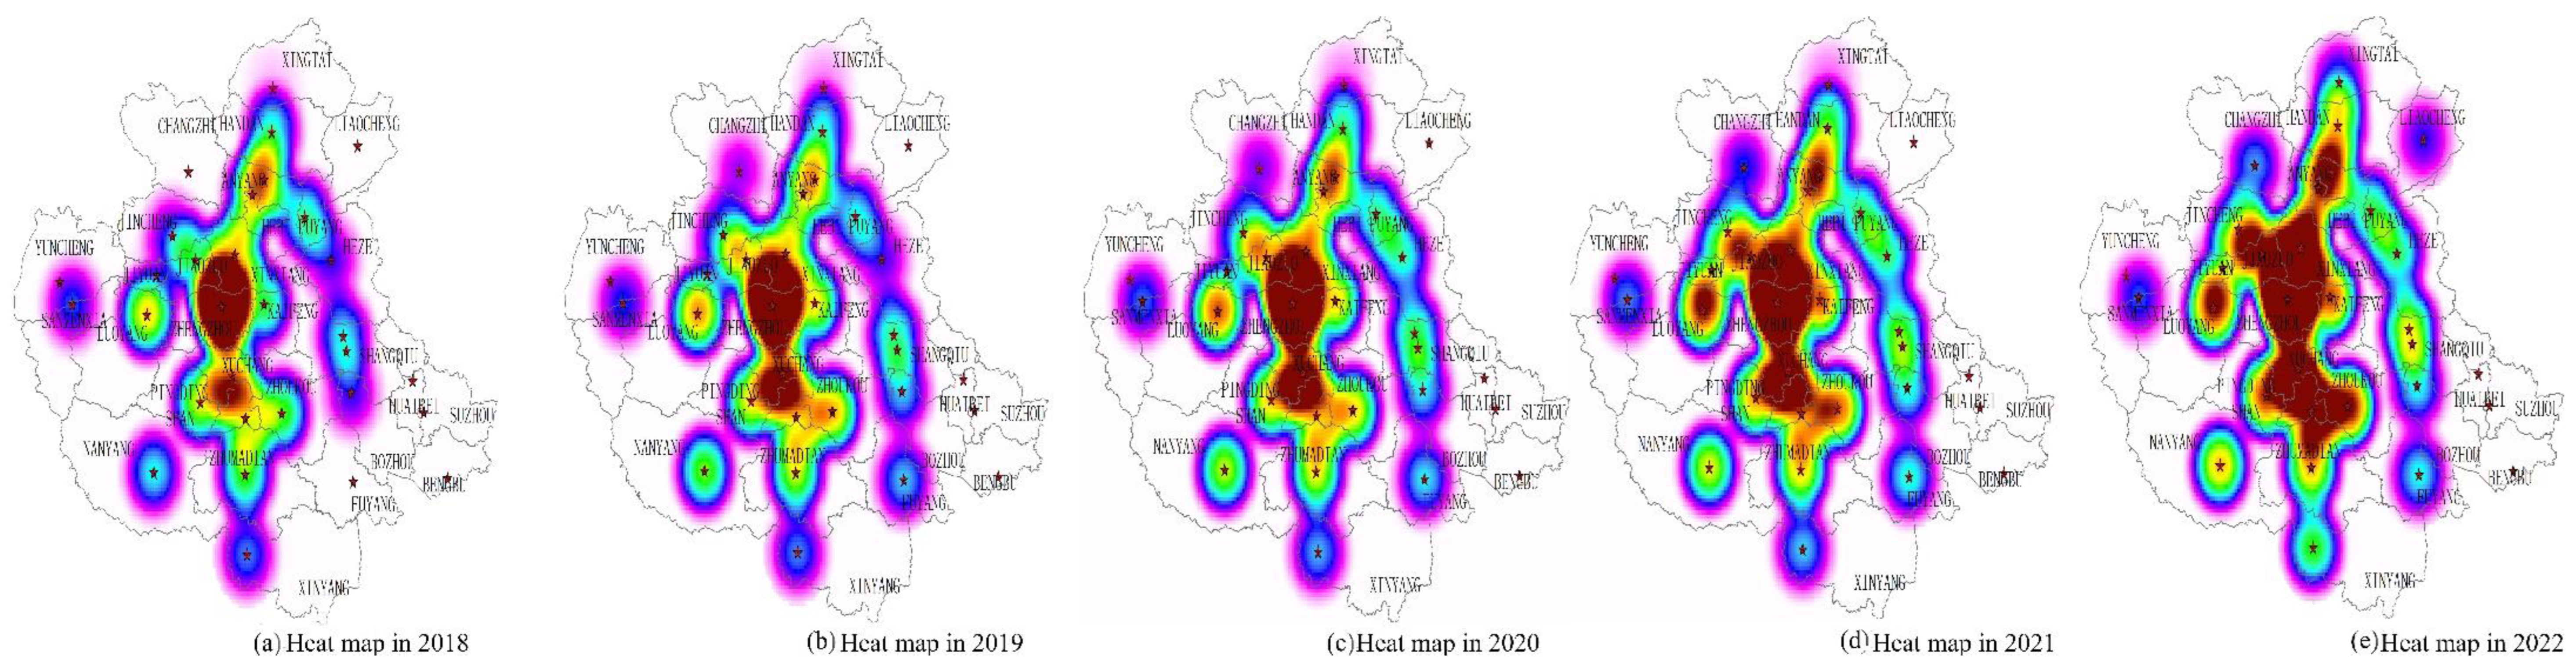
This study utilized a binarized data matrix to generate a core degree heat map for 2018–2022. Figure 6 shows that the advanced service industry has a clear diffusion feature of the proximity area. The central node is closely related to the second central node and exhibits a significant radiation effect from the central node. Figure 7 indicates that the general service industry has important cohesive centre characteristics. A clear core area and a considerable radiation effect from the core nodes exhibit a typical center-periphery structure pattern. Figure 8 shows that other service industries exhibit clear core coalescence patterns but with more pronounced polarization characteristics in the core regions and secondary core nodes. Regions with Zhengzhou, Xinxiang, Kaifeng, and Xuchang as primary core nodes tend to integration and convergence.
We calculate the core-edge density matrix table to further examine changes in the core-edge structure of each industry in the CPER, as shown in Table 13. The core density of tertiary industries in 2018–2019 and 2020–2022 significantly increased from 0.500, 0.343, 0.487 to 0.610, 0.484, 0.694, and 0.580, 0.473, 0.582 to 0.710, 0.740, 0.820. However, in 2020, due to the decrease in the exchange of resources between cities and the reduction in urban compactness caused by the epidemic, the density of the core area decreased relative to 2019. Overall, the increase in density ratio in adjacent years of the core area exhibits an increasing trend. This analysis highlights the dynamic changes in the core-edge structure of each industry and the significant impact of the COVID-19 pandemic on urban connectivity and network density in the CPER.
Table 14 displays the periphery density, except for 2020, where the epidemic weakened connectivity. The density of the advanced, general, and other service industries has generally shown an increasing trend, from 0.068, 0.030, and 0.048 to 0.110, 0.065, and 0.100, respectively. Overall, the increase in the density ratio of the periphery between adjacent years was generally positive, indicating an increasing trend in periphery agglomeration.
Table 15 shows the core edge density ratios of the advanced, general and service industries, which exhibit an increasing trend except during the epidemic. Furthermore, the density ratios of the core edges in adjacent years are positive, suggesting that the ability of the core areas to radiate and drive the peripheral areas has improved, contributing to the coordinated development of various regions. Additionally, the overall core-edge structure of the CPER has displayed a multipolar trend, and the balanced spatial structure’s characteristics have improved.

5. Discussion and Conclusions

5.1. Discussion

Based on the above assumptions, it has been proved that the gravity model combined with the spatial pattern of agglomeration subgroup, network density and kernel density for industrial division of labor can effectively understand the dynamics of industrial spatial pattern and its evolution over time. furthermore. This work reveals that the Central Plains region encounters several development bottlenecks, including slow connectivity networks, an unreasonable industrial structure, and a lagging service sector. To tackle these issues, urban areas must promote industrial division of labor, integrate urban spaces, and enhance communication. This requires establishing mechanisms for resource allocation, planning, infrastructure construction, ecological protection, and interactive development between cities and industries. Moreover, to lead comprehensive and high-quality development, Zhengzhou’s leadership should promote the shared use of resources and factors between cities. These measures will enable the Central Plains region to improve its position in the national development pattern, improve economic strength, and accelerate industrial integration and development.
However, the work has limitations, such as variable differences due to limited data and a lack of empirical research based on multi-period data. Future research should improve models and data reliability to understand the spatial evolution of the third industry and analyses the characteristics of spatial differentiation and the evolution of the service industry for balanced development. Although the study highlights the progress of the third industry, there is still a need to develop high-tech and high-end manufacturing industries for balanced overall growth. Therefore, focusing on the spatial evolution of the third industry is crucial for addressing these challenges and promoting coordinated regional development in the Central Plains region.

5.2. Conclusions

This work investigated economic links, spatial aggregation and dispersion, and division of labor patterns in 30 cities of the CPER from 2018 to 2022. It can not only promote the integrated and coordinated development of the region and rational distribution of industry in space, but also optimize the allocation of resources in a wider range. It can also promote the further improvement of regional economy in the region, take the city as the center, and gradually develop outward, so as to adapt to the planning practice of different levels of regional economic development. The results show a significant improvement in the economic link network, with a clear north-south orientation and increased accessibility and stability. The urban agglomeration has evolved from a single-core pattern to a multi-core, networked practice, creating a diffuse spatial structure that effectively avoids “core monopoly”. The integration of the tertiary industry economic linkage network is also apparent, with interconnectedness among tertiary industry clusters exceeding 90%. Based on these findings, the paper proposes several recommendations to fully exploit the comparative advantages of the Central Plains region, promote coordinated development, and accelerate its rise. These include accelerating the construction of Zhengzhou and Luoyang, promoting the co-purposing of resources between Zhengzhou and Kaifeng, and creating a top area for the integrated, high-quality development of the CPER. The paper emphasizes the need to adhere to the core-driven, axis-driven, node-enhanced, and peripheral-docking spatial network to build a one core, four-axes, four-zones networked spatial pattern.
We also acknowledge the impact of the COVID-19 pandemic on the economy and employment in 2020 and 2022, which exacerbated the “supply shock” and “demand contraction” pressure on the economy. Nevertheless, the paper suggests that the country’s economy and employment will surge at the end of 2022 when the government announces that the epidemic has been fully liberalized.

Author Contributions

Conceptualization, Q.L. and Z.L.; Methodology, Q.L., J.W. and Y.L.; Software, G.G.; Validation, J.W. and G.G.; Formal analysis, Q.L.; Investigation, Q.L., J.W., Z.L. and G.C.; Resources, Q.L., G.G., Y.L., Z.L. and G.C.; Data curation, J.W. and G.G.; Writing—original draft, G.G. and Y.L.; Writing—review & editing, J.W.; Supervision, J.W. and G.G.; Project administration, Q.L.; Funding acquisition, J.W. All authors have read and agreed to the published version of the manuscript.

Funding

This work was partly supported by the Key Scientific and Technological Project of Henan Province (232102111128, 222102320181, 212102310087), in part by the Innovation and Entrepreneurship Training Program of National College Students in China (202110467001), in part by the Major Special Project of Xinxiang City (21ZD003), in part by the Key Scientific Research Projects of Colleges and Universities in Henan Province (23B520003, 21A520001). The authors approved the version of the manuscript to be published. They agreed to be accountable for all aspects of the work in ensuring that questions related to the accuracy or integrity of any part of the work are appropriately investigated and resolved.

Institutional Review Board Statement

Not applicable.

Informed Consent Statement

Not applicable.

Data Availability Statement

The data used to support this study are available from the corresponding author upon request.

Conflicts of Interest

The authors declare no conflict of interest.

References

  1. Li, G.P.; Song, C.Y. Study on the optimization strategy of regional spatial structure in Beijing-Tianjin-Hebei. Hebei J. 2019, 39, 137–145. [Google Scholar]
  2. Perroux, F. Economic space: Theory and application. Q. J. Econ. 1950, 64, 89–104. [Google Scholar] [CrossRef]
  3. Zhu, X.; Wang, Q.; Zhang, P.; Yu, Y.; Xie, L. Optimizing the spatial structure of urban agglomeration: Based on social network analysis. Qual. Quant. Int. J. Methodol. 2021, 55, 683–705. [Google Scholar]
  4. Liu, X.; Luo, Y.; Huang, M. Study on the Spatial Structure and City Form Construction of River Valley-Type Cities in the Context of Artificial Intelligence-A Case Study of Northwest China. Wirel. Commun. Mob. Comput. 2022, 2022, 4202745. [Google Scholar] [CrossRef]
  5. Shi, W.; Tian, J.; Namaiti, A.; Xing, X. Spatial Evolution and Driving Factors of the Coupling Coordination between Urbanization and Urban Resilience: A Case Study of the 167 Counties in Hebei Province. Int. J. Environ. Res. Public Health 2022, 19, 13128. [Google Scholar] [CrossRef] [PubMed]
  6. Chen, H.; Zhu, S.; Sun, J.; Zhong, K.; Shen, M.; Wang, X. A Study of the Spatial Structure and Regional Interaction of Agricultural Green Total Factor Productivity in China Based on SNA and VAR Methods. Sustainability 2022, 14, 7508. [Google Scholar] [CrossRef]
  7. Cheng, W.; Qing, C. Research on the Sustainable Synergetic Development of Chinese Urban Economies in the Context of a Study of Industrial Agglomeration. Sustainability 2020, 12, 1122. [Google Scholar]
  8. Zhang, Y.; Wang, T.; Supriyadi, A.; Zhang, K.; Tang, Z. Evolution and Optimization of Urban Network Spatial Structure: A Case Study of Financial Enterprise Network in Yangtze River Delta, China. ISPRS Int. J. Geo-Inf. 2020, 9, 611. [Google Scholar] [CrossRef]
  9. Marc, B.; Alessandro, F. Co-evolution of Density and Topology in a Simple Model of City Formation. Netw. Spat. Econ. 2009, 9, 401–425. [Google Scholar]
  10. Dong, X.; Xu, S. spatial evolution characteristics of urban and rural settlements in Inner Mongolia. Arab. J. Geosci. 2020, 13, 1214. [Google Scholar] [CrossRef]
  11. Zhao, L.; Zhao, C.; Huang, J. Spatial Dynamics and Determinants of Population Urbanization in the Upper Reaches of the Yellow River. Land 2022, 11, 1420. [Google Scholar] [CrossRef]
  12. Zhang, W. Economic Globalization and Interregional Agglomeration in a Multi-Country and Multi-Regional Neoclassical Growth Model. Investig. Reg.-J. Reg. Res. 2016, 2016, 95–121. [Google Scholar]
  13. Desmet, K.; Rossi-Hansberg, E. Spatial development. Am. Econ. Rev. 2014, 104, 1211–1243. [Google Scholar] [CrossRef]
  14. Cao, Y.; Ma, H. The Evolution and Characteristics of Economic Spatial Structure in Gansu Province. Adv. Mater. Res. 2013, 869–870, 49–52. [Google Scholar] [CrossRef]
  15. Li, H. Study on the evolution of the spatial structure of productive service industry in Chongqing and its causes. Mod. Urban Res. 2017, 10, 52–57. [Google Scholar]
  16. Zhong, Y.; Lu, M.; Xi, X. Agglomeration and service industry development—A perspective based on the spatial distribution of population. Manag. World 2020, 36, 35–49. [Google Scholar]
  17. Yu, H. Study on the spatial structure and aggregation characteristics of tertiary industries in the Yangtze River Delta region. Bus. Res. 2013, 9, 56–61. [Google Scholar]
  18. Guan, H. Analysis of spatial economic growth and border spillover effect of trade service industry in Beijing-Tianjin-Hebei region. Bus. Econ. Res. 2019, 16, 168–171. [Google Scholar]
  19. Liu, Y.; Wen, Y. The transfer of productive service industries and spatial structural changes in Beijing, Tianjin and Hebei. Explor. Econ. Issues 2017, 9, 69–77. [Google Scholar]
  20. Chen, W.; Jing, S. Research on the coordinated layout of modern service industry in the Yangtze River Delta based on deviation-share spatial structure model. J. Southeast Univ. (Philos. Soc. Sci. Ed.) 2012, 14, 31–36+123. [Google Scholar]
  21. Sun, C.; Hu, Y. Research on the linkage development of modern service industry in Wanjiang city belt based on deviation-share spatial structure model. Pract. Underst. Math. 2016, 46, 17–27. [Google Scholar]
  22. Jiao, X.; Li, W.; Tao, Z.; Yu, Z.; Song, J.; Zhang, W. Spatio-temporal evolution of industries in the context of urban expansion in Beijing. Adv. Geogr. Sci. 2014, 33, 1332–1341. [Google Scholar]
  23. Cui, D.; Yang, Y. Study on the spatial differentiation characteristics of productive service industries in the Yangtze River Delta city cluster. Reform Strategy 2015, 31, 135–141, 146. [Google Scholar]
  24. Louis, D.; Angel, I.; Felipe, G. A Hierarchical Gravity Model with Spatial Correlation: Mathematical Formulation and Parameter Estimation. Netw. Spat. Econ. 2011, 11, 439–463. [Google Scholar]
  25. Kincses, A.; Nagy, Z.; Toth, G. The spatial structure of Europe considered by various models. Acta Geog. Slov. 2013, 53, 44–60. [Google Scholar]
  26. Wang, Z.; Chen, Y. Exploring Spatial Patterns of Interurban Passenger Flows Using Dual Gravity Models. Entropy 2022, 24, 1792. [Google Scholar] [CrossRef] [PubMed]
  27. Muhammad, S.; Pan, Y.; Agha, M.; Umar, M.; Chen, S. Industrial structure, energy intensity and environmental efficiency across developed and developing economies: The intermediary role of primary, secondary and tertiary industry. Energy 2022, 247, 123576. [Google Scholar] [CrossRef]
  28. Li, X. Spatial pattern identification of Zhengzhou urban poly center based on gravitational sphere of influence. J. Geogr. 2022, 77, 1475–1489. [Google Scholar]
  29. Xiong, Y.; Li, L.; Sun, W.; Wang, M.; Yin, J. Evolutionary analysis of intercity spatial linkages in the Changzhutan city cluster. Econ. Geogr. 2022, 42, 73–81. [Google Scholar]
  30. Ge, J. Spatial and temporal evolution characteristics of economic linkages among three central city metropolitan areas in the Yellow River basin. J. Jinan Univ. (Soc. Sci. Ed.) 2023, 33, 71–81. [Google Scholar]
  31. Li, Y.; Miao, Y. A comparative study on the collaborative development of Beijing-Tianjin-Hebei urban agglomeration based on the gravitational force model. J. Beijing Jiao Tong Univ. (Soc. Sci. Ed.) 2022, 21, 78–91. [Google Scholar]
  32. 2017 Industry Classification of National Economy (GB/T 4754-2017), National Bureau of Statistics of China, 30 June 2017. Available online: http://www.stats.gov.cn/xxgk/tjbz/gjtjbz/201710/t20171017_1758922.html (accessed on 1 April 2023).
Figure 1. Tertiary GDP development in the CPER, 2018–2022. (a) GDP of the tertiary industry, (b) Tertiary GDP as a percentage of national GDP.
Sustainability 15 07989 g001
Figure 2. Development of employed persons in the tertiary sector in the CPER, 2018–2022. (a) Employed population, (b) National share of employed population.
Sustainability 15 07989 g002
Figure 3. Advanced service industries in the CPER.
Sustainability 15 07989 g003
Figure 4. The general service industry.
Sustainability 15 07989 g004
Figure 5. Other service industries.
Sustainability 15 07989 g005
Figure 6. Heat map of advanced services.
Sustainability 15 07989 g006
Figure 7. Heat map of the general service industry.
Sustainability 15 07989 g007
Figure 8. Heat map of other services.
Sustainability 15 07989 g008
Table 1. Cities of CPER.
ProvinceCities
HenanZhengzhou, Kaifeng, Luoyang, Pingdingshan, Anyang, Hebi, Xinxiang, Jiaozuo, Puyang, Xuchang, Luohe, Sanmenxia, Nanyang, Shangqiu, Xinyang, Zhoukou, Zhumadian, Jiyuan
ShanxiChangzhi, Jincheng, Yuncheng
HebeiXingtai, Handan
ShandongLiaocheng, Heze
AnhuiSuzhou, Huaibei, Fuyang, Bozhou, Bengbu
Table 2. Subcategories of the tertiary industry.
SubcategoriesContent Composition
Advanced ServicesInformation transmission, software, and information technology; finance; leasing and commerce
General ServicesTransportation, storage, and postal services; wholesale and retail; scientific research, technical services, and geological surveys
Table 3. GDP of advanced services (CNY 100 M).
ProvincesCities2018 2019 2020 2021 2022
HenanZhengzhou1691.671916.172029.282388.822782.02
Kaifeng205.75229.76240.79268.52329.90
Luoyang510.95569.49599.25645.70725.81
Pingdingshan209.67234.35248.70279.74344.44
Anyang189.31197.54209.52238.21300.55
Hebi50.4355.8758.8878.57131.93
Xinxiang223.83252.46270.47305.17373.53
Jiaozuo186.23202.24204.32223.09275.53
Puyang133.78146.44153.27176.81234.00
Xuchang241.97272.54284.10312.35374.25
Luohe99.36115.76126.28153.50214.38
Sanmenxia99.53110.50118.57143.34201.77
Nanyang331.49369.19393.61434.73509.51
Shangqiu218.51243.54259.22291.60357.64
Xinyang249.90264.30277.44307.29370.79
Zhoukou205.97232.86245.70275.24338.44
Zhumadian224.18252.32269.38303.14370.56
Jiyuan36.0141.0542.4860.61112.41
ShandongLiaocheng268.32236.15255.22274.29327.01
Heze250.48339.60373.27406.94474.27
ShanxiChangzhi132.92145.94158.95171.97218.64
Jincheng104.28116.27128.26140.25185.90
Yuncheng146.56159.42172.28185.15231.67
AnhuiSuzhou166.32216.47236.25256.04309.49
Huaibei73.92121.42133.07144.72190.03
Fuyang147.84293.09319.68346.26406.51
Bozhou110.88196.79213.72230.66281.25
Bengbu158.93215.63231.03246.44295.50
HebeiXingtai191.14220.17233.82247.47294.78
Handan308.74348.81370.56392.31447.72
Table 4. GDP of general services (CNY 100 M).
ProvincesCities2018 2019 2020 2021 2022
HenanZhengzhou1821.761982.462009.862180.332384.46
Kaifeng277.25292.58301.51327.13386.42
Luoyang699.94804.13816.20844.97907.40
Pingdingshan335.32367.74373.60396.16452.38
Anyang311.07323.50331.88356.96415.69
Hebi121.83131.92133.37151.51203.31
Xinxiang420.76456.12463.33487.24544.81
Jiaozuo305.26422.74412.04418.03457.69
Puyang290.38272.01276.82298.32353.48
Xuchang367.65452.88465.09494.00556.57
Luohe284.22307.91311.35331.49385.28
Sanmenxia365.37225.86228.65248.13301.28
Nanyang502.42677.68688.92716.86778.46
Shangqiu290.57358.73360.57379.10431.30
Xinyang314.02282.30285.21304.82358.09
Zhoukou384.95383.84395.66424.19486.37
Zhumadian306.81328.49337.15362.51421.52
Jiyuan86.9599.04102.57122.81176.70
ShandongLiaocheng510.92447.73454.28460.84501.05
Heze476.95643.86664.41684.96739.17
ShanxiChangzhi148.43184.71221.00257.29327.23
Jincheng115.32146.83178.33209.83275.00
Yuncheng164.61202.07239.54277.01348.13
AnhuiSuzhou255.11314.34322.92337.56385.86
Huaibei113.38176.32181.89187.46226.69
Fuyang226.76425.60436.95448.29493.30
Bozhou170.07285.76292.13298.50338.52
Bengbu243.77313.12315.79318.45354.78
HebeiXingtai330.52348.40370.00391.60446.86
Handan535.07551.96586.37620.79688.86
Table 5. GDP of other services (CNY 100 M).
ProvincesCities2018 2019 2020 2021 2022
HenanZhengzhou2655.693177.803026.043110.443284.60
Kaifeng502.94585.47554.10606.70749.07
Luoyang1112.171151.911096.141163.631320.89
Pingdingshan486.07528.92508.91568.74718.32
Anyang532.10510.55498.66566.06723.22
Hebi177.33157.76150.82198.32335.58
Xinxiang704.44648.95625.67688.36840.81
Jiaozuo570.33508.12450.50471.91583.09
Puyang366.42358.67337.87384.64521.18
Xuchang694.61722.08680.85734.23877.37
Luohe327.55316.59309.01366.13513.02
Sanmenxia302.59269.77263.27320.09466.67
Nanyang958.86949.69915.48984.131142.54
Shangqiu640.89701.31668.21720.37862.29
Xinyang611.84677.75654.31717.15869.75
Zhoukou648.10710.45683.86744.08894.06
Zhumadian536.98594.83574.78640.20795.37
Jiyuan94.17112.87105.78150.93285.85
ShandongLiaocheng514.13480.24478.48505.51622.30
Heze479.95690.62699.80750.39890.74
ShanxiChangzhi276.94331.83358.67484.53700.16
Jincheng215.81264.13289.38395.17590.72
Yuncheng304.86362.61388.73521.67744.36
AnhuiSuzhou348.62465.97455.78471.65577.28
Huaibei154.94261.38256.73266.69366.41
Fuyang309.88630.91616.72637.81748.65
Bozhou232.41423.61412.32424.71526.87
Bengbu333.12464.17445.71453.21550.46
HebeiXingtai389.26460.67461.68488.63605.34
Handan629.26729.83731.66774.60907.30
Table 6. Employed population (10,000) of advanced services.
ProvincesCities2018 2019 2020 2021 2022
HenanZhengzhou42.6444.4340.0745.7248.36
Kaifeng6.887.046.057.075.08
Luoyang14.5918.7715.5814.3910.20
Pingdingshan5.876.635.776.915.04
Anyang8.168.317.658.987.32
Hebi3.173.303.375.434.50
Xinxiang7.767.438.629.819.00
Jiaozuo5.385.755.755.743.74
Puyang3.897.405.453.491.54
Xuchang5.095.916.036.155.27
Luohe3.723.403.062.722.38
Sanmenxia3.373.713.342.972.59
Nanyang12.4512.8913.6614.4414.21
Shangqiu10.0010.898.716.534.36
Xinyang6.798.026.945.854.77
Zhoukou17.0219.8516.6713.5010.32
Zhumadian18.0620.4917.8315.1612.50
Jiyuan0.600.700.710.710.72
ShandongLiaocheng11.3111.3422.0032.6642.32
Heze5.055.2514.5023.7532.00
ShanxiChangzhi12.4111.6910.9711.1110.25
Jincheng10.129.729.329.168.00
Yuncheng15.0216.1517.2917.4216.55
AnhuiSuzhou17.8417.4010.096.407.24
Huaibei5.889.545.551.551.15
Fuyang36.3632.8315.8713.0510.22
Bozhou17.3017.6317.3016.9816.65
Bengbu13.838.459.0013.0417.08
HebeiXingtai2.332.392.442.502.55
Handan4.664.774.884.995.11
Table 7. Employed population (10,000) of general services.
ProvincesCities2018 2019 2020 2021 2022
HenanZhengzhou161.33195.21214.73237.25258.77
Kaifeng46.2446.0139.5736.1331.69
Luoyang67.6582.7868.7157.6345.56
Pingdingshan44.7350.0643.5540.0435.54
Anyang57.2854.7350.3548.9746.59
Hebi19.4015.2315.5318.8421.14
Xinxiang54.0355.1663.9975.8186.64
Jiaozuo40.1139.8939.8742.8444.82
Puyang37.5646.5134.2324.9414.66
Xuchang45.8143.7844.6648.5351.41
Luohe29.1736.7433.0732.3930.72
Sanmenxia25.5326.5223.8624.2123.55
Nanyang97.9195.12100.83109.53117.24
Shangqiu107.22110.5888.4669.3549.23
Xinyang87.5479.9569.1661.3652.57
Zhoukou69.5272.8461.1952.5342.88
Zhumadian76.8775.7065.8657.0247.18
Jiyuan6.767.137.308.478.64
ShandongLiaocheng6.674.8310.5017.1722.84
Heze5.865.0414.0023.9632.92
ShanxiChangzhi16.9214.1011.2812.3212.37
Jincheng13.8011.699.5810.3310.09
Yuncheng20.4819.1217.7618.7518.74
AnhuiSuzhou19.7618.8713.9912.129.24
Huaibei6.365.044.096.146.10
Fuyang40.0836.8822.4617.9212.37
Bozhou25.4225.8720.4117.9514.49
Bengbu19.1611.6211.6114.6016.60
HebeiXingtai12.2512.1612.0815.0016.92
Handan24.4924.3324.1727.0028.84
Table 8. Employed population (10,000) of other services.
ProvincesCities2018 2019 2020 2021 2022
HenanZhengzhou127.53140.77154.85172.92191.00
Kaifeng53.0855.0447.3343.6339.92
Luoyang80.7679.0865.6456.1946.75
Pingdingshan46.3750.2543.7241.1938.65
Anyang51.2752.4048.2148.0247.82
Hebi18.9819.0819.4623.8428.22
Xinxiang53.8954.9163.7076.4889.27
Jiaozuo33.6933.8933.8737.8541.83
Puyang34.6541.8030.7623.7216.68
Xuchang42.1541.9942.8347.6752.51
Luohe21.3320.5918.5320.4722.41
Sanmenxia22.9224.4221.9723.5325.08
Nanyang94.3789.3694.72102.08109.44
Shangqiu81.7480.0264.0250.0136.01
Xinyang65.2264.6455.9148.1940.46
Zhoukou89.22101.6085.3470.0954.83
Zhumadian89.2986.9975.6865.3755.06
Jiyuan7.377.777.969.1410.33
ShandongLiaocheng39.5943.0585.00127.95170.90
Heze54.9459.85112.00165.15218.30
ShanxiChangzhi30.5236.1741.8143.8345.85
Jincheng24.9030.2035.5136.3037.10
Yuncheng36.9551.4165.8668.1470.41
AnhuiSuzhou98.96101.7683.5266.4549.38
Huaibei33.0833.7827.5922.4017.46
Fuyang176.40168.64132.4297.1962.25
Bozhou101.86102.1262.6554.1745.80
Bengbu60.0867.7331.9838.9051.11
HebeiXingtai14.7915.3215.8517.3818.91
Handan29.5830.6431.7033.7635.82
Table 9. Network linkage intensity.
Linkage Intensity20182019202020212022
Advanced services16321990204023772815
General services61027293729681979882
Other services882210,68111,24011,57814,826
Table 10. Overall network density.
Network Density20182019202020212022
Advanced Services 0.1590.1830.1890.1990.205
General Services0.1450.1730.1790.1960.214
Other services0.1620.1850.1890.2160.244
Table 11. Normalized values of network density.
Normalized Network Density20182019202020212022
Advanced Services0.0560.0640.0660.0700.072
General Services0.0510.0620.0640.0690.075
Other Services0.0570.0650.0660.0760.086
Table 12. The centrality correlation of tertiary industry.
Types of ServiceYearAdvancedGeneralOther
Advanced Services2018-93.56%96.00%
2019-95.24%99.50%
2020-95.41%99.64%
2021-96.00%97.15%
2022-89.32%96.41%
General Services201893.56%-95.70%
201995.24%-95.51%
202095.41%-94.75%
202196.00%-95.68%
202289.32%-93.30%
Other Services201896.00%95.70%-
201999.50%95.51%-
202099.64%94.75%-
202197.15%95.68%-
202296.41%93.30%-
Table 13. The core density.
Core Density20182019 2020 2021 2022
Advanced Services0.5000.6100.5800.6220.710
General services 0.3430.4840.4730.5020.740
Other services0.4870.6940.5820.7230.820
Table 14. The density relative to periphery.
Marginal Area Density20182019202020212022
Advanced Services 0.0680.0710.0890.0900.110
General Services0.0300.0420.0420.0440.065
Other Services0.0480.0640.0760.0900.100
Table 15. The core-edge density ratio.
Core Edge Density Ratio20182019202020212022
Advanced Services7.358.596.526.916.45
General Services11.4311.5211.2611.4111.38
Other Services10.1510.847.668.038.20
Disclaimer/Publisher’s Note: The statements, opinions and data contained in all publications are solely those of the individual author(s) and contributor(s) and not of MDPI and/or the editor(s). MDPI and/or the editor(s) disclaim responsibility for any injury to people or property resulting from any ideas, methods, instructions or products referred to in the content.

