Article

Grain-Size Analysis of Middle Cretaceous Sandstone Reservoirs, the Wasia Formation, Riyadh Province, Saudi Arabia

Faculty of Earth Sciences, King Abdulaziz University, Jeddah 21589, Saudi Arabia
Sustainability 2023, 15(10), 7983; https://doi.org/10.3390/su15107983
Submission received: 31 March 2023 / Revised: 10 May 2023 / Accepted: 10 May 2023 / Published: 13 May 2023
(This article belongs to the Section Sustainable Water Management)

Abstract

:
Grain-size analysis is a significant descriptive method to determine and evaluate depositional environments and hydrodynamic conditions in addition to classifying sedimentary rocks. In this study, grain-size analysis was conducted using dry-sieving procedures on fourteen representative sandstone samples from the Wasia Formation, a thick water aquifer and a hydrocarbon reservoir. Hydrodynamic conditions and depositional environments were determined using bivariate plots, linear discriminate function (LDF), log probability, and Passega diagram. The results reveal that the lower outcrop section consists of coarse- to medium-grained sandstone with a majority being poorly sorted, while the upper section is made up of medium- to medium-well-sorted fine-grained sandstone units. The sediments have a unimodal distribution of 2∅ (all the lower section) and 3∅ (most of the upper section), while two beds have a bimodal of 2 and 3∅. The lower section has wide range skewness with mainly mesokurtic curves, while the upper section is near-symmetrical to coarse-skewed but mostly leptokurtic. Additionally, log probability plots and the Passega diagram show that the majority of the indicative sediments were transported via one to two saltation levels, while fine-grains were transported via suspension. The results of the LDF method are predominantly indicative of aeolian, marine, and fluvial environments.

1. Introduction

Grain-size analysis is a significant descriptive method to evaluate depositional environments and hydrodynamic conditions and to classify sedimentary rocks [1,2,3,4]. Such analysis delivers important indications about the sediment origin, transportation mechanism, and depositional environments [5]. Many researchers, including [1,2,5,6,7,8,9,10,11,12,13,14,15,16,17,18,19,20], proved that the grain-size parameters can reveal the sedimentary conditions since each environment has unique characteristics that can be distinguished from others.
Boggs [21] revealed three main grain-size methods that researchers depend on: (I) grade scale method which measures the grain size; (II) graphical or statistical method using quantitative data; and (III) data genetic importance. However, statistical and graphical analyses are the most common methods to evaluate such data. They include plotting individual (linear) or cumulative weight percentages against the sieve size in phi (∅) units. Statistical parameters can then be calculated including grain-size mean, standard deviation, kurtosis, and skewness.
Friedman [22] revealed plotting different parameters on bivariate diagrams helps to distinguish different sedimentary environments, while other researchers, such as Visher [20] and Sagoe and Visher [23], suggest analyzing log-probability plots of cumulative grain size. Furthermore, Visher [20] proved that these curves represent straight lines (two to three), identifying sediment environments as well as sediments transportation mechanisms including suspension, saltation, and traction.
The Wasia Formation is a middle Cretaceous sedimentary sequence that mainly consists of sandstone and siltstone [24,25,26,27,28]. This research provides relatively detailed grain-size analysis of the Wasia Formation that contains 14 sandstone beds that are covered by a limestone unit on the top of the studied outcrop. The novelty of this research is to determine and evaluate the depositional process and environments of the Wasia Formation using the generation and integration of the grain-size analysis results in addition to the parameters’ plotting.
The Wasia Formation was named for Khashm Wasi, where it is outcropped in a discontinuous arc (lat. 20°54′–30°00′ N), and the complete outcrop is exposed at latitude of 24°23′ N [26,29,30,31] (Figure 1). Additionally, a stratigraphic column of the Cretaceous and Tertiary of the Arabian platform is shown in Figure S1. Steineke et al.’s study [29] was the first published research to describe the stratigraphic details of the Wasia Formation. The base of the Wasia Formation is at the point of contact of fine-grained sandstone and siltstone underlying with pebbly coarse-grained sandstone of the Biyadh Formation, while the top is at the point of contact of Wasia sandstone with the overlying limestone and dolomite of Aruma Formation [31]. The thickness of the Wasia Formation increases irregularly but gradually from south to north. The thickness in the south (near Wadi ad Dawasir) is about 25 to 30 m, while it reaches a maximum of 285 m in the north near Sakakah with an average outcrop of 42 m [26,28,29,30,32,33]. The Wasia Formation consists mainly of Middle-Cretaceous sandstone and siltstone units, the northern and central parts of which are mostly marine units, while the southern part is non-marine [25,27,29,31,34,35,36].
The Wasia Formation can be divided into up to seven members in limited locations. The rock units are (from oldest to youngest): Khafji, Safaniya, Mauddud, Wara, Ahmadi, Rumaila, and Mishrif [29,37]. The top five members were named after Kuwaiti formations, while the base two members (highest economically significant members) were named after Saudi Arabian locations [24]. These two members are equivalent to the Burgan Formation in Kuwait and the Nahr Umr Formation in Iraq [24,26,34,38]. The lithology of the Wasia Formation is mainly sandstone, where most of the sands are sub-rounded to angular [25,26,28,32]. Eastward, however, there is an increase in clays, marls, carbonates, and shales [25]. Wasia can be classified into two major sections. The lower sequence contains siliciclastic facies including four members: Khafji, Safaniya, Mauddud, and Wara. The upper section, on the other hand, includes a sequence of fine-grained siliciclastics and rare carbonates with three members: Ahmadi, Rumaila and Mishrif [30,32].
The Wasia Formation is one of the most important formations since it is a thick water aquifer [27,30,31,33] and a hydrocarbon reservoir [25,27,30,31,39,40,41,42]. The Wasia Formation aquifer varies in quality, being freshly meteoric (excellent quality) near the outcrop, while it becomes brine toward the northeast [31]. Moreover, the Waisa and its equivalents are one of the main hydrocarbon production units in the region [24,25,30,40]. It holds commercial productive oil and gas at several levels, especially in the Safaniya field (offshore). The Safaniya sandstone reservoir, for instance, has an average porosity of 31.5% (22.8–33.5%) and an average permeability of 6394 mD (14–9550 mD). It contains heavy oil with an API of 13.2–15.7° that has a high amount of sulfur (6.2–8.7%) [39]. Most of the oil and gas is accumulated in friable sandstone. However, a significant amount has been found in porous limestone units. There is also a gas accumulation in the Wasia Formation at Dammam field, as well as low-gravity oil at Khursaniyah field. Generally, most of the Wasia petroleum reservoirs are in the Khafji, Safaniya, and Ahmadi members [30]. It is worth noting that the Wasia Formation contains significant quantities of oil and gas in Saudi Arabia, Kuwait, Iraq and Bahrain. To date, this is the first comprehensive study that uses grain-size analysis to evaluate the depositional environments, hydrodynamic conditions, and sedimentary classifications of the Wasia Formation in Saudi Arabia.

2. Materials and Methods

This study investigated a 23 m thick outcrop of the Wasia Formation located north-east of Al-Kharj city, Riyadh Province (latitude 24°15′37″ N, longitude 47°26′12″ E). The outcrop was divided into fourteen beds based on its structures and grain size. All these beds consist of poorly cemented and friable sandstones. To investigate the entire outcrop, a fresh representative sample was collected from each bed, beginning from the bottom of the outcrop. For instance, sample 1 represents the bottom bed of the outcrop (Figure 1). A riffle sample splitter was used to prepare a representative dry fraction of 350 g of each sandstone sample. This portion was then sieved using a set of stacked sieves composed of 4000, 2000, 1000, 500, 250, 125, 63, and 38 microns mesh sizes and a receiving pan. Each sample was poured into the top sieve and shaken for 15 min. Each grain fraction in each sieve, as well as the pan, were collected, weighted and recorded. The grain sizes were converted from millimeters (D) to ∅ unit using the following equation [43]:
= l o g 2 ( D )
Then, the cumulative percentages were plotted versus the grain sizes in ∅ unit to identify the 95th, 84th, 75th, 50th, 25th, 16th, 5th, and 1st percentiles and then calculate the inclusive graphic mean ( M Z ), inclusive graphic standard deviation ( σ I ), inclusive graphic skewness ( Sk ), and graphic kurtosis ( K ), which have been verified by Folk and Ward [9], as follows:
M Z = 16 + 50 + 84 3
σ I = 84 16 4 + 95 5 6.6
Sk = 84 + 16 2 50 2 ( 84 16 ) + 95 + 5 2 50 2 ( 95 5 )
K = 95 5 2.44 ( 75 25 )
Bivariate curves were plotted to distinguish between depositional settings according to the variation in the sediment textures. Moreover, the linear discriminant function (LDF) was employed to discriminate the depositional process and environments. Parameters of the grain-size analysis, C-M plots (one-percentile value versus the median), and log-probability plots were used to distinguish depositional processes, sedimentation mechanisms and transportation methods [15,20].
The four parameters of the grain-size analysis are defined as follows:
-
The inclusive graphic mean ( M Z ) is a descriptive measure that represents the grain-size distribution of sediments.
-
The inclusive graphic standard deviation ( σ I ), commonly known as grain-size sorting, measures the degree of scattering of grain-size around the mean size.
-
The inclusive graphic skewness ( Sk ) is a descriptive parameter that displays the symmetry of the grain-size distribution.
-
The graphic kurtosis ( K ) represents the sharpness of grain-size frequency curve that compares the sorting or spreading of the middle distribution section to the tail spread.

3. Results and Discussion

3.1. Grain-Size Statistics

The outcropped sandstone beds in this study vary in thickness from 0.3 m to around 3 m. The grain-size analysis results are shown in Table 1. The results are ordered according to their stratigraphic deposition in the outcrop, where bed 1 is the base of the outcrop. The sandstone beds are composed of pebbly coarse sandstone (mainly the bottom beds) to very fine sandstone (mostly the upper beds). At the lower five beds of the outcrop, the gravel-pebble percentage reaches up to 12.7% with minor clay (0.3 to 1.3%) with an average grain-size median of 409 microns. Most of these sandstones consist of medium-grained sands (48.5%), coarse-grained sands (26.3%), and fine-grained sands (19.9%). On the other hand, the silt-clay percentage of the upper section of the outcrop reaches 4.6% with minor gravel-bubble (0.7%) with an average grain-size median of 208 microns. Most of these beds consist of fine-grained sands (69.4%), medium-grained sands (24.0%) and coarse-grained sands (4.2%) (Table 1).
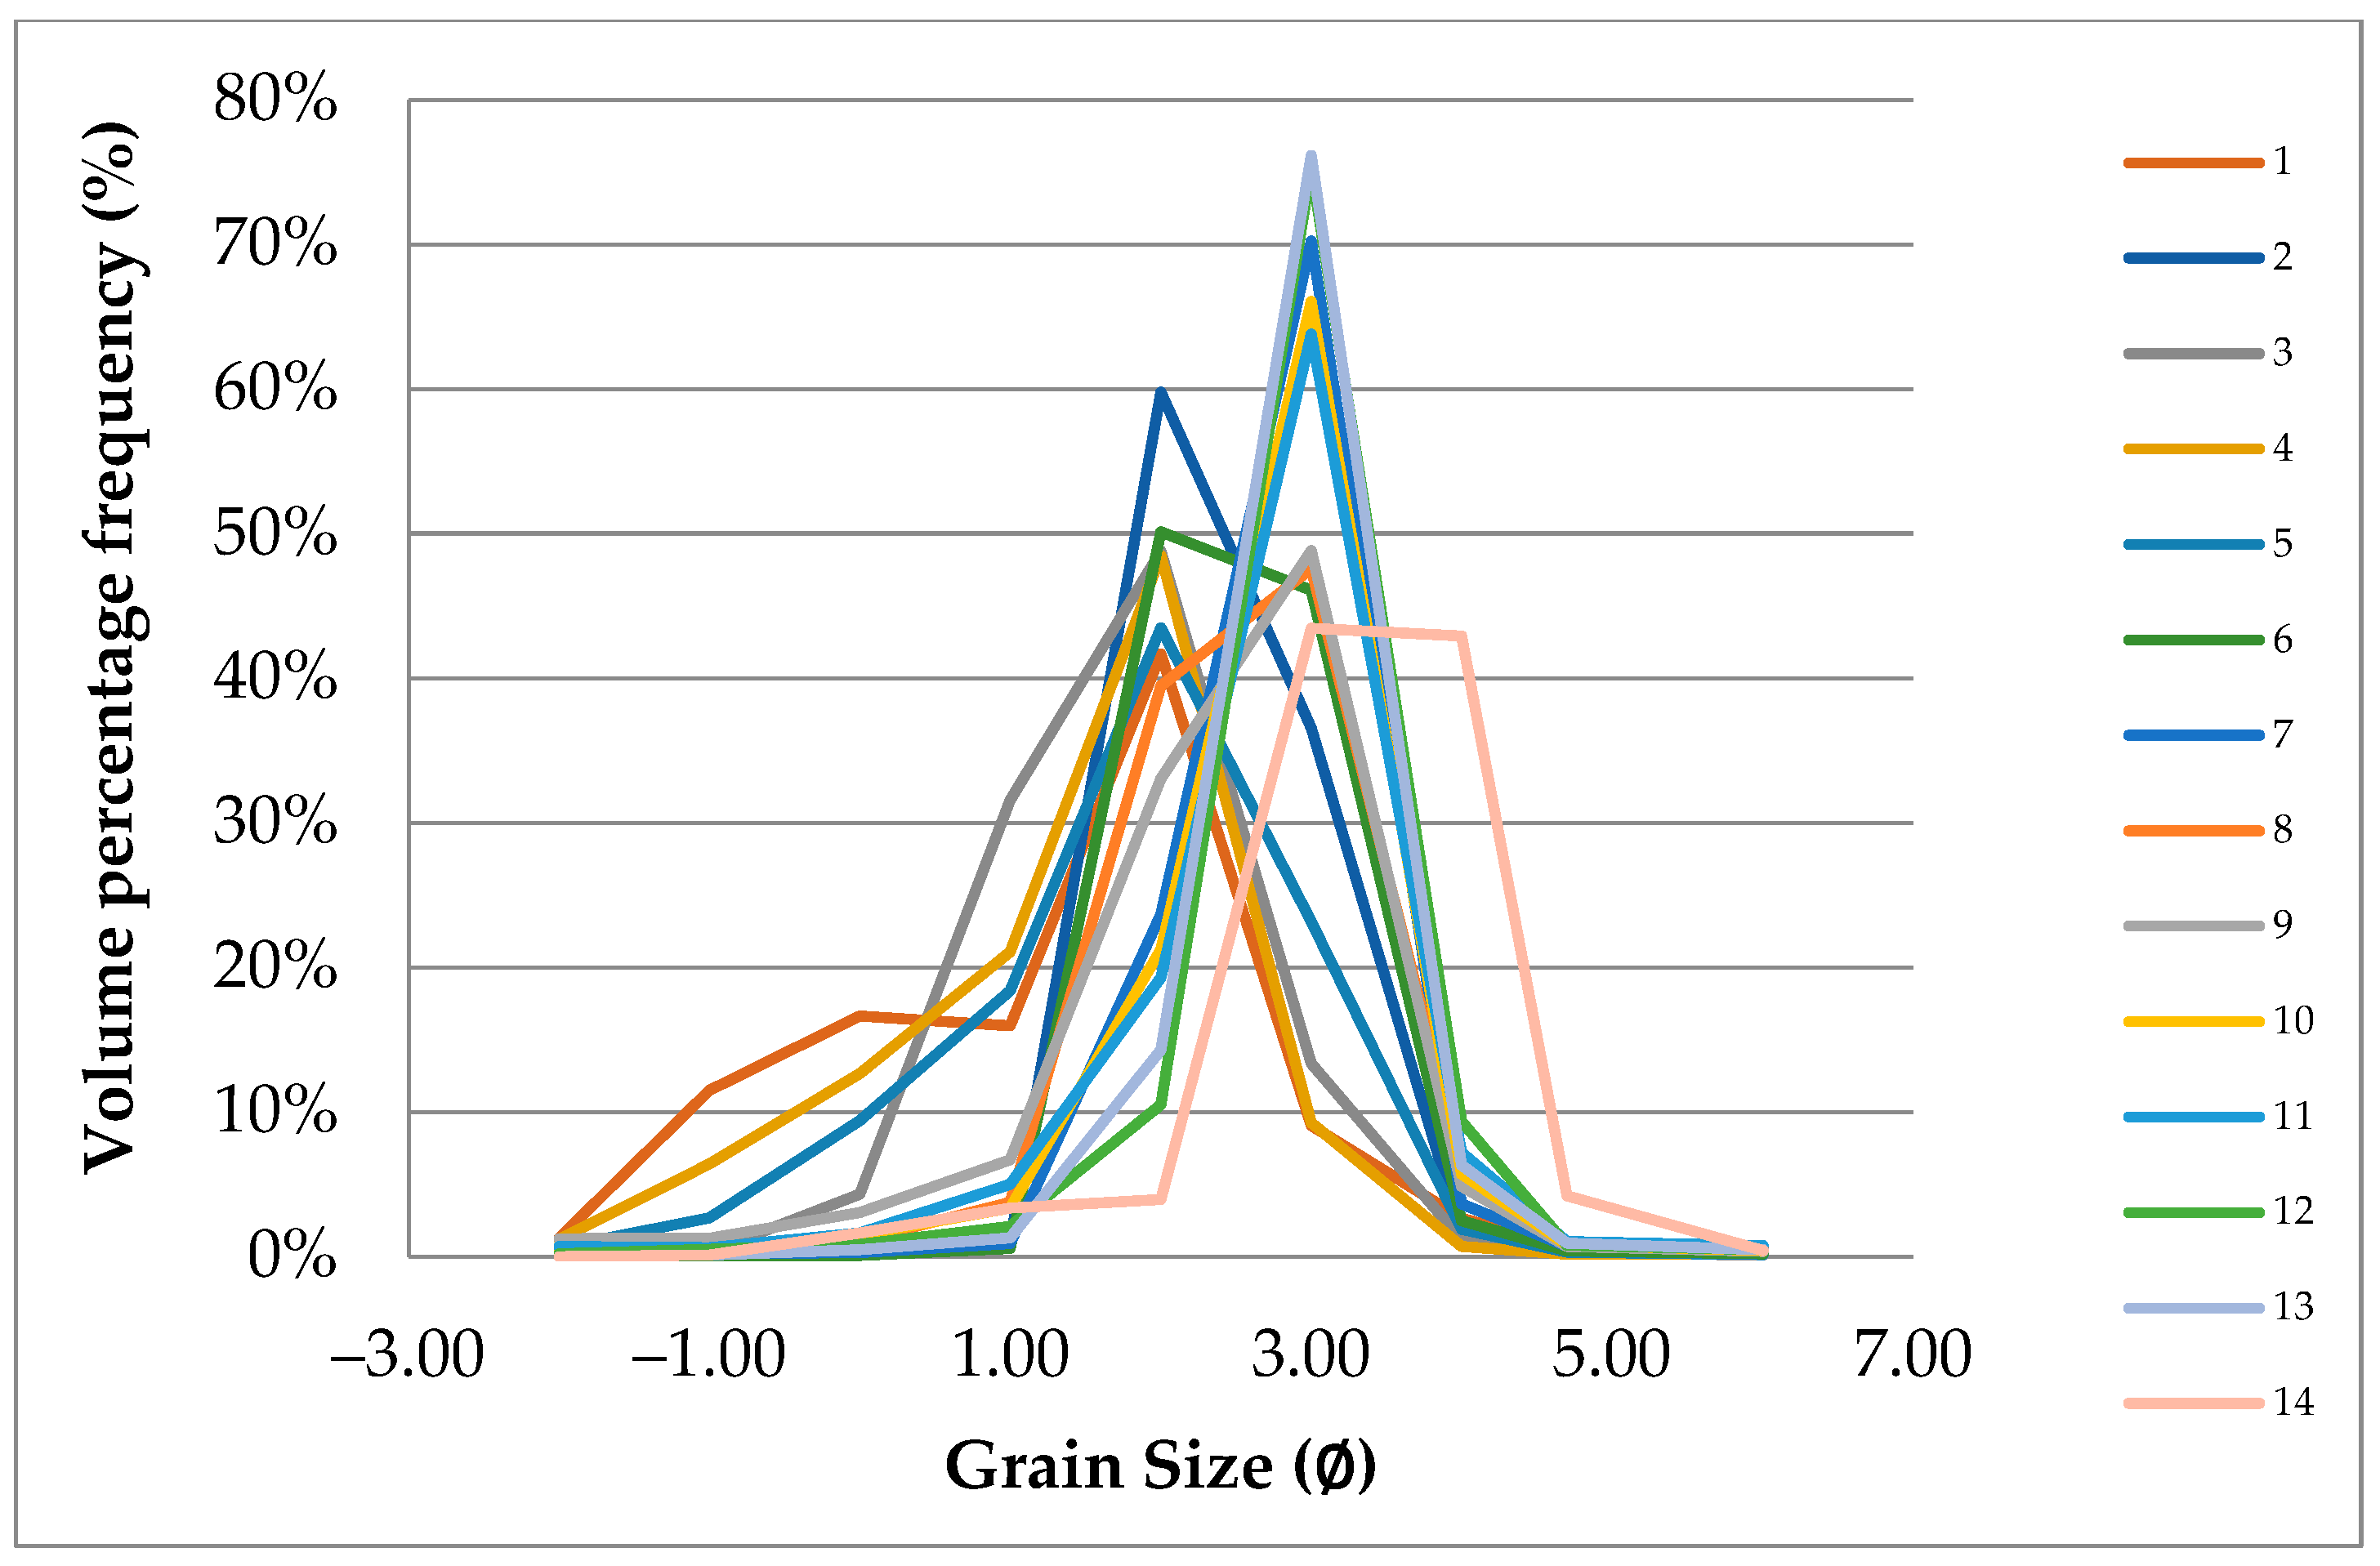
The volume percentage frequency plot (Figure 2) shows that the majority of the sandstones are unimodal (79%) with only two bimodal beds. All the lower section sandstones have a peak at 2∅ (250 microns), while 67% of the upper section beds have a peak at 3∅ (125 microns). On the other hand, three beds are unimodal with peaks at 2∅ and 3∅ and 3∅ and 4∅.

3.2. Grain-Size Parameters

Most of the depositional environments have unique conditions which affect the grain sizes and transportation methods [21,44,45,46,47]. Different grain-size statistical parameters were calculated from the cumulative grain-size distribution curves including the mean, standard deviation, skewness, and kurtosis (Table 2). The mean size is one of the most significant characteristics in different areas of study such as hydraulic conductivity of sandstone reservoir [48] and groundwater management [49]. A graphic mean of grain-size analysis from coarse- to medium-grained sandstone represents high-to-medium depositional environment energy. A narrow variation in the grain-size means indicates minor velocity fluctuations of the depositional medium or a single depositional source of the particles. Additionally, Folk and Ward [9] proved that the grain size have an inverse relationship with the grain sorting. Fine-to-medium sand particles, for example, have the best grain sorting, while the worst sorting can be associated with coarser particles. The variation in the kinetic energy regime can be interpreted via the standard deviation of the grain-size analysis, which represents the medium transportation velocity.
The results of the mean size (in ∅ unit) indicate that the studied outcrop can be subdivided into two sections: (I) lower section (bottom five beds), which is coarse- to medium-grained sandstone; and (II) upper section (upper nine beds), which is totally fine-grained sandstone. The grain-size mean of the lower section varies from 0.75∅ to 1.89∅, indicating that the beds are coarse- to medium-grained sandstone. On the other hand, the grain-size mean of the upper section ranges from 2.00∅ to 2.95∅, meaning that all the upper beds are fine-grained sandstone.
The variation in the sorting between the lower section (lower five beds) and the upper section (upper nine beds) of the studied outcrop indicates that either there is variation in the depositional medium velocity or the sediments were transported by two different methods. Both of grain size and sorting control reservoir permeability. In general, sediments that have better sorting (lower standard deviation) have higher permeability. Standard deviation, which represents the grain sorting, can be used to discriminate beach/shallow-marine from fluvial environments. The results of the grain-size standard deviation reveal that most of the lower section beds are poorly sorted with a standard deviation of 1.02∅. In contrast, the beds from the upper section are medium- to medium-well-sorted with an average standard deviation of 0.72∅.
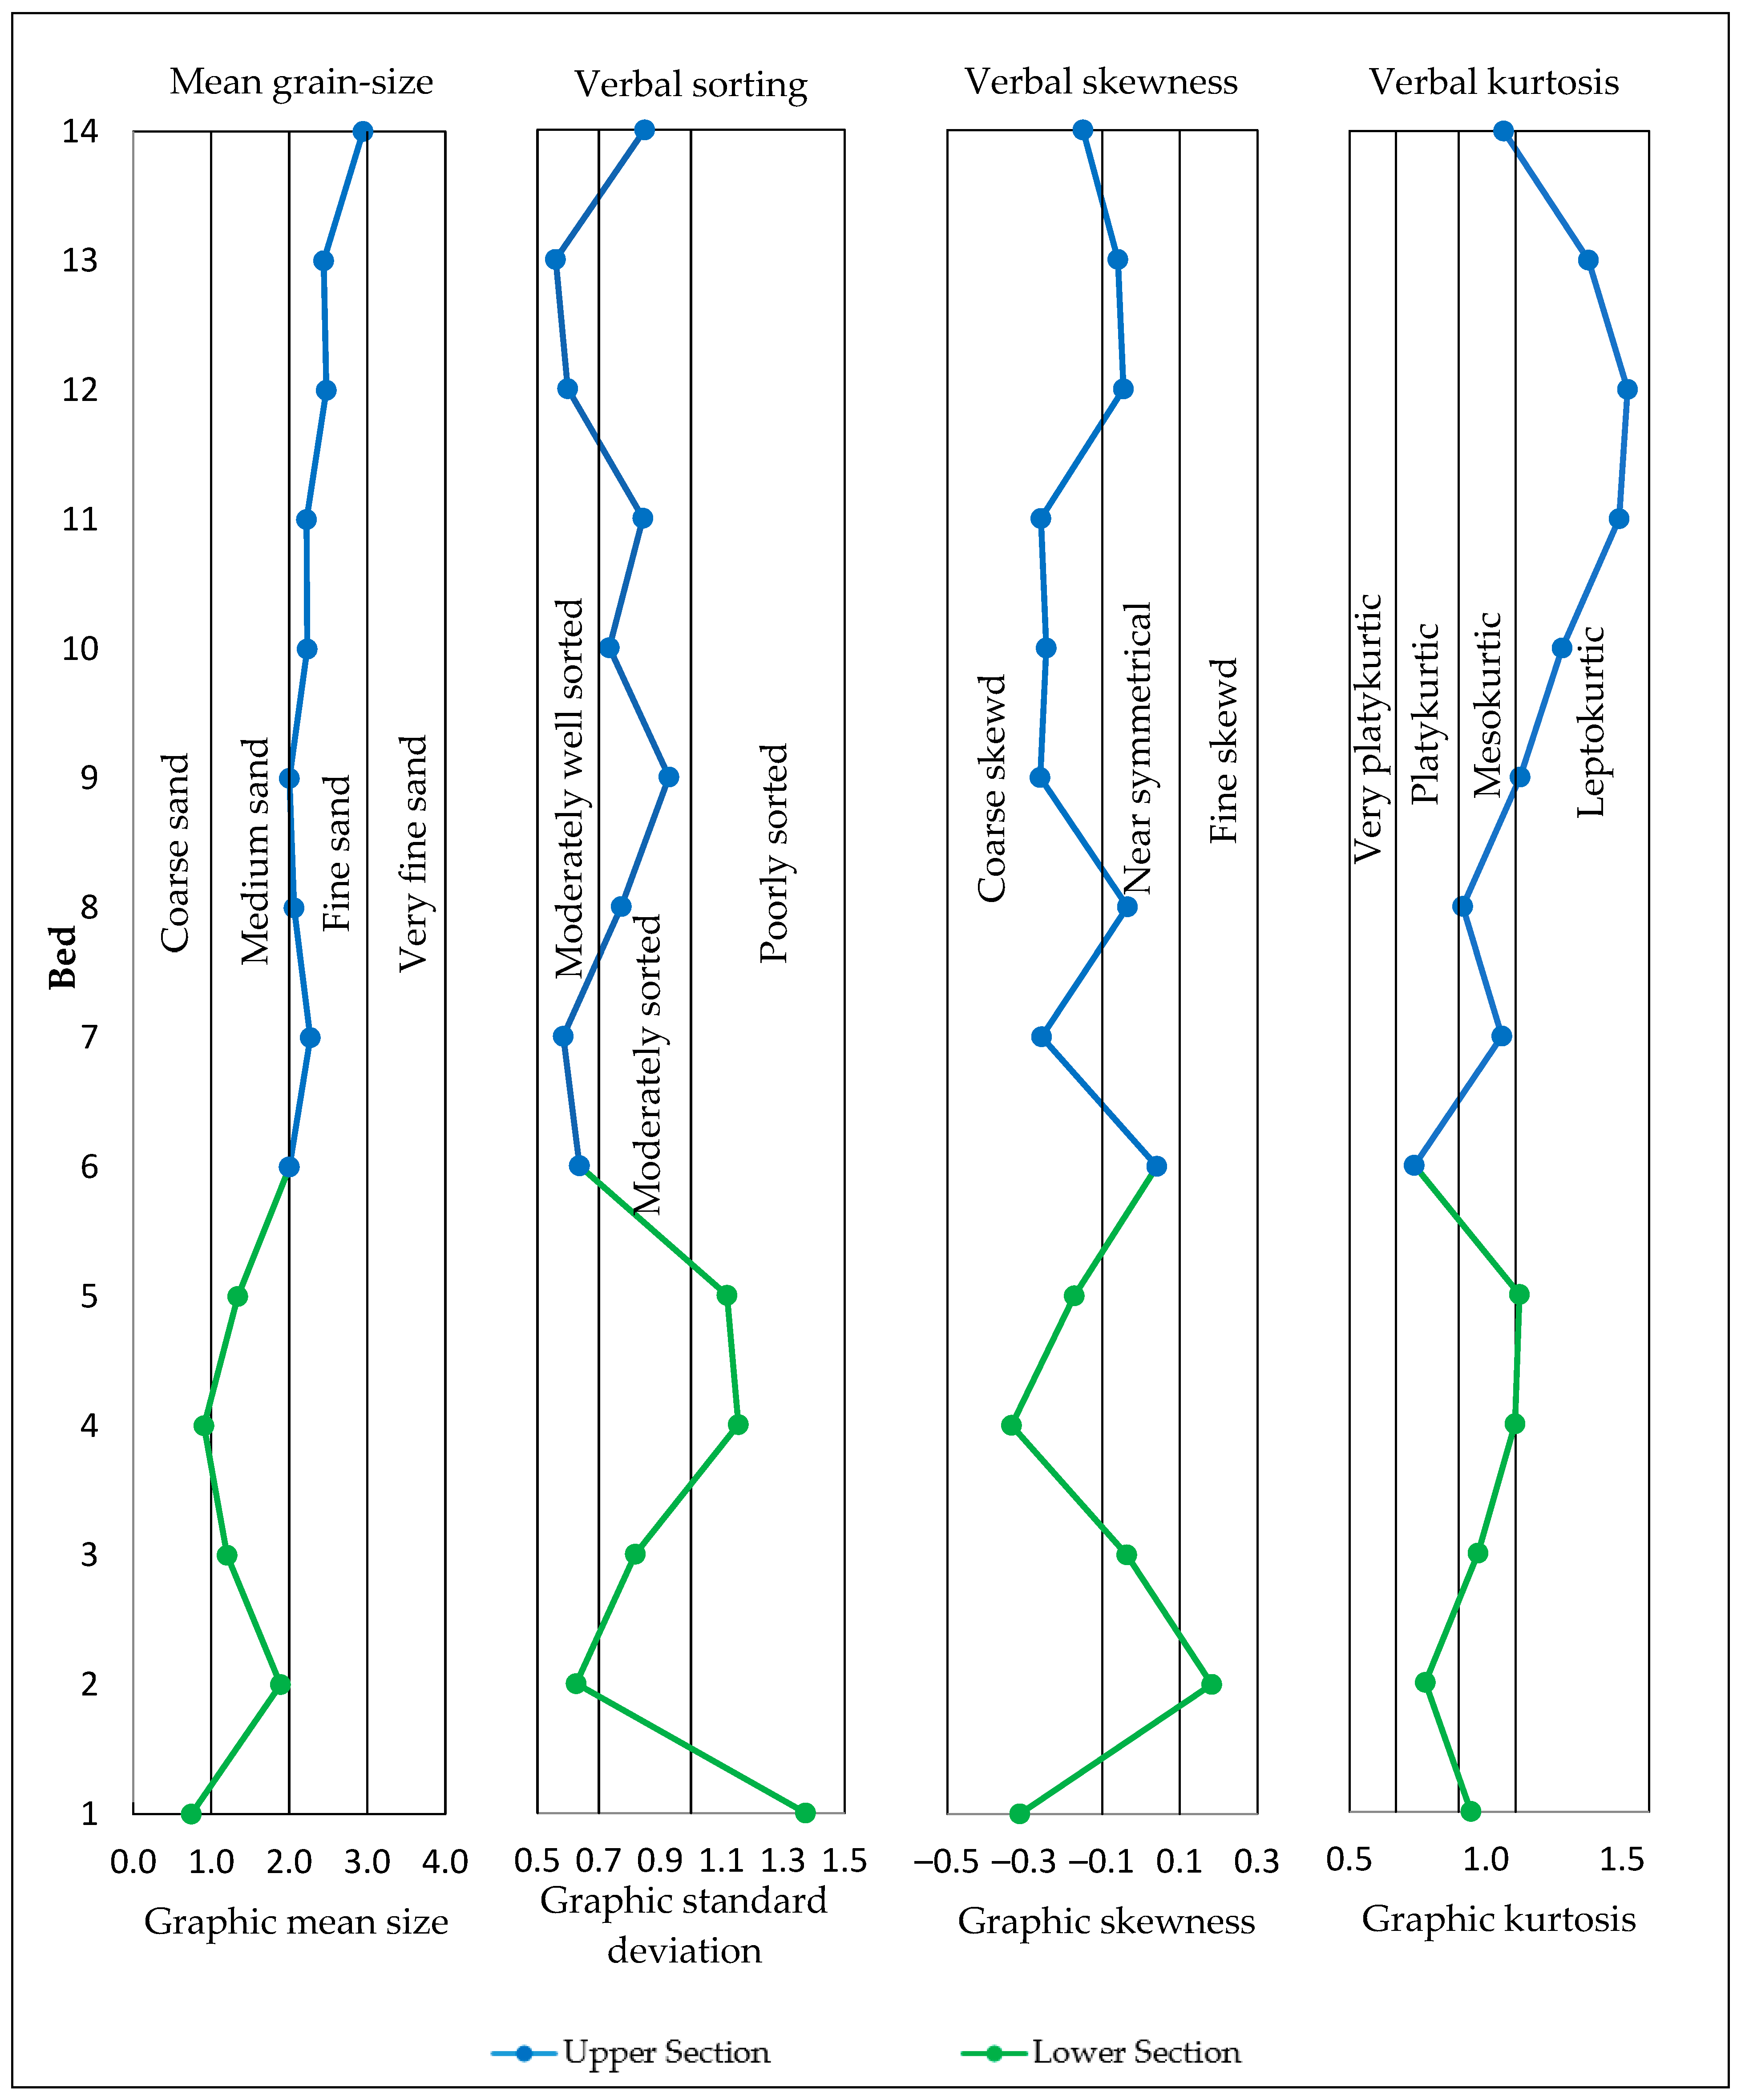
The grain-size skewness values vary from strongly coarse-skewed (as low as −0.33∅) to fine-skewed (up to 0.18∅), with an average of −0.14∅ which considered as coarse-skewed (Figure 3). Such variation indicates energy fluctuation of the depositional environments. Folk and Ward [9] stated that beach environments are subjected to frequent waves and current actions resulting in fine grain winnowing, thus leading to negative skewness. The positive skewness, however, indicates the presence of fine particles, which is typical of a fluvial environment. Yang and Shi [47] stated that positive skewness can be a result of weathering by inducing fine particles.
The grain-size distribution kurtosis presents the central distribution ratio to the tail spread. A beach environment, for instance, can be considered leptokurtic [45], while Baiyegunhi et al. [1] claimed that leptokurtic and mesokurtic distributions represent the fine-grained supply after losing the sediments’ transportation energy. The results of the grain-size analysis revealed that most of the grain distributions are mesokurtic (43%) and leptokurtic (36%) (Figure 3).

3.3. Bivariate Plots of Statistical Parameters

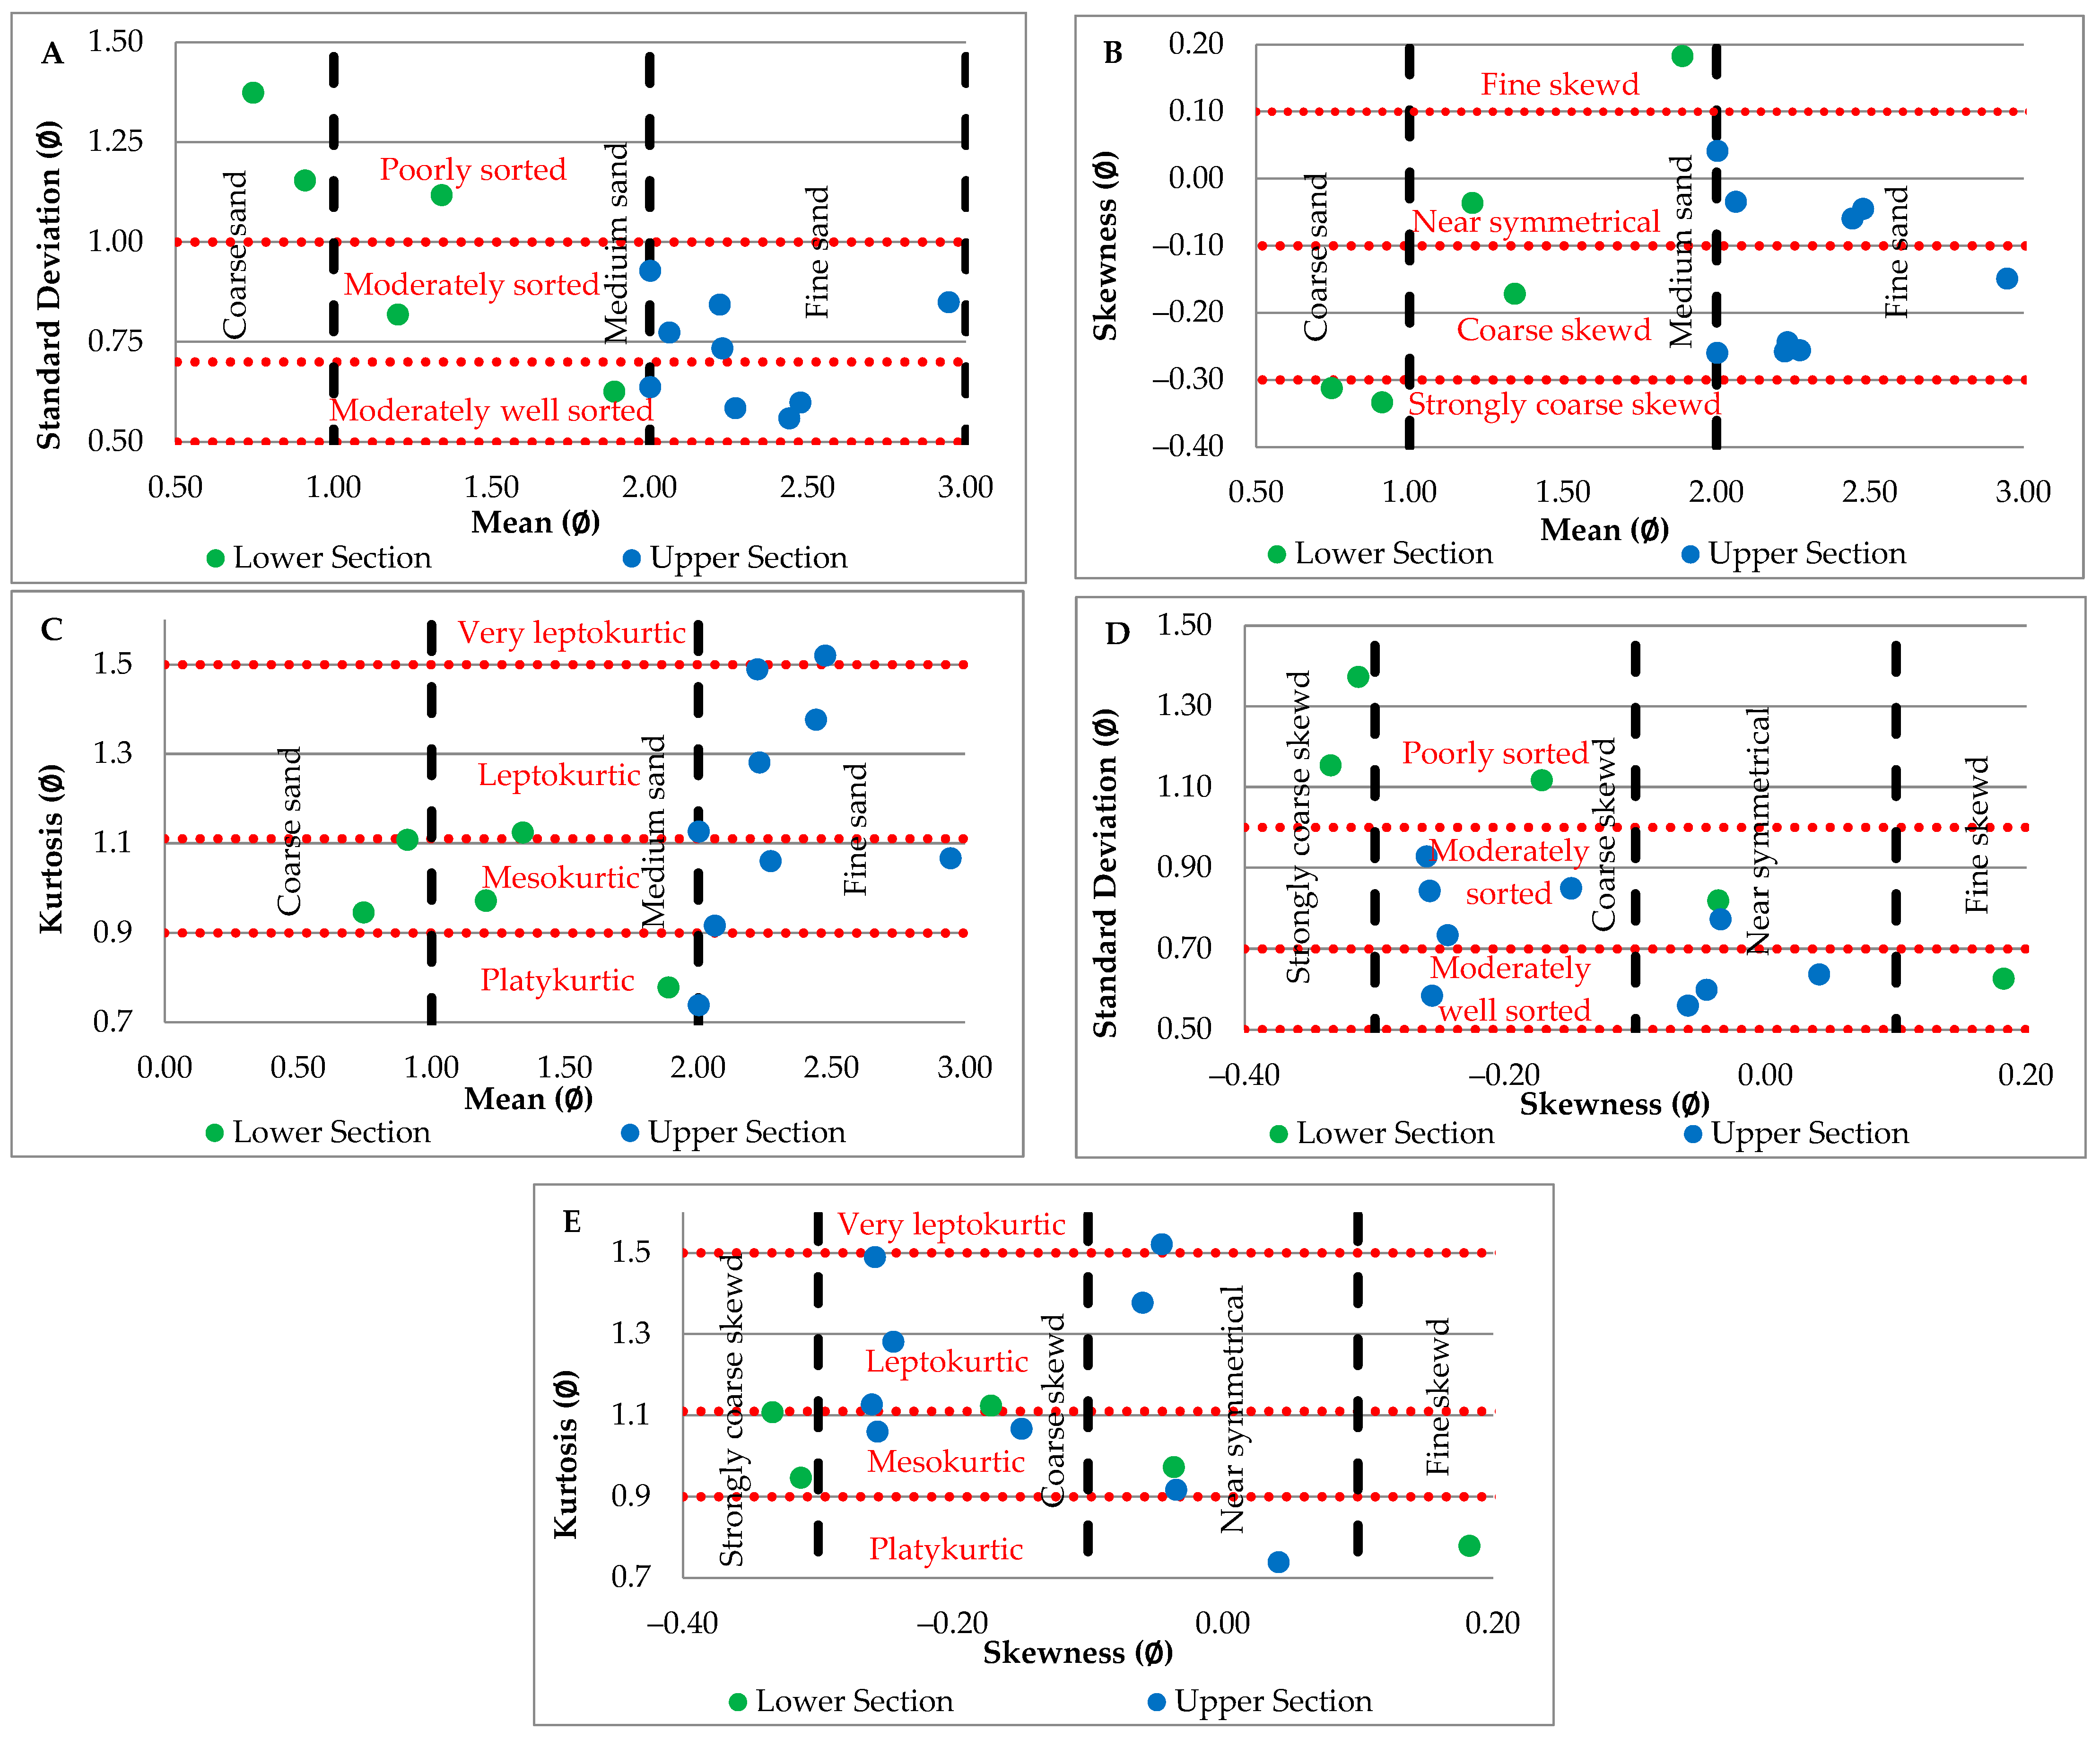
The bivariate plot of the standard deviation versus the mean grain size (Figure 4A) indicates an inverse relationship between the standard deviation and the mean. When the mean size of the particles (in ∅ unit) increases, the standard deviation (the sorting) decreases. This is an indication that the coarser-grained sands (low mean value in ∅ unit) deposited at high energy level, leading to poor sorting (high standard deviation in ∅ unit), while the fine-grained sands deposited when the transportation energy reduces. The beds of the lower section of the outcrop are coarse- to medium-grained sands (average mean size of 1.22∅) with mainly poorly sorted particles (average standard deviation of 1.02∅). The beds of the upper section, however, are only fine-grained grains (average mean size of 2.29∅) with medium- to medium-well sorting (average standard deviation of 0.72∅).
The positive skewness is an indication that grain distribution curve is leaning toward the coarse grains. The majority of the skewness distribution of the lower section beds, which are coarse- to medium-grained sands, is strongly coarse- to strongly coarse-skewed, with skewness varying from 0.18 to −0.33∅ and an average skewness of −0.13∅ (Figure 4B). On the other hand, the grain distribution skewness of the upper section beds (only fine-grained particles) is coarse-skewed to near symmetrically, with negative skewness ranging from −0.26 to −0.04∅ with an average of −0.14∅.
The kurtosis of the grain distribution curve of the coarse-grained sands (lower section) is mainly mesokurtic, meaning that the particle distribution has normal peaks (Figure 4C). Its kurtosis varies from 0.78 to 1.12∅ with an average of 0.99∅. The upper section, in contrast, has a main kurtosis of mesokurtic (normal peaks) to leptokurtic (peaked) with a kurtosis ranging from 0.74 to 1.52∅ and an average of 1.18∅.
The bivariate plot of the standard deviation versus skewness shows an inversion relationship between the standard deviation (sorting) and the skewness (Figure 4D). When the transportation medium is high in energy, the deposited sediments are coarse in size, with low skewness and poor sorting (high standard deviation). The poorly and moderately sorted beds are coarse- to strongly coarse-skewed while most of the moderately-well sorted beds are near-symmetrical to fine skewed.
The bivariate plot of the kurtosis against the skewness shows a general inverse trend (Figure 4E). Most of the very leptokurtic and leptokurtic beds are coarse- to strongly coarse-skewed, while most of the fine-skewed to near-symmetrical beds are platykurtic and mesokurtic. The coarse-grained beds, which show high skewness values, have poor grain sorting and distribution, and thus low kurtosis values.

3.4. Linear Discriminate Function (LDF)

Sahu [18] introduced the linear discriminant function (LDF) to define the energy fluctuations and fluidity during sediment depositions [18,50]. Four LDFs ( Y 1 , Y 2 , Y 3 , and Y 4 ) can be used to determine depositional processes and environments as follows: Y 1 can distinguish between beach and aeolian, Y 2 between shallow agitated water and beach, Y 3 between fluvial and shallow marine, and Y 4 between turbidity and fluvial current processes. All of the abovementioned functions are controlled by the grain-size analysis parameters, including graphic mean ( M Z ), inclusive graphic standard deviation ( σ I ), inclusive graphic skewness ( SK ), and graphic kurtosis ( K ).
The following equation ( Y 1 ) can be used to discriminate between aeolian and beach processes. The cutoff of this equation is −2.7411. The environment can be defined as aeolian if Y 1 is lower than −2.7411, while it can be defined as beach if Y 1 is higher than −2.7411.
Y 1 = 3.5688   M Z + 3.7016   σ I 2 2.0766   SK + 3.1135   K
The Y 2 equation distinguishes between beach and shallow agitated water. The cutoff in this equation is 65.365. The environment is shallow agitated water if Y 2 is more than 65.365, while it is beach if it is less than 65.365.
Y 2 = 15.6534   M Z + 65.7091   σ I 2 + 18.1071   SK + 18.5043   K
The Y 3 equation distinguishes between fluvial and shallow marine. The cutoff in this equation is −7.419. The environment is shallow marine if Y 3 is more than −7.419, while it is fluvial if it is less than −7.419.
Y 3 = 0.2852   M Z 8.7604   σ I 2 4.8932   SK + 0.0482   K
Finally, the Y 4 equation can be used to distinguish between fluvial process and turbidity current depositions. If the majority of the depositional process was controlled by turbidity currents, Y 4 is supposed to be below 9.8433, while it should be controlled by fluvial processes if Y 4 is above 9.8433.
Y 4 = 0.7215   M Z 0.40304   σ I 2 + 6.7322   SK + 5.2927   K
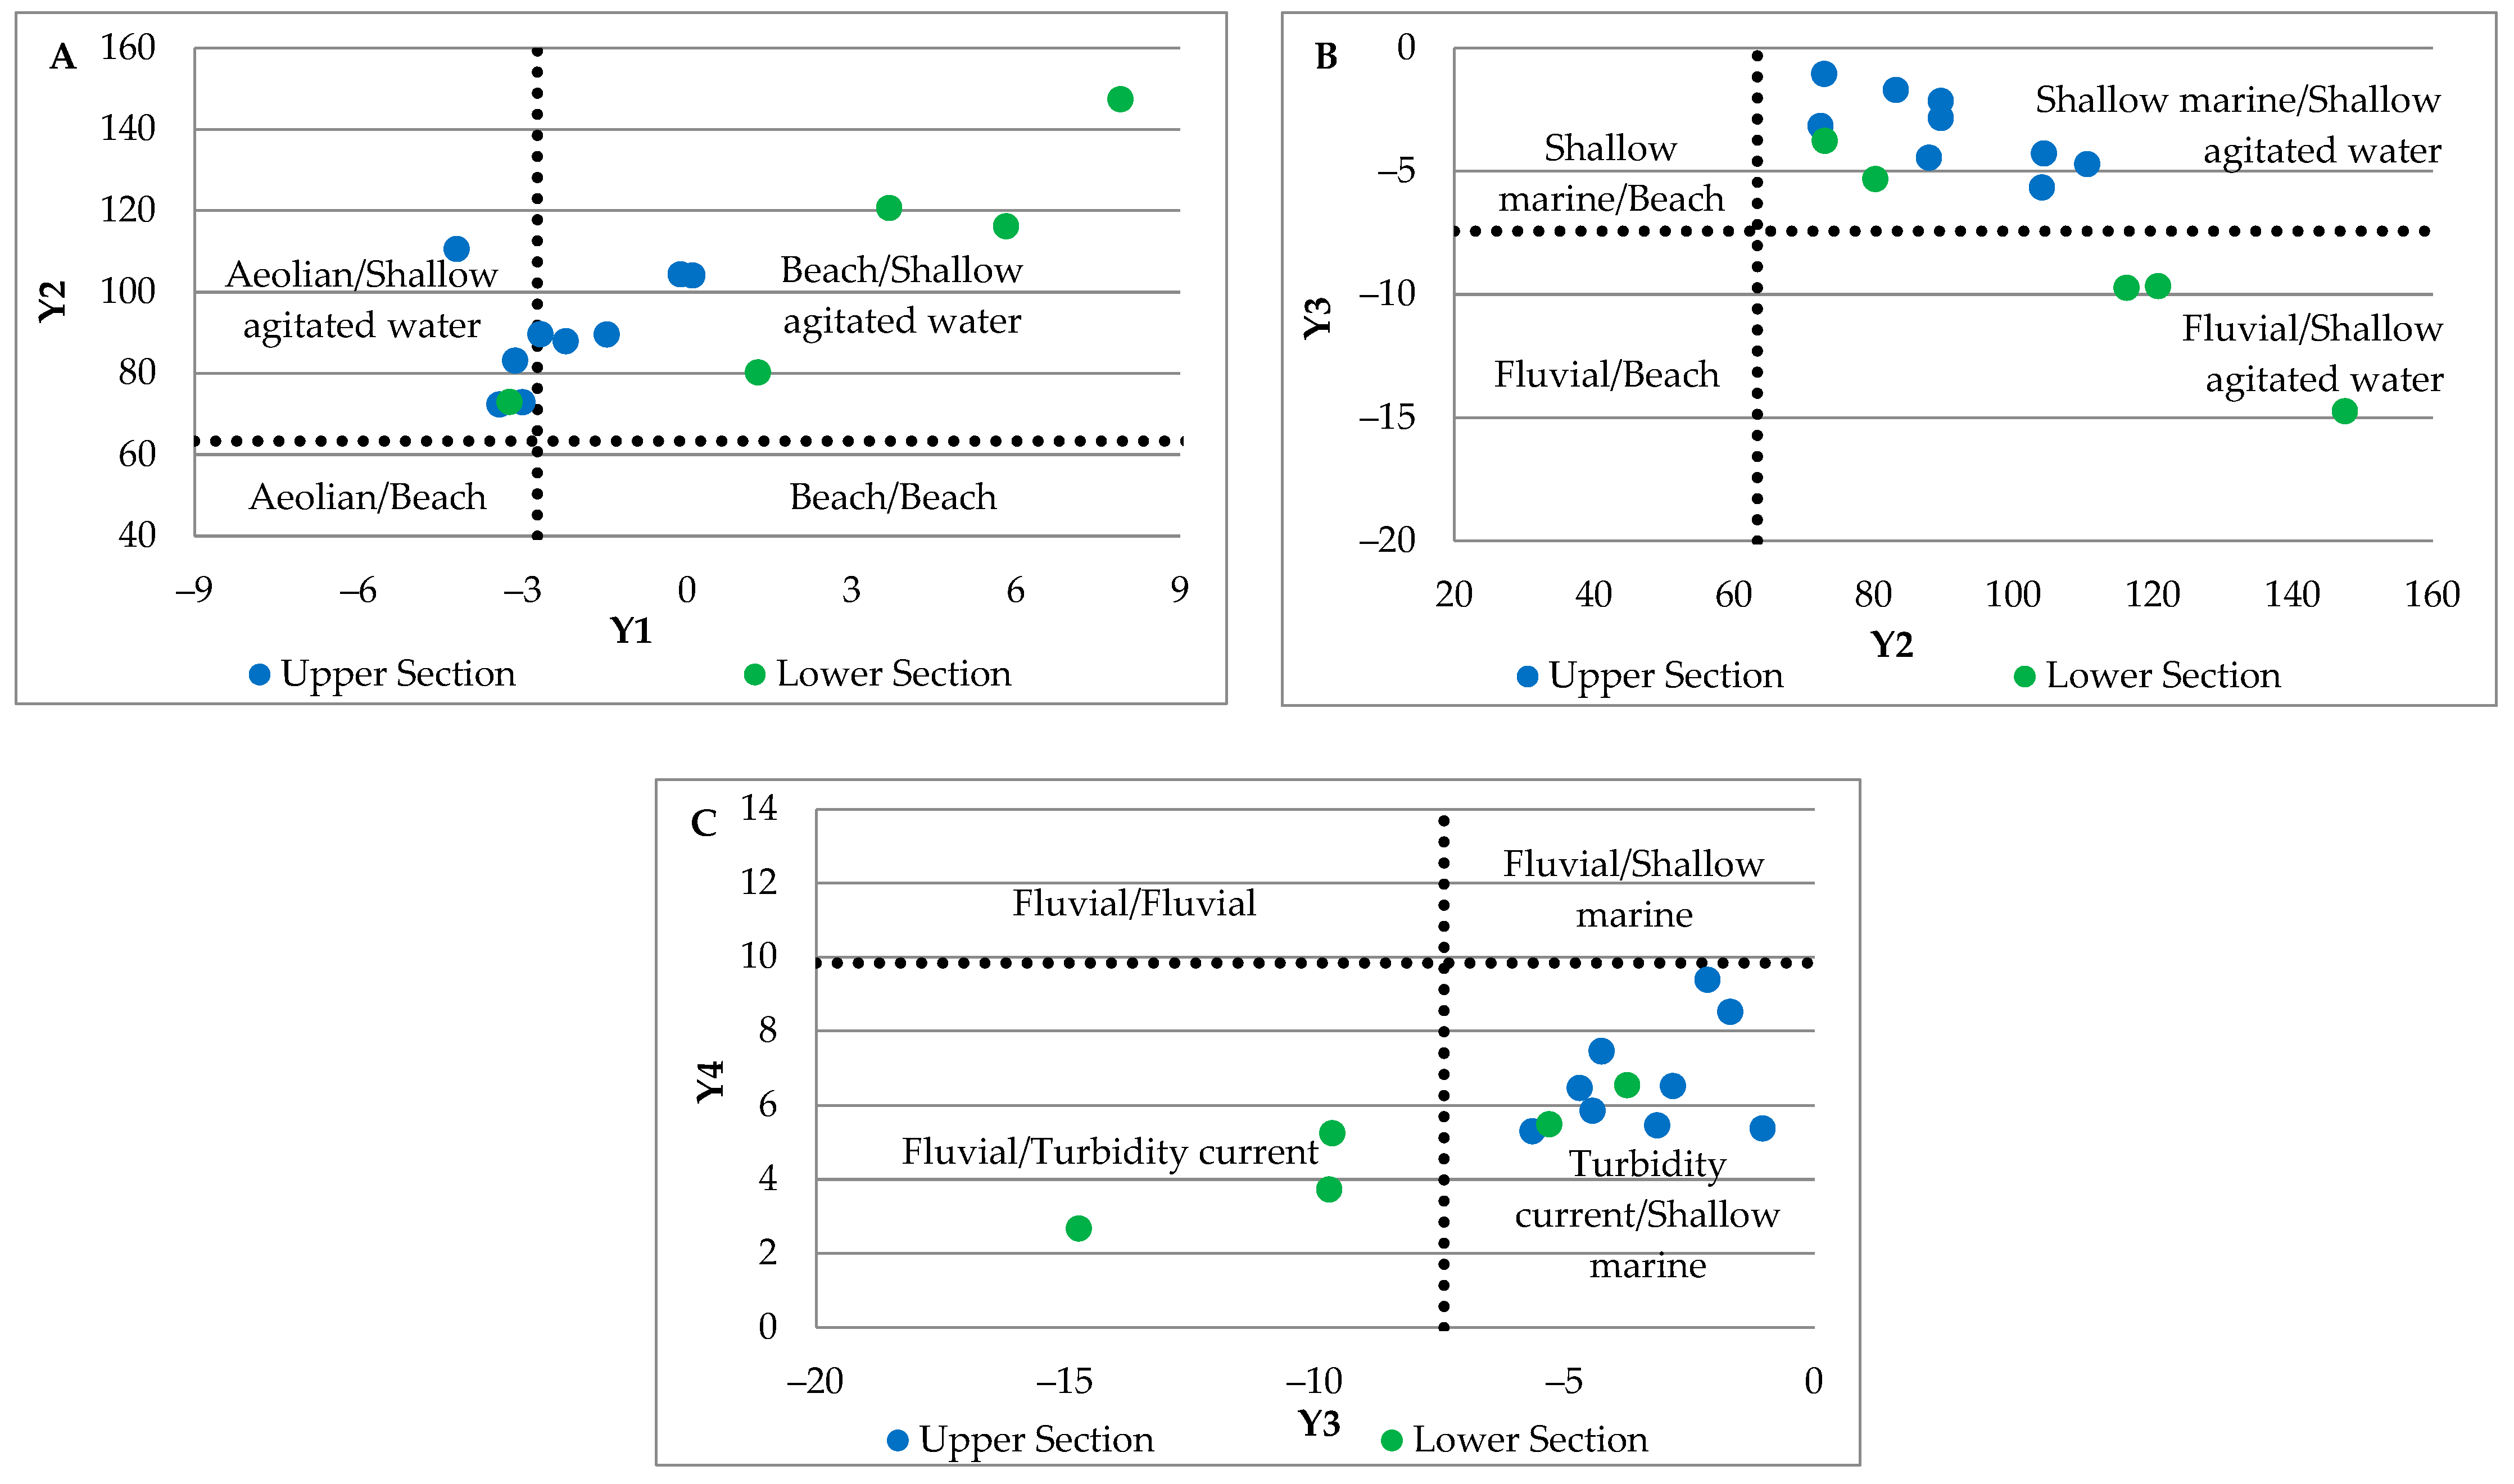
The LDFs analysis results are shown in Table 3. The values of Y 1 in Figure 5A, which discriminate between beach and aeolian process, vary from −4.21 to 7.91, indicating that the majority (64%) of the beds were deposited in aeolian environments, while five beds (36%) were deposited in beach environments. The results of Y 2 range from 72.42 to 147.47, indicating that all the beds were deposited in shallow agitated water environments (Figure 5B). The results of Y 3 and Y 4 range from −14.74 to −1.04 and from 2.68 to 9.39, respectively, meaning that all of the upper section beds were deposited in shallow marine environments under turbidity currents, while the lower section beds were deposited in both fluvial (60%) and shallow marine (40%) environments under turbidity currents (Figure 5C).

3.5. Facies Analysis

Statistical grain-size analysis may be useful in defining depositional environments. Other methods, however, are expected to be utilized to support such settings. These methods include sediment body textures, sedimentary facies associations, sedimentary structures, unit thickness and fossils. In this research, the environments were investigated through grain-size parameters with the facies’ elements.
From the bottom to the top of the studied outcrop, 14 sandstone lithofacies were identified as: grayish-brown pebbly coarse-grained, yellowish-brown, yellowish-white, pebbly coarse-grained, medium-grained, fine- to medium-grained, fine-grained, yellowish-gray fine- to medium-grained, fine- to medium-grained, yellowish-gray fine-grained, fine-grained, yellowish-gray fine-grained, fine-grained, and yellowish-gray calcareous with marls and siltstone, respectively.
Based on grain-size analysis and the common characteristics of each environment, three depositional environments were identified in the studied outcrop. Aeolian is characterized by medium- to well-sorted deposits with large-scale cross-bedding. The fluvial environment, on the other hand, is primarily composed of poorly sorted gravel and sands, and the marine environment may contain carbonate, sand, silt, and clay depending on sea depth. The depositional environments of the outcrop where defined from the base of the outcrop as: (I) fluvial where coarse sand and granule where deposited; (II) marine where medium sands were deposited at tabular (planar) cross-bedding; (III) marine where medium and coarse-grained sands were deposited at large scale planar and trough cross-bedding; (IV) fluvial where coarse-grained sand and granule were deposited; (V) aeolian where medium-grained sands were deposited at planer cross-bedding with 28° dip; (VI) marine containing fine- to medium-grained sand; (VII) marine where fine-grained sand was deposited as laminae or thin beds; (VIII) marine where fine-grained sand was deposited as thin beds; (IX) aeolian where fine- to medium-grained sands were deposited as planar cross-bedding with 29° dip; (X) aeolian containing fine-grained sands; (XI) aeolian containing thinly bedded-laminated fine-grained sands; (XII) aeolian containing bedded fine-grained sands, (XIII) aeolian where fine-grained sands were deposited as large-scale trough crossbedded with 31° dip; and (XIV) shallow main (shallow subtidal) where massive fine-grained sandstone was deposited with siltstone and marls. The transitional environment of the studied sequence ranged from continental, shoreline and marine to shallow marine (shallow subtidal). It is worth noting that Sharief et al. [30] and Shabani et al. [42] stated that the depositional environments of the Wasia Formation range from fluvial to shallow and open marine environments.

3.6. Passega Diagram (C-M Pattern)

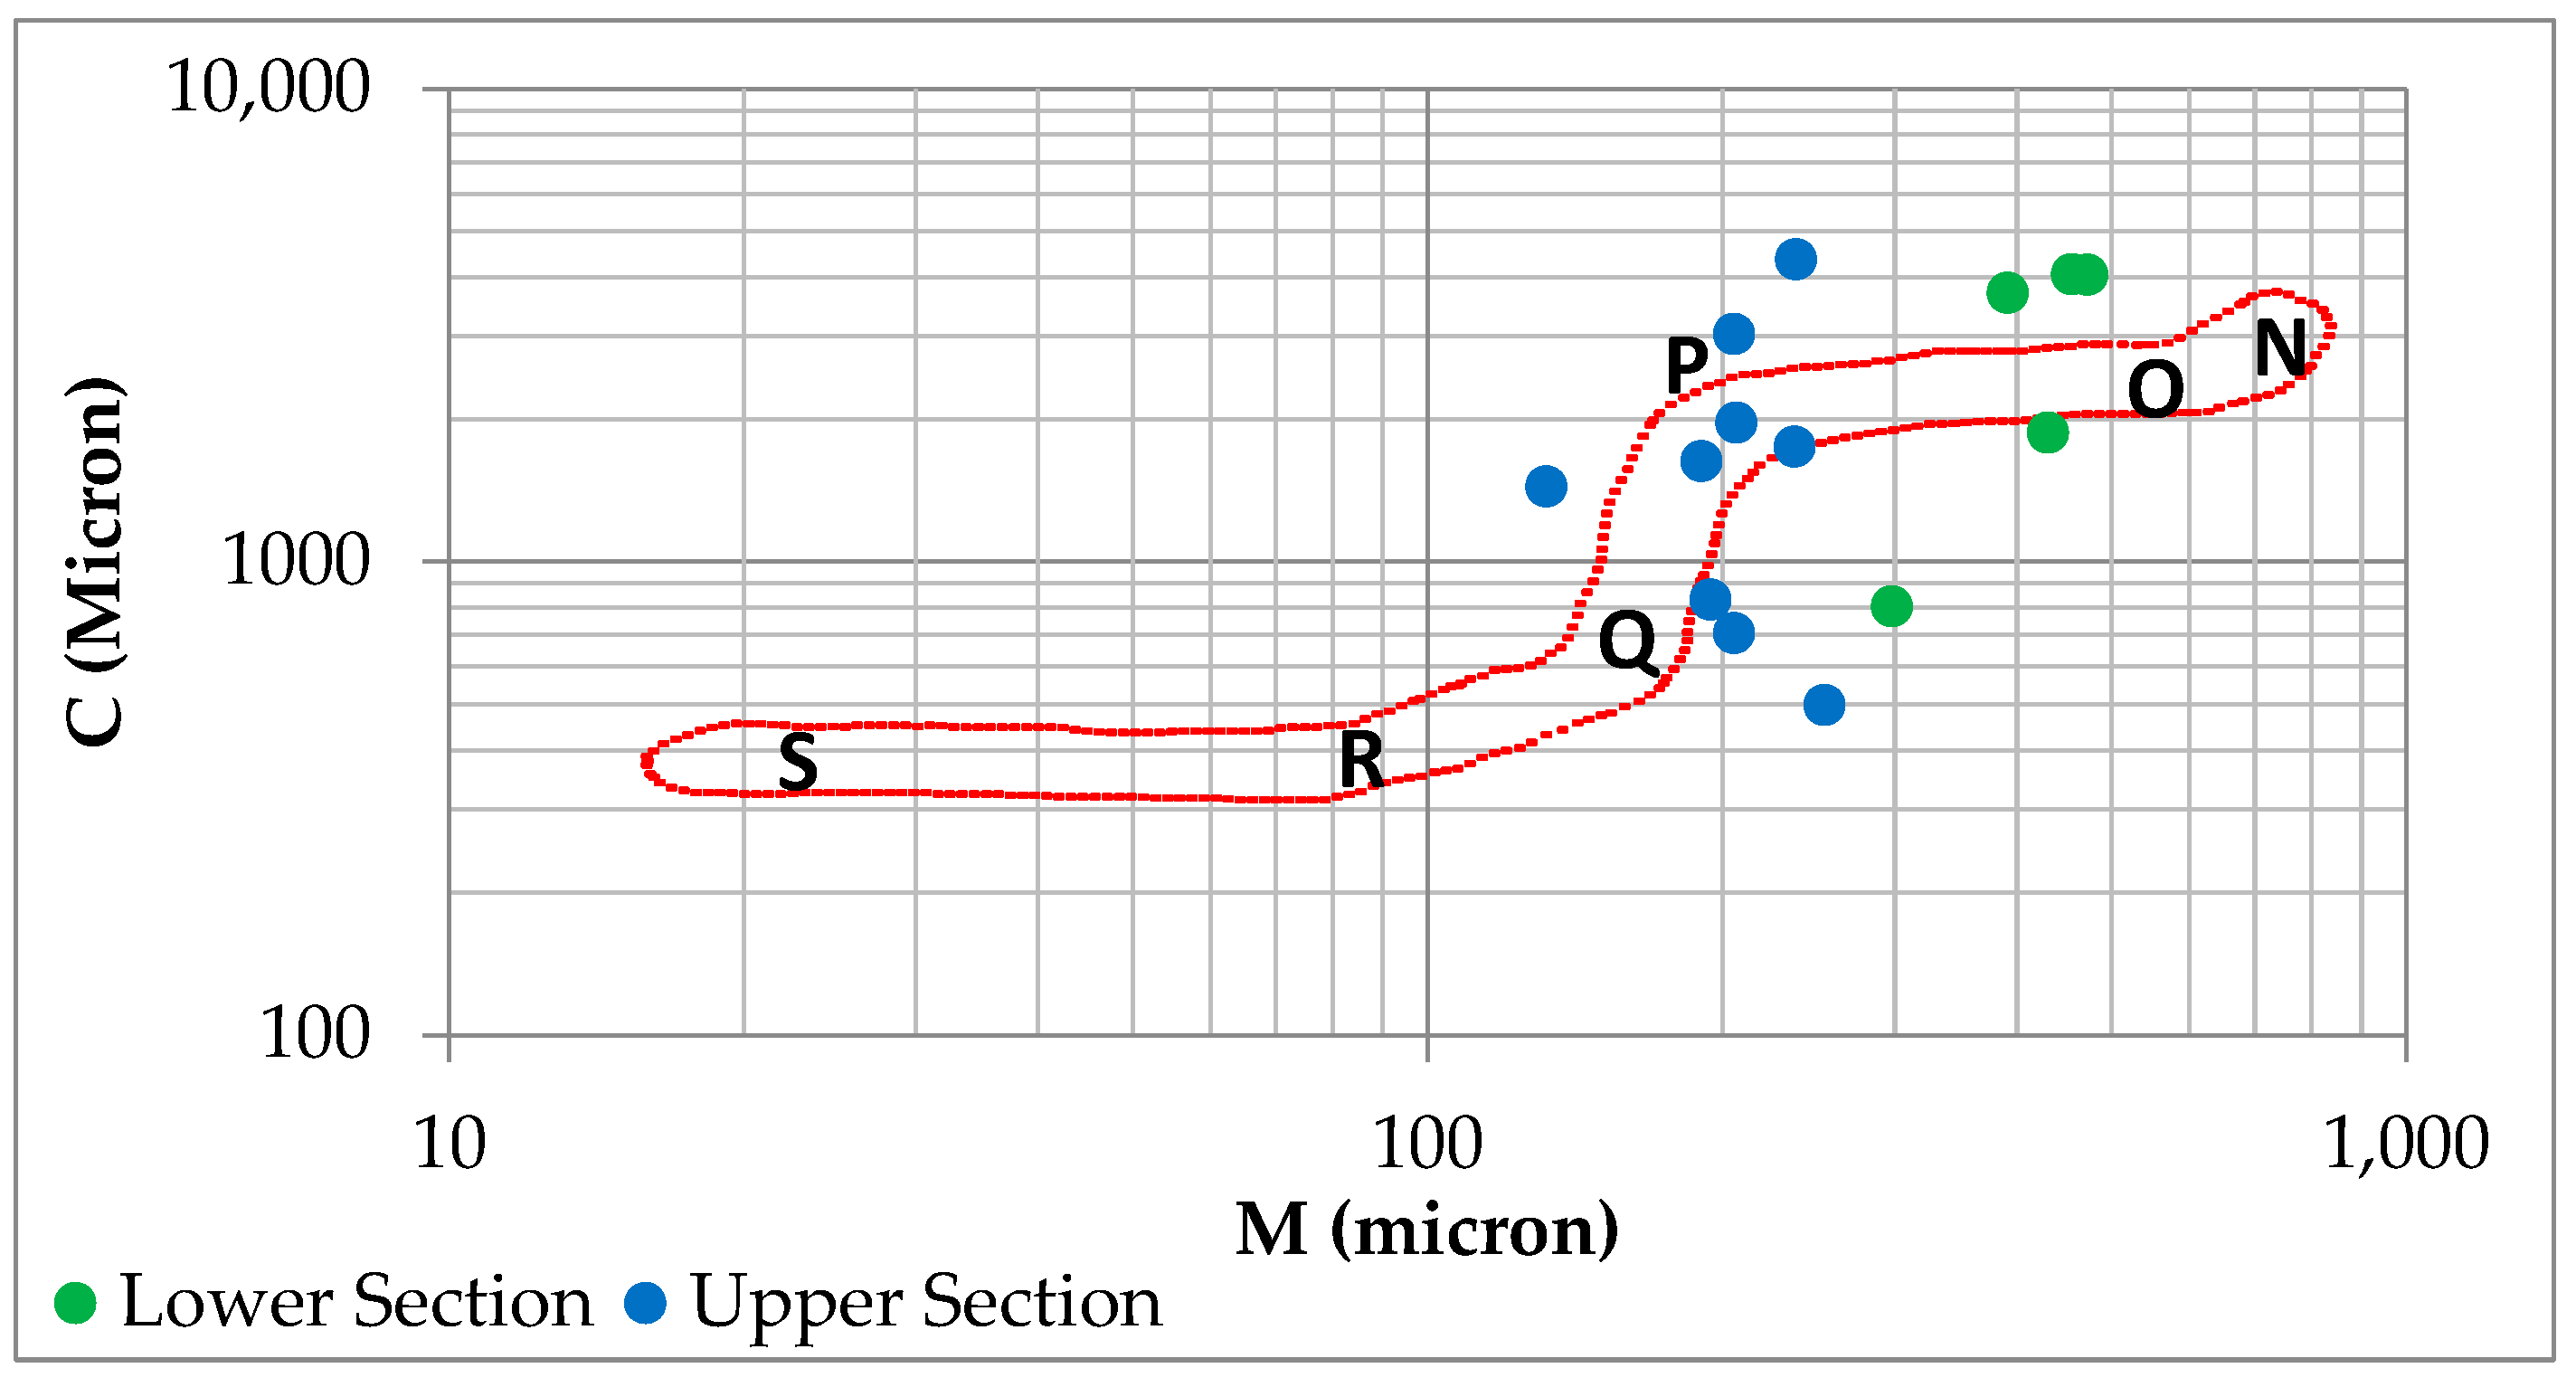
Passega [14] proposed a Passega diagram (C-M plot) to predict the predominant hydrodynamic forces prior to particles’ deposition. It is a significant geological method to reconstruct the depositional conditions of modern and ancient grains. It is a bivariate curve of coarser one-percentile (C) against the median (M) both in microns on a log-log diagram. The diagram can identify the transportation mode from rolling (N-O), rolling and bottom suspension (O-P), suspension and rolling (P-Q), graded suspension as mainly saltation (Q-R), uniform suspension (R-S) and pelagic suspension (T). Figure 6 shows that most (80%) of the lower section sediments of the outcrop were transported via rolling since they are coarser grains, while 43% of the beds were transported via rolling and bottom suspension, and 29% via suspension and rolling.

3.7. Visher Diagram

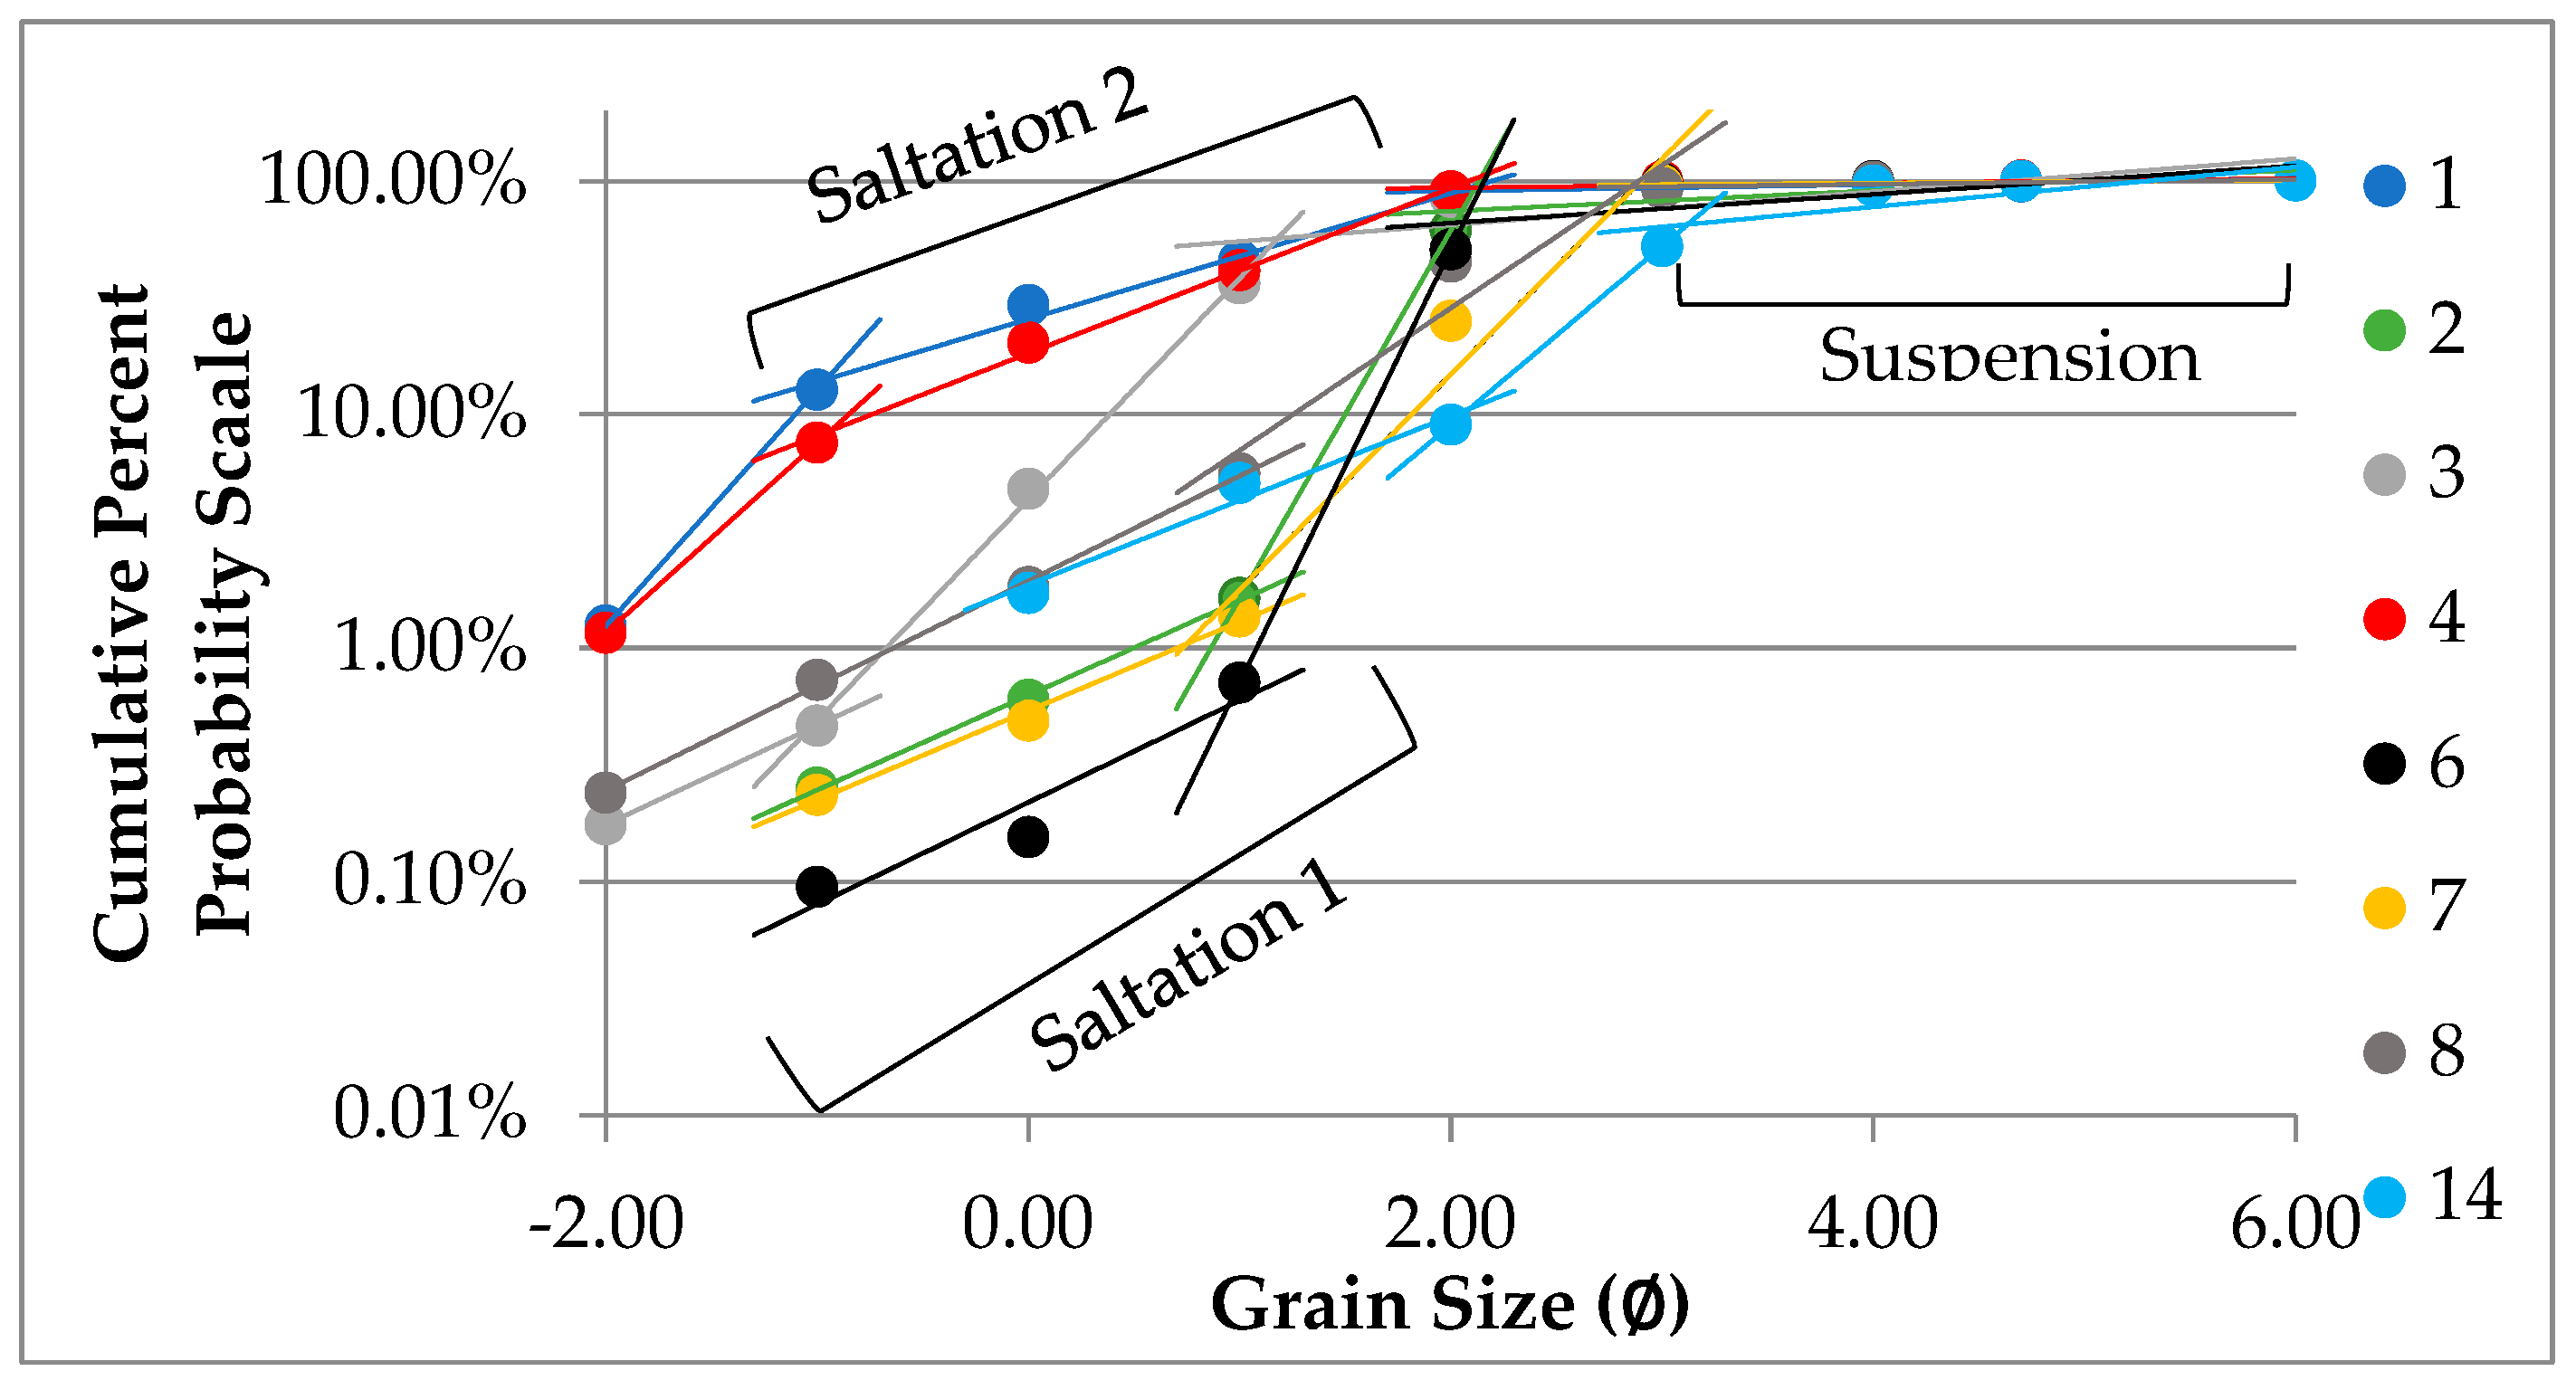
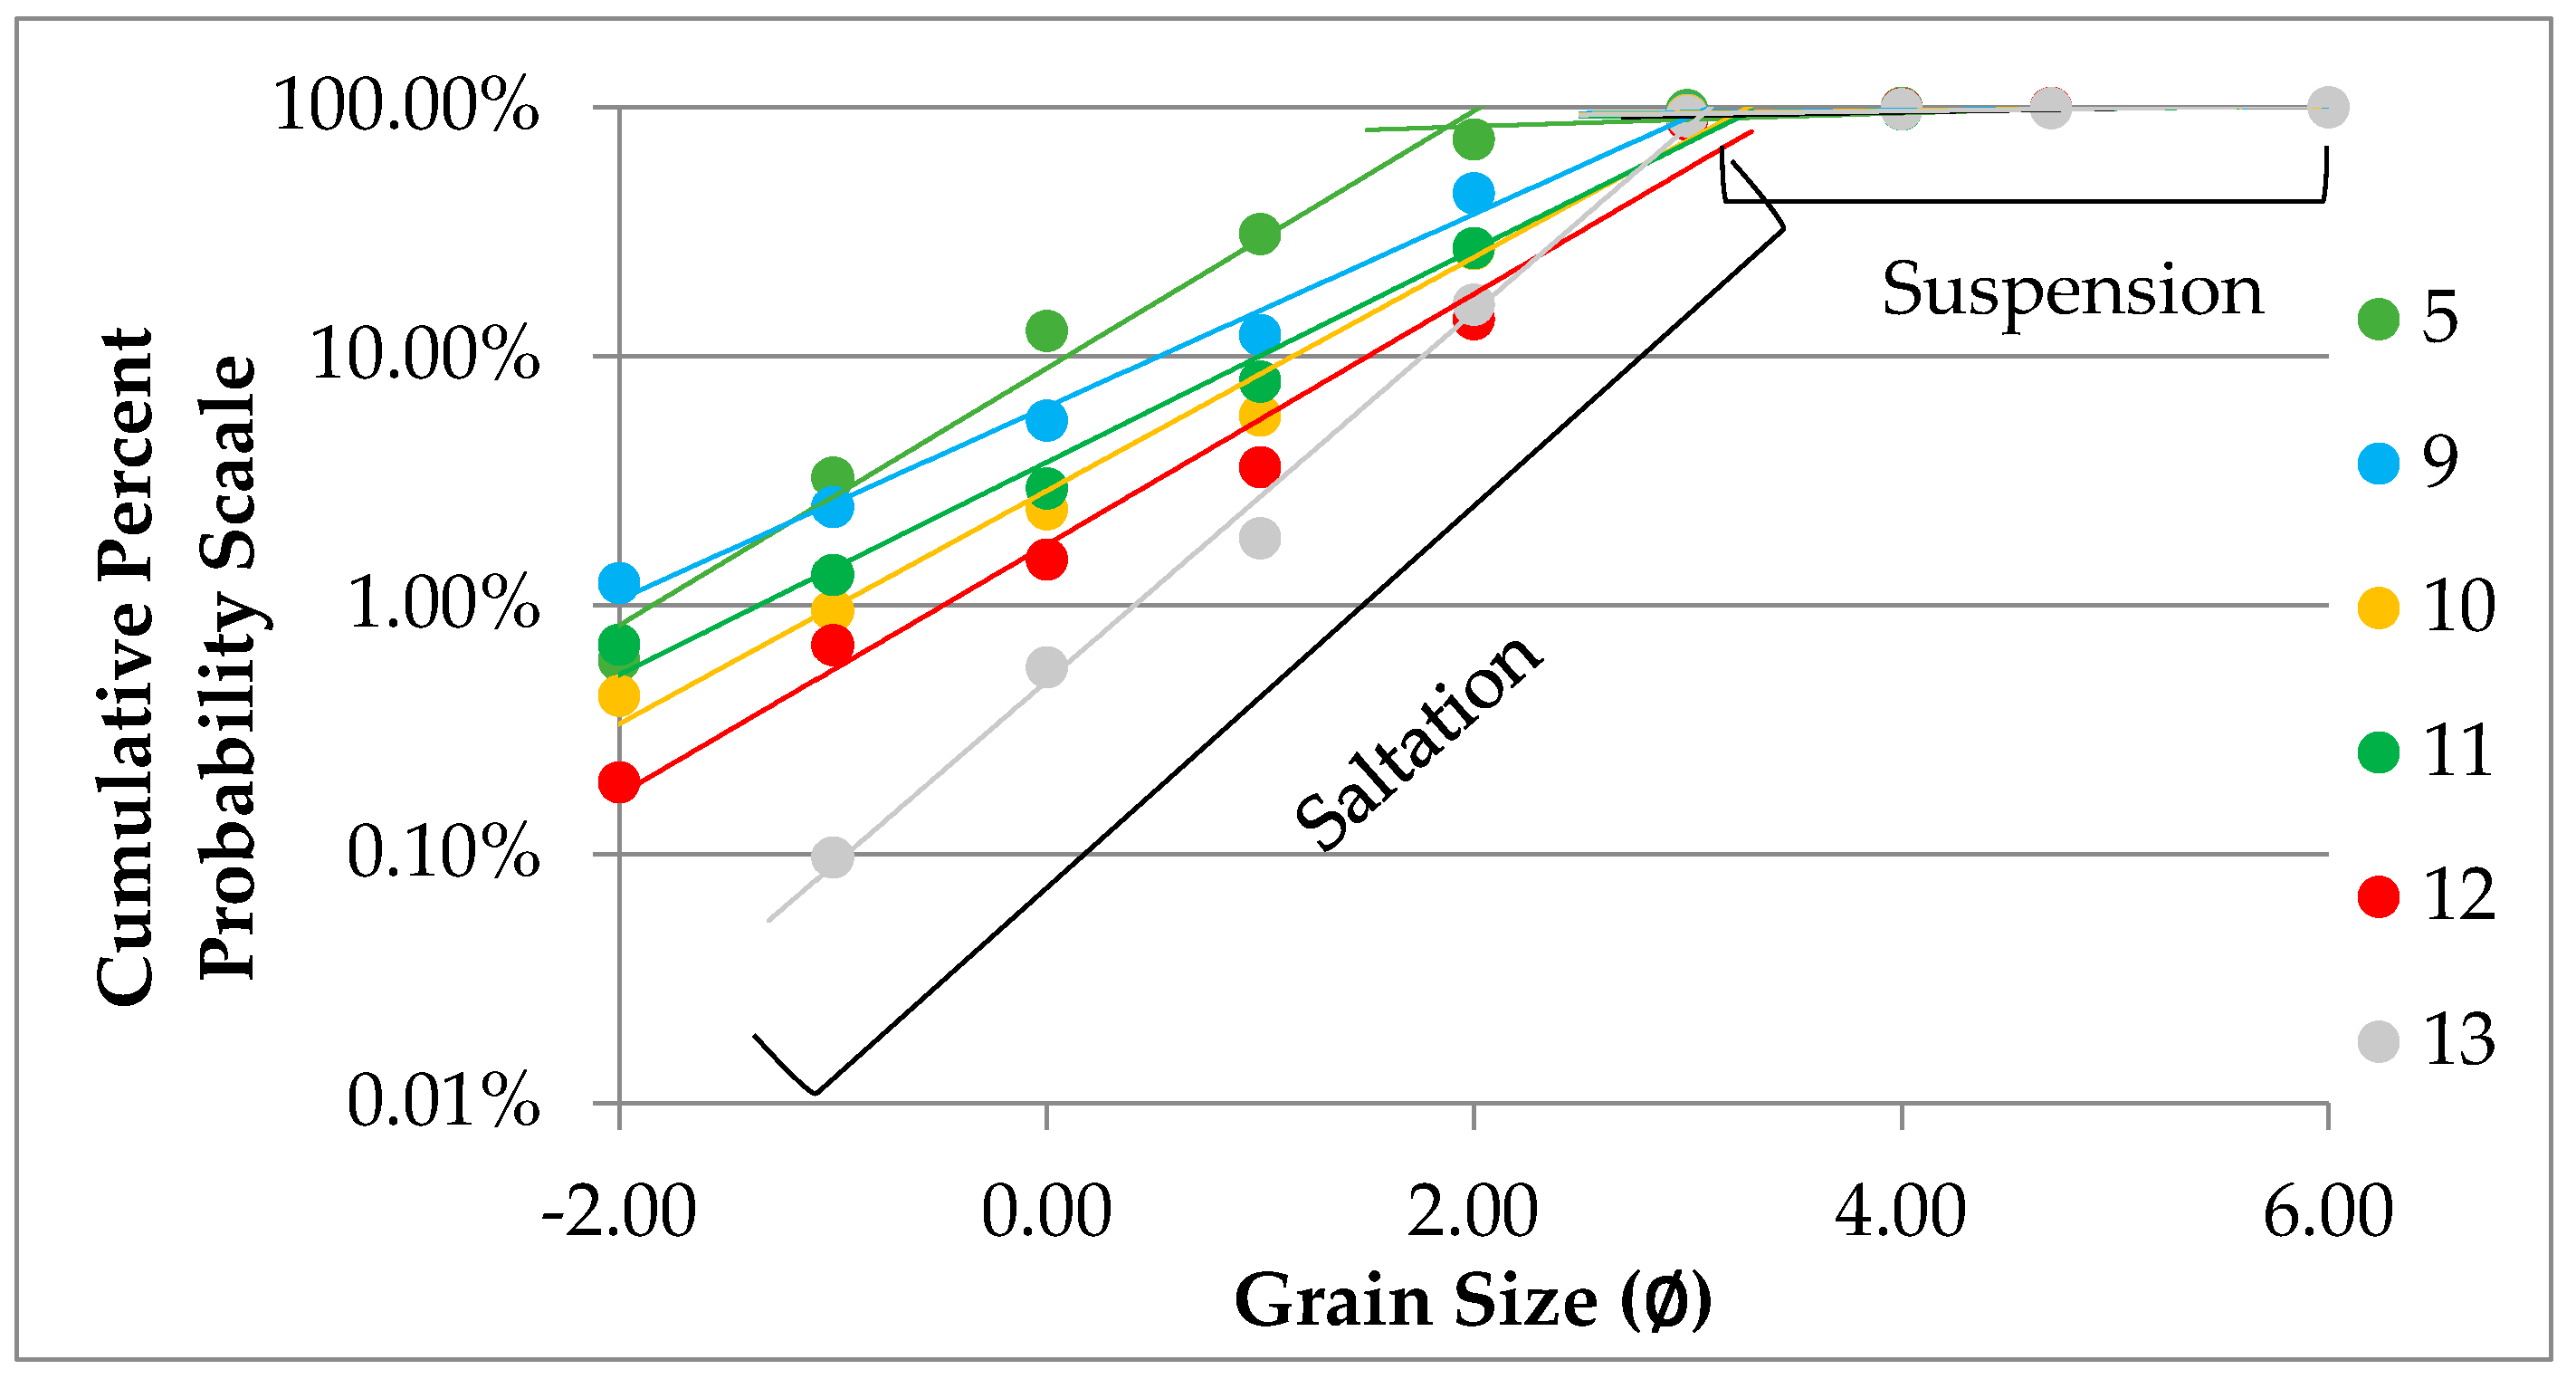
The log-probability plots are helpful to define the transportation methods and depositional processes which give insight into the depositional rate [20,23]. The results revealed that all the beds were transported via suspension and one or two saltation levels. The suspension method occurred for all grain sizes that are larger than 3∅ (grain diameter lower than 125 microns), while the saltation process happened for all the grains that are lower than 3∅ (grain diameter greater than 125 microns) (Figure 7 and Figure 8). Moreover, Figure 7 shows that most of the beds (57%) (1, 2, 3, 4, 6, 7 and 8) where transported via suspension (fine-grained sand, silt and clay) and two levels of saltation (medium-grained sands and coarser). Figure 8 indicates that six beds (43%) were transported by a suspension (fine-grained sands and finer) and a single level of saltation (medium-grained sands and coarser). It is worth noting that there is a relationship between the saltation level and the verbal kurtosis of the grain-size distribution. All the leptokurtic and very leptokurtic distributions contain only one level of saltation.
BedFacies (Thickness)Sedimentary StructureStrike and dipDepositional
environment
Photo
14Yellowish-gray calcareous sandstone (3 m)Massive sandstone Shallow marine (Shallow subtidal)Sustainability 15 07983 i001Transitional Environment: continental to shoreline to marine to shallow marine (shallow subtidal)
13Fine-grained sandstone (2.5 m)
Large-scale trough crossbeddedStrike 134° SE
Dip 31° N
AeolianSustainability 15 07983 i002
12Yellowish-gray fine-grained sandstone (2 m)Bedded, occasionally pebbles at the base of each AeolianSustainability 15 07983 i003
11Fine-grained sandstone (1.5 m)Thinly bedded—laminated AeolianSustainability 15 07983 i004
10Yellowish-gray fine-grained sandstone (3 m)Occasionally pebbles at the base of each bed AeolianSustainability 15 07983 i005
9Fine to medium-grained sandstone (1 m)Planar crossbeddingStrike 7° NW
Dip 29° E
AeolianSustainability 15 07983 i006
8Fine to medium-grained yellowish-gray sandstone (1.5 m)Thinly bedded with a gradational contact MarineSustainability 15 07983 i007
7Fine-grained sandstone (2 m)Laminated to thinly bedded with a gradational contact MarineSustainability 15 07983 i008
6Fine to medium-grained sandstone (1 m)Gradational contacts with overlying / underlying beds MarineSustainability 15 07983 i009
5Medium-grained sandstone (0.5 m)Planer crossbedding with pebbles at the baseStrike 328° NW
Dip 28° E
AeolianSustainability 15 07983 i010
4Pebbly coarse-grained sandstone (0.3 m)Sharp contacts with overlying and the underlying units FluvialSustainability 15 07983 i011
3Yellowish-white sandstone (3 m)Large-scale planer and trough crossbeddingstrike 350° NW
Dip 18° E
MarineSustainability 15 07983 i012
2Yellowish-brown sandstone (1.2 m)Tabular crossbedding with several crossbed setsCrossbed strike 25°NW, dip 6° E
Crossbed sets dip 24° E
MarineSustainability 15 07983 i013
1Grayish-brown pebbly coarse-grained sandstone (0.4 m)The base of the section FluvialSustainability 15 07983 i014

4. Conclusions

  • To investigate the Wasia Formation outcrop, the grain-size analysis was conducted on its fourteen poorly cemented and friable sandstone beds, where a fresh representative sample was collected from each bed.
  • The mean grain-size values show a large variation throughout the studied outcrop. The mean grain size of the bottom five beds is 0.75–1.89∅, while the values of the above nine beds range from 2.00 to 2.95∅. Such variation is to be expected because the grain size of the outcrop’s bottom section is larger than that of the upper section.
  • Because the depositional environments of the bottom five beds of the studied outcrop were predominantly fluvial and marine, it was expected that such beds would have poor sorting and skewness variation, which is supported by the standard deviation results (average of 1.02∅). The depositional environments of the majority of the outcrop upper beds, on the other hand, were aeolian. As a result, well-sorting and symmetrical skewness were expected. The standard deviation and skewness of these beds, however, range from medium-sorted to medium-well-sorted and from coarse skewness to near symmetrical.
  • Rolling and/or differing saltation levels were expected to transfer the sediments of the beds that were deposited in marine and fluvial environments. Aeolian sediments, on the other hand, were expected to be transported via suspension. The log probability plots and Passega diagram reveal that the majority of the sediments in the lower beds (fluvial and marine) were carried via rolling and two levels of saltation, whereas the majority of the sediments in the upper beds (mostly aeolian) were transported via suspension and one level of saltation.
  • The LDF method confirms that the studied outcrop consists of aeolian, marine, and fluvial environments.

Supplementary Materials

The following supporting information can be downloaded at: https://www.mdpi.com/article/10.3390/su15107983/s1, Figure S1: A Cretaceous and Tertiary stratigraphic column of the Arabian platform (modified after [35,36]).

Funding

This research received no external funding.

Data Availability Statement

The data will be provided upon requesting via email: [email protected].

Conflicts of Interest

The author declares no conflict of interest.

References

  1. Baiyegunhi, C.; Liu, K.; Gwavava, O. Grain size statistics and depositional pattern of the Ecca Group sandstones, Karoo Supergroup in the Eastern Cape Province, South Africa. Open Geosci. 2017, 9, 554–576. [Google Scholar] [CrossRef]
  2. Boggs, S., Jr.; Boggs, S. Petrology of Sedimentary Rocks; Cambridge University Press: Cambridge, UK, 2009. [Google Scholar]
  3. Edwards, A.C. Grain size and sorting in modern beach sands. J. Coast. Res. 2001, 17, 38–52. [Google Scholar]
  4. Kasim, S.A.; Ismail, M.S.; Ahmed, N. Grain size statistics and morphometric analysis of Kluang-Niyor, Layang-Layang, and Kampung Durian Chondong Tertiary Sediments, Onshore Peninsular Malaysia: Implications for paleoenvironment and depositional processes. J. King Saud Univ. Sci. 2023, 35, 102481. [Google Scholar]
  5. Blott, S.; Pye, K. Gradistat: A grain size distribution and statistics package for the analysis of unconsolidated sediments. Earth surface Processes and Landforms. 2001, 26, 1237–1248. [Google Scholar] [CrossRef]
  6. Bhat, M.; Chavadi, V.; Hegde, V. Morphological and textural characteristics of Kudle beach, Karnataka, central west coast of India. Geol. Soc. India 2002, 59, 125–131. [Google Scholar]
  7. Folk, R.L. A review of grain-size parameters. Sedimentology 1966, 6, 73–93. [Google Scholar] [CrossRef]
  8. Folk, R.L. Petrology of Sedimentary Rocks; Hemphill Publishing Company: Austin, TX, USA, 1980. [Google Scholar]
  9. Folk, R.L.; Ward, W.C. Brazos River bar [Texas]; A study in the significance of grain size parameters. J. Sediment. Res. 1957, 27, 3–26. [Google Scholar] [CrossRef]
  10. Friedman, G.M. Differences in size distributions of populations of particles among sands of various origins: Addendum to IAS Presidential Address. Sedimentology 1979, 26, 859–862. [Google Scholar] [CrossRef]
  11. Goswami, B.; Ghosh, D. Understanding the transportational and depositional setting of Panchet Formation, Purulia and Bankura districts of West Bengal, India—Evidence from grain size analysis. Front. Earth Sci. 2011, 5, 138–149. [Google Scholar] [CrossRef]
  12. Kovács, J. Grain-size analysis of the Neogene red clay formation in the Pannonian Basin. Int. J. Earth Sci. 2008, 97, 171–178. [Google Scholar] [CrossRef]
  13. Kulkarni, S.J.; Deshbhandari, P.G.; Jayappa, K. Seasonal variation in textural characteristics and sedimentary environments of beach sediments, Karnataka Coast, India. Aquat. Procedia 2015, 4, 117–124. [Google Scholar] [CrossRef]
  14. Passega, R. Texture as characteristic of clastic deposition. AAPG Bull. 1957, 41, 1952–1984. [Google Scholar]
  15. Passega, R. Grain size representation by CM patterns as a geologic tool. J. Sediment. Res. 1964, 34, 830–847. [Google Scholar] [CrossRef]
  16. Pettijohn, F.J.; Potter, P.E.; Siever, R. Sand and Sandstone; Springer: Berlin/Heidelberg, Germany, 2012. [Google Scholar]
  17. Rajganapathi, V.; Jitheshkumar, N.; Sundararajan, M.; Bhat, K.; Velusamy, S. Grain size analysis and characterization of sedimentary environment along Thiruchendur coast, Tamilnadu, India. Arab. J. Geosci. 2013, 6, 4717–4728. [Google Scholar] [CrossRef]
  18. Sahu, B.K. Depositional mechanisms from the size analysis of clastic sediments. J. Sediment. Res. 1964, 34, 73–83. [Google Scholar]
  19. Skaberne, D. Interpretation of depositional environment based on grain size distribution of sandstones of the Val Gardena Formation in the area between Cerkno and Smrečje, Slovenia. Geologija 1996, 39, 193–214. [Google Scholar] [CrossRef]
  20. Visher, G.S. Grain size distributions and depositional processes. J. Sediment. Res. 1969, 39, 1074–1106. [Google Scholar]
  21. Boggs, S. Principles of Sedimentology and Stratigraphy; Pearson: London, UK, 2012. [Google Scholar]
  22. Friedman, G.M. Distinction between dune, beach, and river sands from their textural characteristics. J. Sediment. Res. 1961, 31, 514–529. [Google Scholar]
  23. Sagoe, K.-M.; Visher, G.S. Population breaks in grain-size distributions of sand; a theoretical model. J. Sediment. Res. 1977, 47, 285–310. [Google Scholar]
  24. Al-Furaih, A.A. Middle Cretaceous (Cenomanian Ostracoda from the Wasia Formation of Saudi Arabia. Univ. Kans. Paleontol. Contrib. 1983, 1–6. Available online: https://kuscholarworks.ku.edu/bitstream/handle/1808/3711/paleo.paper.108.pdf;sequence=1 (accessed on 23 January 2023).
  25. Soliman, F.; Al Shamlan, A. Review on the geology of the Cretaceous sediments of the Rub’al-Khali, Saudi Arabia. Cretac. Res. 1982, 3, 187–194. [Google Scholar] [CrossRef]
  26. Alsharhan, A.; Nairn, A. A review of the ctretaceous formations in the Arabian Peninsula and gulf: Partii. mid-cretaceous (wasia group) stratigraphy and paleogeography. J. Pet. Geol. 1988, 11, 89–112. [Google Scholar] [CrossRef]
  27. Khan, A.M.; Al-Juhani, S.G.; Abdul, S. Digital viscoelastic seismic models and data sets of central Saudi Arabia in the presence of near-surface karst features. J. Seism. Explor. 2020, 29, 15–28. [Google Scholar]
  28. El-Khayal, A. Occurrence of a characteristic Wealden fern (Weichselia reticulata) in the Wasia Formation, central Saudi Arabia. Scr. Geol. 1985, 79, 75–88. [Google Scholar]
  29. Steineke, M.; Bramkamp, R.; Sander, N. Stratigraphic relations of Arabian Jurassic oil. In Habitat of Oil; Weeks, L.G., Ed.; the American Association of Petroleum Geologist: Tulsa, Oklahoma, USA, 1958; pp. 1294–1329. [Google Scholar]
  30. Sharief, F.A.; Magara, K.; Abdulla, H.M. Depositional system and reservoir potential of the Middle Cretaceous Wasia Formation in central—Eastern Arabia. Mar. Pet. Geol. 1989, 6, 303–315. [Google Scholar] [CrossRef]
  31. Powers, R.; Ramirez, L.; Redmond, C.; Elberg, E. Geology of the Arabian Peninsula; U.S. Geological Survey: Washington, DC, USA, 1966.
  32. Entsminger, L.D. Sedimentary Response to Tectonic and Eustatic Changes: An Example from the Mid-Cretaceous Wasia Formation, Saudi Arabia. In Proceedings of the Middle East Technical Conference and Exhibition, Manama, Bahrain, 9–12 March 1981. [Google Scholar]
  33. Alfaifi, H.J.; Abdelfatah, M.S.; Abdelrahman, K.; Zaidi, F.K.; Ibrahim, E.; Alarifi, N.S. Groundwater management scenarios for the Biyadh-Wasia aquifer systems in the eastern part of Riyadh region, Saudi Arabia. J. Geol. Soc. India 2017, 89, 669–674. [Google Scholar] [CrossRef]
  34. Herlambang, A.; John, C.M. Fluid flow evolution revealed by carbonate clumped isotope thermometry along the fractures in a complex salt dome setting: Study case (Jebel Madar, Oman). Mar. Pet. Geol. 2023, 152, 106220. [Google Scholar] [CrossRef]
  35. Sharland, P.; Archer, R.; Casey, D.; Davies, R.; Hall, S.; Heward, A.; Horbury, A.; Simmons, M. Sequence stratigraphy of the Arabian Plate. GeoArabia 2001, 2, 1. [Google Scholar]
  36. Awadh, S.M.; Al-Mimar, H.; Yaseen, Z.M. Groundwater availability and water demand sustainability over the upper mega aquifers of Arabian Peninsula and west region of Iraq. Environ. Dev. Sustain. 2021, 23, 1–21. [Google Scholar] [CrossRef]
  37. Nairn, A.; Alsharhan, A. Sedimentary Basins and Petroleum Geology of the Middle East; Elsevier: Amsterdam, The Netherlands, 1997. [Google Scholar]
  38. Davies, R.B.; Casey, D.M.; Horbury, A.D.; Sharland, P.R.; Simmons, M.D. Early to mid-Cretaceous mixed carbonate-clastic shelfal systems: Examples, issues and models from the Arabian Plate. GeoArabia 2002, 7, 541–598. [Google Scholar] [CrossRef]
  39. AlGeer, R. Origin of the Mid Cretaceous Heavy Oils from the Safaniya Sandstone Reservoir (Wasia Formation), Saudi Arabia. Master’s Thesis, University of Calgary, Calgary, AL, Canada, 2014. [Google Scholar]
  40. Newell, K.; Hennington, R. Potential Petroleum Source Rock Deposition in the Middle Cretaceous Wasia Formation, Rub’Al Khali, Saudi Arabia. In Proceedings of the Middle East Oil Technical Conference and Exhibition, Manama, Bahrain, 14–17 March 1983. [Google Scholar]
  41. Hussain, M.; El Hassan, W.M.; Abdulraheem, A. Controls of grain-size distribution on geomechanical properties of reservoir rock—A case study: Cretaceous Khafji Member, Zuluf Field, offshore Arabian Gulf. Mar. Pet. Geol. 2006, 23, 703–713. [Google Scholar] [CrossRef]
  42. Shabani, F.; Amini, A.; Tavakoli, V.; Honarmand, J.; Gong, C. 3D forward stratigraphic modeling of the Albian succession in a part of the northeastern margin of the Arabian Plate and its implications for exploration of subtle traps. Mar. Pet. Geol. 2022, 145, 105880. [Google Scholar] [CrossRef]
  43. Krumbein, W.; Monk, G. Permeability as a function of the size parameters of unconsolidated sand. Trans. AIME 1943, 151, 153–163. [Google Scholar] [CrossRef]
  44. Ajaegwu, N.E.; Okoro, A.U.; Obiadi, I.I.; Anakwuba, E.K.; Onuba, L.N. Facies Associations and Successions in Amaseri Sandstones, Southern Benue Trough, Nigeria: Implications for Interpretation of Depositional Environments and Palaeogeography. Facies 2015, 5, 25–41. [Google Scholar]
  45. Friedman, G.M. Dynamic processes and statistical parameters compared for size frequency distribution of beach and river sands. J. Sediment. Res. 1967, 37, 327–354. [Google Scholar]
  46. Tijani, M.N.; Nton, M.E. Hydraulic, textural and geochemical characteristics of the Ajali Formation, Anambra Basin, Nigeria: Implication for groundwater quality. Environ. Geol. 2009, 56, 935–951. [Google Scholar] [CrossRef]
  47. Yang, H.; Shi, C. Sediment grain-size characteristics and its sources of ten wind-water coupled erosion tributaries (the Ten Kongduis) in the Upper Yellow River. Water 2019, 11, 115. [Google Scholar] [CrossRef]
  48. Tijani, M.N.; Nton, M.E.; Kitagawa, R. Textural and geochemical characteristics of the Ajali Sandstone, Anambra Basin, SE Nigeria: Implication for its provenance. Comptes Rendus Geosci. 2010, 342, 136–150. [Google Scholar] [CrossRef]
  49. Moiola, R.; Weiser, D. Textural parameters; an evaluation. J. Sediment. Res. 1968, 38, 45–53. [Google Scholar]
  50. Baiyegunhi, T.L.; Liu, K.; Gwavava, O.; Baiyegunhi, C. Textural characteristics, mode of transportation and depositional environment of the Cretaceous sandstone in the Bredasdorp Basin, off the south coast of South Africa: Evidence from grain size analysis. Open Geosci. 2020, 12, 1512–1532. [Google Scholar] [CrossRef]
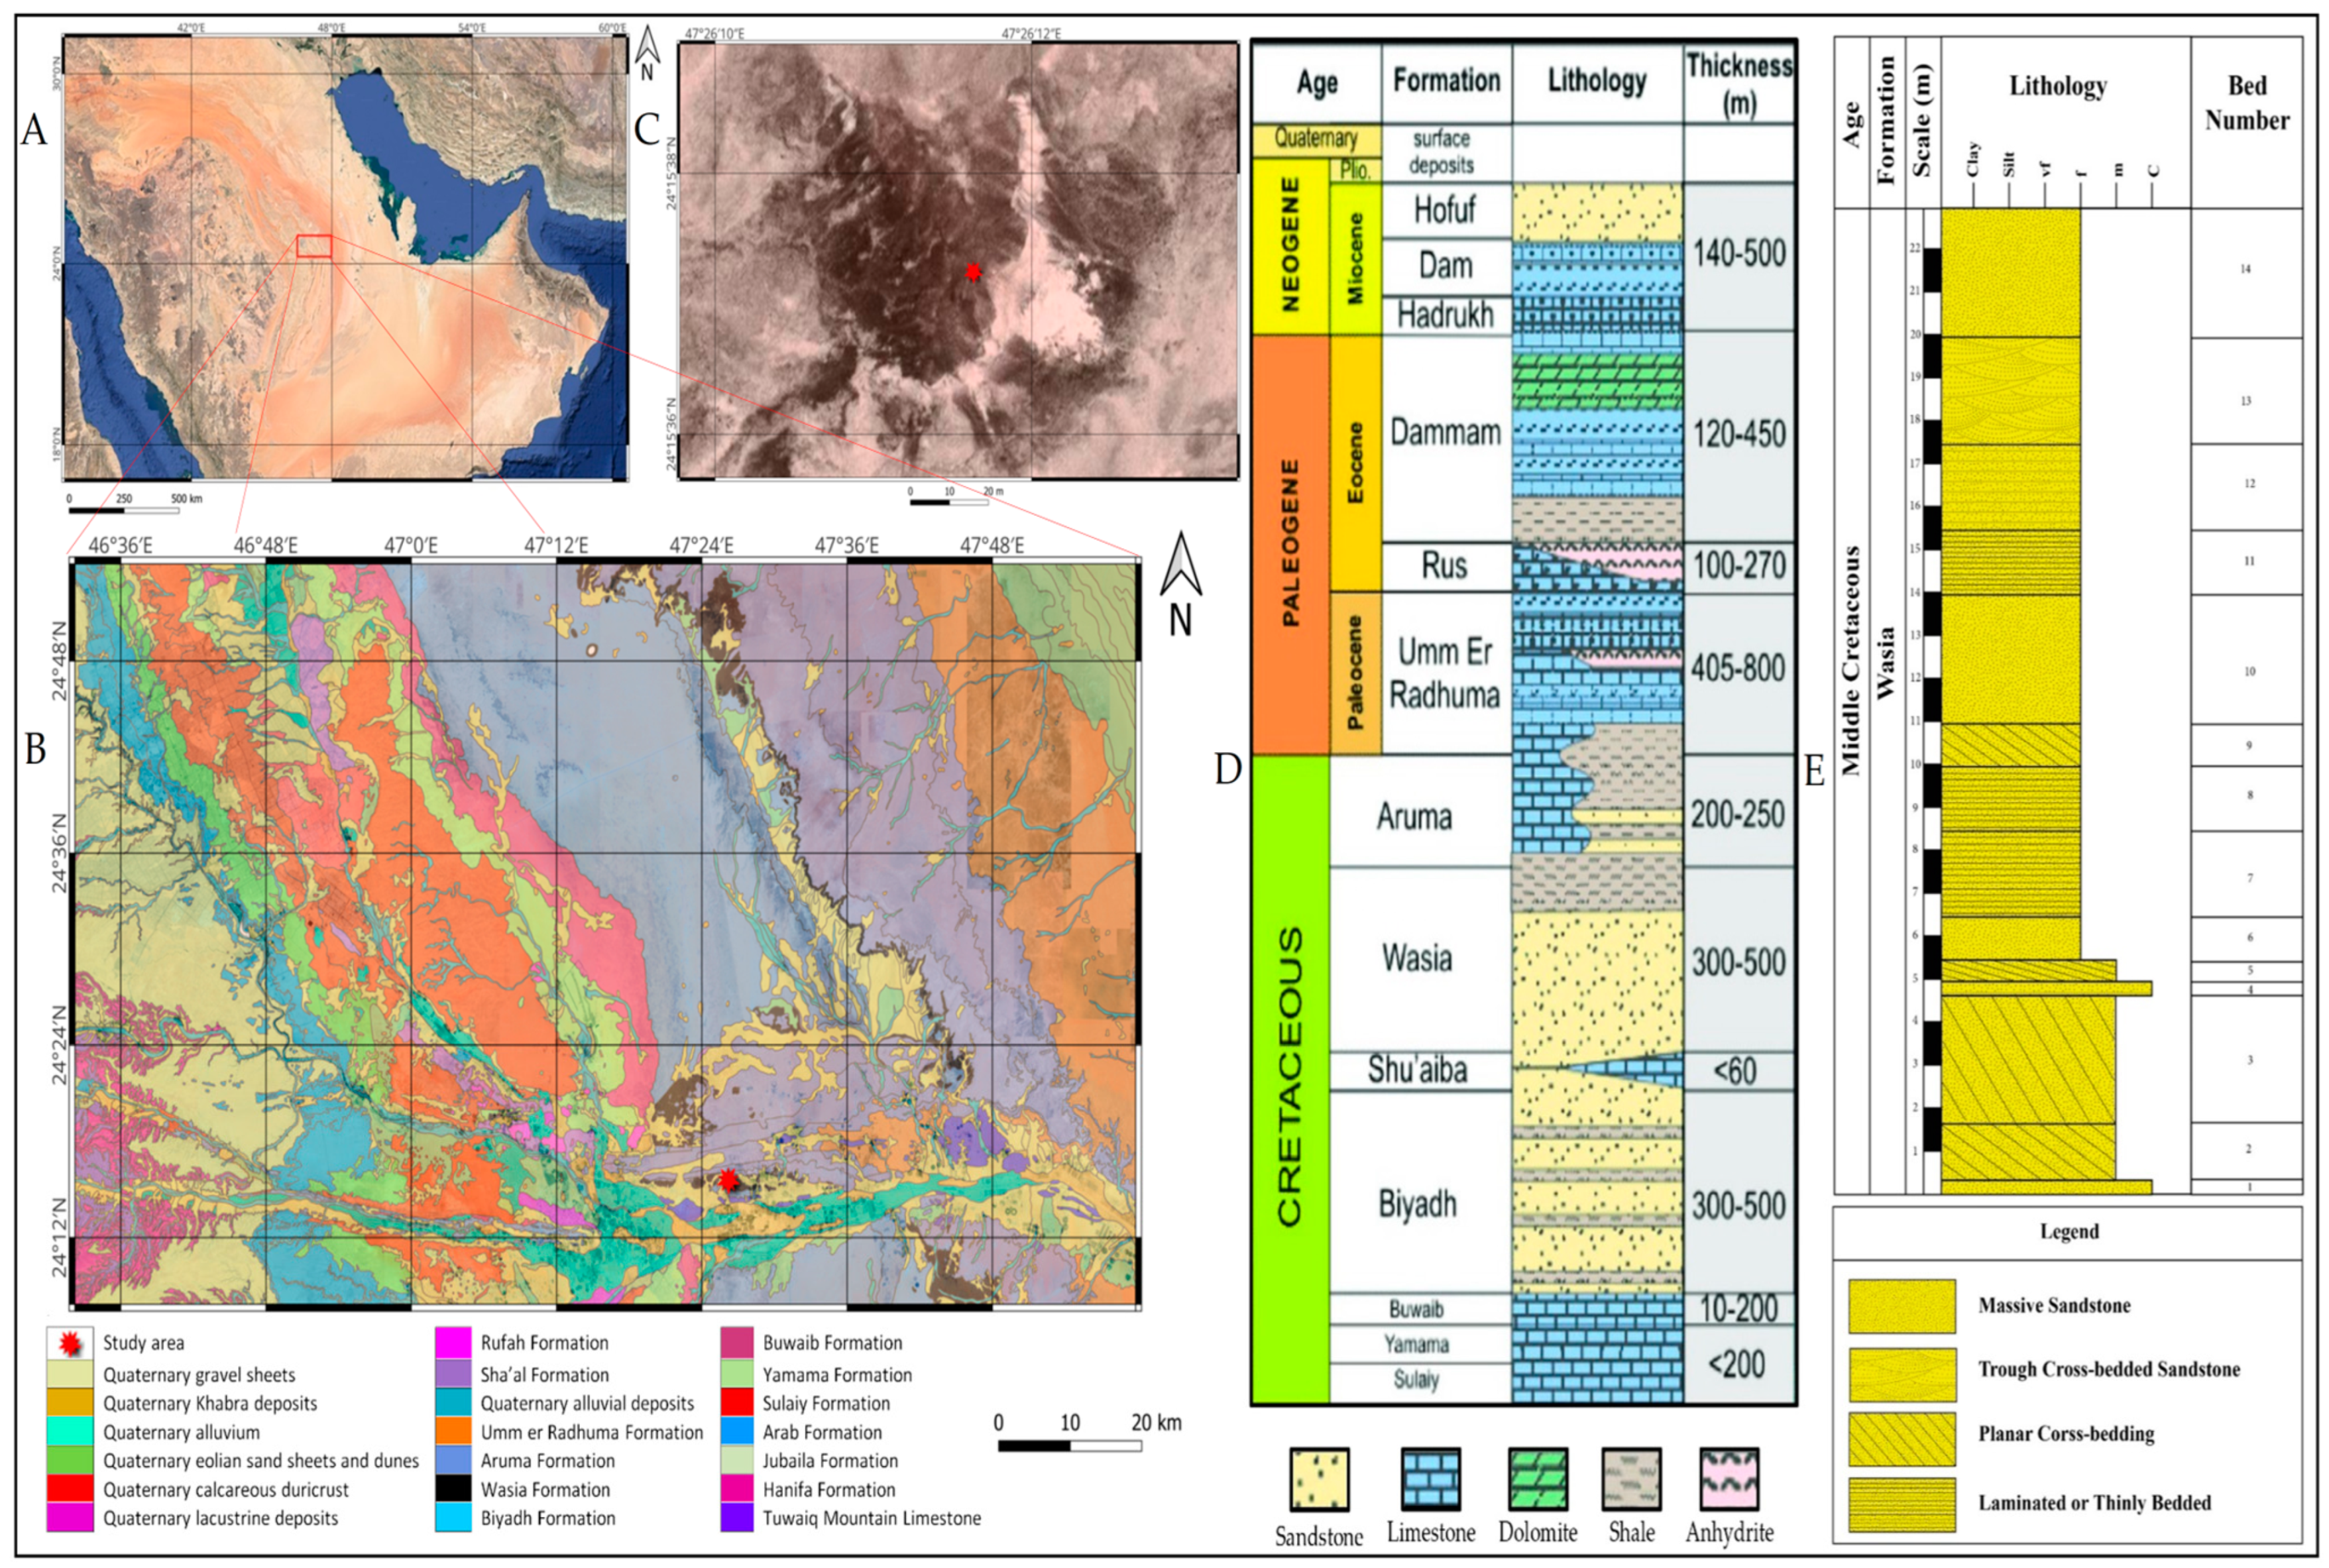
Figure 1. Location, geological maps and stratigraphic columns, (A) a satellite map of Saudi Arabia, (B) a geological map of The AR Riyad Quadrangle (modified after https://ngd.sgs.gov.sa accessed on 23 January 2023), (C) a satellite map of the study area (D) a Cretaceous and Tertiary stratigraphic column of the Arabian platform (modified after [35,36]), and (E) a stratigraphic column of the studied outcrop.
Sustainability 15 07983 g001
Figure 2. Volume percentage plot of the Wasia Formation beds.
Sustainability 15 07983 g002
Figure 3. Textural components of the Wasia Formation beds.
Sustainability 15 07983 g003
Figure 4. Bivariate plots of: (A) standard deviation against mean, (B) skewness against mean, (C) kurtosis against mean, (D) standard deviation against skewness, and (E) kurtosis against skewness.
Sustainability 15 07983 g004
Figure 5. Binary plots of linear discriminate functions (LDF): (A) Y2 versus Y1; (B) Y3 versus Y2; and (C) Y4 versus Y3.
Sustainability 15 07983 g005
Figure 6. Passega diagram (C-M plot) showing transportation mechanisms (After [14]).
Sustainability 15 07983 g006
Figure 7. Log-probability plot showing 2-level saltation and suspension trends (after [20]).
Sustainability 15 07983 g007
Figure 8. Log-probability plot showing saltation and suspension trends (after [20]).
Sustainability 15 07983 g008
Table 1. Graphic measurements and grain-size parameters of the Wasia Formation beds.
Beds 5 16 25 50 75 84 95 C M d GravelSandMud
1−1.67−0.80−0.261.111.711.932.88404247212.7%86%1.3%
21.061.241.391.812.372.622.928052980.3%99%0.5%
30.010.360.641.281.791.982.7418764300.5%99%0.3%
4−1.40−0.330.231.181.701.882.5740504557.6%92%0.3%
5−0.820.180.671.442.022.412.8837003913.3%96%0.4%
61.091.301.481.982.522.722.964992540.1%99%0.6%
71.151.622.002.362.712.843.007072060.2%99%1.1%
80.851.261.492.102.632.823.3917502370.7%98%1.3%
9−0.171.121.392.102.612.793.1943632382.5%96%1.1%
100.771.481.902.352.732.863.3319682071.0%98%1.2%
110.411.421.892.362.752.893.5530312051.3%97%1.8%
121.132.032.142.482.812.933.6016321900.7%98%1.2%
131.221.992.122.442.772.893.438311940.1%99%1.4%
140.982.162.372.943.523.733.9914421320.1%95%4.6%
Where: C is the coarser one-percentile (in micron) and M d is the median (in micron).
Table 2. Grain-size statistical parameters of the beds and their interpretations.
Beds M Z Sizing σ I Sorting S k Verbal Skewness K Verbal Kurtosis
10.75CS1.37PS−0.31SCSK0.946M
21.89MS0.63MWS0.18FSK0.778P
31.20MS0.82MS−0.04NS0.972M
40.91CS1.15PS−0.33SCSK1.107M
51.34MS1.12PS−0.17CSK1.124L
62.00FS0.64MWS0.04NS0.738P
72.27FS0.58MWS−0.26CSK1.060M
82.06FS0.77MS−0.03NS0.916M
92.00FS0.93MS−0.26CSK1.127L
102.23FS0.73MS−0.24CSK1.281L
112.22FS0.84MS−0.26CSK1.490L
122.48FS0.60MWS−0.05NS1.521VL
132.44FS0.56MWS−0.06NS1.377L
142.95FS0.85MS−0.15CSK1.067M
Where: M Z is the graphic mean, σ I is the graphic standard deviation, Sk is the graphic skewness, K is the graphic kurtosis, CS is coarse sand, MS is medium sand, FS is fine sand, PS is poorly sorted, MWS is medium-well-sorted, MS is medium-sorted, SCSK is strongly coarse-skewed, FSK is fine-skewed, NS is near symmetrical, CSK is coarse-skewed, M is mesokurtic, P is platykurtic, L is leptokurtic and VL is very leptokurtic.
Table 3. Linear discriminate functions (LDF) and depositional environment interpretations of the beds.
SampleDiscriminate FunctionEnvironment of Deposition
Y1Y2Y3Y4Y1Y2Y3Y4
17.91147.47−14.742.68AeolianShallow AgitatedFluvialTurbidity
2−3.2473.04−3.756.56BeachShallow AgitatedShallow MarineTurbidity
31.2980.26−5.315.50AeolianShallow AgitatedShallow MarineTurbidity
45.82116.22−9.723.73AeolianShallow AgitatedFluvialTurbidity
53.69120.71−9.665.26AeolianShallow AgitatedFluvialTurbidity
6−3.4372.42−3.155.47BeachShallow AgitatedShallow MarineTurbidity
7−3.0172.96−1.045.39BeachShallow AgitatedShallow MarineTurbidity
8−2.2287.95−4.445.86AeolianShallow AgitatedShallow MarineTurbidity
90.09104.10−5.655.31AeolianShallow AgitatedShallow MarineTurbidity
10−1.4789.62−2.836.53AeolianShallow AgitatedShallow MarineTurbidity
11−0.12104.41−4.267.47AeolianShallow AgitatedShallow MarineTurbidity
12−2.6889.64−2.149.39AeolianShallow AgitatedShallow MarineTurbidity
13−3.1583.18−1.698.52BeachShallow AgitatedShallow MarineTurbidity
14−4.21110.58−4.706.48BeachShallow AgitatedShallow MarineTurbidity
Disclaimer/Publisher’s Note: The statements, opinions and data contained in all publications are solely those of the individual author(s) and contributor(s) and not of MDPI and/or the editor(s). MDPI and/or the editor(s) disclaim responsibility for any injury to people or property resulting from any ideas, methods, instructions or products referred to in the content.