1. Introduction
Incorporating sustainable development goals has become a priority for policymakers worldwide (Kwee, 2021) [
1]. Foreign Direct Investment (FDI) can be an important tool for achieving these goals by promoting sustainable economic growth (Udemba, 2022; Suehrer, 2019) [
2,
3]. FDI can bring new technology, expertise, and capital to host countries, which can help reduce poverty, increase access to education and healthcare, and promote environmental sustainability (Baniak et al., 2005) [
4]. Therefore, it is crucial to examine the causal relationship between FDI and economic growth to better understand how FDI can contribute to sustainable development (Rao et al., 2023; Baniak et al., 2005) [
4,
5]. This study investigates the direction of causality between FDI and economic growth in China over a 40-year period, from 1981 to 2020. The findings suggest that policymakers should prioritize growth policies that foster sustainable economic expansion, rather than focusing solely on attracting FDI. The study contributes to the literature on the relationship between FDI and economic growth and highlights the importance of understanding the direction of causality between these two variables.
China has been very important to the growth of the world economy over the past few years. These days, China is considered the core engine in terms of economic development. Since the country joined the World Trade Organization (WTO) in 2001, it has been facilitating trade liberalization as well as the rapid growth of investments in the national economy, thus providing high growth of the Chinese economy. In 1995, China’s share in global trade was 3%, which was worth a value of
$280.9 billion in imports and exports of goods and services. By the year 2017, its share in global trade increased to 12.4 per cent of the world’s total trade, i.e.,
$4.1 trillion. At the same time, it has been observed that investments (% of GDP) are decreasing and expenditure (% of GDP) is increasing (Zhang et al., 2009) [
6].
Over the last three decades, China has experienced rapid economic growth. A large level of capital investment is a prerequisite for economic expansion. FDI is a key source of this large capital flow in China. Based on the recent data from the Chinese State Administration of Foreign Exchange (SAFE), FDIs held the largest proportion of external liabilities (49%), which amounted to
$3179.3 billion US dollars, at the end of 2020. Whereas portfolio investment was 30%, financial derivatives were 0.2%, and other investment was 21% of total extreme liabilities in the same year (
https://www.safe.gov.cn/en/2021/0326/1817.html, accessed on 12 February 2021). Therefore, a general assumption is that FDI is a blessing for Chinese economic growth. For instance, Cai et al. (2011) and Tiwari & Mutascu (2011) believed that FDI inflows played a significant role in the growth of the Chinese economy [
7,
8]. Moreover, to attract FDI Chinese government is also introducing different promotional activities. An open-door policy and favourable policies for FDI, including special economic zones, low tax rates, tax brackets and exemptions, a tax holiday, etc., are also encouraging the investor to invest more. As a result, China became a central attraction for foreign investors Garnaut et al. 2008) [
9]. Investment in China expanded progressively from less than 1 billion dollars in 1978 to 30 billion dollars by 1998, taking advantage of cheap labour costs and specific tax incentives. According to the 2020 World Investment Report, China became the second largest country receiving foreign direct investment (FDI) (
https://unctad.org/system/files/official-document/wir2021_en.pdf, accessed on 12 February 2021). In contrast, with a GDP of
$17.73 trillion, China will be the second-largest economy in the world in 2021 (WB, 2022). When policymakers are focusing on attracting FDI, it is important to understand whether FDI is able to boost the economic growth of the host country. In theory, an increase in FDI may increase capital investment. As a result, productivity and per capita income will increase in the short term. However, it can imply limitations on growth in the long run. FDI inflow also increases competition in the domestic market. Therefore, firms shift their focus to improving managerial skills, improving resource management, and adopting new technology (Kaufmann, 1997; Mello, 1999; Fosfuri et al., 2001) [
10,
11,
12]. According to Wang and Blomstrom (1992), FDI can benefit the host country through different channels of technological spillovers [
13]. According to the findings of Borensztein et al. (1998), to fill the technological gap, FDI acts as the core engine [
14]. The domestic investment contribution of FDI is larger. The authors argued that sufficient absorptive capacity on the new technology is the prerequisite for the host country to achieve higher growth from FDI. Being one of the fastest-growing economies, China has become the central destination for investment. According to UNCTAD, China’s FDI amounted to 140 billion US dollars in 2019, which is the world’s 2nd highest (
https://unctad.org/press-material/fdi-developing-asia-defied-pandemic-grew-4-2020-un-report, accessed on 6 may 2023). Although China is now experiencing a slow growth rate in its GDP, the Chinese GDP is still the second largest in the world after the USA at 14.34 trillion USD. Data shows that the 2019 GDP growth rate was 6.1% for China (World Bank, 2021) (World Development Indicators database, World Bank, 12 February 2021,
https://databank.worldbank.org/data/download/GDP.pdf, accessed on 12 February 2021).
FDI and economic growth are related, which makes them a major area of interest within the field of finance and economics. During the last decades, a number of researchers have sought to determine the relationship between growth and FDI. In the literature on growth, the relative importance of FDI has been subject to considerable debate. Some of these studies found a positive relation between FDI and growth (Cashin et al., 2017; Cai et al., 2015, Sen, 2010; Ying & Riming, 2008) [
15,
16,
17,
18], whereas some pointed to a negative impact of FDI (Carkovic & Levine, 2005) [
19]. However, most of these studies are based on cross-country data analysis. Cross-country studies of FDI often combine data from developed and developing economies. This may mislead the accuracy of the result. According to Choe (2003), based on the economic development level, a factor may positively relate to one country and negatively relate to many others [
20]. This leads to a gap in the literature for studies on a single country’s economy. To understand the relationship between growth and FDI, we focused on a specific country. After considering several facts, we shifted our focus to China to investigate the causal relationship between FDI and growth. To date, less study has been done on the causal relationship between FDI and growth, focusing on the Chinese economy. As a trading partner, China is linked to 100 countries that account for 80% of global GDP (Cashin et al., 2017) [
15]. So, we cannot deny the role that China plays in world trade. China also plays a key role in the global supply chain. China sometimes buys intermediate products from other countries and then sends them back after making changes to them.
This study’s goal is to investigate the causal link between FDI and China’s economic expansion. However, discussions in the literature indicate that FDI and Chinese economic growth are significantly related. Tiwari & Mutascu (2011) asserted that FDI has a significant impact on the expansion of the Asian economy [
8]. Since the 1990s, China’s fast-growing economy has been able to draw more foreign direct investment (FDI) than any other emerging nation. Strong preliminary research shows that foreign direct investment (FDI) is important to China’s economic growth (Sui, 2019) [
21]. However, FDI may raise the likelihood of financial crises, which is not necessarily ideal for the host country (Kose et al., 2009) [
22]. In this article, we look at how important FDI is to the growth of the Chinese economy. The main goal of this study is to look at how economic growth in China and FDI affect each other. We also look at how the growth of GDP affects other macroeconomic factors, such as trade openness, inflation, capital formation, domestic credit, and government spending. This study answers the following questions to help us reach our main and secondary goals: Will China’s economy grow faster if FDI increases? Or will increased FDI result from increased growth? How is GDP interacting with the other macroeconomic variables? A quantitative approach was used in research, and this approach is excellent for characterising variables and looking at how they relate to one another. The World Bank (WB), the United Nations Conference on Trade and Development (UNCTAD), and the International Monetary Fund (IMF) provided the data for this study, which was subsequently collected.
This paper is structured as follows:
Section 2 presents a review of existing literature.
Section 3 describes the data and method for this study.
Section 4 presents the empirical results of this study.
Section 5 describes the results and application, and
Section 6 concludes the paper.
2. Literature Review
Studies based on the combined data from developed and developing countries often show a negative impact on growth (Carkovic and Levine, 2005; Lensink and Morrissey, 2006; Türkcan et al., 2008; Herzer, 2012; Gunby et al., 2017) [
19,
23,
24,
25,
26]. By using a meta-analysis, Gunby et al. (2017) found that FDI has a large and positive impact on the economic growth of China [
26]. The authors analysed 37 studies with 280 estimations. However, if preferred characteristics and publication bias are considered, these results change significantly, and an insignificant impact is observed in the relationship between FDI and economic growth. In a cross-country empirical study, Carkovic and Levine (2005) found no strong evidence suggesting that FDI necessarily enhances economic growth in the host country [
19]. The authors used microeconomic and macroeconomic data for 72 countries from 1960 to 1995. Carkovic & Levine (2005) conclude that when other factors are taken into consideration, FDI fails to have a strong, autonomous impact on growth [
19]. Moreover, it has been observed that, after an increasing average year of schooling, FDI has failed to influence economic growth. The authors also reject the concept of special tax benefits and subsidies offered by host countries to attract FDI. They suggested that sound policies promote both FDI and economic growth. However, many econometric specifications suggest that FDI is positively related to long-term growth (Carkovic & Levine, 2005) [
19]. Elaborating on the facts about the relation between FDI and economic growth, Lensink and Morrissey (2006) include the effect of FDI inflow volatility [
23]. Results show a negative impact on growth when there is volatility in FDI, while FDI has a positive relationship with growth. Proof of the positive impact of FDI is not easily affected by other explanatory variables. Nevertheless, based on specifications, the importance of the estimated coefficient differs (Lensink and Morrissey, 2006) [
23]. Evidence from previous studies on Asian countries’ economic growth shows that FDI and exports have a positive impact (Tiwari & Mutascu, 2011) [
8]. They looked at nonlinearities in the relationship between FDI and export growth in 23 Asian economies. In the nonlinear alignment of FDI and export, results show that to achieve higher growth, export plays a more vital role than FDI in the case of Asian countries. Countries with limited natural resources need a large amount of investment to improve their infrastructure. Therefore, these countries are focusing on attracting more and more FDI. According to Tiwari and Mutascu (2011), at the initial level of growth, exports play an important role, but continuous growth depends on FDI inflows for Asian countries [
8]. Export promotion incentives and more exports are two of the most important things that help the economy grow.
Cross-country studies of FDI are often used to combine data from developed and developing economies. This may mislead the accuracy of the result (Choe 2003; Blonigen and Wang 2004) [
20,
27]. Blonigen and Wang (2004) completely disagreed with the findings of Carkovic & Levine (2005), arguing that pooling data from developing and developed countries is not appropriate and is responsible for estimating the negligible impact of FDI on GDP per capita growth [
19,
27]. The author argued that the results of polling data collected in this way may be incorrect for one or both types of countries. The factors that attracted FDI and the impact of FDI on developing and developed economies are similar, although theoretically, they may be fundamentally different. The same source suggested that by encouraging backward or forward production linkage, FDI crowds in local investments for non-OECD countries, but in contrast, no such impact has been observed in OECD countries (Blonigen and Wang, 2004) [
27]. In addition, the results of a panel data analysis may lead to false conclusions if FDI affects growth in different ways in different countries (Herzer et al., 2008) [
25]. According to Choe (2003), based on the economic development level, a factor may positively affect one country and negatively affect many others [
20]. This leads to a gap in the literature for studies on a single country’s economy. After considering several facts, we shifted our focus to China to investigate the causal relationship between FDI and growth.
Several issues of the International Monetary Fund 2004, 2006, and 2007 advocated that the Chinese economy largely depends on exports, and Asia became its favourite destination for exports (
https://www.imf.org/en/Publications/AREB/Issues/2016/12/30/International-Monetary-Fund-Annual-Report-2004-Making-the-Global-Economy-Work-for-All-17509, accessed on 6 May 2023. In 2007, China exported more than 75% of its total exports to Asia (Sen, 2010; Cashin et al., 2017) [
15,
17]. Chinese exports in 2019 reached 2.6 trillion USD (World Development Indicators database, World Bank,
https://databank.worldbank.org/data/download/GDP.pdf, accessed on 12 February 2021). In comparison with developed countries, China has a closer trade relationship with Asian countries. Hong Kong’s gateway for Chinese trade is no longer operational for China (Sen, 2010) [
17]. Developing economies generally have an increasingly volatile nature, which works in China’s favour to avoid the damage that could be caused by the collapse of the export market for such an economy. In the Chinese economy, import-export contributions reached more than 60% once (Sui, 2019), which indicates that international trade plays a key role in economic growth. Again, scholars argue that international capital flows have a significant role in boosting international trade (Sui, 2019) [
21]. In China, companies with foreign capital have dominated the import-export market by 40 to 60 per cent since the mid-1990s. During this period, the use of foreign capital accounted for more than 10% of the domestic capital formation in China. After a while, this ratio started to fall with the growing economic scale of the country. By the year 2016, the utilization ratio of foreign capital was 2.7% (Sui, 2019) [
21]. In terms of capital flows, China became more integrated with the developed economies’ capital markets. According to Sen (2010), the Chinese real sector is linked with the world by FDI, mostly Chinese capital structure and export trade, and FDI flow increases productivity by creating employment opportunities [
17]. Later, it increases the risk of making the country’s economy and capital market vulnerable to external shocks.
According to Cai et al. (2011), China became one of the favourite destinations for investors after reforming and opening its economy to international investors [
16]. At the initial stage, cheap labour costs were the main incentive for foreign companies to invest, but large production, a potential market, and favourable policies have also played an essential role in the latter part. China largely benefited from FDI because of a lack of capital, technological spillover, and economic growth. In this process, inward FDI and modern management not only developed infrastructure but also Chinese outward FDI. Zeng and Zhou (2021), who examined Chinese provincial data, demonstrated that FDI inflows are boosting China’s technological innovation capabilities and positively influencing the country’s economic growth [
28]. Recent studies have shown that FDI becomes an engine for economic development during the late part of industrialization and acts as a balancing variable for open macroeconomic equilibrium (Cai et al., 2011) [
7]. Therefore, FDI is an essential variable for an open economy, which enhances macroeconomic development. However, large FDI inflows boost the technological innovation capabilities of the host country and raise industrial production. Consequently, it increases wastewater discharge in China (Zeng & Zhou, 2021) [
28].
To study the factors related to GDP, FDI, and foreign trade in China, Ying and Riming (2008) observed 28 Chinese cities for the period of 1994–2005 [
18]. To obtain the results that are not possible to obtain by using traditional econometric techniques, the authors used an ANN model. This system can model nonlinear problems. The ANN system is a nonlinear system that can model nonlinear economic problems. It is able to simulate nonlinear economic problems. Therefore, the authors used this ANN model to create a function of Chinese trade, FDI, and GDP. Ying & Riming (2008) pointed out that FDI is not always the best for the country [
18]. Additionally, it has concentrations of economic units as dense provincial settlements along the eastern coast. The authors also suggested an optimal level for FDI and international trade at which they would have the greatest impact on the regional GDP of China. The optimal values for trade and GDP were declared as 105.4 billion USD and 2.96 billion USD, respectively (Ying & Riming, 2008) [
18]. Policymakers may use this optimal level as a benchmark and divide the regions into two categories. To achieve overall growth, policymakers should push more FDI and international trade to regions that are below optimal levels.
Previous studies have indicated that foreign direct investment (FDI) may have a significant impact on China’s GDP growth in the short term. However, according to the results of this study, the causal direction, in the long run, is from GDP growth to FDI. This means that a growing economy is more likely to attract increasing amounts of FDI. This study’s findings suggest that in the short term, FDI may still have some influence on China’s GDP growth. However, in the long term, a growing economy is the primary factor that attracts more FDI. This is because a growing economy provides foreign investors with greater opportunities for return on investment and lower risks, making it an attractive destination for foreign investment. The relationship between GDP growth and FDI is not immediate, and it takes time for the effects of economic growth to fully manifest. In the long run, sustained economic growth and improved overall competitiveness are essential for attracting more FDI to China. Moreover, this study’s results suggest that for China to attract more FDI in the long run, it must focus on achieving sustained economic growth and improving the competitiveness of its economy. By doing so, China can create a virtuous cycle of economic growth and FDI that drives long-term prosperity and development.
3. Research Design/Data Collection
For the empirical part of this study, data from the WB, UNCTAD, and IMF were used as secondary sources. These databases are accepted and reliable worldwide. A time series of data has been used from 1981 to 2020. For the econometric regression, macroeconomic variables were used, such as GDP, FDI inflows, trade openness to foreign trade, inflations, gross capital formation, domestic credit to the private sector, and government size. Throughout this paper, we used GDP as the real GDP and FDI as gross and as a share of GDP. For the index of trade openness, the values considered are the ratio of imports and exports to the GDP, while inflation is the consumer price change index. Government expenditure (in terms of a percentage of GDP) is considered a measure of government size. Private sector aids are referred to as domestic credit and include loans, trade credits, securities, and accounts receivable.
The main goal of this study is to develop a better understanding of the causality between FDI and economic growth in China. There are several statistical methods that have been developed to examine the factors impacting economic growth. However, this current study will deploy the VAR model. This model was introduced by Sims (1980) in his paper “Macroeconomics and Reality,” [
29]. A VAR is a n-equation model for n-variables that expresses a linear function for each variable in the context of past values. This model is mainly used to forecast macroeconomic variables and conduct policy analysis. By using this approach, we will be able to avoid differentiating the variables as exogenous or endogenous. In a study identifying the causal relationship between FDI and economic growth in Romania, Maria (2012) used the VAR model [
30]. The authors found that growth is not affected by the volume of FDI. However, economic growth is a key indicator for attracting FDI to the host country.
The present study is intended to examine whether an increase in FDI leads to an increase in Chinese growth. FDI alone cannot contribute to economic growth; however, it can influence the other variables in the growth process. Therefore, we will examine the causal relationship between FDI and economic growth, as well as other independent variables such as capital, trade openness, inflation, credit to the private sector, and government size. To achieve our objectives, we write the simple multivariable model as follows:
Here, GDP implies per capita GDP growth and K implies capital formation (gross capital formation as a percentage of GDP). Evidence from Mankiw (2004) shows that foreign trade contributes to the growth of the host country [
31]. Zeng and Zhou (2021) also confirmed that openness to foreign trade has a strong positive impact on growth [
28]. Therefore, in this model we included trade openness, which is indicated by T. Previous studies suggested that the FDI has a positive relationship with growth (Cai et al., 2011; Ying & Riming, 2008) [
7,
18]. Some control variables, such as inflation (I) and government size (GS), have also been used to show the impact on growth. A developed financial system also has a positive relationship with growth. Beck et al. (2000) found that developed financial systems improve capital allocation and stimulate growth [
32]. Moreover, Samargandi and Kutan (2016) find a significant positive spillover effect of credit to the private sector on Chinese economic growth [
33]. Therefore, we gave credit to the privet sector (denoted as CR). FDI not only includes capital transfer but also provides market access and technological knowledge for the host country. As a result, FDI tends to have a direct influence on the development of the manufacturing sector, which increases the productivity of the host country. Therefore, FDI has been included in the model. Sub-scripts t denote the time span of this study. To present the residual, we used the term and, which is representing the coefficient slope. Here in Equation (1), it shows the causality from GDP to other variables. Similarly, Equations (2)–(7), present the causality for all other variables.
Non-stationary variables may generate spurious correlations (Granger & Newbold, 1974) [
34]. Therefore, we will examine our data series under both Augmented Dickey–Fuller (ADF) and Phillips–Perron (PP) tests. Abbes et al., (2015) used the ADF test for the unit root analysis to examine the causal interactions between FDI, and growth [
35]. By using the ADF test for investigating the stationarity of variables we will write the model as follows.
where the variable of interest is denoted by
, time trend is denoted by t, the lag length is represented by k and random variables are denoted by
. Here we will test the hypothesis:
H0: there is no unit root in the data or data is stationary.
H1: unit root exists in the data or data is non-stationary.
If the absolute value of the t-statistic is
t-critical and the
p-value is
0.05 then we will accept H0. Phillips and Perron (1988) also suggested an alternative test for stationary [
36], which is more robust to data correlation, time-dependent heteroskedasticity, and improves the ADF test (Kim & Schmidt, 1990) [
37]. Therefore, we will re-check the stationarity test by using the PP test.
Before estimating the VAR model, we need to select lag length criteria. Appropriate lag length is crucial for any empirical study. If the leg length is too short, the model can be misspecified. In contrast, the degrees of freedom can be wasted if the lag length is too large. Akaike (AIC), Schwarz (SBIC), and Hannan-Quinn (HQIC) are the most commonly used length decision-making approaches. Once we select the appropriate lag length, now we can implicate the model. This current study will deploy Panel Vector Auto Regression (PVAR). Like the traditional VAR model, this model will allow us to use all variables endogenously and interdependently. The VAR model was developed by Sims (1980) [
29], and abundant use of this method has been seen in panel analysis (Canova & Ciccarelli, 2013) [
38]. However, this method has been developed by Love & Zicchino (2006), and Abrigo & Love (2016) who made it a more robust application model in macro-economic analysis [
39,
40]. The panel VAR equation can be written as follows.
where the vector of the dependent variable is indicated by, the estimated parameters are noted as and the exogenous covariates vector is indicated by, u is presenting the vectors of the dependent variable specific panel fixed effects, and is indicating idiosyncratic errors.
At this stage, it is important to carry out T to examine the direction of causality among the variables. It will allow us to understand whether an increase in the dependent variable will cause an increase in the independent variable or whether an increase in the independent variable leads to an increase in the dependent variable. The Granger Causality Method is a widely used method to investigate the direction of the relationship between variables. This method was introduced and developed by Granger (1969) [
34], and several studies have used this model in their analysis (Abbes et al., 2015; Antonietti & Franco, 2021; Cincinelli et al., (2022) [
35,
41,
42]. The model for panel causality can be written as follows.
where, stationary variables are indicated by A and Z, and autoregressive parameters are indicated by
,
expressed the slope of coefficients. Here the assumption is that idiosyncratic effects are constant and there will be a common delay, which is denoted by K.
4. Empirical Results
Here,
Table 1 presents an overview of the descriptive statistics for the variables we used in our model. The number of observations is 40, with seven variables that have been used in this study to establish a better understanding of the causal interaction among these variables. GDP growth was a dependent variable, and independent variables were the degree of trade openness, inflation, capital formulation, domestic credit, and government expenditure. Data may be considered non-stationary when random trends and structural changes are observed in the dataset. It is not economically significant to use nonstationary data for OLS regression or any other model. Nonstationary data may bias the estimated parameters and cause false regression. To avoid these problems, at first we examined the stationarity of our data by using Augmented Dickey–Fuller (ADF) and confirmed the results by re-examining them under the Phillips–Perron (PP) test for unit root. The Dickey–Fuller test for the unit root report provides a higher
p-value, which is
p > 0.05 for all variables. Therefore, we can say our series is non-stationary. To verify this result, we also ran the Philip-Perron test for unit root. Again, we found that the
p-value was higher than 0.05. In the next step, by using VAR models, we checked whether our variables were stationary or nonstationary. We generated differences for each variable and ran the root test again. The following
Table 2 shows that all variables are stationary at first differences.
As can be seen from
Table 2, at first, all variables are stationary and the
p-value is 0.05. At the next step of our analysis, we will select an appropriate lag length. It is necessary to select an appropriate lag length before estimating the VAR model. The model might be misspecified if the used lag length is too small. In contrast, the degree of freedom may be wasted because of a large lag length. The Akaike, Schwartz, and Hannan–Quinn tests are the most commonly used to determine the lag length. However, the literature suggests that there is no best one. Therefore, we used lag length in our model, which is selected by most of these criteria. Since most of the criteria call for selecting 1 as the appropriate lag length (
Table 3), Therefore, we used 1 as our selected lag length in the model.
At the beginning, we identified that our variables had nonstationary levels. Therefore, we applied differences to estimate our model. Now it is essential to examine whether our model satisfies the stability conditions. We also checked residual diagnostics to make sure that there was no autocorrelation. A model can be considered stable when each of the inverse roots of the property AR polynomial has a modulus less than one and remains within the unit circle. However, if the VAR model is not stable, diverse tests conducted using our VAR model may be invalid, along with the impulse response standard errors. From
Table 4, we can see that all the roots are lying inside the unit circle. The output result in modulus is less than 1, suggesting that VAR satisfies the stability condition.
Table 5 presents the Lagrange multiplier test summary for autocorrelation, where null hypotheses are at the selected lag length and no autocorrelation exists. Here, the
p-value is higher than 0.05. Therefore, it is confirmed that our model has no autocorrelation.
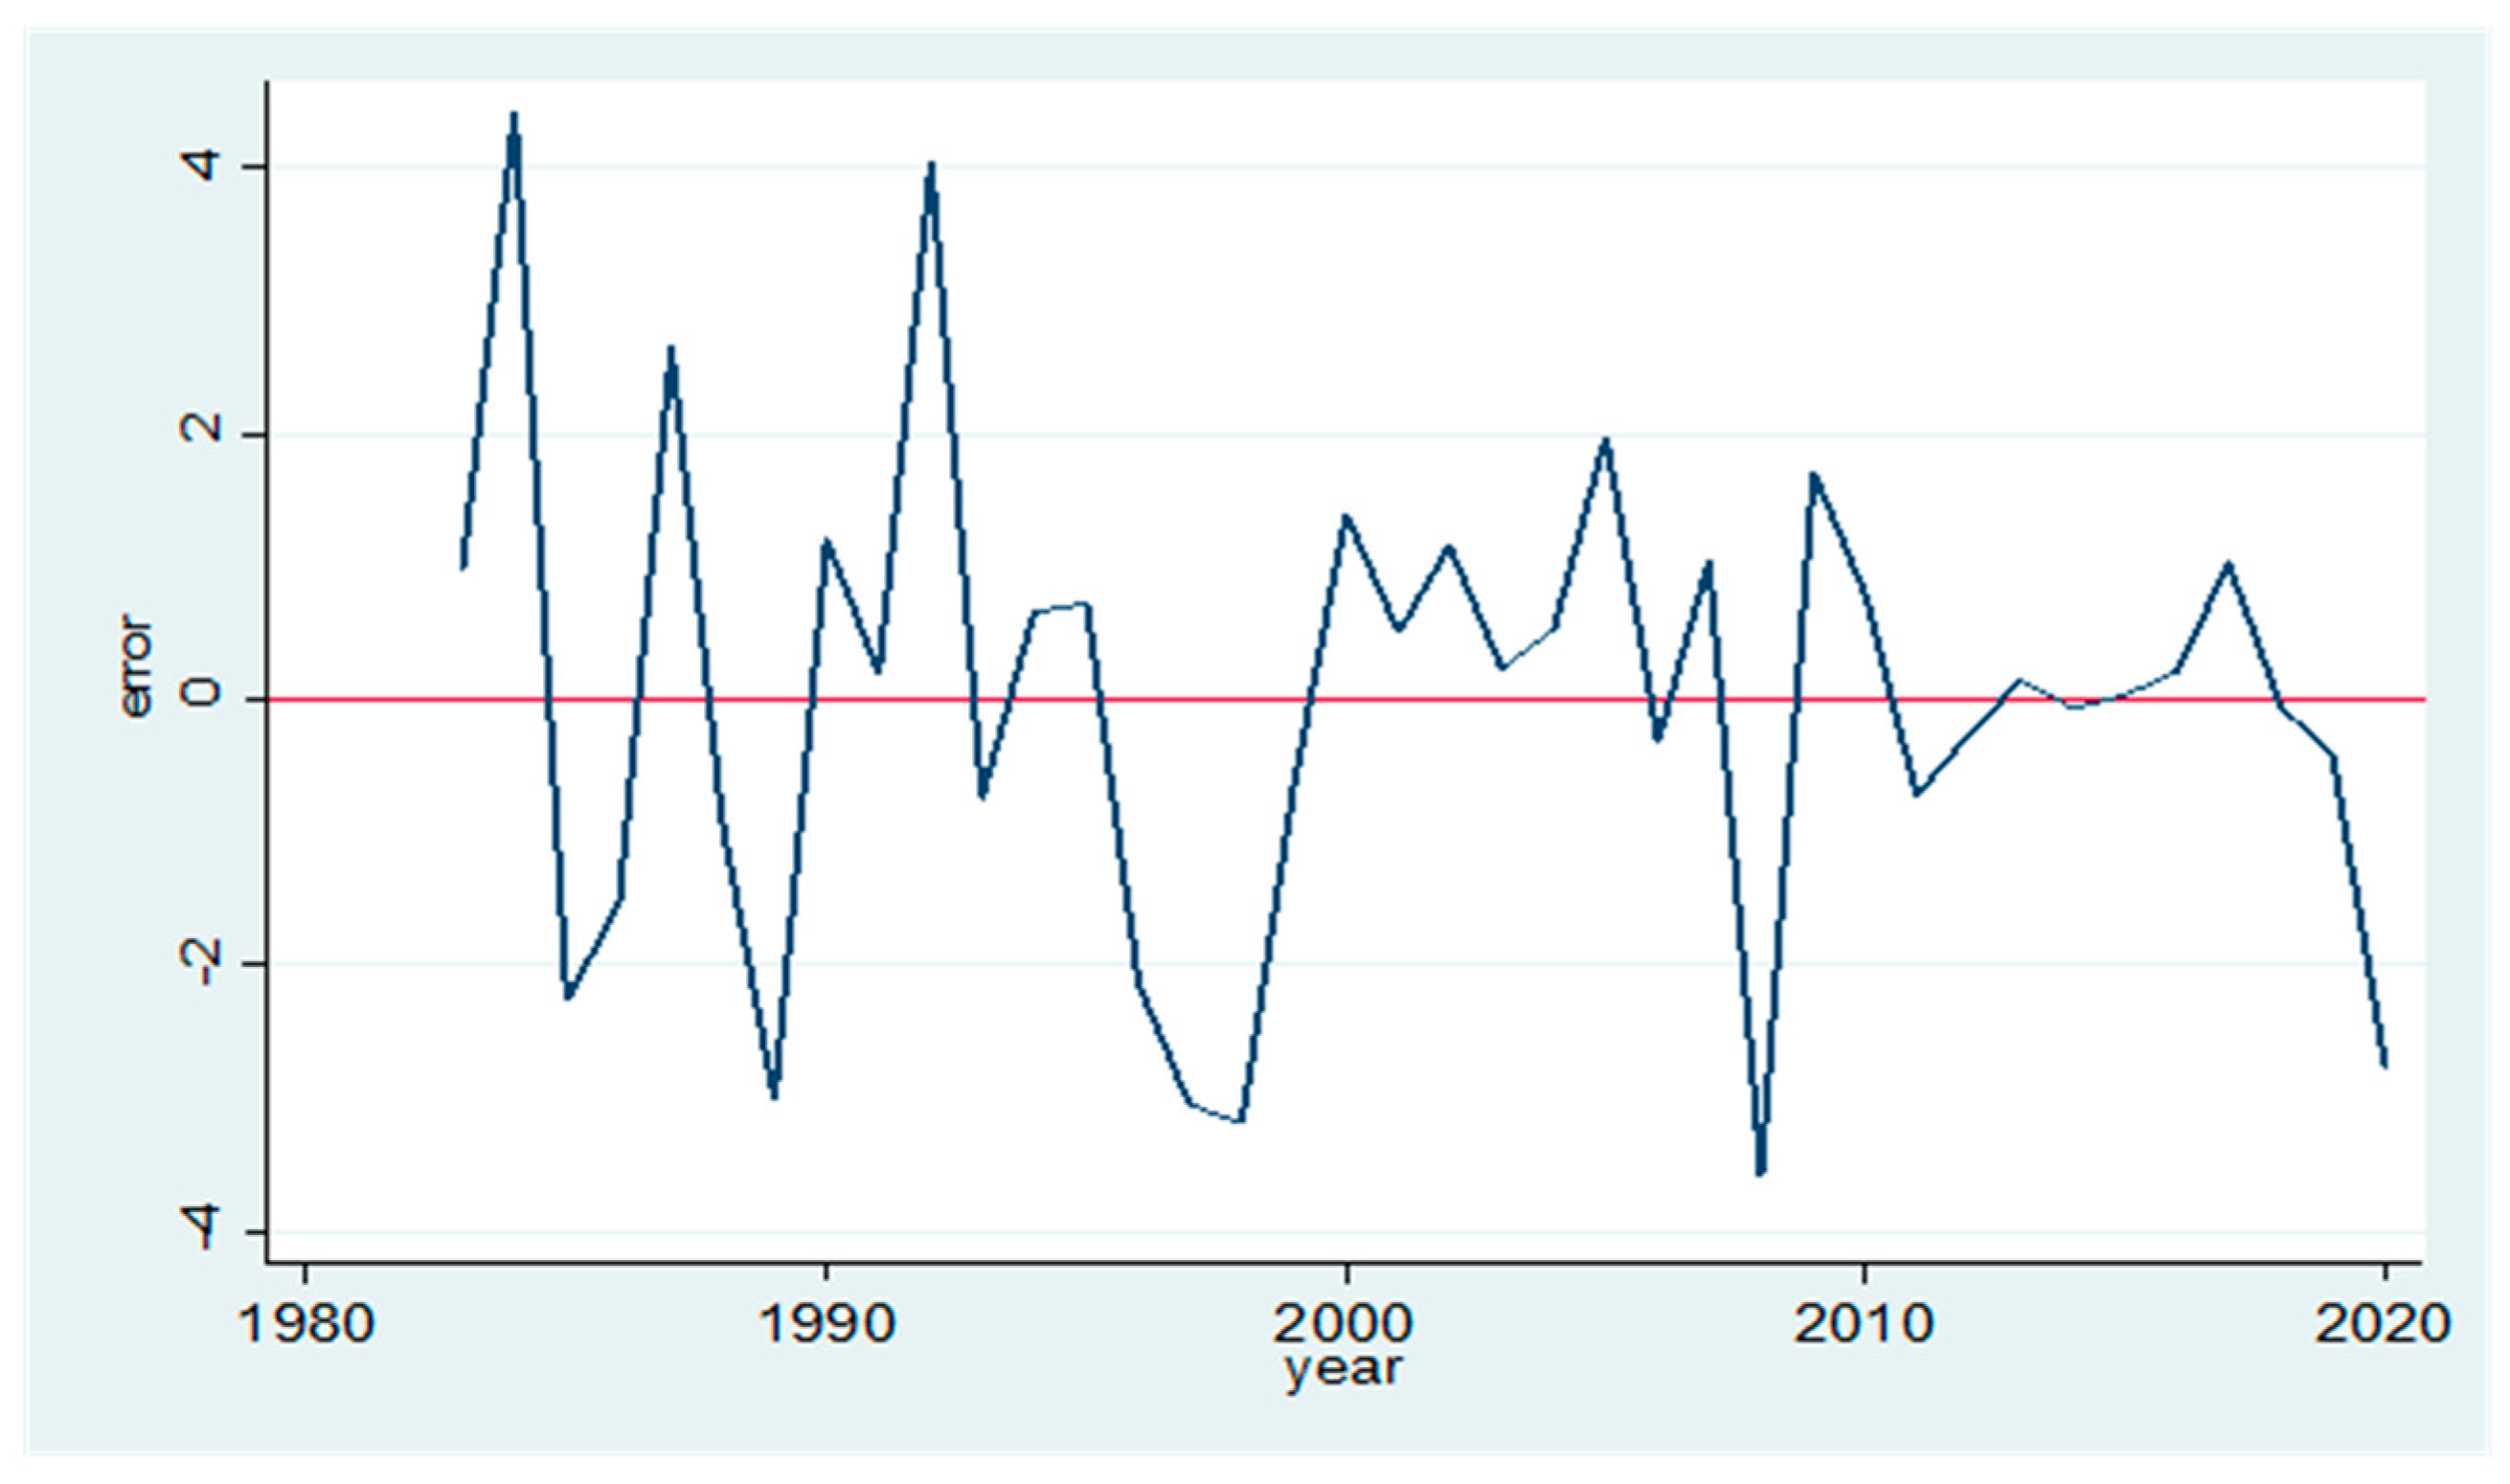
In
Figure 1, the Granger causality performed as part of residual diagnostics is presented based on 38 observations with an SD of 1.824637. The calculations in relation to this figure are presented in
Table 6. Whereby we can second the findings ahead in the explanation of the analysis that shows the bidirectional explanation of inflation by means of GDP and FDI, through the years 1983 to 2020.
To assess the importance of bi-directional causality between variables, we performed the Granger causality test.
Table 7 presents an overview of the Granger causality test. Results are suggesting that GDP has a bi-directional relationship with inflation. This means a change in inflation may help to predict GDP growth or a change in growth will help to explain inflation. Findings also show another two-way causality between CR and T. Except that there is no two-way causal relationship between other variables, However, we observed one-way causality from K to GDP and FDI to GDP (Aslan et al., 2022). Some additional one-way causal relationships have been observed from K to GDP (0.000), K to T (0.055), K to GS (0.019), K to FDI (0.003), T to GDP (0.006), T to FDI (0.028), I to CR (0.010), CR to GDP (0.009), CR to FDI (0.031), FDI and I (0.041).
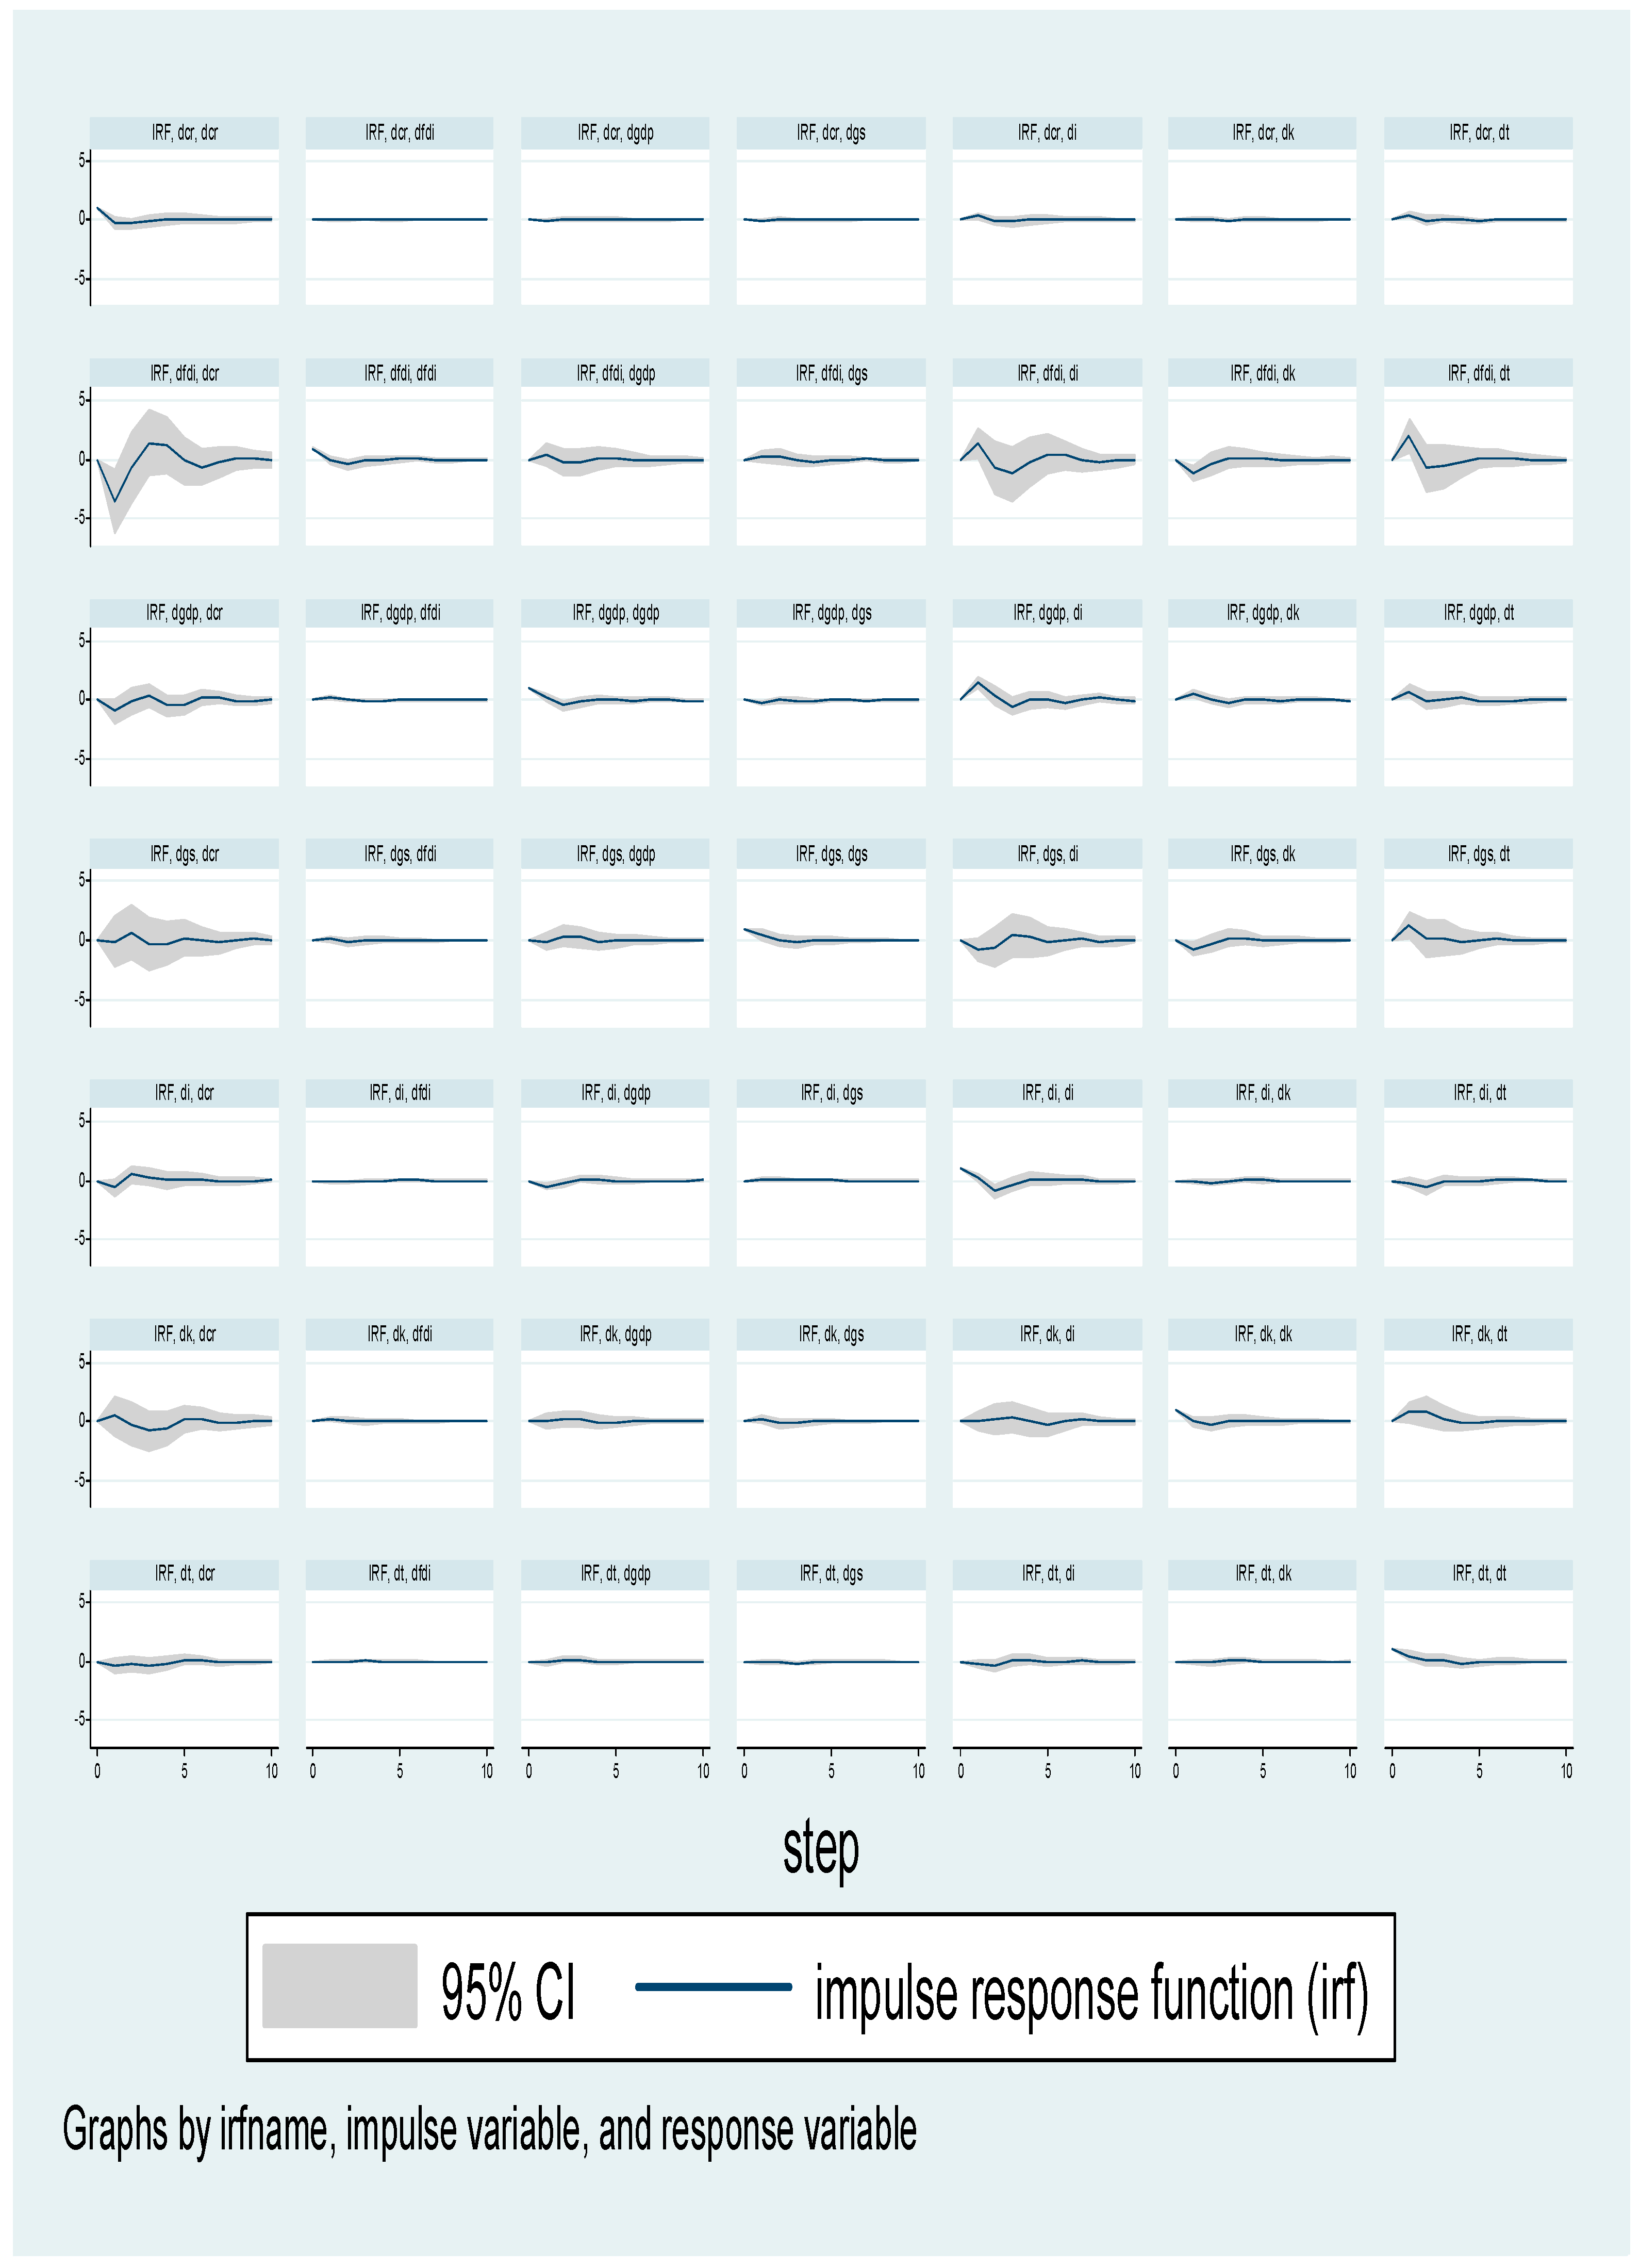
The impulse response function (IRF) is presented in
Figure 2. It is observed that a shock of one standard deviation to GDP has a negative effect on CR. However, after a certain period, it rises and reaches its initial value. In contrast, a shock of one standard deviation in GDP has a positive effect on FDI, inflation, capital, and trade. The same figure suggests that FDI positively affects GDP growth, GS, I, and T. In contrast, at the beginning, FDI affected CR and K negatively, and later, the effect continued to be positive. The impulse response for other variables is also presented in
Figure 2.
Table 8 shows variations in variables in the Chinese economy. For the Chinese economy, the GDP variable account itself is at 68%. Other variables that affect the growth over a period of 10 years are K, I, FDI, GS, CR, and T in the proportions of 30%, 26%, 20%, 15%, 9%, and 6%, respectively. Variance decompositions for other variables are presented in
Appendix A.
6. Conclusions and Limitations
Globalization has made capital movements easier than ever. The integration of sustainable development goals has gained increasing importance among policymakers worldwide. FDI can serve as a crucial means for attaining these goals by fostering sustainable economic growth through the introduction of new technology, expertise, and capital to host countries. These benefits can include poverty reduction, improved access to education and healthcare, and the promotion of environmental sustainability. Over the last three decades, the world has seen that to attract FDI, enormous efforts have been made by developing countries. Due to policy changes and economic reform, China has been experiencing rapid growth in FDI inflow. A general assumption is that FDI plays a key role in boosting a country’s economy. Although empirical studies suggest mixed results regarding the relationship between growth and FDI, this study set out to determine the causal relationship between growth and FDI inflow in China. The main objective of the study is to examine the causality between FDI and Chinese economic growth. To evaluate this problem, we found the VAR model to be a strong testing model. As it indicates not only the relationship between the variables but also the direction of causality.
In the growth of the Chinese economy, FDI plays an important role. Our findings suggest that there is a positive relationship between FDI and GDP growth in China. In the short run, growth has a negative relationship with CR and K in China. After a certain period, it rises and remains positive in the long run. At the same time, GDP has a positive relationship with FDI, I, and T over a 10-year period and remains constant. In the growth of the Chinese economy, the effect ratio is 20% for FDI, which is smaller than K and I. Whereas there is no statistically significant relationship between growth and GS, this study has also shown that there is no bi-directional relationship between GDP growth and FDI. Although GDP has a one-way causal relationship with FDI, which indicates that growth is influenced by FDI, our findings also show a bidirectional relationship between GDP and I, CR, and T.
The result of this study indicates that growth has a one-way causal relationship with FDI. which means FDI has a significant impact on the growth of the Chinese economy. As a result, policymakers should prioritise FDI-friendly policies to attract more FDI and achieve sustainable growth. However, FDI cannot extract the desired growth by itself. Therefore, it is also very important to consider other macroeconomic variables in long-term policy. By creating technological diffusion from a developed country to the host country, FDI boosts economic growth. Therefore, policymakers should be careful to distribute FDI to more productive sectors. It is very important to make sure that these investments are able to create new job opportunities, increase the efficiency of the labour force, promote trade, create a competitive business environment, and stimulate and transfer new technology.
Finally, a number of important limitations need to be considered. First, this study only considered macro-level data, whereas sectoral data analysis might paint a different picture of how these sectors are influencing growth in China with the help of FDI. Second, further research might explore technological spillover and productivity gains from FDI. The data source we used for this study does not have data on Chinese labour for some time periods, particularly before 1989. Therefore, another aspect can be addressed in a future study by including the FDI effect on the labour market in China.


