1. Introduction
In the 21st century, the world has entered the era of a knowledge-based economy, and factors, such as knowledge, talent, and information, have replaced natural factors, such as land and minerals, as the main resources for social and economic development. Developing scientific and technological innovation capabilities, enhancing the innovation environment, and seizing and leading the frontier of scientific and technological innovation is the starting point for building a strong scientific and technological nation, achieving sustainable national development, and enhancing regional competitiveness [
1]. With the development of the division of labor in society, the development of cities has changed from an agglomeration of production to a service operation, and resources, such as knowledge and information, have become new factors of production, which are linked to each other in the process of exchange, dissemination, and integration between cities to form a networked structure. Innovation networks, as a product of innovation agglomeration, represent a kind of “soft network” in the field of urban network research. Innovation factors, such as talent, knowledge, and technology, have broken through the previous local spatial restrictions and have become the dominant form of spatial organization by realizing the flow and exchange of factors through communication technology, rapid transportation, and other physical infrastructure, avoiding geographical distance in physical space and thus realizing the sharing of the flow of time and space [
2]. The shift from ‘space of place’ to ‘space of flows’ questions the explanatory structure and research approach of city-region systems based on the central place theory. The shift from ‘urban systems’ to ‘urban networks’ has reshaped the spatial organization of urban-regional systems [
3].
Innovation is a driving force for socio-economic development, and cities, as important spaces for knowledge and technology creation and innovation implementation, provide the necessary spatial sites conducive to the clustering and exchange of innovation factors, while creating urbanized economies that provide specialized environments and adaptive opportunities for innovation [
4]. With the in-depth development of globalization and the continuous refinement of industrial chains, the flow of innovation resources between organizations, regions, and industries has become increasingly frequent, and the exchange of technology and knowledge and technical cooperation has become increasingly close [
5]. In this context, research based on flow space theory provides a new perspective and new ideas for the development of inter-regional collaborative innovation. As the construction of inter-city relations advances from the ‘real’ to the ‘virtual’, i.e., from physical flows, such as traffic and migration, flows to non-physical flows, such as information and knowledge flows, it is important to explore the spatial relations of regional cities under the role of innovative flows. This is a key area of research on urban networks. Innovation networks represent a combination of social and spatial networks, with both social and spatial attributes, which can facilitate the study of urban networks to keep pace with the times and make up for the shortcomings of socio-spatial research. At the same time, the dual social-spatial attributes of innovation networks can lead to the up-to-date study of urban networks and make up for the lack of socio-spatial research. At the regional (city cluster) level, the innovation competitiveness of the region as a whole not only focuses on the level of innovation development of cities within the region, but also emphasizes the degree of networking of inter-city innovation coordination [
6]. The establishment of innovation relationships between cities in the region is a process of constructing relationships, and scholars have already adopted the model fitting method to establish an indicator system for the comprehensive evaluation of city innovation levels and innovation capabilities, with factors such as strong subjectivity of data and differences in the statistical caliber of data. With the popular application of massive data in cities, explicit data characterizing inter-city innovation cooperation are statistically available and accessible, and the covariate substitution method is increasingly favored by scholars. The study of the structural characteristics of regional innovation networks, the spatial pattern of innovation networks and their evolution mechanisms is of great theoretical value for the rational allocation of innovation resources in the region, deepening the study of city–region system and regional innovation, and is of great practical significance for the enhancement of regional innovation capacity [
7]. How to bring into play the comparative advantages of various regions and cities, promote the reasonable flow and efficient gathering of innovation resources and high-end elements, and promote the construction of regional innovation systems and urban innovation networks [
8] is an urgent question to be answered in order to promote the formation of an innovation development pattern with complementary advantages and high-quality development, in order to build an innovative country.
The twin-city economic circle of Chengdu and Chongqing is located in western China and is the region’s center in terms of population and economic gravity, linking the coastal areas east-west via the Yangtze River Economic Belt and north-south via the New Land and Sea Corridor. The Chengdu-Chongqing region has an “H-shaped” national dual-channel structure with the dual functions of “linking the horizontal” and “merging the vertical”, and the twin-city economic circle of the Chengdu-Chongqing region is a strategic support for the development of the western region and the Yangtze River Economic Belt. As one of the key national city clusters in China, it is worth considering how to co-ordinate the innovative and synergistic development of the region so that it can play a key role in the new development pattern. In the face of the new development pattern, it is of great significance to study the distribution of innovation development in inland and post-haircut regions, for their coordinated regional development, rational planning, and layout of innovation factor development, as well as regulation of regional innovation resource allocation, for the formulation of regional innovation development strategies and policies and the cultivation of regional innovation centers. In view of this, this paper explores the structural characteristics, spatial pattern, and formation mechanisms of the regional innovation network of the twin-city economic circle in the Chengdu-Chongqing region based on the perspective of innovation flow, with a view to providing useful references for regional innovation issues, such as regional knowledge spillover, the geographical process of innovation diffusion, and regional innovation development path, in the twin-city economic circle in the Chengdu-Chongqing region, providing model implications for the development of a regional innovation collaborative network in western China.
2. Literature Review
The interactions between cities and their spatial organization represent a key area of interest in urban science [
9]. The spatial scale of urban networks, including innovation networks, is being reconstructed at an accelerated pace, as technological innovation is changing rapidly under the wave of globalization, knowledge flows are becoming more frequent, and innovation cooperation is becoming closer. Flow space theories, such as Castells [
10], has laid the theoretical foundation for the study of the network paradigm, and data on various flow elements between cities provide the practice for the empirical study of urban networks [
11]. The organizational logic of urban networks is rooted in the process of inter-city factor flows and exchanges, and such spatial flows serve as a vehicle for reflecting inter-city functional links. The organizational characteristics and spatial patterns of urban networks depend on the types of inter-city factor flows and the specific urban functions they reflect [
12]. Therefore, a networked perspective is introduced to try to explain the “space of flows”, such as the intensification of inter-city linkages, the increase of linkage channels, the non-hierarchical nature of linkages, and the related issue of knowledge and innovation networks in urban agglomerations [
13,
14,
15]. At present, existing research on regional innovation networks focuses on the following three areas.
First, with regard to data selection and network construction, in terms of data selection, more studies have chosen heterocity cooperation relations of scientific and technological achievements as the basis for network construction, among which co-authored papers [
16,
17] and joint patents [
18,
19,
20] are used as proxy variables to measure the level of inter-city innovation. Matthiessen et al. [
21] analyze the hierarchical and regional nature of knowledge innovation linkages among global cities and the spatial pattern and topological characteristics of urban knowledge networks in China, respectively, based on thesis collaboration data. Some scholars also used data on cross-city mobility of talents [
22] and the number of transfers of scientific and technological achievements [
23] as reflecting inter-city innovation interactions. In terms of network construction, mathematical models were used to calculate the strength of inter-city innovation links [
24] and gravitational models were used to simulate the strength of inter-city innovation links [
25].
Second, concerning spatial characteristics and topology, in terms of spatial structure, studies have been conducted using traditional spatial analysis to reveal the spatial pattern and hierarchical differences of urban knowledge cooperation networks [
26]. For example, Gay and Dousset [
27] found that the technology innovation network structure shifted from a scale-free morphology to a small-world characteristic morphology by studying the technology innovation networks formed in the biotechnology industry. Li et al. [
28] constructed a Chinese biotechnology field scientific knowledge network and technological knowledge network in China, analyzing the overall network structure characteristics, meritocratic linkability, and spatial characteristics of central cities and their self-networks. Some scholars also explored the monocentric and polycentric characteristics of urban knowledge cooperation networks [
28,
29]. In terms of topology, scholars examined the small-world, scale-free, and homogenous nature of urban knowledge cooperation networks, as well as the degree centrality, proximity centrality, and intermediary centrality of individual cities in the network, etc., based on social network analysis and complex network theory [
30].
Third, with regard to influencing factors and evolutionary mechanisms, based on the multidimensional proximity theory of Boschma [
31] a large number of empirical studies have been conducted, finding that multidimensional proximity, such as geographic, institutional, cognitive, and social proximity has a significant impact on the evolution and formation of urban innovation networks [
7,
32,
33]. In studying network formation mechanisms, gravity models (GM) [
34,
35], multiple regression quadratic allocation scheme models (QAP) [
36,
37], and exponential random graph models (ERGM) [
38] are commonly used in dissecting network formation mechanisms. For example, Gu Chaolin [
39] used the gravity model to quantitatively study the strength of spatial linkages among Chinese cities to portray the urban hierarchy. The innovation linkages estimated by the gravity model show a positive correlation with the actual innovation linkages among cities. However, the GM is usually set to a log-normal form that cannot satisfy the zero-difference assumption of its error term, and too many zero values in the sample may also lead to biased estimation results [
40]. The QAP considers the interdependence of individual level variables but does not address the dependence of the overall network, making the estimation results biased [
41]. The exponential random graph model integrates the consideration of network endogenous and exogenous level variables, models the probability of occurrence of edges in the network, takes network structure variables as the core, can include node attribute variables, covariates, and network structure variables, and infers through the simulation process and parameter estimation. The influence of these endogenous structural and exogenous dynamical variables on the overall network is advantageous in predicting network relationship formation and exploring network evolution mechanisms [
42]. Some scholars have used ERGM models to study inter-country trade exchange linkages [
43], regional intellectual property protection network relationships [
44] and other probabilistic modelling to explain network relationship generation dynamics mechanisms in terms of endogenous structural and exogenous attribute variable dimensions. For example, Wang Haihua et al. [
45] constructed an ERGM and found that the knowledge uniqueness of the YRD industry–university–research innovation network helps to form innovation cooperation among cities. Sun Yu et al. [
46] used a multi-valued ERGM to explore the innovation network characteristics of the YRD city cluster. The exogenous level of cities’ own attributes and network proximity have significant effects on the formation and development of cohesive subgroups in the YRD city innovation network, as well as the endogenous level of cities. The development of cohesive subgroups in innovation networks at the endogenous level is characterized by self-reinforcement under the path-dependent mechanism.
As an important part of the national innovation system, regional innovation networks, as a reflection of inter-city innovation exchanges, reflect the innovation radiation capacity of cities and the intensity of inter-city innovation cooperation [
47]. Establishing a good innovation network connection can guide the flow and sharing of innovation resources, optimize the spatial layout of innovation, and provide strong support for enhancing regional collaborative innovation power and comprehensive competitiveness. With large differences in innovation development levels between cities in the twin-city economic circle of the Chengdu-Chongqing region and large gradient differences in innovation factor resources between cities, building a regional innovation community together and an efficient and collaborative regional innovation network are key [
41,
48]. This paper constructs a regional innovation network with the number of co-authored papers among cities in the twin-city economic circle of Chengdu-Chongqing region from 2010 to 2018, explores the mechanism of regional innovation network evolution, constructs an exponential random graph model by selecting time-section data, tests the mechanism of innovation network formation, uses the Markov chain Monte Carlo maximum likelihood estimation method for simulation processing and parameter estimation, explores the endogenous structure, node attributes, and network relationships, to investigate the effects of endogenous structure, node attributes, and network relationship covariates on innovation network formation and explore the mechanism of regional innovation network evolution.
3. Research Methods and Data Sources
3.1. Survey Regionand Data Sources
Located in the upper reaches of the Yangtze River, the Chengdu-Chongqing region is the region with the highest level of economic development and the greatest room for innovation capacity innovation development appreciation in western China. In this paper, 16 cities of the Outline of the Construction Plan of the Twin-City Economic Circle of Chengdu-Chongqing Region are used as the research objects, and the number of inter-city co-authorship indicates the strength of network side connection to construct a regional knowledge innovation network. In this study, the Wanfang Data Knowledge Service Platform and Web of Science database multi-source databases were selected to ensure the robustness of the data. The study period was 2010–2018, and we considered the number of co-authored papers between cities among 16 cities in the Chengdu-Chongqing twin circle. The data of independent authors and collaborators in the same city need to be excluded, and the papers involving cross-city collaborative links are split, e.g., if a paper is completed by scholars from Sichuan University and University of Electronic Science and Technology, characterizing the Chengdu-Chengdu linkage, it is not in scope of the study. The output of papers with cross-regional collaboration is considered, such as a paper with authors from Sichuan University, University of Electronic Science and Technology, and Chongqing University, whose corresponding cities are Chengdu, Chengdu, and Chongqing, and since the study does not consider intra-city collaboration, one collaborative link between Chengdu and Chongqing is finally obtained. Finally, all the links are summed up to construct a regional research collaboration network in the twin-city economic circle of Chengdu-Chongqing region.
3.2. Research Methods
3.2.1. Social Network Analysis
Social network analysis is a method that explores the structure and attributes of actors’ social networks, starting from their mutual actions and interrelationships [
49]. Social network analysis is a social science research paradigm, and the gradual application of regional network structure research helps to characterize the attributes and spatial structure of regional urban network nodes and their evolutionary trends. In this study, social network analysis is used to describe the relationship between node cities in regional research and innovation networks, network density, and average path length in the overall network and individual networks, to study network scale, network structure, and complex network characteristics [
50]. The overall characteristics are mainly measured by network density, average clustering coefficient, average path length, and other indicators. By studying the overall characteristics of the network, the overall situation of the innovation cooperation network can be clarified [
51]. The individual characteristics of the network are measured by centrality indicators, which allow us to quantify the position and power of nodes. Identifying the ‘core-edge’ structure of a network allows for the identification of the network hierarchy of nodes.
Network density is the ratio of the actual number of links between node cities in a network to the maximum possible number of links in the entire network, i.e., any two nodes have an edge connection with a theoretical value of 1. This reflects the sparseness of network organization and the average degree of interaction between nodes in the network [
52]. The higher the network density, the more links there are between the node cities and other cities in the region, indicating a high degree of permeability in the innovation network structure and a tendency for cities in the region to be homogeneous in their research cooperation development. The formula is as follows:
where
n denotes the number of node cities in the region and
Pij is the amount of innovation cooperation between city
i and city
j.
The clustering coefficient is the ratio of the actual number of relationships between a node in the network and its neighboring nodes to the maximum number of possible relationships and measures the degree of aggregation of nodes in the network. The average clustering coefficient is the average of the clustering coefficients of the nodes in the network, and this paper reflects the closeness of the research cooperation between cities. The calculation formula is as follows:
where
n denotes the number of node cities in the region,
Ei denotes the actual number of relationships between nodes adjacent to node
i, and
ki denotes the number of nodes adjacent to node
i.
The average path length is the average of the distance between any two nodes in the network. A smaller average path means that the fewer transit times required between any two cities in the innovation network, the better the accessibility, reflecting the degree of separation of nodes in the innovation network, an important indicator to measure the spatial organization efficiency of the network. The calculation formula is as follows:
where
L denotes the average path length and
dij denotes the distance between node
i and node
j, using the number of edges on the shortest path connecting the two nodes.
Network centrality is used to measure the importance or hierarchy of node cities in innovation networks. In this paper, we choose degree centrality and intermediate centrality to visually reflect the importance of node cities in regional innovation networks in both quantitative and qualitative dimensions.
Degree centrality (
CDi) measures the position of a node city in the network and the sum of the number of effective connections between the node and other cities. The higher the degree centrality, the more important the node is at the center of the network. In a regional innovation network, degree centrality indicates the number of cities in which a city has direct innovation links with other node cities to generate thesis partnerships. The formula is:
where
CDi refers to degree centrality,
n refers to the number of cities with which city
i has innovation interactions;
Pij is the number of innovation collaborations between city
i and other cities.
Betweenness centrality (
CBi) indicates the number of times the node helps any two other cities in the network to connect with each other on the shortest path, as well as the node’s ability to control innovation resources in the network. Intermediate centrality is where a city acts as a ‘bridge’ in the innovation network [
53]. The formula is:
where
CBi refers to intermediate centrality and
n refers to the number of cities with which city
i has innovative interactions;
is the number of shortcuts for innovation
cooperation between city
j and city
k;
represents the total number of shortest paths between city
j and city
k for city
i.
3.2.2. Exponential Random Graph Model
The exponential random graph model (ERGM) is a statistical model for studying the structure of networks and can be used to explain the connections in a network and the reasons for their formation, explaining the observed influences on the formation mechanisms of the network through a form similar to logistic regression. The exponential random graph model is considered to be the most effective tool for empirical analysis of theories related to social network science to explore the formation mechanism of regional research cooperation and innovation networks [
54]. Exponential random graph models can incorporate network structure, node attributes, and covariate relationships into the model for analysis, and can be used to explain linkage relationships in innovation networks and the reasons for link formation, considering the role played by node cities in scientific collaboration and the influence of external network relationship covariates on them, and for explaining whether the formation of linkage relationships in observed networks originates from the endogenous network structure or the effect of exogenous variables. The basic form of the ERGM is as follows:
In the equation, denotes pure network structure statistics; represents the network statistics after adding the node attributes; denotes the network statistics for joining the covariate network; , , then represent the estimated coefficients of each of the three network structure statistics, indicating the impact on network formation and establishment. is a normalized constant for the distribution and this parameter is primarily used to ensure that the model has an appropriate probability distribution. ERGM models are modelled using the Statnet package in R. The Statnet package provides a comprehensive framework for cross-sectional and dynamic network modelling for ERGM: model estimation, model evaluation, network simulation, and network visualization programming tools.
ERGM can incorporate a variety of network endogenous structure variables into the model. The network endogenous structure variables mainly include the edge and geometric weighting dimensions of the network, involving network interaction effects, expansion effects, convergence effects, transmission effects, etc. In this paper, the number of edges, geometric weighting degree distribution star structure, and interaction k-triangle network structure variables are selected to be included in the model for measurement. The addition of network relationship variables is mainly used to test the influence of the external environment on relationships in regional innovation networks, which are covariate network effects or network embedding effects. The ERGM model is used for estimation, and the basic idea is as follows: Firstly, the initial value of the ERGM model fitting is set using the pseudo-great likelihood estimation method. Then, the network comparison is transformed through the MCMC parameter estimation method until the whole MCMC chain is fully completed. Therefore, according to the estimation idea of the exponential random graph model (ERGM), this paper studies the ERGM model contains network structure variables, node attribute variables, and network relationship covariates, which can explain the formation and evolution of innovation networks (see
Table 1). The ERGM is used to investigate which factors influence the formation of regional innovation networks and to measure the degree of influence of each influencing factor on regional innovation networks.
4. Evolution and Structural Features of Regional Innovation Networks
4.1. Evolution Characteristics of Regional Innovation Network
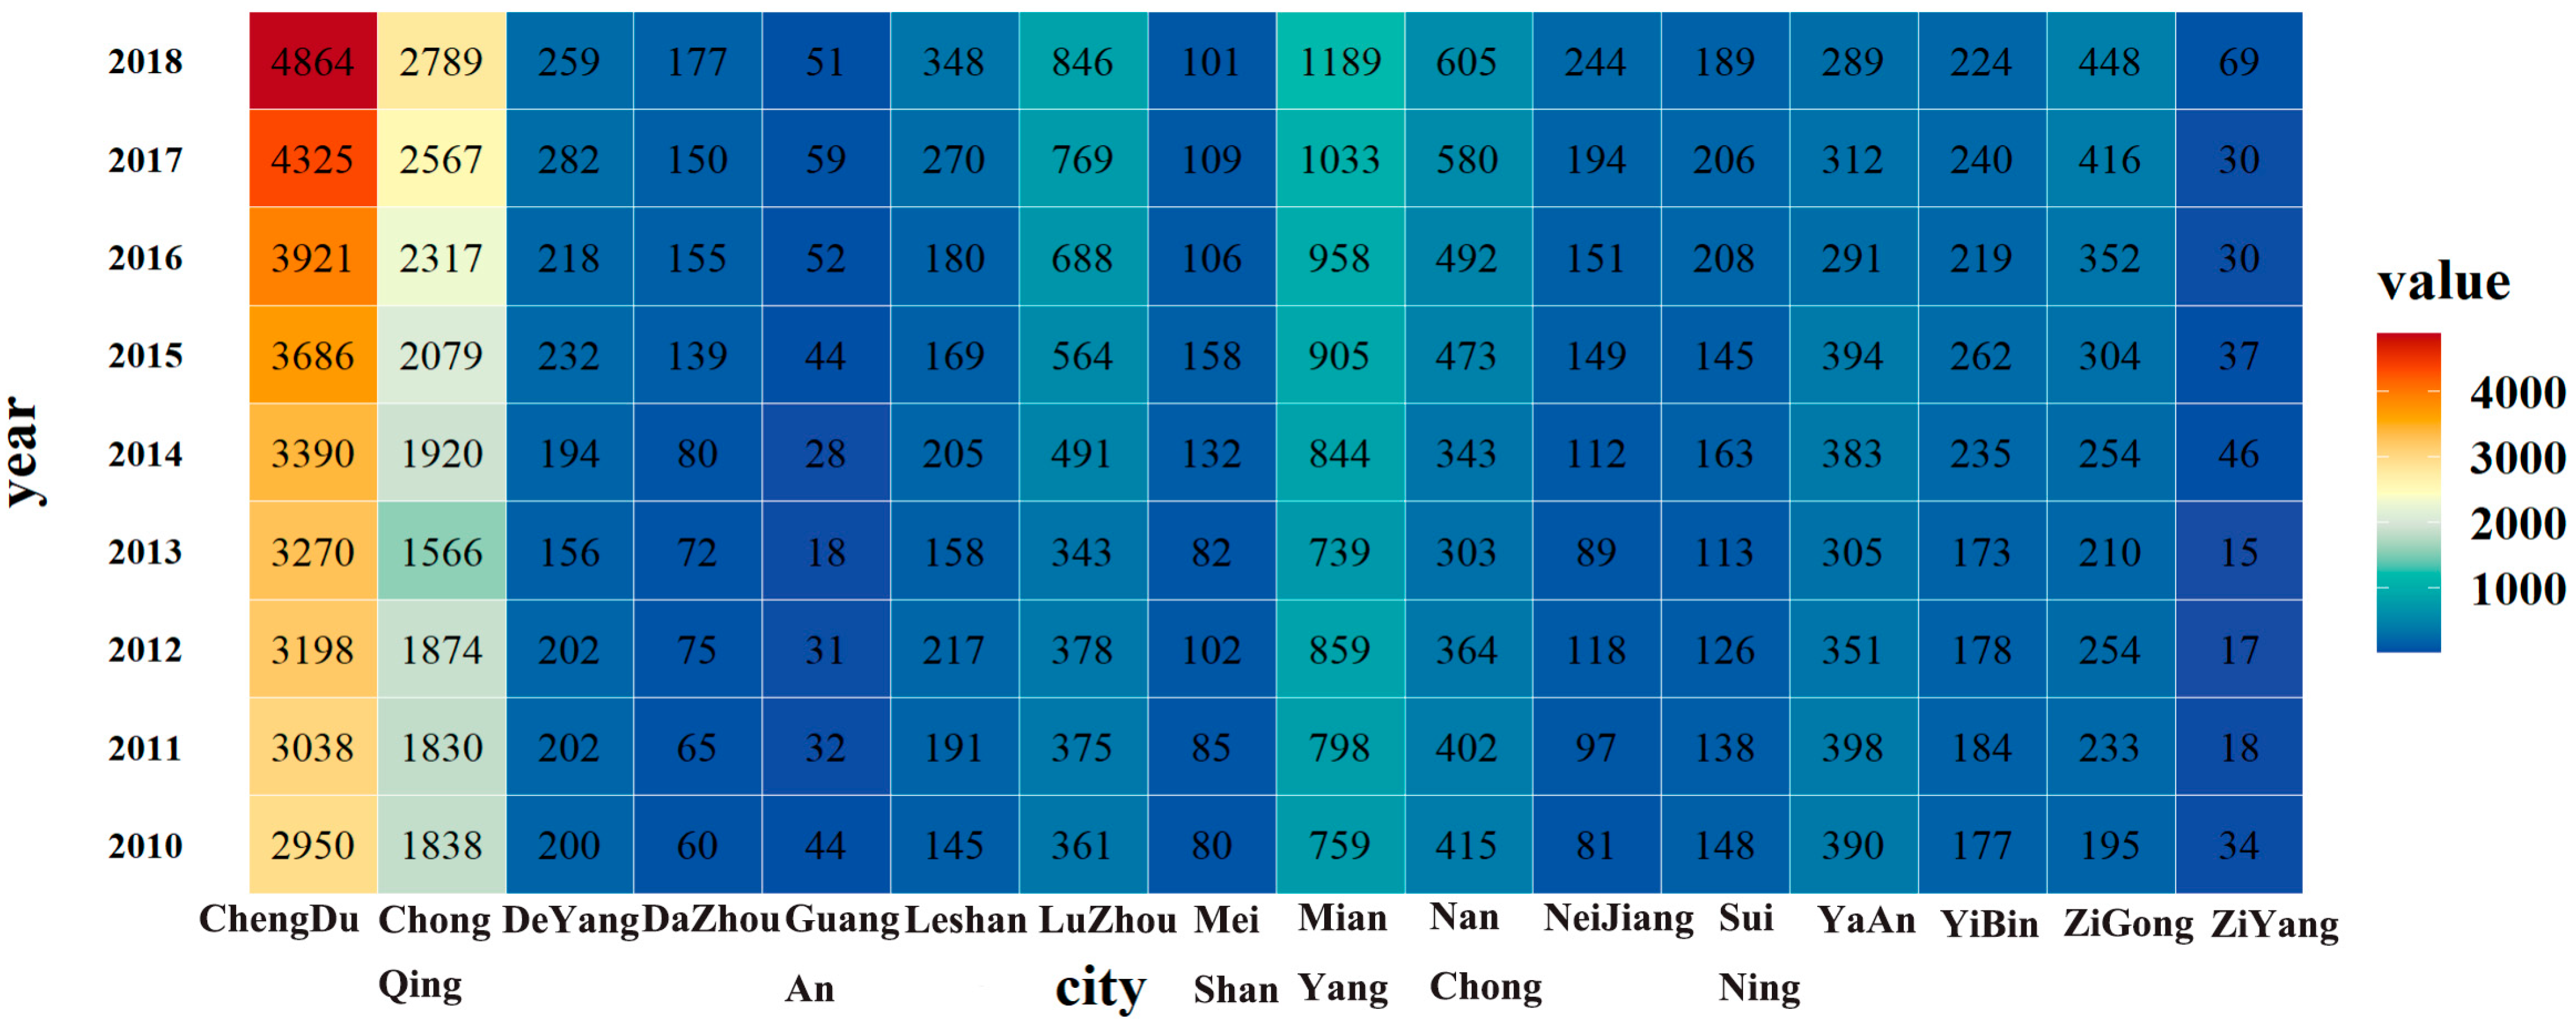
During the study period, the synergistic and collaborative ties between cities in the twin-city economic circle of the Chengdu-Chongqing region have deepened and the degree of networking has increased. The state of innovation collaboration in the twin-city economic circle of the Chengdu-Chongqing region during the study period is mapped through the color key in the heat map in
Figure 1, from 7877 papers in 2010 to 12,692 papers in 2018, an increase of 1.61 times. Through the change of the heat map chroma key, the color change of co-authored papers within the Chengdu-Chongqing urban agglomeration during the study period is significant with Chengdu and Chongqing chroma key colors, and the annual growth rate of the number of co-authored papers is 8.2% and 6.5% respectively, while the number of co-authored papers in other cities has increased significantly from the early stage of the study. The change in the heat map color key from 2010–2018 shows that the Chengdu and Chongqing cities of the Chengdu-Chongqing Economic Circle Innovation Network have high heat values, the cities of Luzhou, Mianyang, and Ya’an have medium heat values, and the other cities have low heat values.
4.2. Network Topology Analysis
During the study period, regional innovation linkages have deepened, networking has increased, and the network structure has become extremely heterogeneous, with a tendency to concentrate on certain hub nodes and a ‘center–periphery’ structure, from a ‘monocentric radial. The network structure has become more and more heterogeneous, with a tendency to concentrate on certain hub nodes. As can be seen from
Table 2, the innovation network showed an expansion trend from 2010 to 2018 with the network scale, i.e., the number of nodes, expanding continuously, and the number of nodes in the region reached 16 in 2018, indicating that all 16 node cities in the region have established innovation cooperation relationships with other cities; the number of network relationships has increased significantly over time, from 44 in 2010 to 110 in 2018, but the number of theoretical network relationships is still far from the ideal number of 240 relationships (16 × 15), indicating that there is more potential and room for the development of innovation networks in the region. The overall network density value during the study period is small and increases slowly, with a maximum of only 0.25. The overall structure of the intra-regional innovation network is loose, which shows that there is a high degree of heterogeneity in innovation cooperation between internal cities [
30], and the links between node cities have not yet formed a strong connection. This is basically consistent with the results of innovation network density obtained by Sun Zhongrui et al. using inter-city patent cooperation data of the Chengdu-Chongqing urban agglomeration. The average node degree increased from 2.625 at the beginning of the study period to 3.667 at the end of the period, with a small increase, reflecting the slow increase in the number of urban innovation cooperation objects. The ratio of the density of intra-community ties to the density of inter-community ties is measured by the Community Detection indicator (0.087 to 0.261), which shows that the characteristics of community structure in the network are not prominent, innovation cooperation nodes have a preference for homogeneity, innovation cooperation is biased towards the “acquaintance” society. The path-dependent nature of innovation networks is highlighted, and the unevenness of innovation links is prominent.This may be due to the late construction of urban agglomerations in the Chengdu-Chongqing region and the low level of inter-city collaboration [
31]. The average path length of the innovation network in the twin-city economic circle of Chengdu-Chongqing region decreases from 1.663 to 1.583, and the clustering coefficient increases from 0.645 to 0.822. The value of the average path length of the innovation network decreases slowly and is overall smaller than that of the random network, indicating that the regional innovation network shows small-world characteristics, good access to the innovation network, and that the multiple resource factors in the network can flow quickly and improve the overall innovation efficiency The average path length of a regional innovation network decreases slowly and is smaller than that of a random network. Over time, the “small-world” characteristics of the regional innovation network become more obvious, and the exchange and cooperation between nodes have become more fluid and unhindered, as a result of the popularization of public infrastructure in the Chengdu-Chongqing twin circle and the reduction of transportation and communication costs.
4.3. Innovation Network Space Evolution Analysis
Innovation network visualization is integrated with statistical modelling to better present the characteristics of innovation development and innovation linkages between cities. The visual representation of inter-city innovation flow connections is carried out by means of chord diagrams, with the length of the arcs indicating the size of the city’s elemental attributes and the thickness of the connecting lines between nodes, the chords—reflecting the strength of the connections, visually revealing the topological interactions between city nodes. ArcGIS 10.2 is used to calculate the distribution of innovation connection flow strengths with Using ArcGIS 10.2 to calculate the distribution of innovation linkage flow intensity with geospatial overlay to sort out the spatial pattern and topological network comparison of the twin-city economic circle in the Chengdu-Chongqing region (see
Figure 2).
In this paper, the innovation network in the Chengdu-Chongqing region is structured as a “double-core” to “multi-center” network, and the radiation range of the innovation network shows a single-core diffusion to a “trunk-branch” hierarchical diffusion. The innovation network is spreading from a single nucleus to a “trunk-branch” hierarchy. In the process of regional innovation networking, the center of innovation cooperation is concentrated in Chengdu, which is the center of innovation exchange with the Chengdu Plain Urban Agglomeration cities. The centrality and innovation linkage values of Chengdu and Chongqing are increasing, reflecting the rapid increase of the importance of the two core cities in the innovation network, and their innovation spillover effect is becoming more and more significant. From the point of view of centrality, from 2010 to 2018, Chengdu was the core of the regional innovation network, with its degree centrality 35.71% higher than that of Chongqing, which is in second place. The number of innovation connections between these two core cities and other node cities in the region accounted for 80.32% of the whole region. The degree centrality of cities, such as Mianyang, Luzhou, and Zigong, in the regional innovation network has slightly increased, and the overall structure has changed from a “Chengdu-Chongqing” dual-core structure to a “Chengdu-Chongqing-Mianyang-Luzhou” multi-tier structure. The evolution of the regional innovation network shows diversified, complex, and structural characteristics. Cities, such as Mianyang and Luzhou, as secondary cores in the regional innovation network, have outstanding levels of economic and social development, attracting a large number of research institutes and high-tech industrial clusters, and have great potential and room for improvement. The regional innovation network Chengdu is the core of the regional innovation network, and the innovation effect is radiated to cities in the Chengdu plain, such as Mianyang and Ya’an, forming a group of cities in the west and north of Sichuan to expand to the east, while Chongqing mainly influences and radiates cities in the northeast and south of Sichuan, and has a unique basin spatial dependence with Luzhou, Yibin, and other basin cities for innovation links. These cities are in the middle of the region, which intuitively forms an obvious central collapse zone for innovation, and the spatial pattern of the innovation network “dense in the west and sparse in the east, collapsing in the center”. The spatial pattern of the ‘dense west and sparse east’ innovation network has led to spatial fragmentation and imbalance, resulting in greater challenges to the collaborative development of regional innovation.
5. Analysis on Formation Mechanism of Regional Innovation Network
ERGM can incorporate a variety of network endogenous structure variables into the model. The network endogenous structure variables mainly include the edges and geometric weighting dimensions of the network, involving network interaction effects, expansion effects, convergence effects, transmission effects and so on. In this paper, Edges, Gwodegree, and Gwesp network structure variables are selected to be included in the model for measurement. In terms of nodal attribute variables, this paper assumes that the individual characteristics of cities themselves can influence the propensity of other cities to establish innovation cooperation relationships with them. In this paper, R&D, research institution, university, PGDP, and R&D researchers are selected as city attribute proxies to examine the collaborative innovation capability within the region [
55]. The addition of network relationship variables is mainly used to examine the influence of the external environment on relationships in regional innovation networks, which are covariate network effects or network embedding effects. Based on the multidimensional proximity analysis framework, for the specificity of the complex proximity relationships possessed by the twin-city economic circle in the Chengdu-Chongqing region, with the help of the multidimensional proximity framework, this paper examines the relationship between geographical proximity, cognitive [
56], social [
57], and institutional proximity. This paper considers the interaction of the evolution of regional innovation networks in five dimensions of proximity: geographical proximity, cognitive proximity [
56], social proximity [
57], institutional proximity, and cultural proximity. The five network variables, namely geographical proximity network, cognitive proximity network, social proximity network, institutional proximity network, and cultural proximity network, are used to detect the explanatory and driving forces of network relationship covariates on the establishment of relationships in the network in response to the specificity of the complex proximity relationships possessed by the twin-city economic circle in the Chengdu-Chongqing region [
58].
In order to explore the mechanism of regional innovation network formation, the ERGM model is used for empirical testing, and an ERGM benchmark model containing network structure variables, city endowment characteristics, and proximity relationship network covariates is constructed. The basic idea of using the ERGM model for estimation is as follows: Firstly, the initial value of the ERGM model fitting is set using the pseudo-great likelihood estimation method, and then the network comparison transformation is carried out through the MCMC parameter estimation method until the whole MCMC chain is fully completed. Therefore, according to the estimation idea of the exponential random graph model (ERGM), on the basis of the above-mentioned variable selection, ERGM is then applied to study which factors actually influence the formation of regional innovation network and to measure the degree of influence of each influencing factor on the regional innovation network. The empirical analysis of this paper is based on the estimation, simulation, comparison, and testing of the model with the help of the Statnet package in R.
From the regression estimation results in
Table 3, it can be seen that ERGM benchmark model 1 selects network structure variables, such as Edges, Gwodegree, Gwesp, and Gwdsp, and incorporates city attributes including R&D, research institution, university, PGDP, R&D researcher. Model 2 incorporates neighborhood network relationships to include geographic proximity networks, cognitive proximity networks, social proximity networks, cultural proximity networks, and institutional proximity networks. Model 3 incorporates all of the above network structure variables, city endowment variables, and proximity network relationship variables [
35].
The number of edges in model 1 is used as the benchmark comparison, and the number of edges is significantly negative at the 0.1% level, and the standard error decreases year by year, indicating that the network density of regional innovation networks is low, and the node cities’ innovation linkage status changes from sparse to dense during the evolution of regional innovation networks. The coefficient of Gwdsp is significant and positive at the 1% level, and the coefficient of Gwesp is 0.474984 and significant at the 1% level. This indicates that there are multiple connections in the regional innovation network, and the connection paths tend to be closed, forming a closed triad.
There is a large amount of transmissibility triangulation in the regional innovation network, a tendency for cities in dense regions in the network to overlap in transmissibility, a tendency for community division, and a tendency for cohesive subgroups of small groups present in the network to guide the overall network. The regression results of city endowment characteristics show that the three attributes of PGDP per capita, higher education institutions, and research institution personnel are significantly heterogeneous, and the attributes of R&D costs and research institutions pass the significance test, but the coefficients do not vary significantly, indicating that in the process of mutual selection between nodes and nodes of the regional innovation network, cities with good levels of economic development and innovation development favor, in the early stage of the network, the same level of development. In the early stage of the network, cities with a good level of economic development and innovation development prefer to collaborate with cities of the same level of development, and the network nodes have high assortativity and low hetero-assortativity. Compared to cities with low research capital investment, cities with high research capital investment have less need for collaborative innovation with other cities because they have abundant innovation resources and strong independent research capabilities.
In Model 2, geographical proximity network, social proximity network, cognitive proximity network, cultural proximity network and institutional proximity network are introduced into the model to consider the influence of network exogenous factors on inter-regional research cooperation. The coefficients of social proximity and cognitive proximity are positive and significant, indicating that social proximity networks, cognitive proximity networks, and innovation networks are symbiotic and mutually reinforcing, and both of them increase the probability of forming innovation relationships. The coefficient on the cultural proximity network is negative and insignificant, and the coefficient on the institutional proximity network is positive and significant, meaning that cultural proximity has a minimal effect on innovation network relationships.
Finally, model 3 incorporates all the influencing factors into the model, and by comparing the AIC and BIC of the model, the fit effect realized by model 3 can better explain the formation mechanism of inter-regional innovation networks. The endogenous level of the network shows that there are regional innovation networks with multiple connectivity in the network, and the node linking paths present a large amount of transmissive triangulation, which drives the network towards complexity and multiplicity. The city attributes of PGDP per capita, the number of higher education institutions, and number of researchers have a catalytic effect on regional innovation. The proximity network relationship reflects that the central cities in the region are more inclined to carry out collaborative innovation with other cities in the same province, and the provincial capital cities are more likely to drive the innovation competitiveness of other cities in the province. The exchange of knowledge, information, and technology between cities in the same province is less costly, and it is easier to guide and manage the process of knowledge creation and collaborative innovation. Previous collaborative experiences help to strengthen trust between city actors, but as innovation networks evolve, actors in the network tend to establish innovation relationships with actors who have no collaborative experiences in order to explore new knowledge and access new resources [
37].
6. Conclusions and Discussion
This paper takes 16 cities in the twin-city economic circle in the Chengdu-Chongqing region as the research object, constructs a regional innovation network based on inter-city co-authored thesis data from 2010 to 2020, acquires data, and builds a model using social network analysis, spatial network analysis, and the exponential random graph model, systematically analyzes the network structure, spatial pattern, and network formation mechanism of the regional innovation network in the twin-city economic circle in the Chengdu-Chongqing region, and draws the following conclusions.
From the perspective of network evolution, the network scale is expanding, and the network structure is becoming more complex. In 2010–2020, the scale of the regional innovation network gradually expanded, with a non-equilibrium innovation network with Chengdu and Chongqing as the twin cores and cities, such as Mianyang and Luzhou, as the secondary cores formed within the network, with Chengdu and Chongqing playing an important role in terms of resource radiation and bridging in the network, and the phenomenon of twin-core dominance is prominent. The innovation network tends to be small-world in nature, the network density is small overall, the level of collaborative innovation in city clusters is low, and close cooperation between cities has not yet been formed.
The spatial structure of the regional innovation network shows significant “unbalanced” characteristics, as analyzed by the evolution of the spatial pattern of the innovation network. The spatial structure of the regional innovation network shows an obvious Chengdu-Chongqing dual-core structure, with Chengdu as the core innovation spillover and innovation clusters with cities, such as Mianyang and Ya’an, and Chongqing as the core innovation linkage with basin cities, such as Luzhou and Yibin, which have a unique basin spatial dependency. However, Zigong and Meishan, which are in the hinterland of Chengdu-Chongqing region, lack innovation-energy innovation linkage, which intuitively forms an innovation central collapse. The spatial pattern of the innovation network, which is “dense in the west and sparse in the east and collapsed in the center”, has led to spatial fragmentation and imbalance in the network, which poses a great challenge to the collaborative development of regional innovation.
With regard to the innovation network formation mechanism, network structure variables and neighboring network relationship variables have a significant impact on the formation of innovation networks. The heterogeneity of innovation development stages is closely related to the geographical location, resource base, infrastructure, economic and social development, and planning policies of cities, and requires the formulation of policies to match the market base. Cognitive proximity networks and social proximity networks always play a positive role in network formation. Cognitive proximity networks and social proximity networks have overlap. Similar knowledge structures and technology bases between cognitive proximity cities can promote innovation cooperation, but in the long run, it will cause a lack of knowledge collision and knowledge kinetic output, leading to negative effects, such as path dependence and technology locking. Institutional proximity presents a positive direction for network relations, implying similar institutional environments and preferential innovation policies, which are conducive to promoting innovation cooperation and eliminating hidden barriers. In the future, we will actively promote the construction of the integrated innovation development of the twin-city economic circle in the Chengdu-Chongqing region, further improve the layout of science and technology factor resources, introduce high-end innovation talent teams as soon as possible, improve the innovation development environment, and form a robust, efficient, and cooperative innovation network.
This study contributes more than previous studies on urban innovation networks, in which EGRM was used to measure the endogenous structure and external environmental attributes of the network, and the selection of indicators was subjective. The spatial scale of the study only considers the twin-city economic circle of Chengdu and Chongqing, but there is also cooperation between Chengdu, Chongqing, and cities outside the region, so the “multi-scale” characteristics of the innovation network can be further studied from the perspective of “local buzz and global pipeline”. The innovation network is a multi-level and multi-dimensional complex network. In addition to thesis cooperation among researchers, patent transfer, talent flow, and innovation linkage among high-tech enterprises are also important. Subsequent research can analyze the coupling relationship between the knowledge innovation network and technology innovation network in terms of the “innovation chain”. Finally, the network matrix is constructed using a full-count approach, assuming equal status of the collaborating parties and ignoring the differences in the contributions of the paper co-authors, which can be optimized in the future by using a weighted fractional count approach.


