Article

Spatial Layout Assessment of Urban Mining Pilot Bases in China Based on Multi-Source Data Collaboration

School of Geosciences and Info-Physics, Central South University, Changsha 410083, China
*
Author to whom correspondence should be addressed.
Sustainability 2023, 15(10), 7977; https://doi.org/10.3390/su15107977
Submission received: 14 April 2023 / Revised: 9 May 2023 / Accepted: 11 May 2023 / Published: 13 May 2023
(This article belongs to the Section Sustainable Engineering and Science)

Abstract

:
Rapid urbanization in China has led to an exponential increase in the stocks of metals used in cities. Exploring their amount and growth patterns is an important way to forecast future metal demand and identify the potential for urban mining. Here, we use a combination of bottom-up and GIS tools to estimate the amount of in-use stocks and scrap metal of steel, copper, and aluminum in 366 regions of mainland China from 2010 to 2020. We then downscaled the 2020 metal scrap volume based on a multi-source dataset of socioeconomic factors. Finally, the accessibility of the urban mining pilot base (UMPB) was calculated using the two-step floating catchment area method (2SFCA), and the spatial layout assessment analysis of the UMPB was conducted under the supply–demand balance perspective. The results showed that the total in-use stocks of steel, copper, and aluminum increased from an initial 3186 million tons to 5216 million tons, with a corresponding trend of continued growth in the amount of metal scrap. The high value of scrap metal in 2020 is concentrated in the Beijing–Tianjin–Hebei urban agglomeration, the Yangtze River Delta region, and the Chengdu–Chongqing metropolitan area. The accessibility results show that the road network distance-based accessibility covered a smaller area than the Euclidean distance-based accessibility, but when the UMPB service radius was set to 300 km, the road network distance-based accessibility could also cover most of the eastern part of China. The spatial evaluation results of UMPB show that for service radii of 200 km and 300 km, low-supply and high-demand areas account for 6.32 percent and 5.89 percent, respectively.

1. Introduction

With accelerated industrialization and urbanization, waste is rapidly accumulating in cities, placing a greater burden on urban spaces. One of the main reasons for the overconsumption of material resources in cities is the traditional linear economic model that has long existed in society, in which material resources generally flow by way of “take-make-dispose” [1]. Landfills are the final destination in the flow of material resources, which can lead to increasingly serious urban environmental problems [2]. As a result, governments are taking actions focused on circular economy and sustainable development. Large quantities of materials have been extracted from in-ground ore deposits and used as raw materials to make many types of man-made products [3], especially in the infrastructure and building industries. The amount of these materials stocked in the built environment is generally referred to as the in-use stocks of materials [4]. The in-use stocks of materials are considered future urban mines that can be transformed into new resources after being discarded [5], while increasing the proportion of recycled resources allows for less reliance on raw materials. Scrap metals not only have a high recycling value but also represent the future potential of metal recycling; therefore, there has been growing interest in understanding metal in-use stocks in recent years.
Metal in-use stocks play an important role in the metabolism of socioeconomic systems, which are closely related to human life and are important carriers of housing, transportation, etc. When products that exist in society reach the end of their useful lives, the materials contained in them can be recycled and reused. Consequently, the question of what amount of urban minerals in a country or region can be exploited, and when to exploit them to maximize the benefits, is a pressing one. Estimating the metal in-use stocks and clarifying their spatial and temporal distribution can help assess their future development potential and can guide the orderly recycling of scrap metals [6].
The recycling and disposal of scrap metal is a thorny issue. Informal means of recycling and disposal can make the metal underutilized and can also contaminate the soil and water with the harmful substances in the products. In 2010, China’s National Development and Reform Commission (NDRC) and the Ministry of Finance (MOF) together promoted the construction of thirty UMPBs across the country over five years to improve the recycling rate of urban minerals. The construction target was subsequently increased to 50. The UMPB has strengthened industrial clustering, and there is a complete industrial chain for waste disposal and reuse within the base. In addition, the concentration of production technology helps to increase the efficiency and economic benefits of resource regeneration.
As of 2015, China has established 49 UMPBs, largely meeting the projected target. However, during the five-year period from 2016 to 2020, nine UMPBs were withdrawn in quick succession, mainly due to operational and management issues. The approval process of the UMPB is mainly based on the subjective judgment of experts and does not take into account the spatial service benefits of the pilot base and the resource supply capacity in the service area. The neglect of the spatial benefits of the demonstration bases can lead to long-term imbalances in the supply and demand of resources for the bases, which in turn can lead to their operational difficulties and decay.
The purpose of this study is to estimate the in-use stock and scrap metal quantities of typical metals contained in urban minerals to explore the mining potential and recycling demand of urban minerals and to assess the spatial layout of the UMPB based on accessibility calculations. First, we used a top-down approach to account for typical metal in-use stocks in 363 Chinese regions, and based on this, we estimated metal scrap from provincial data published in the literature. Then, we performed accessibility measures based on the 2SFCA method and combined the scrap amount and accessibility to evaluate the spatial layout of UMPBs from a supply–demand matching perspective.
The following are the two major contributions to this research:
(1)
We propose a spatialization method for metal scrap volume by region and use the method to map the scrap volume of steel, copper, and aluminum in mainland China at a 1 km resolution.
(2)
We use road network distance to express the transportation distance from the demand point to the UMPB, which is more realistic and accurate than Euclidean distance. Additionally, based on accessibility, we measure the match between the service intensity provided by the UMPB and the actual end-of-life demand at the demand point, which provides a reference for the layout optimization of the UMPB.
The remainder of this paper is organized as follows. Section 2 is a review of the relevant research. Section 3 introduces statistical data-based methods for estimating typical metal in-use stock and scrap metal quantities and describes the approach to accessibility metrics as well as the spatial layout assessment method. Section 4 provides the experimental results and analysis. Section 5 summarizes the content of this article and puts forward future outlooks.

2. Related Work

Most studies that have accounted for material in-use stocks have been product- or element-oriented. Among the product-oriented studies, building materials, and electrical appliances were the research hotspots. With continued urbanization, the stock of the urban built environment has expanded further over the past few centuries [7]. Wiedenhofer et al. [8] estimated the in-use stock of non-metallic minerals in residential buildings, roads, and railroads in the EU-25 from 2004–2009. Their findings suggest that the five-year average growth rate for in-use non-metallic stocks is about 1 percent, and they predicted that growth in in-use stocks would slow to 0.7 percent in 2020. Electronic products are ubiquitous in modern society, and the number of electronic products is rapidly increasing around the world [9]. At the same time, continuing technological innovation has led to the shortening of the end-of-life cycle of electronics [10], and the management of electronic waste has been considered a great challenge for human society. Electronics contain high-tech mineral resources with high recycling value, but end-of-life electronics contain some heavy metals and other toxic substances [11], so it is urgent to strengthen the recycling management of electronic waste. The estimation of the in-use stocks and end-of-life of electronic products can help guide the development of recycling strategies; thus, many researchers have conducted studies on electrical and electronic equipment at the national and regional levels [12,13,14].
Previous studies have quantified in-use metal stocks using either the top-down approach based on the use of product consumption data and lifetime distribution models or the bottom-up approach based on the quantities of in-use products and their metal intensities [15,16]. The top-down approach is to calculate the difference between the inflow and outflow in the system to estimate the metal in-use stock, which requires the amount of metal flowing into and out of the system and is generally limited to global or national scales [17]. Wang et al. [18] estimated the steel stocks and flows in 2000 for 68 countries and 9 world regions globally at three scales: global, regional, and national. Their study found that steel stocks in post-industrial countries have stabilized over time and that their steel cycles have a better chance of reaching equilibrium. Pauliuk et al. [19] analyzed the trends of steel in-use stocks in 200 countries worldwide during 1700–2008 and determined that the saturation range of steel stocks per capita was 13 ± 2 t based on developed countries in Europe and the USA. Chinese provinces are generally large in population and extensive in area and may be comparable or even larger than a medium-sized European country. As a result, the spatial distribution of metal stocks in China is more heterogeneous, and the estimated metal stocks in China using the top-down approach are not very meaningful as a reference for the accessibility of provinces and cities.
Compared to studies conducted at the national level, there have been relatively few studies based on a bottom-up approach to evaluate metal in-use stocks at the provincial and municipal levels in China. According to the time-series span of the study, the estimation of metals can be divided into static studies, which are bounded by a certain or discrete number of years, and dynamic studies, which are bounded by a continuous number of years [20]. In the static research, there were more estimated metals for a specific year in large cities, such as the estimated amount of copper in-use stocks in Nanjing in 2009 [21] and the estimated amount of copper in-use stocks in Shanghai in 2012 [22]. Most of the existing bottom-up studies are based on statistical data, but statistical data has administrative boundaries that prevent access to finer-grained data that can support pixel-scale studies. Combining geographic information systems (GIS) with bottom-up quantification provides a new way to obtain small-scale data sets of in-use metal stocks and metal scraps. For example, Liang et al. [23] used DMSP/OLS nighttime lighting data to model the spatialization of steel in-use stocks in Chinese buildings and civil engineering infrastructure. Song et al. [24] used a combination of statistical data and GIS-based methods to estimate steel in-use stocks in Xiamen city during 1980–2015 and produced a 100 m grid resolution steel stock map of Xiamen for 2000 and 2010. However, most of these studies estimate a single metal or a single region as the object of study, which is of limited relevance for resource recovery in a UMPB.
Accessibility was originally proposed by Hasen [25] in 1959. It was first applied to the field of transportation and defined as the magnitude of the chance of interaction between nodes in space. Subsequently, several scholars have extended the concept of accessibility to the field of urban geography to explore regional economic development and its spatial structure. Accessibility is a more flexible concept, commonly defined as the ease of traveling from one point to another [26]. From a spatial perspective, the ability of scarce service resources to be effectively used by people depends on good accessibility. Service resources and demand are often not evenly distributed in space, so an accessibility-based assessment is essentially an assessment of how well resources are allocated. A common method used to measure accessibility is the 2SFCA method, which adequately considers the scale of supply and demand and the impedance of travel [27]. The 2SFCA method was initially used to analyze the distribution of public resources in society by measuring the accessibility of hospitals and schools in a certain area, mostly in the field of healthcare and elderly care [28,29]. With the increased application of the 2SFCA method, various forms of improvement have emerged, and most of the improvements to the method are focused on the improvement of the form of the decay function [30]. The application of this method and other various modified forms to public service facilities has mainly been developed mathematically, but applications in other areas remain more promising.
In this study, we combine a dynamic bottom-up approach with GIS tools to construct mesoscale and microscale urban mining datasets and build a framework for spatial layout assessment based on accessibility measures. Based on the 2SFCA method and the concentric zone theory, we measure the service area of the pilot base by Euclidean distance and road network distance by dividing it into three circles. Then, we analyzed accessibility and metal scrap amounts to see if supply and demand match to obtain an assessment of the spatial layout of existing UMPBs.

3. Materials and Methods

The methodology presented in this study consists of three parts: an estimation method for metal in-use stocks and scraps, an accessibility measure based on the 2SFCA method, and a spatial layout assessment from the supply–demand balance point of view. For the first part, there are two phases: (1) the estimation of metal in-use stock based on the bottom-up method; (2) the spatialization of metal scrap volume based on multi-source data. For the second part, there are two phases: (1) the accessibility measurement based on Euclidean distance; (2) the accessibility measurement based on road network distance. The framework of this study is illustrated in Figure 1.

3.1. Metal in-Use Stocks and Scrap Estimation Methods

3.1.1. Account for in-Use Metal Stocks

Since data on product inventories is becoming available on a city scale, this study uses a dynamic bottom-up approach to account for in-use inventories of steel, copper, and aluminum. The bottom-up approach can be expressed in the following form:
S ( t ) = i = 1 n N i ( t ) × U i ( t )
where S ( t ) is the metal in-use stocks at time t ; N i ( t ) is the amount of final product i in use at time t ; and U i ( t ) is the intensity of use of the corresponding metal in the product i .
The spatial boundary of this study was 366 administrative regions in China, and the stocks were accounted for at the prefecture-level city or smaller level. The quantity of metal-containing products was sourced from the Statistical Yearbooks of each province and the country for the period 2010–2020. Due to the large number of product data and study areas, it is difficult to avoid missing some data. For the case of missing data, two solution strategies were developed in this study. When data for individual years are missing for a region, linear interpolation is used to estimate the missing data between consecutive recorded values. In the case of missing data for some regions, the provincial resource distribution coefficient was obtained by calculating the GDP share of the region in the province and multiplying the provincial data by this coefficient to complete the missing data of the region. The material intensity was sourced from various references [21,31,32].
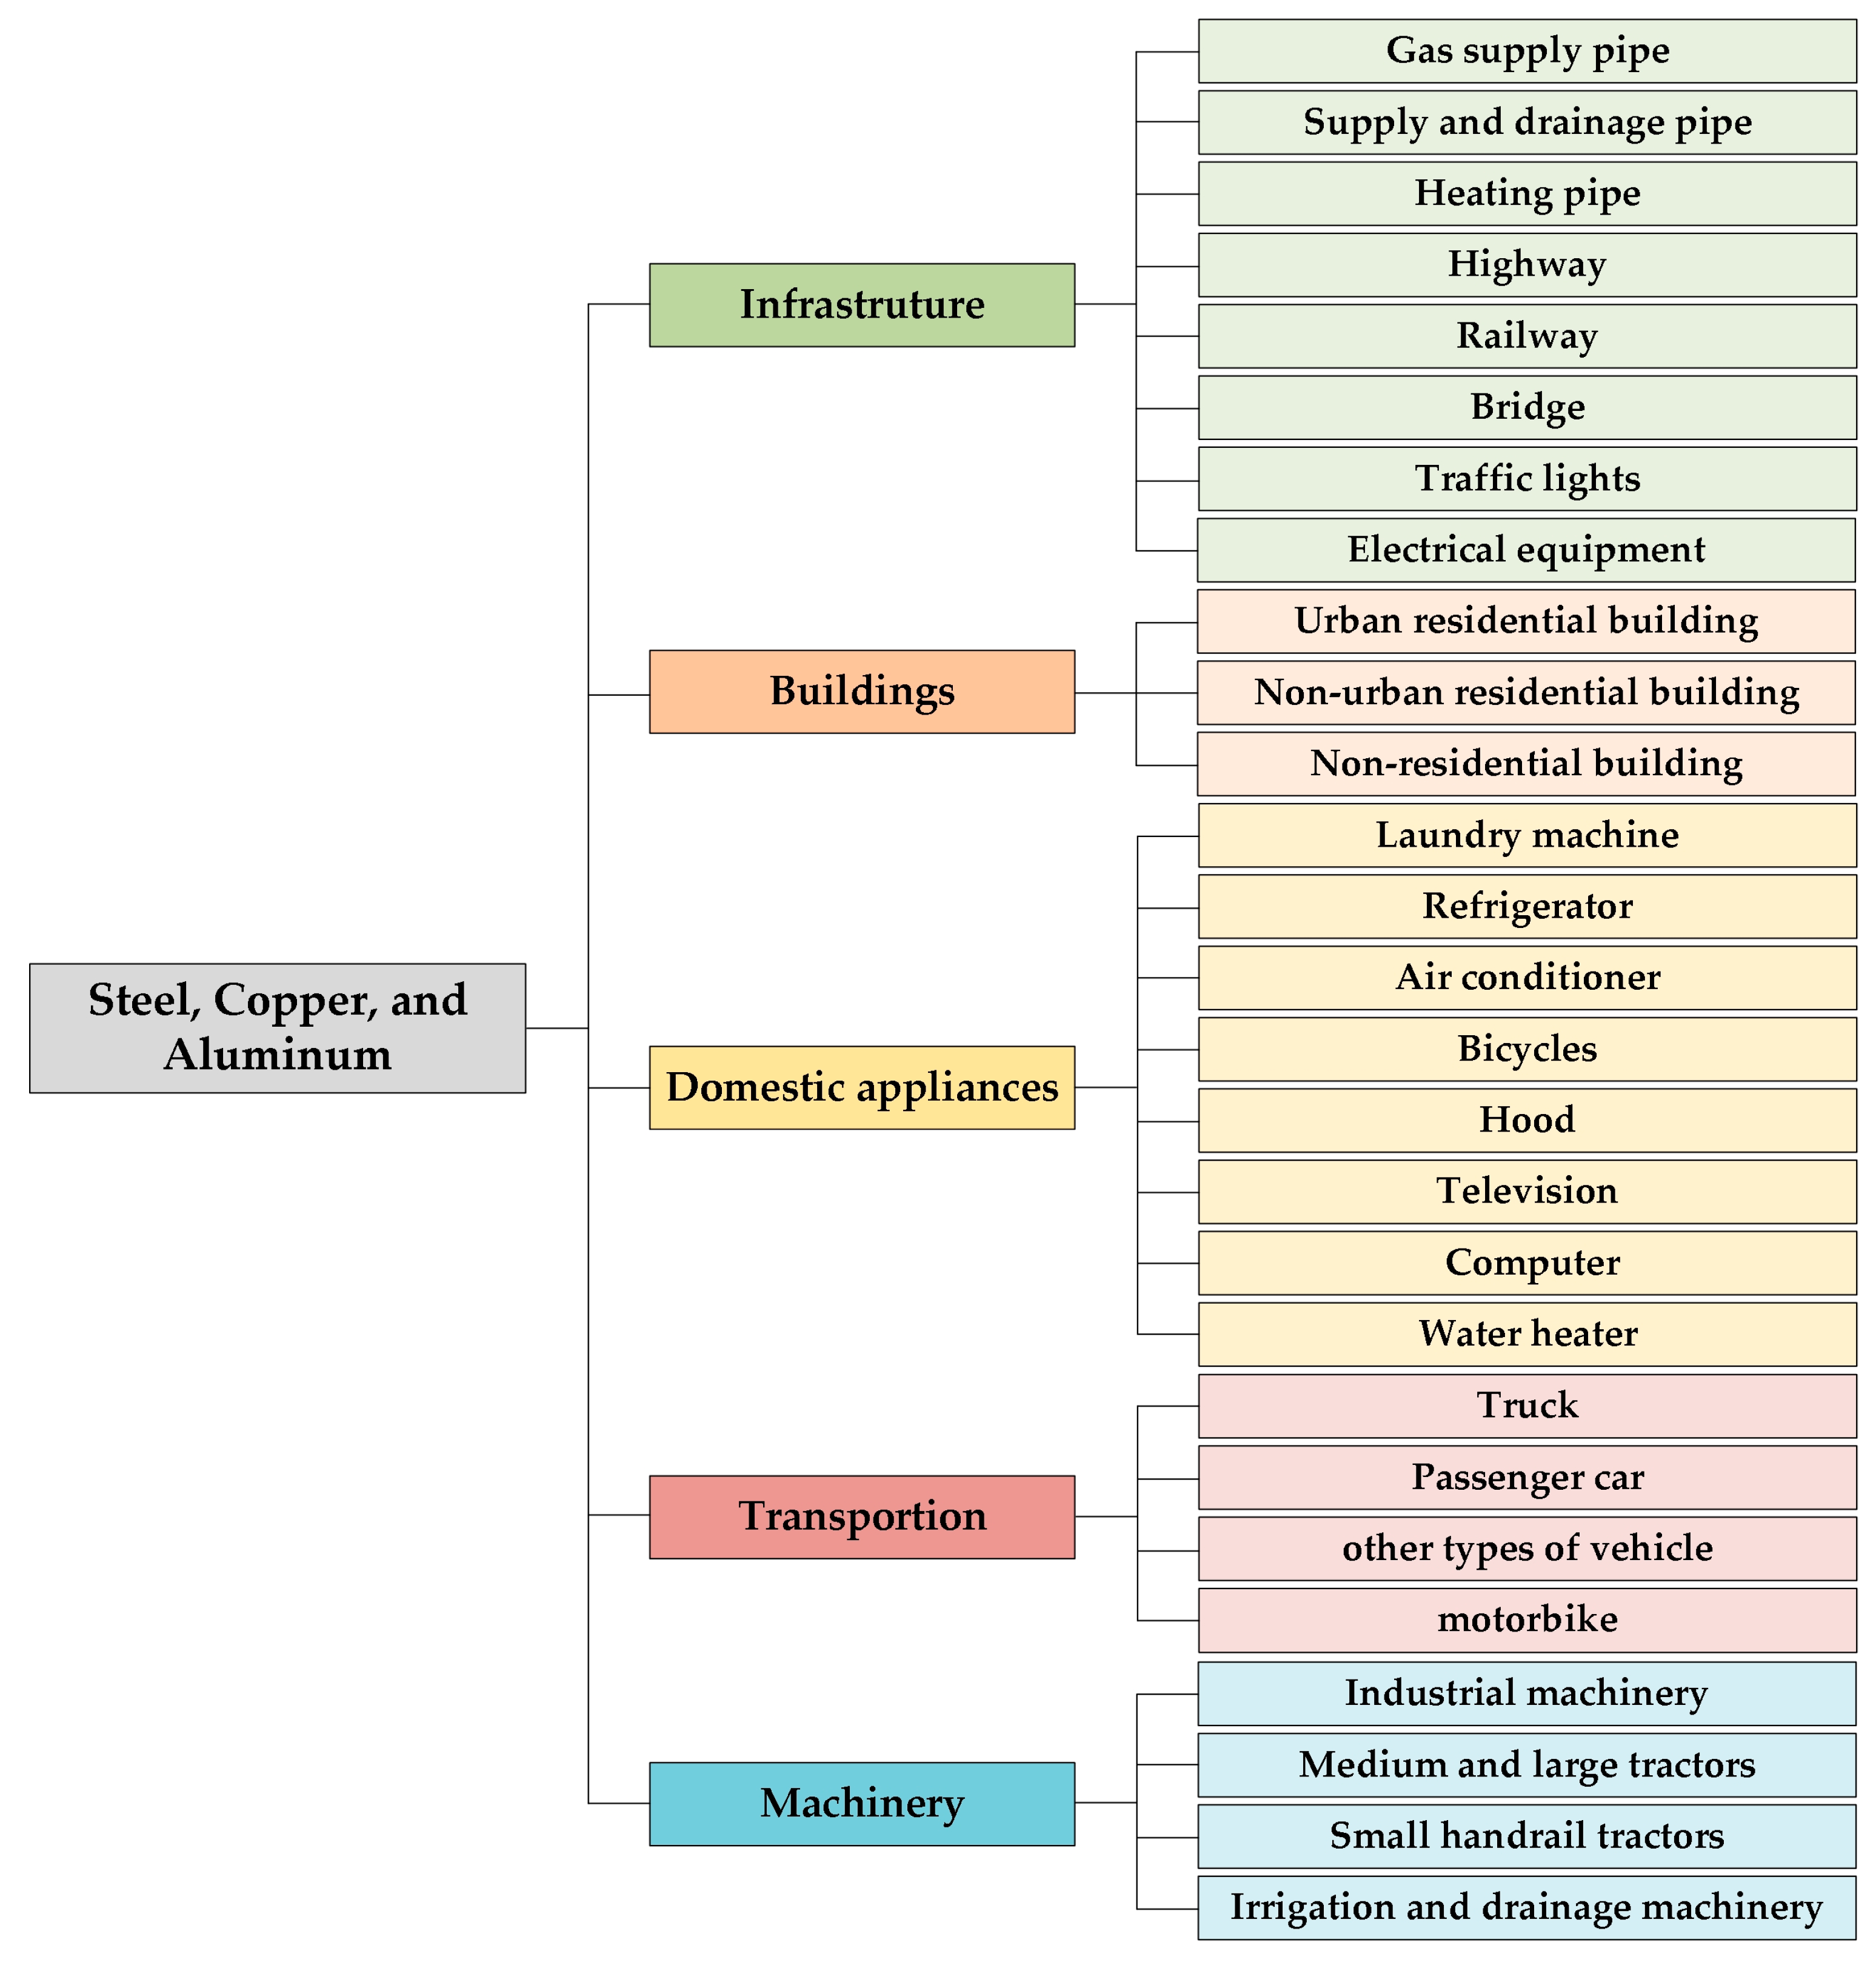
In this paper, the system was divided into five subcategories based on the topology of the metals used in the city systems. The five sub-categories are infrastructure, construction, domestic appliances, transportation, and machinery. Under this division structure, the subcategories are further decomposed into some next-level product units. The categories and subcategories of steel, copper, and aluminum in-use stocks are shown in Figure 2.
The urban residential floor area and rural residential floor area in this paper were calculated by multiplying the urban housing area per capita by the urban population and the rural housing area per capita by the rural population, respectively. The non-residential building stock is calculated based on the ratio of non-residential land area to residential land area. The calculation is shown in Equation (2):
S n r ( t ) = N n r ( t ) × S r ( t ) N r ( t )
where S n r ( t ) and S r ( t ) are the metal in-use stocks of residential and non-residential buildings at time t , respectively; N n r ( t ) and N r ( t ) denote the residential land area and non-residential land area at time t , respectively.
The number of product units for domestic appliances was calculated by multiplying the number of households by the number of domestic appliances obtained for every hundred households. Urban and rural products were first calculated separately and then added together. The calculation procedure is as follows:
N d g ( t ) = H u ( t ) × i = 1 n N u d i ( t ) + H r ( t ) × i = 1 n N r d i ( t ) 100
where N d g ( t ) is the total number of domestic appliances at time t ; H u ( t ) and H r ( t ) represent the number of urban and rural households at time t , respectively; N u d i ( t ) and N r d i ( t ) represent metal in-use stocks of residential and non-residential buildings at time t , respectively.
The in-use stock of industrial machinery cannot be determined directly as data on industrial machinery is not available in statistics, and, therefore, indirect calculations through agricultural machinery are required. The calculation is shown in Equation (4):
S i m ( t ) = S a m ( t ) × E i m ( t ) E a m ( t )
where S i m ( t ) and S a m ( t ) are the metal in-use stocks of industrial machinery and agricultural machinery at time t , respectively; E i m ( t ) and E a m ( t ) represent the industrial machinery power and agricultural machinery power at time t , respectively.
The metal scrap is generally estimated using a lifetime distribution model, which uses the consumption and lifetime of the product as input parameters. However, the unit of study in this study was the prefecture-level city, and data on product consumption at this scale are difficult to obtain. Therefore, we used the provincial data on metal in-use stocks and scraps published in the previous literature [33] for indirect calculation of scrap at the prefecture-level city scale. The calculation is performed as follows:
M j ( t ) = g l × S j ( t )
where M j ( t ) is the calculated scrap amount in region j at time t ; g l is the ratio coefficient of metal scrap to in-use stock in the province l where region j is located; S j ( t ) is the in-use stock of metals in region j at time t .

3.1.2. Development of Multiple Linear Regression Models

From the perspective of external drivers, the main factors affecting urban mining are population concentration, urbanization, industrial upgrading, technological change, and consumption upgrading. These influences can be summarized into three types of elements, including population distribution, industrial economy, and urban development. Population and economic agglomeration will accelerate the accumulation of minerals in cities, which is the driving force for the materials used. The role of the population is mainly reflected in the consumption phase, in which the demand for cars and household appliances increases with population growth. In addition, more products are used per capita in economically developed regions than in less developed regions, and the replacement rate is faster. Urban expansion requires more construction supplies, and in situ industrial development requires more machinery and equipment and products with a much higher urban mineral content than electrical appliances but with longer lifespans.
Therefore, the mineralization mechanism in urban mining is positively correlated with population and economic growth rate, and the development of cities can also promote the accumulation of urban minerals to a certain extent. Based on the above analysis, we selected three indicators, including population, GDP, and built-up area, to characterize the three elements of population distribution, industrial economy, and urban development.
To further explore the quantitative relationship between scrap and socio-economic variables, this study measures the correlation between scrap and individual socio-economic variables separately for all study regions using the Pearson correlation coefficient. The Pearson coefficient is calculated as shown in Equation (6):
P e a r s o n = σ x y 2 σ x σ y = i = 1 n ( x i x ¯ ) ( y i y ¯ ) i = 1 n ( x i x ¯ ) 2 i = 1 n ( y i y ¯ ) 2
where σ x y 2 is the covariance of variable x and variable y ; σ x and σ y are divided into the standard deviation of variable x and variable y ; x ¯ and y ¯ are the means of the corresponding variables; n is the total number of samples.
For each socioeconomic variable, a single linear regression was performed, with itself as the independent variable and metal scrap as the dependent variable, to explore the explanatory effect of each variable on metal scrap. Then, we constructed a multiple regression model for metal scrap and population, GDP, and built-up area. The model was solved using the scikit-learn machine learning toolbox in Python, using data from 2010 to 2018 as the training set and data from 2019 and 2020 as the test set to test the stability of the model and the accuracy of the predictions. The model is formulated as follows in Equation (7):
M j ( t ) = a j P j ( t ) + b j G j ( t ) + c j B j ( t ) + d j
where M j ( t ) is the calculated scrap amount in region j at time t ; P j ( t ) ,   G j ( t ) , and B j ( t ) represent the population, GDP, and built-up area of region j at time t , respectively; a j ,   b j ,   and   c j represent the fitted slope coefficients of population, GDP, and built-up area of region j , respectively; and d j is the fitted intercept of region j .
Based on the multiple linear regression equation constructed above, a downscaled expression of the metal scraps can be achieved, giving data support for micro-level research. In spatialized estimation, the sum of the data in the downscaled region and the data in the original region will generate errors due to the change in the scaling expression. Therefore, error correction of the spatialized data is required to ensure that the sum of the estimated data within the boundary of a region is equal to the metal scrap data obtained based on statistical methods. The method of error correction is as follows:
P p i x = P ^ p i x × P j P ^ p i x , j
where P p i x is the corrected grid-scale scrap amount; P ^ p i x is the amount of scrap at the grid scale after spatialization using the multiple linear regression method; j is the number of study regions; P j is the amount of scrap estimated in region j using the statistical data-based approach; P ^ p i x , j is the sum of the grid-scale scraps in region j .

3.2. Spatial Layout Assessment Method

3.2.1. Spatial Accessibility Measurement Method

The spatial layout assessment method used in this study is based on accessibility calculations. In the accessibility calculation, the service radius is determined based on the theory of concentric zones. The concentric zone theory was originally developed to study the role of cities in regional economies. The core of the theory is the definition of the inter-relationship between the city and the surrounding area, which follows the law of “distance decay”. We have extended the meaning of the theory of concentric zones based on an in-depth analysis of its connotation and its applications in different fields. We model the studied UMPBs as urban centers and use this as a premise for the delineation of the circle structure.
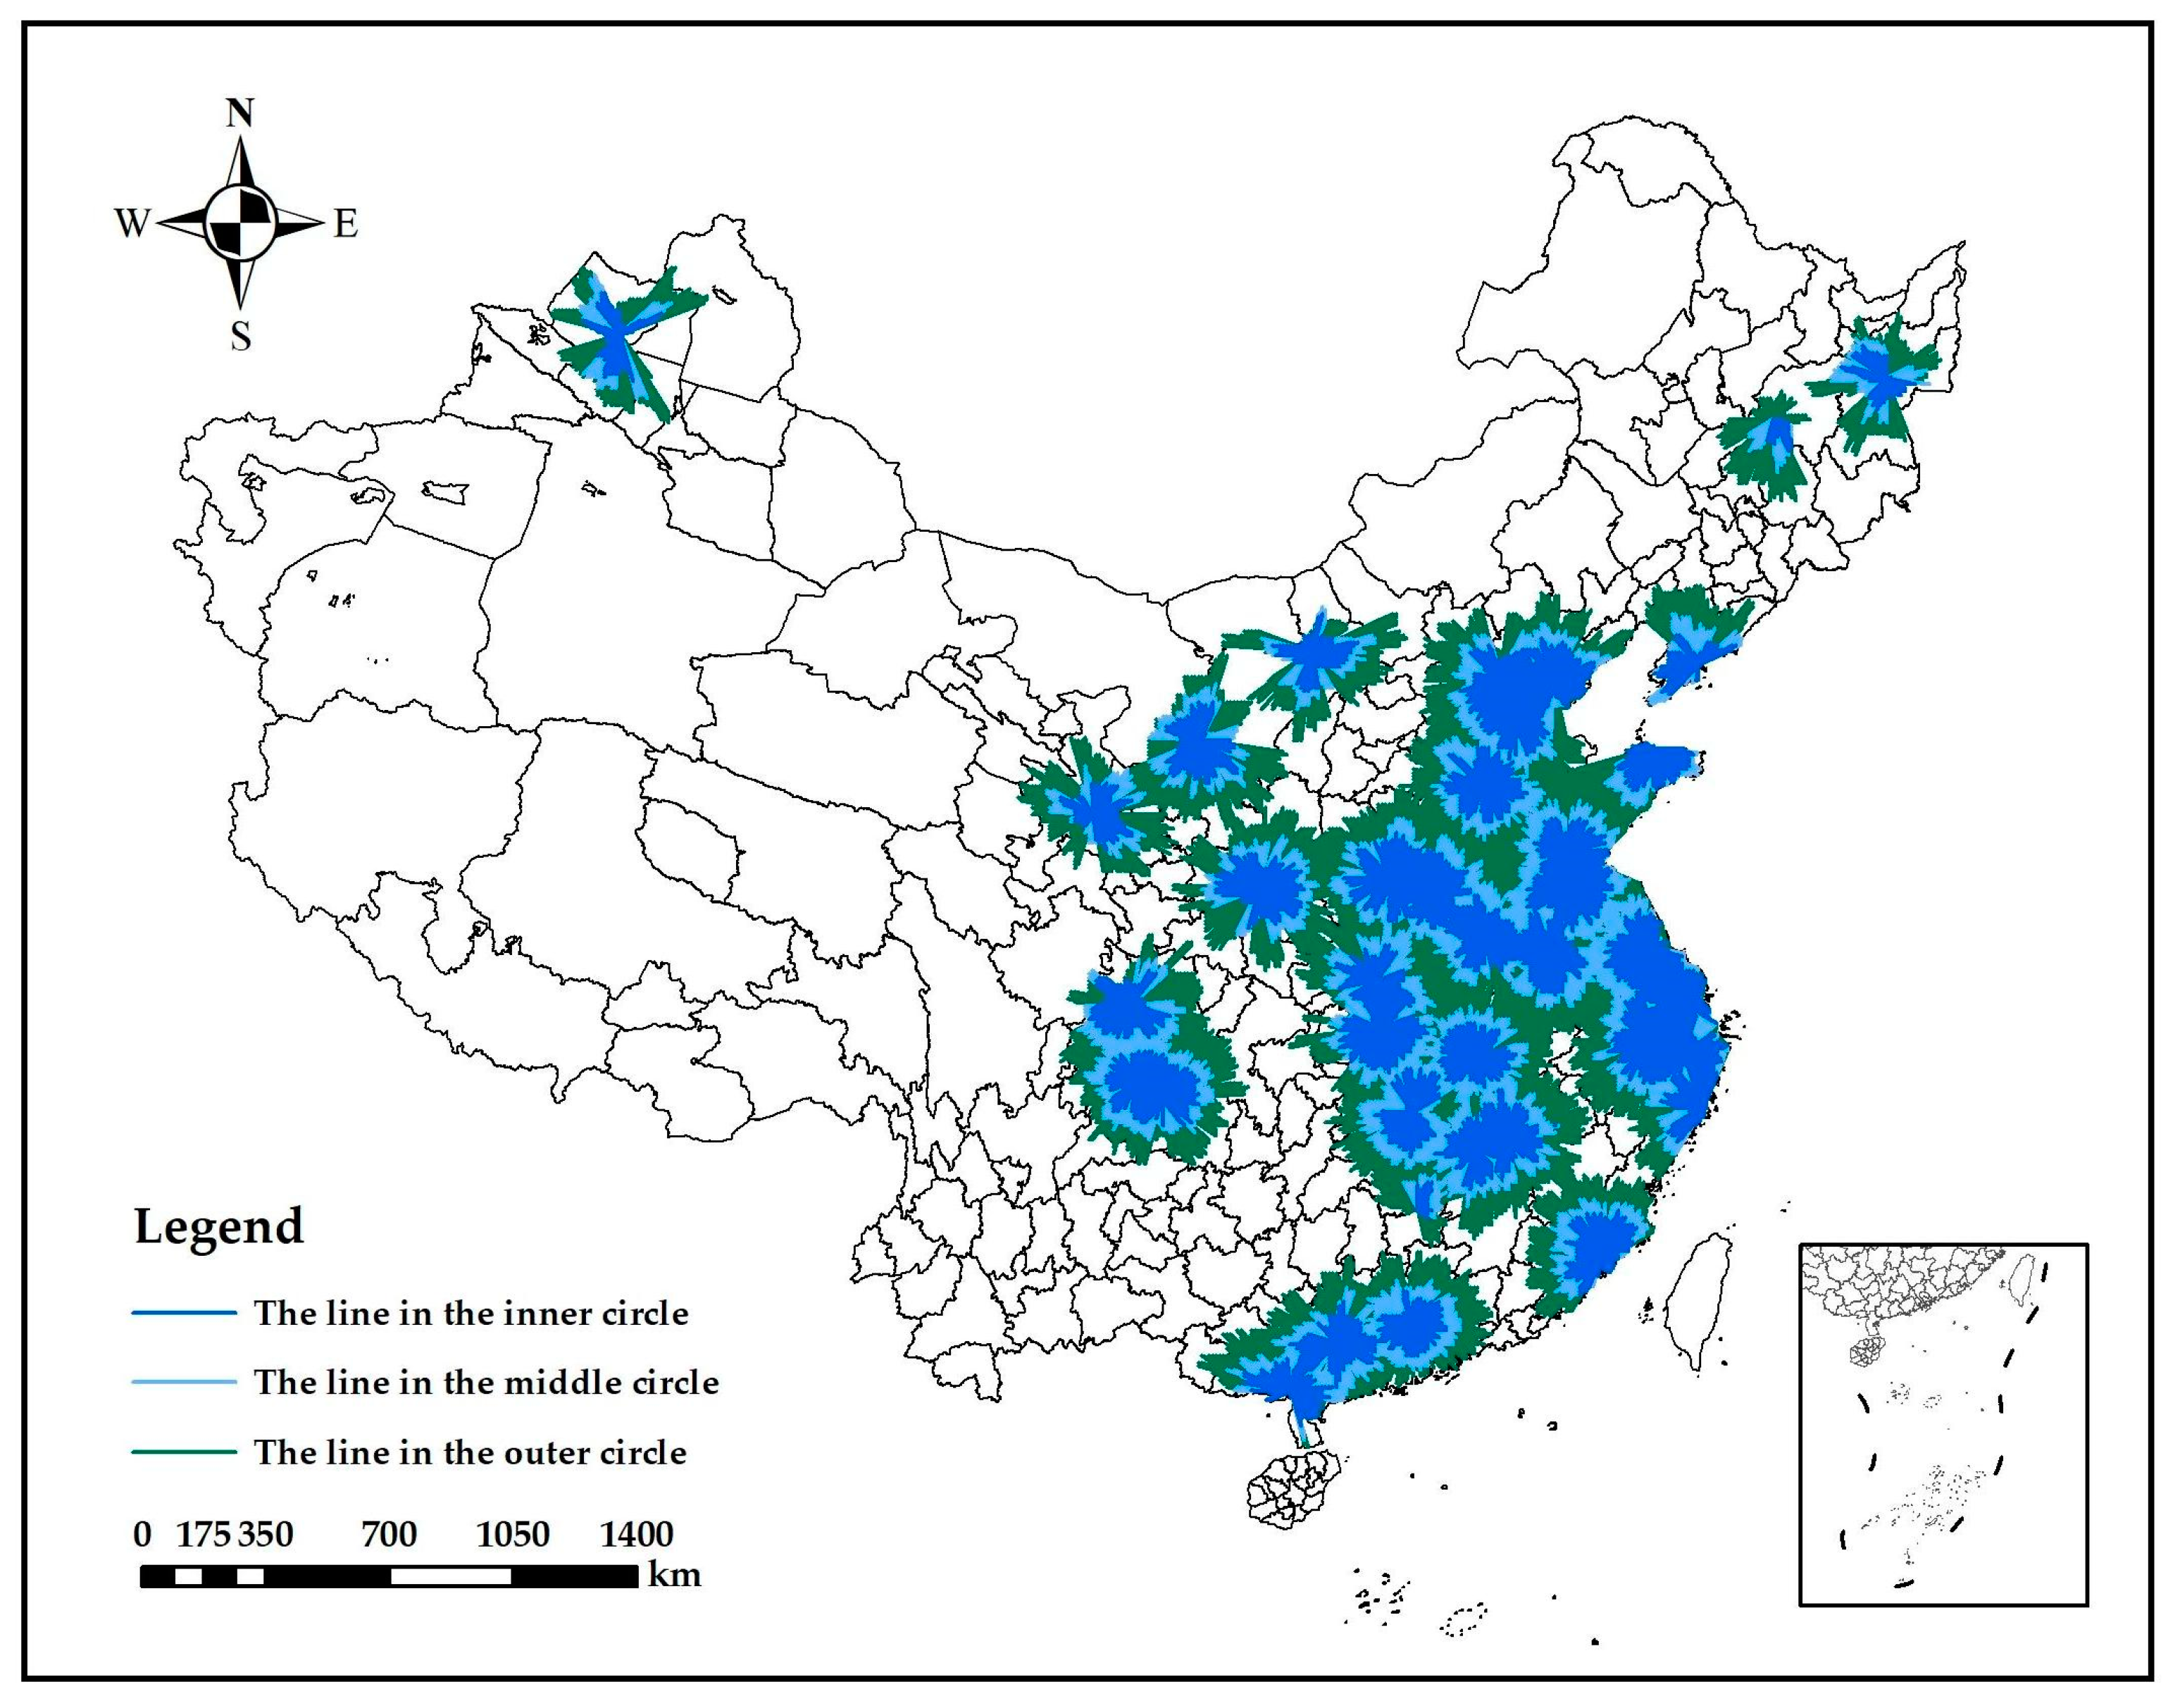
Since the recycling of scrap metal resources is mainly limited by the transportation distance, in this study, we use the road network distance to characterize the relationship between the recycling demand of the region and the resources of the UMPB’s recycling services. This metric is much more realistic and more interpretable than the Euclidean distance approximation. The division of the service area into circular structures reflects the service resources of scrap metal recycling from the core, to the UMPB, to the periphery, presenting a central spatial hierarchy. In general, it can be divided into inner, middle, and outer circles.
In this study, the inner, middle, and outer circles were set at 150 km, 200 km, and 300 km, respectively. Among them, the inner circle radius is set by taking the average distance from each UMPB to the nearest provincial administrative center, which represents the satisfaction of the basic demand for urban mineral recovery. The setting of the middle circle radius is referred to the setting of the maximum service radius in the literature [34]. Considering that the road network distance between two points is generally 1–2 times that of the Euclidean distance, the radius of the outer circle layer is set to 300 km. The classification of circles based on the distance of the road network is shown in Figure 3.
Based on the determination of the service radius of the UMPB, we calculate the achievable rate using the 2SFCA method. The method is easy to understand and can accurately reflect the role of supply and demand. Therefore, the method has been widely used in the accessibility calculation of public service facilities such as hospitals, schools, and elderly living facilities.
On the one hand, the UMPB, as a hub for the collection and distribution of waste resources, has a radiating effect on the surrounding area as a service resource. On the other hand, the surrounding areas also need to provide scrap metal resources to the nearby UMPBs. Thus, a UMPB can be viewed as a facility that provides a service resource, and the area where the scrap resource is distributed can be viewed as the demand side that needs to be served.
In considering the UMPB as an accessibility calculation for the facility, the distance decay effect between supply and demand scales and the spatial interaction between them is considered. Among them, the distance between supply and demand was characterized by two measures of Euclidean distance and road network distance, respectively, and the distance decay effect was expressed by the Gaussian function. The reachability is calculated in Equations (9)–(11) below.
In the first step, three different radius circles are divided based on the circular structure with UMPB j as the center, and the distance threshold d 0 of this circle is used as the radius for the first search:
R j = T j k ϵ { d k j d 0 } G ( d k j , d 0 ) D k
where R j is the ratio of supply to demand of the UMPB j ; the set of demand points falling into the search domain is k ; T j is the scale of UMPB j ; D k is the scale of demand point k ; G ( d k j , d 0 ) represents the distance decay function. The specific form of calculation is shown in Equation (10) below.
In the second step, all UMPBs j within the distance threshold d 0 are searched with demand point k as the center. Then, the sum of the supply and demand ratio of UMPB j in the search range is calculated to obtain the accessibility value of demand point k , as follows:
A k = j ϵ { d k j d 0 } R k
where R k is the supply-to-demand ratio of the facilities in the reachable range, and A k is the accessibility of demand point k . The distance decay function can be calculated as follows:
G ( d k j , d 0 ) = { e ( 1 2 ) × ( d k j d 0 ) 2 e ( 1 2 ) 1 e ( 1 2 ) , d k j d 0 0 , d k j > d 0
where d k j is the distance from the UMPB j to the demand point k .

3.2.2. Bivariate Spatial Autocorrelation Analysis

Bivariate spatial autocorrelation analysis is a method used to characterize the spatial association and dependence of the characteristic relationship between two elements. In this study, we use the bivariate Moran’s I index to measure the correlation and dependency between scrap and accessibility. The calculation is as follows:
I a b = n i = 1 n j 1 n W i j X i a X j b ( n 1 ) i = 1 n j 1 n W i j
where I a b is the bivariate global autocorrelation coefficient; n is the number of study units; X i a is the normalized value of the scrapping of the unit i ; X j b is the normalized value of the accessibility of facility j in the neighborhood of the unit i ; W i j is the spatial weight matrix.
Moran’s I index takes values between −1 and 1. A value greater than 0 indicates a spatially positive correlation, and larger values indicate a stronger spatial correlation. A value below 0 is a spatially negative correlation, with smaller values indicating greater spatial variability, while an equation equal to 0 means that there is no spatial correlation.
Based on the global correlation, the bivariate local autocorrelation can be used to further measure the local correlation between scrappage and accessibility, as well as the supply and demand matching relationship in the local area. The calculation is shown as follows:
I i a b = X i a w i j X j b
where I i a b is the bivariate local autocorrelation coefficient. The calculation of bivariate local Moran’s I index will present four types of clusters: high-high, high-low, low-high, and low-low.

4. Results and Discussion

This section presents the spatial and temporal distribution of typical metal resources and the results of the UMPB’s spatial layout evaluation. Firstly, the results of the estimation of the in-use stock and the scrap quantity of typical metal resources were analyzed from different scales. Then, the spatialization of the scrapped quantities is achieved using multiple linear regression methods. Finally, based on the above data, the accessibility of the areas where the scrap quantity accumulated was calculated, and the spatial layout of the UMPB was evaluated by combining the accessibility and scrap quantity distribution.

4.1. Spatial and Temporal Distribution of Typical Metal Resources

4.1.1. Historical Spatial Distribution of Typical Metal Stocks

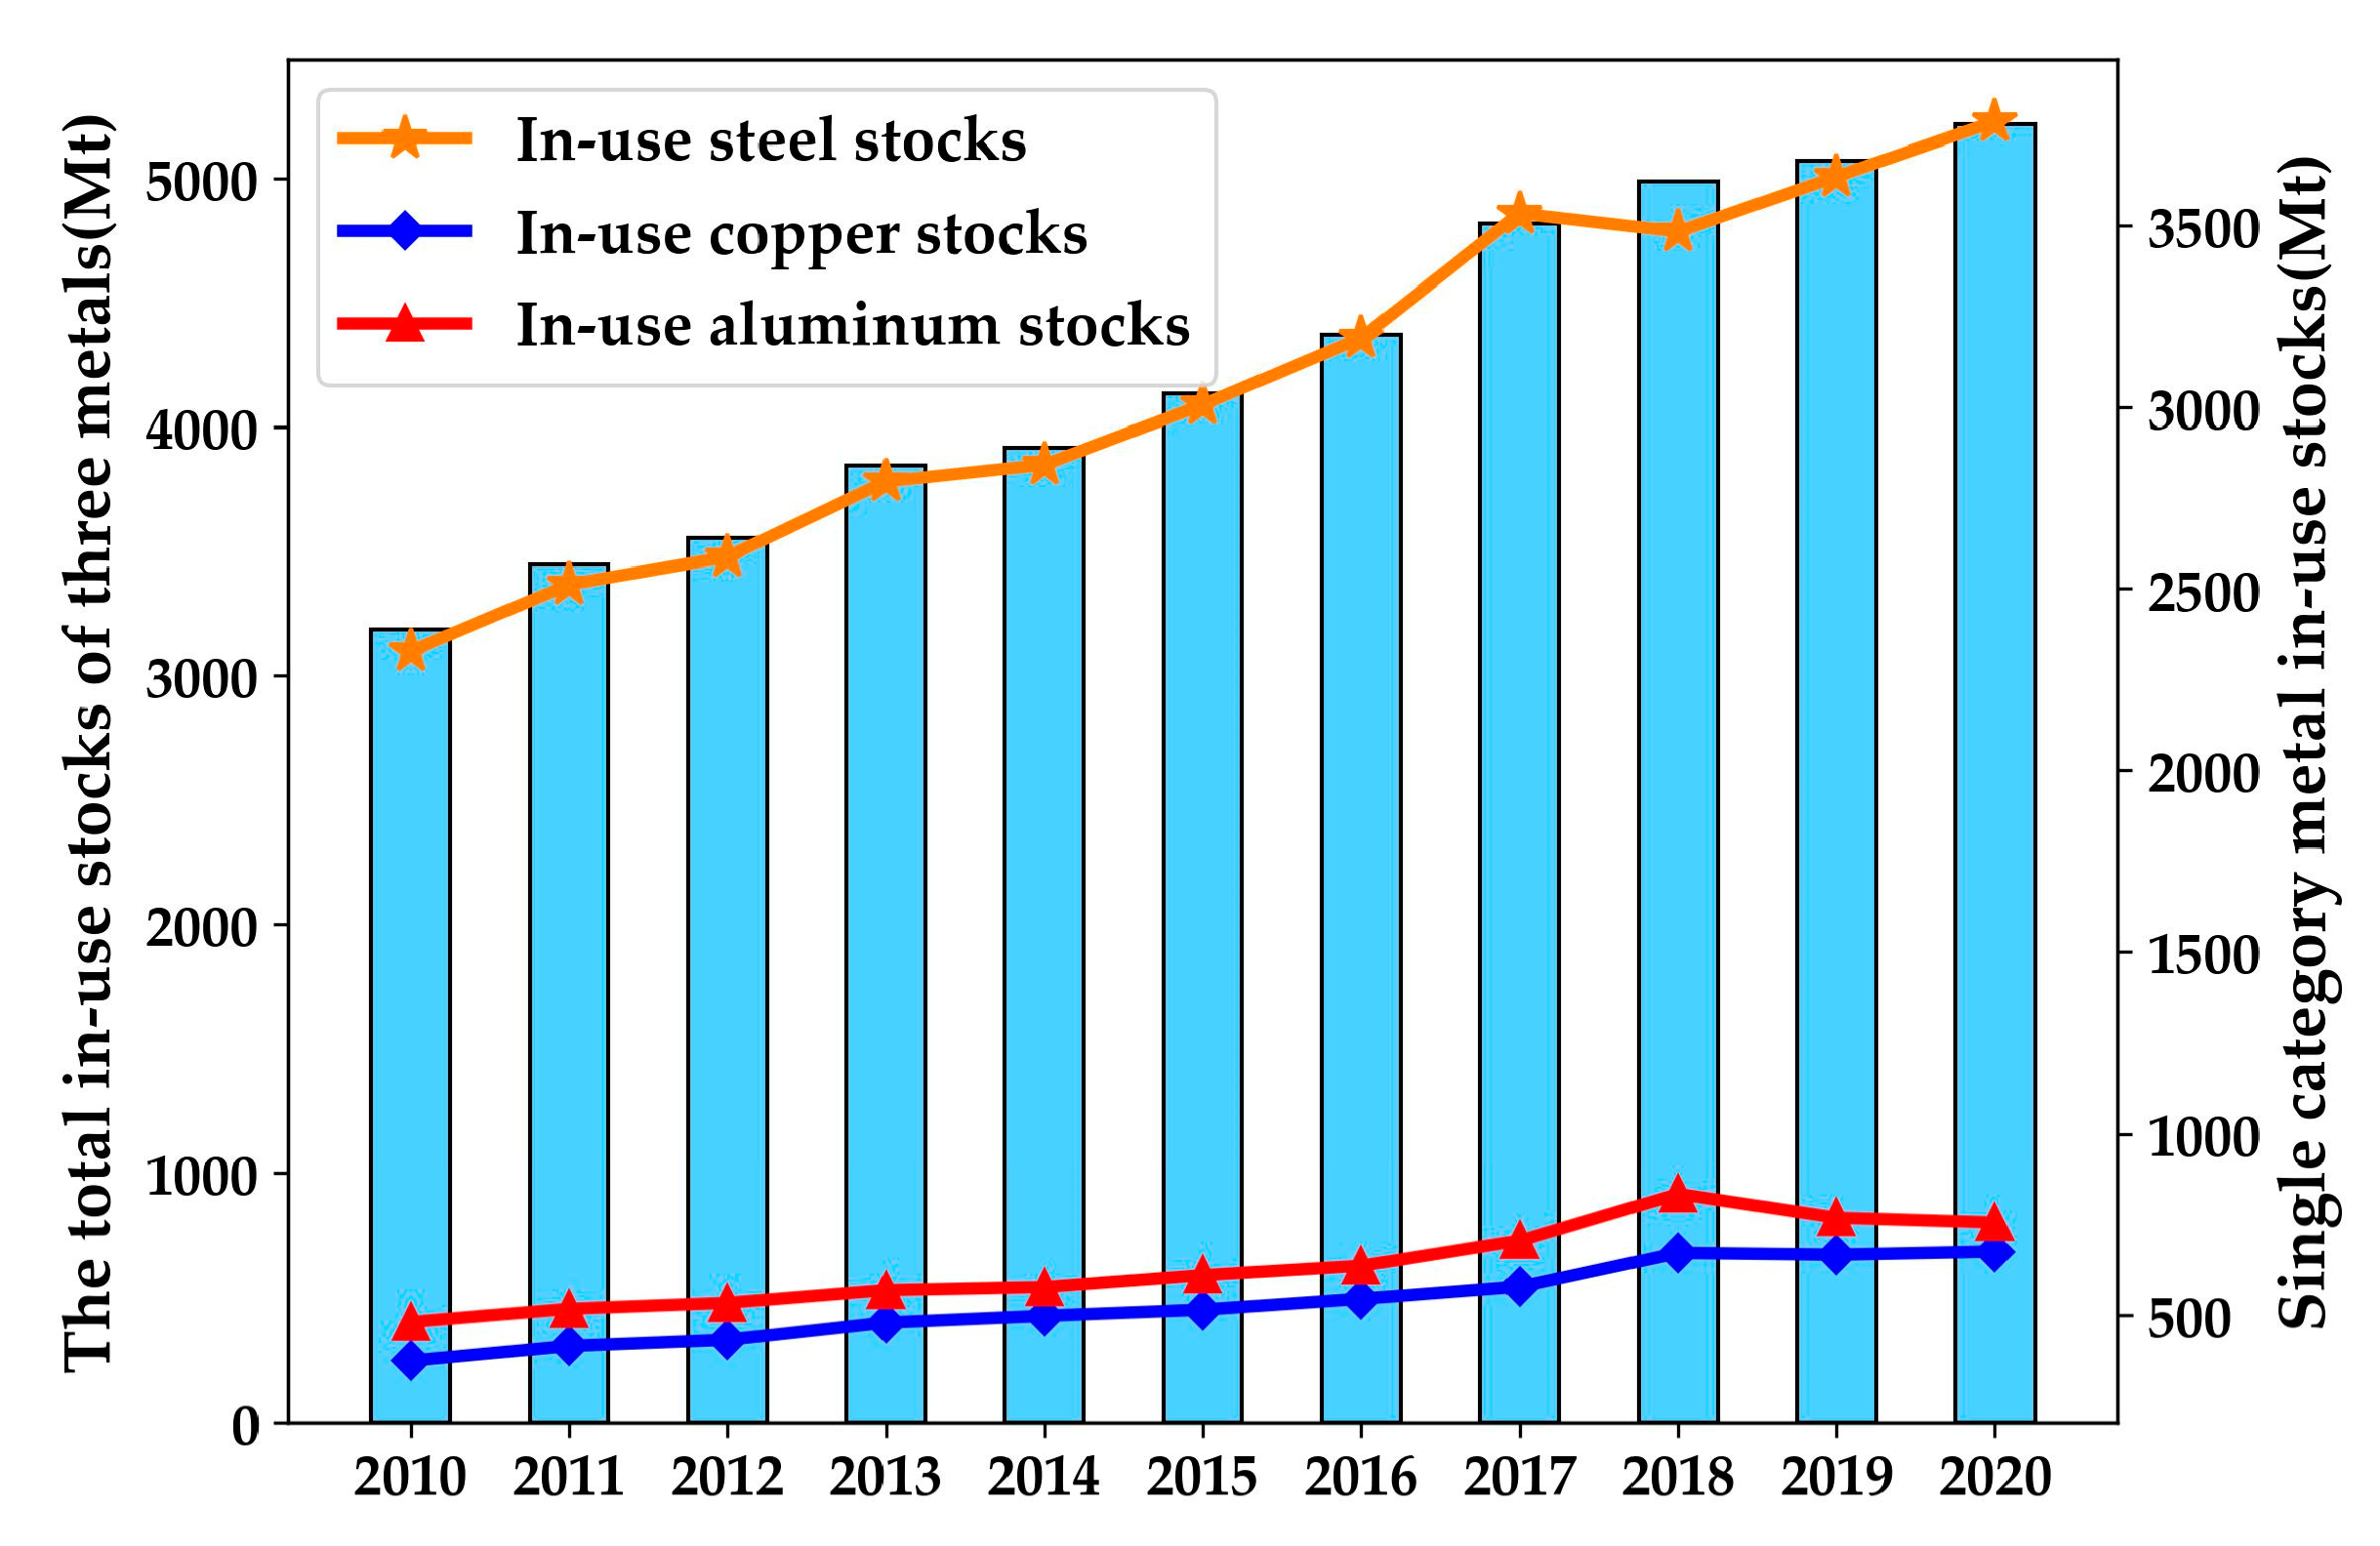
The in-use stocks of steel, copper, and aluminum in mainland China from 2010 to 2020 were calculated according to Equation (1), and the in-use stock of different regions was aggregated at the national level (Figure 4). From 2010 to 2020, the total in-use stocks of steel, copper, and aluminum grew from 3.186 billion tons to 5.216 billion tons. The in-use inventories of steel, copper, and aluminum increased by 1.458 billion, 299 million, and 273 million tons, respectively, with average annual growth rates of 6.26 percent, 7.97 percent, and 5.66 percent, respectively. The in-use inventories of all three metals showed a steady growth trend until 2017 and slowed after that. The average annual growth rates of steel, copper, and aluminum were 2.39 percent, 5.56 percent, and 2.35 percent, respectively, in the 2017–2020 period, which are all below their corresponding values in the 2010–2020 period. This could be related to changes in China’s population growth rate. In 2018, China’s natural population growth rate began to decline sharply, with a population growth rate of 1.8‰ in 2018 and a negative population growth for the first time in 2022.
A time-series analysis of the in-use stock of metals on a national scale may yield its macro trends, which can be used to guide the development of recycling policies at the appropriate scale. Due to the vast territory of China, there was a strong spatial heterogeneity in the distribution of metal in-use stocks in different provinces (Figure 5). The average in-use stocks in central China and east China were among the national leaders, at 212 million tons and 201 million tons, respectively, and 1.26 and 1.19 times higher than the national average. Meanwhile, the average in-use metal stock in western China was slightly lower than the national average at 134 million tons. Northeast China, due to its lower population density, has a lower average in-use stock of 108 million tons. Among the 31 provincial-level administrative regions, the top 3 provinces with in-use stocks were Jiangsu (482 million tons), Zhejiang (349 million tons), and Sichuan (332 million tons). The bottom three provinces were Ningxia (27 million tons), Qinghai (17 million tons), and Tibet (15 million tons).
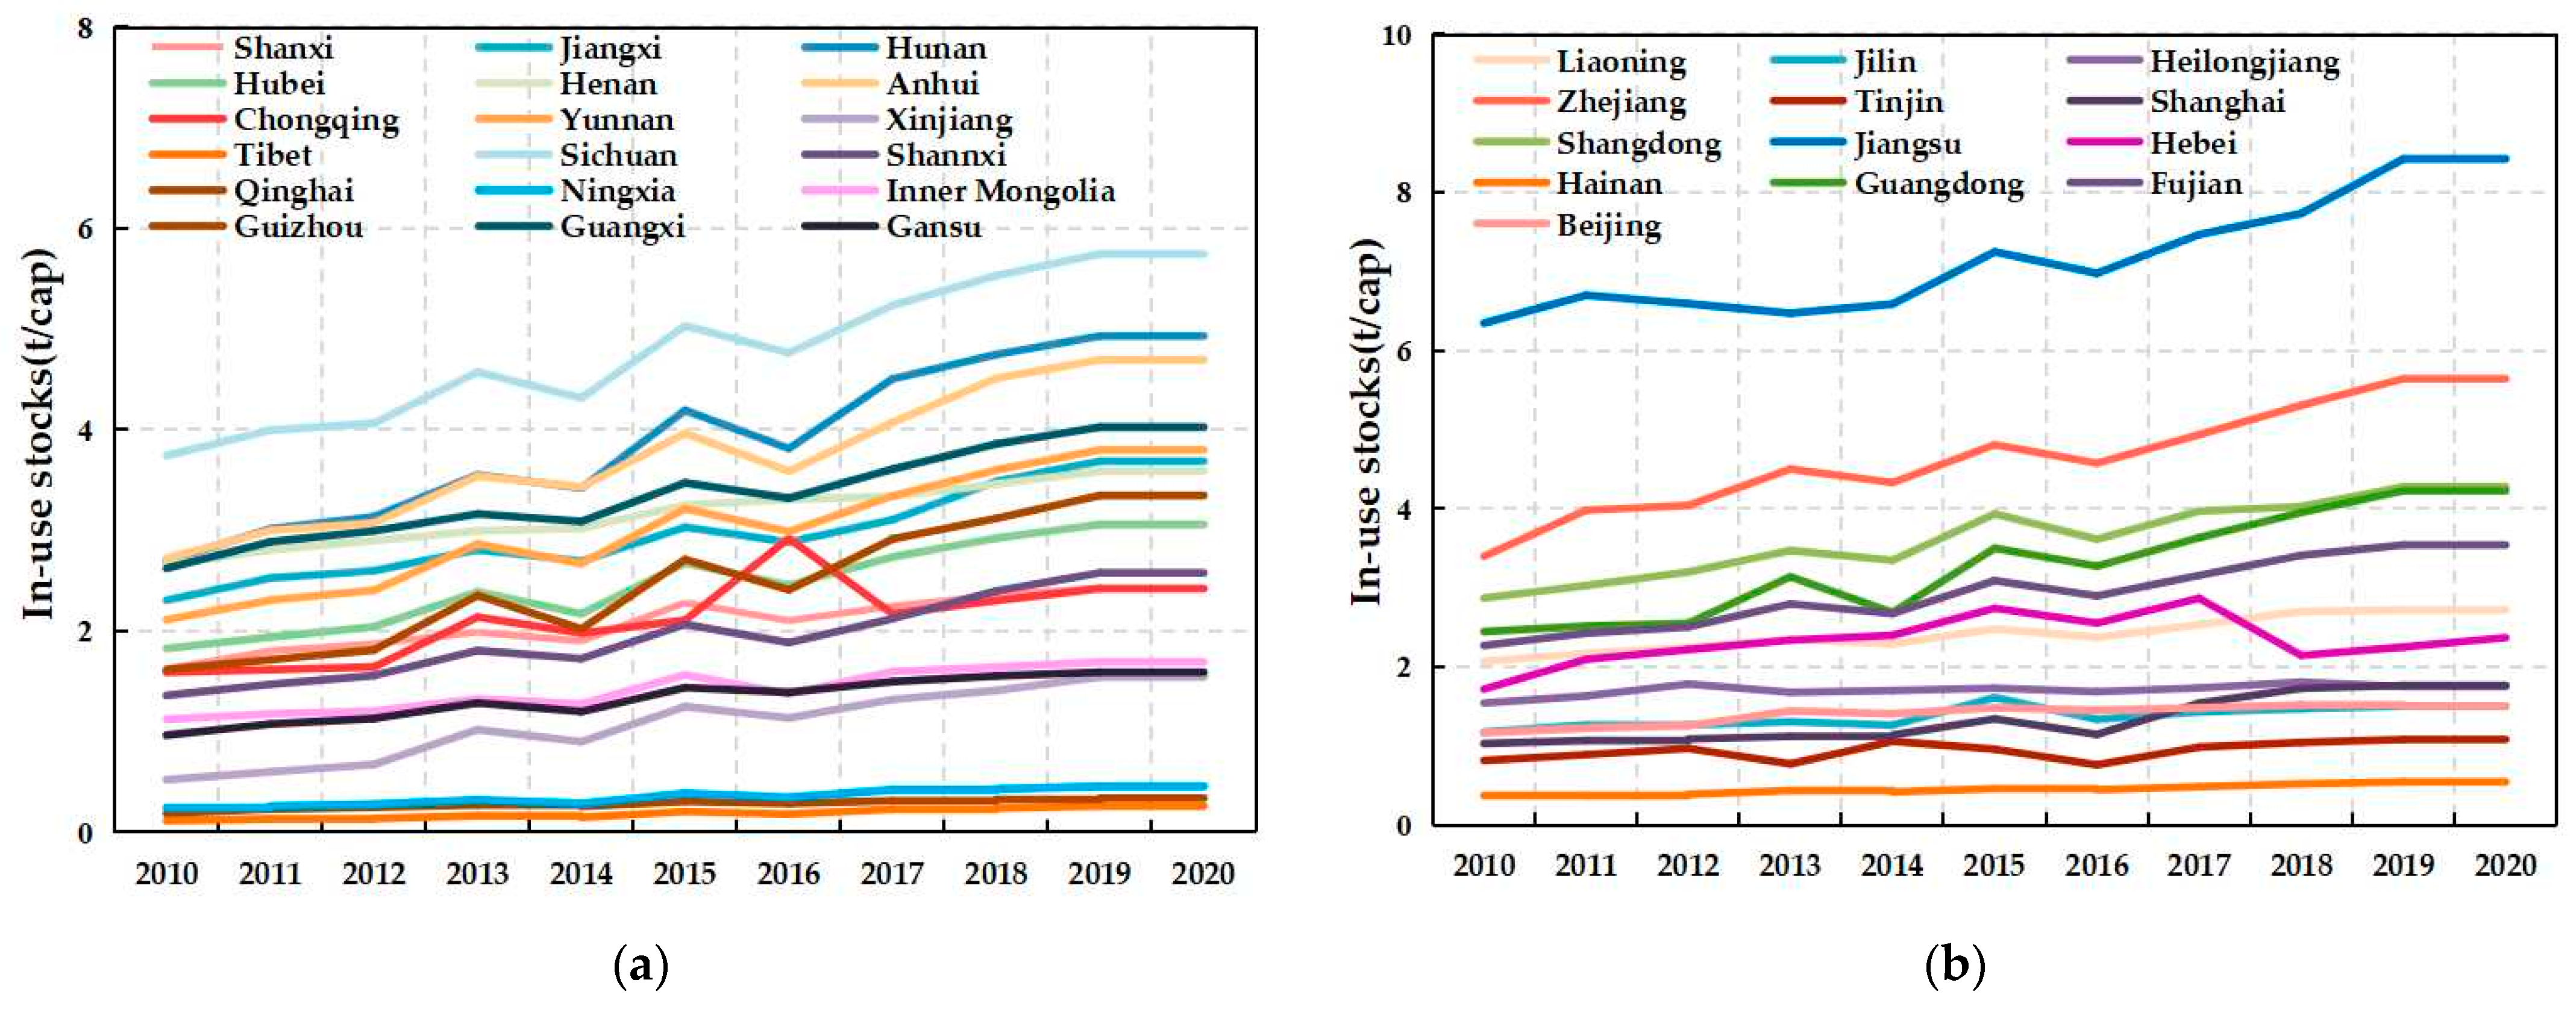
Metal in-use stocks per capita represent the level of metal resources per capita in the region, and the higher the value, the more secure the corresponding metal supply in the region. From 2010 to 2020, the per capita in-use stocks of metals showed a slow growth trend (Figure 6). In particular, in Zhejiang, Hunan, Jiangsu, and Sichuan, the increase in per capita stocks exceeded 2 t/cap, and the increase was 2.25 t/cap, 2.24 t/cap, 2.07 t/cap, and 2.01 t/cap. The national per capita in-use stock in 2020 was 3.69 t/cap, with six provinces above the average and the rest below the average. This reflects the large overall gap in China’s pro-provincial level of metal supply.
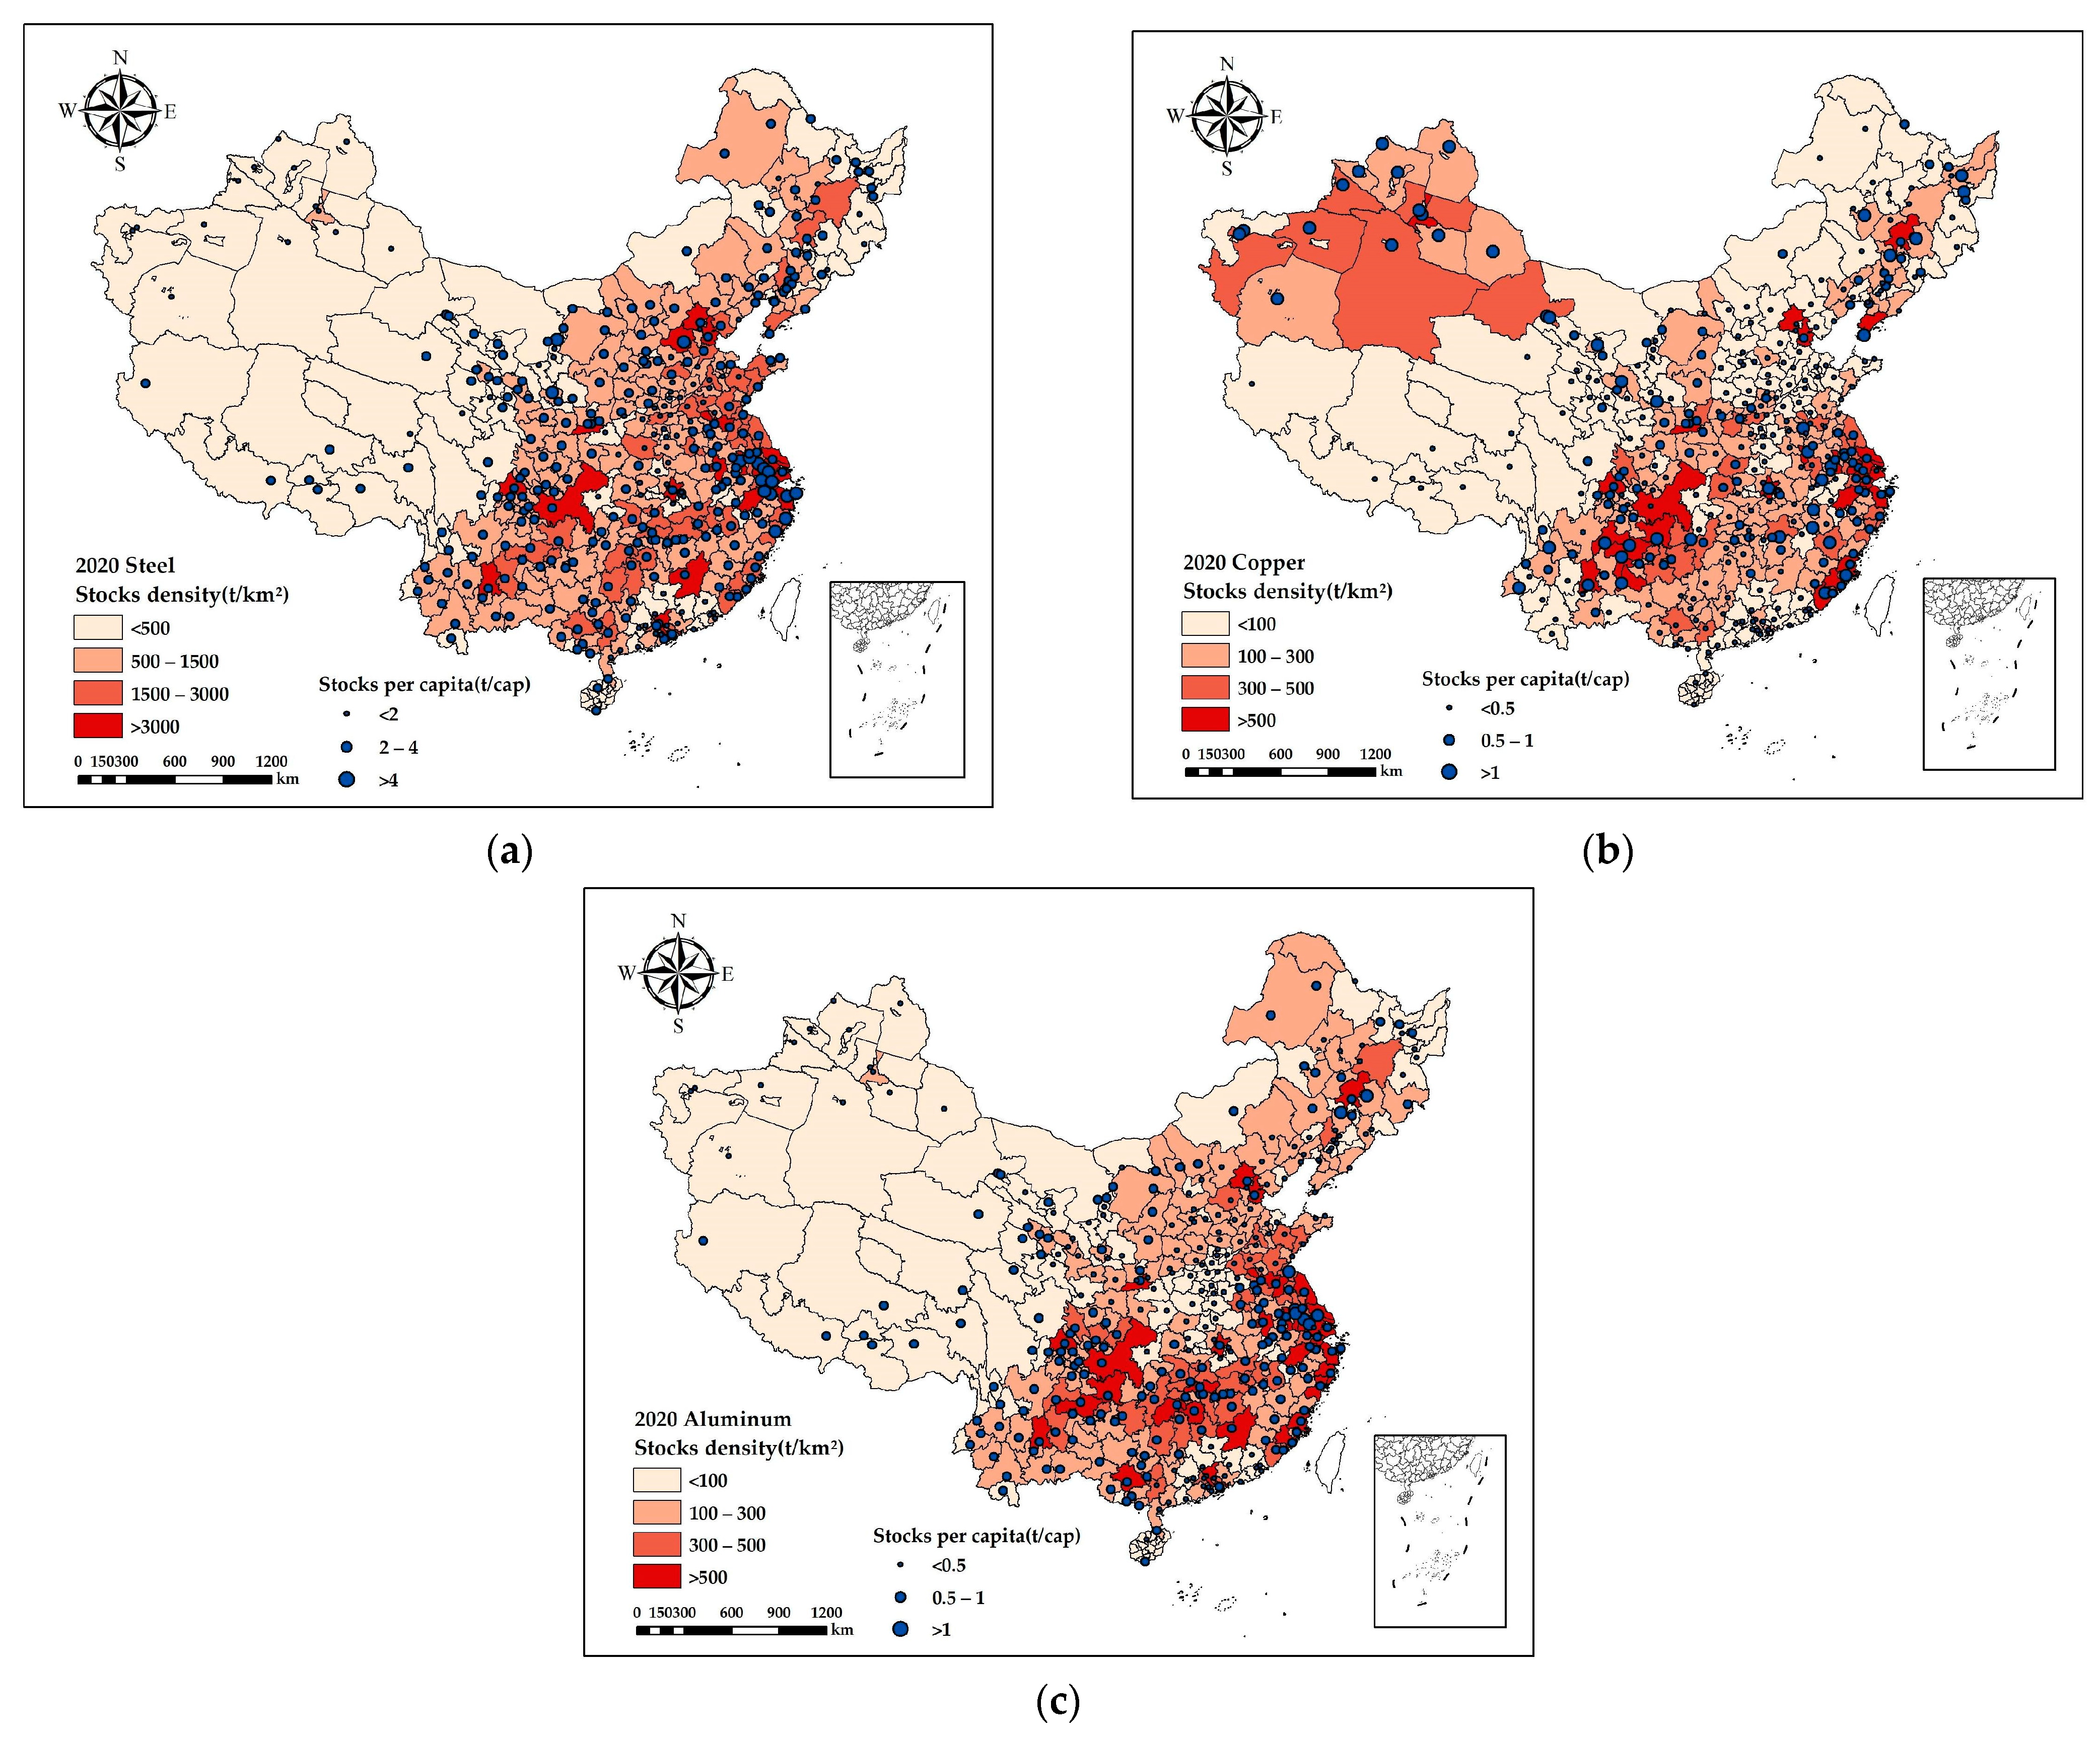
The spatial distribution of the in-use stock of metals in 2020 estimated using Equation (1) is shown in Figure 7. Steel stocks in use in 2020 exceeded 20 million tons in 49 cities and more than 30 million tons in 21 cities. In Chongqing, Shanghai, and Beijing, stocks of steel in use exceeded 60 million tons. Very high values of per capita steel stock exist in extremely sparsely populated regions, such as Shennongjia Forestry District, the Daxinganling area, and Wuhai City. In addition, high values of the per capita stock are mostly found in coastal areas. The distribution of in-use stocks and per capita stocks of copper had some similarities to the distribution of steel. However, in Xinjiang, due to its large area and large number of power generation facilities, there is a correspondingly large accumulation of copper in-use stocks and per capita stocks. The high density of aluminum in-use stocks in 2020 was concentrated in the Yangtze River Basin. Meanwhile, the high value per capita of aluminum in-use stocks is concentrated in the eastern coastal regions and a small number of cities in the northeast.
The reliability of our estimated dataset can be verified by comparing our reported stocks of the same metals in a number of selected cities and years with estimates from bottom-up approaches in the existing literature (Table 1).
At the national level, our estimates are usually low, while at the city level we have high and low estimates, with differences generally within 30%. The number of products containing steel, copper, and aluminum is the main reason for this variation as some regions have statistical missing quantities for some products. In addition, the intensity of steel, copper, and aluminum use estimated via different studies may introduce uncertainty into the results.

4.1.2. Changes in the Spatial and Temporal Patterns of Typical Metal Scrap

From 2010 to 2020, the total scrap of steel, copper, and aluminum in China grew from 121 million tons to 198 million tons and showed a continuous growth trend (Figure 8). The per capita scrap increased accordingly from 91.39 kg/cap to 139.63 kg/cap, with an average annual growth rate of 5.28%. However, the amount of scrap per capita in 2017 decreased by 298.71 kg/cap compared to the previous year.
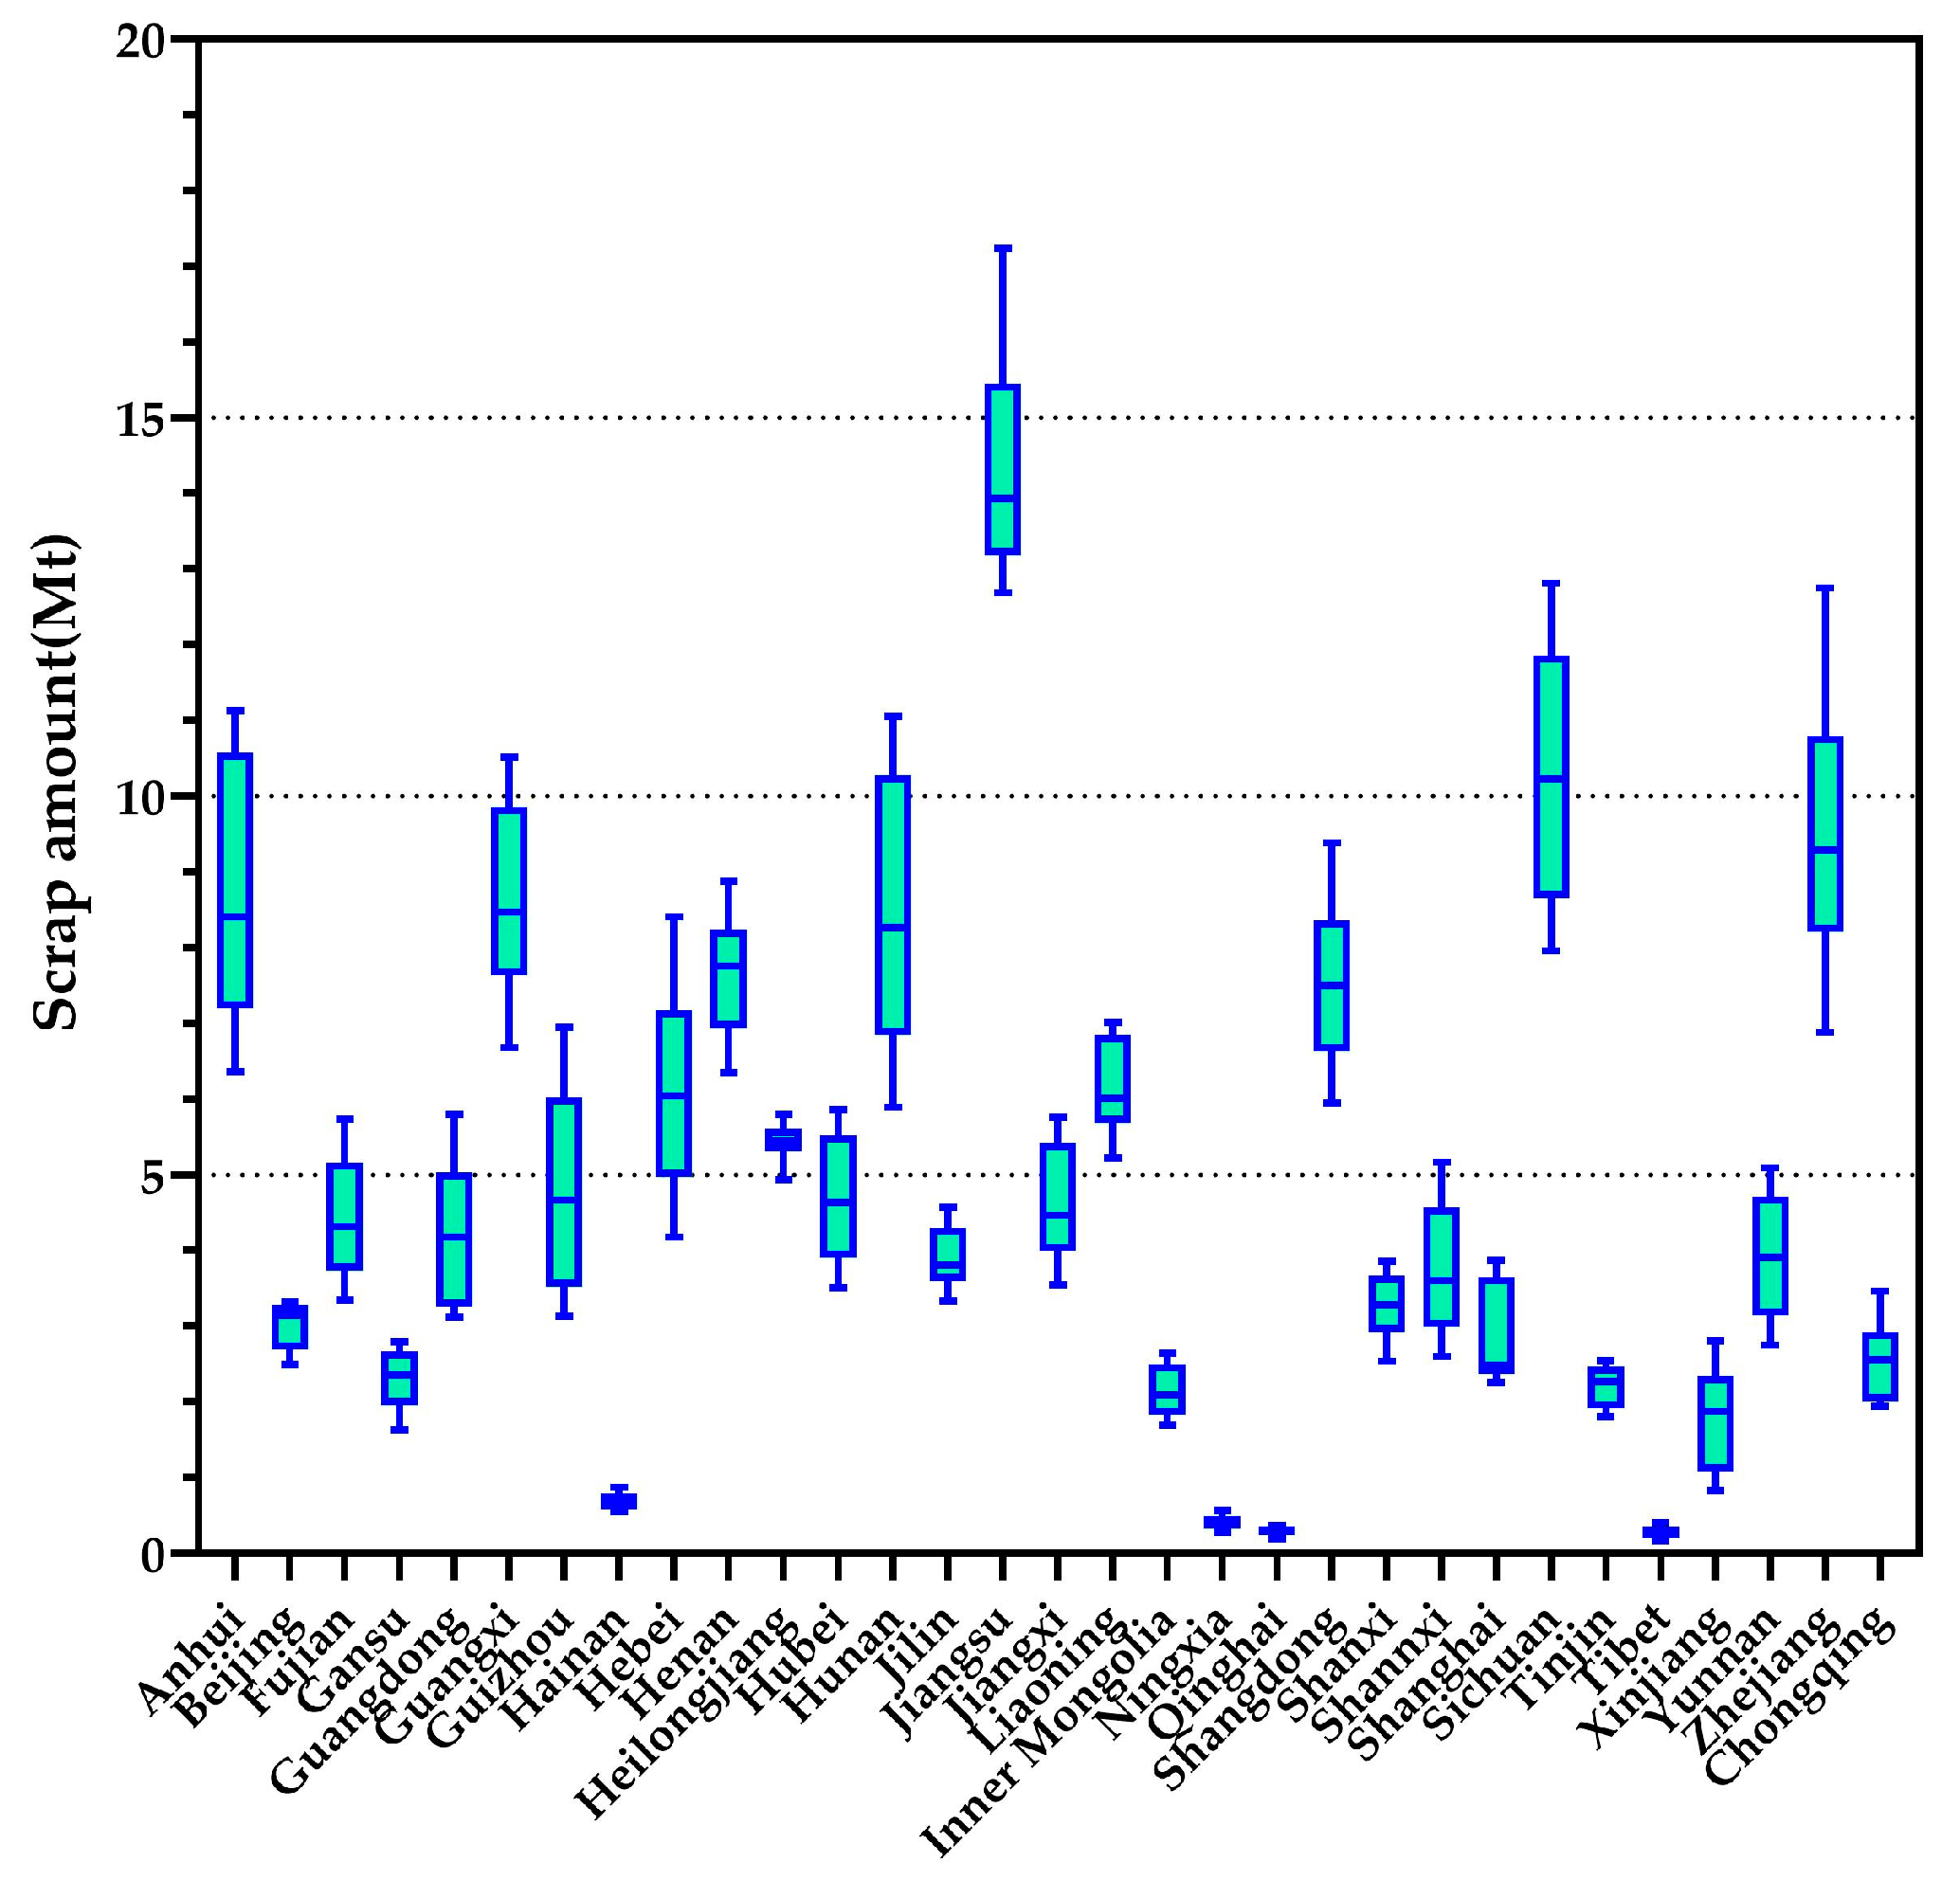
To reflect the variability among the scrap amount of each province in China, the box plot of the scrap amount of each province from 2010 to 2020 is combined to determine their temporal distribution (Figure 9). The results showed that in 2020, Jiangsu, Sichuan, and Zhejiang were in the top three in terms of metal scrap amount. Among them, Jiangsu reached 17.23 million tons of scrap, which is much higher than the level of other provinces. Tibet and Qinghai, which are located in the western region, have been affected by geographical and economic factors, with only 0.40 million and 0.34 million tons of scrap in 2020, which is much smaller than other provinces. In terms of the time change, the provinces with the highest increase in scrap volume were Zhejiang, Hunan, and Sichuan.

4.1.3. Downscaling Metal Scrap

We first analyzed the correlation between metal scraps and three socioeconomic variables for each region. For example, metal scraps in Tianjin were well correlated with the population (R2 = 0.896, p < 0.001), GDP (R2 = 0.967, p < 0.001), and built-up area (R2 = 0.920, p < 0.001) (Figure 10). The R2 of the unitary linear regression also exceeded 0.80 in all other study areas.
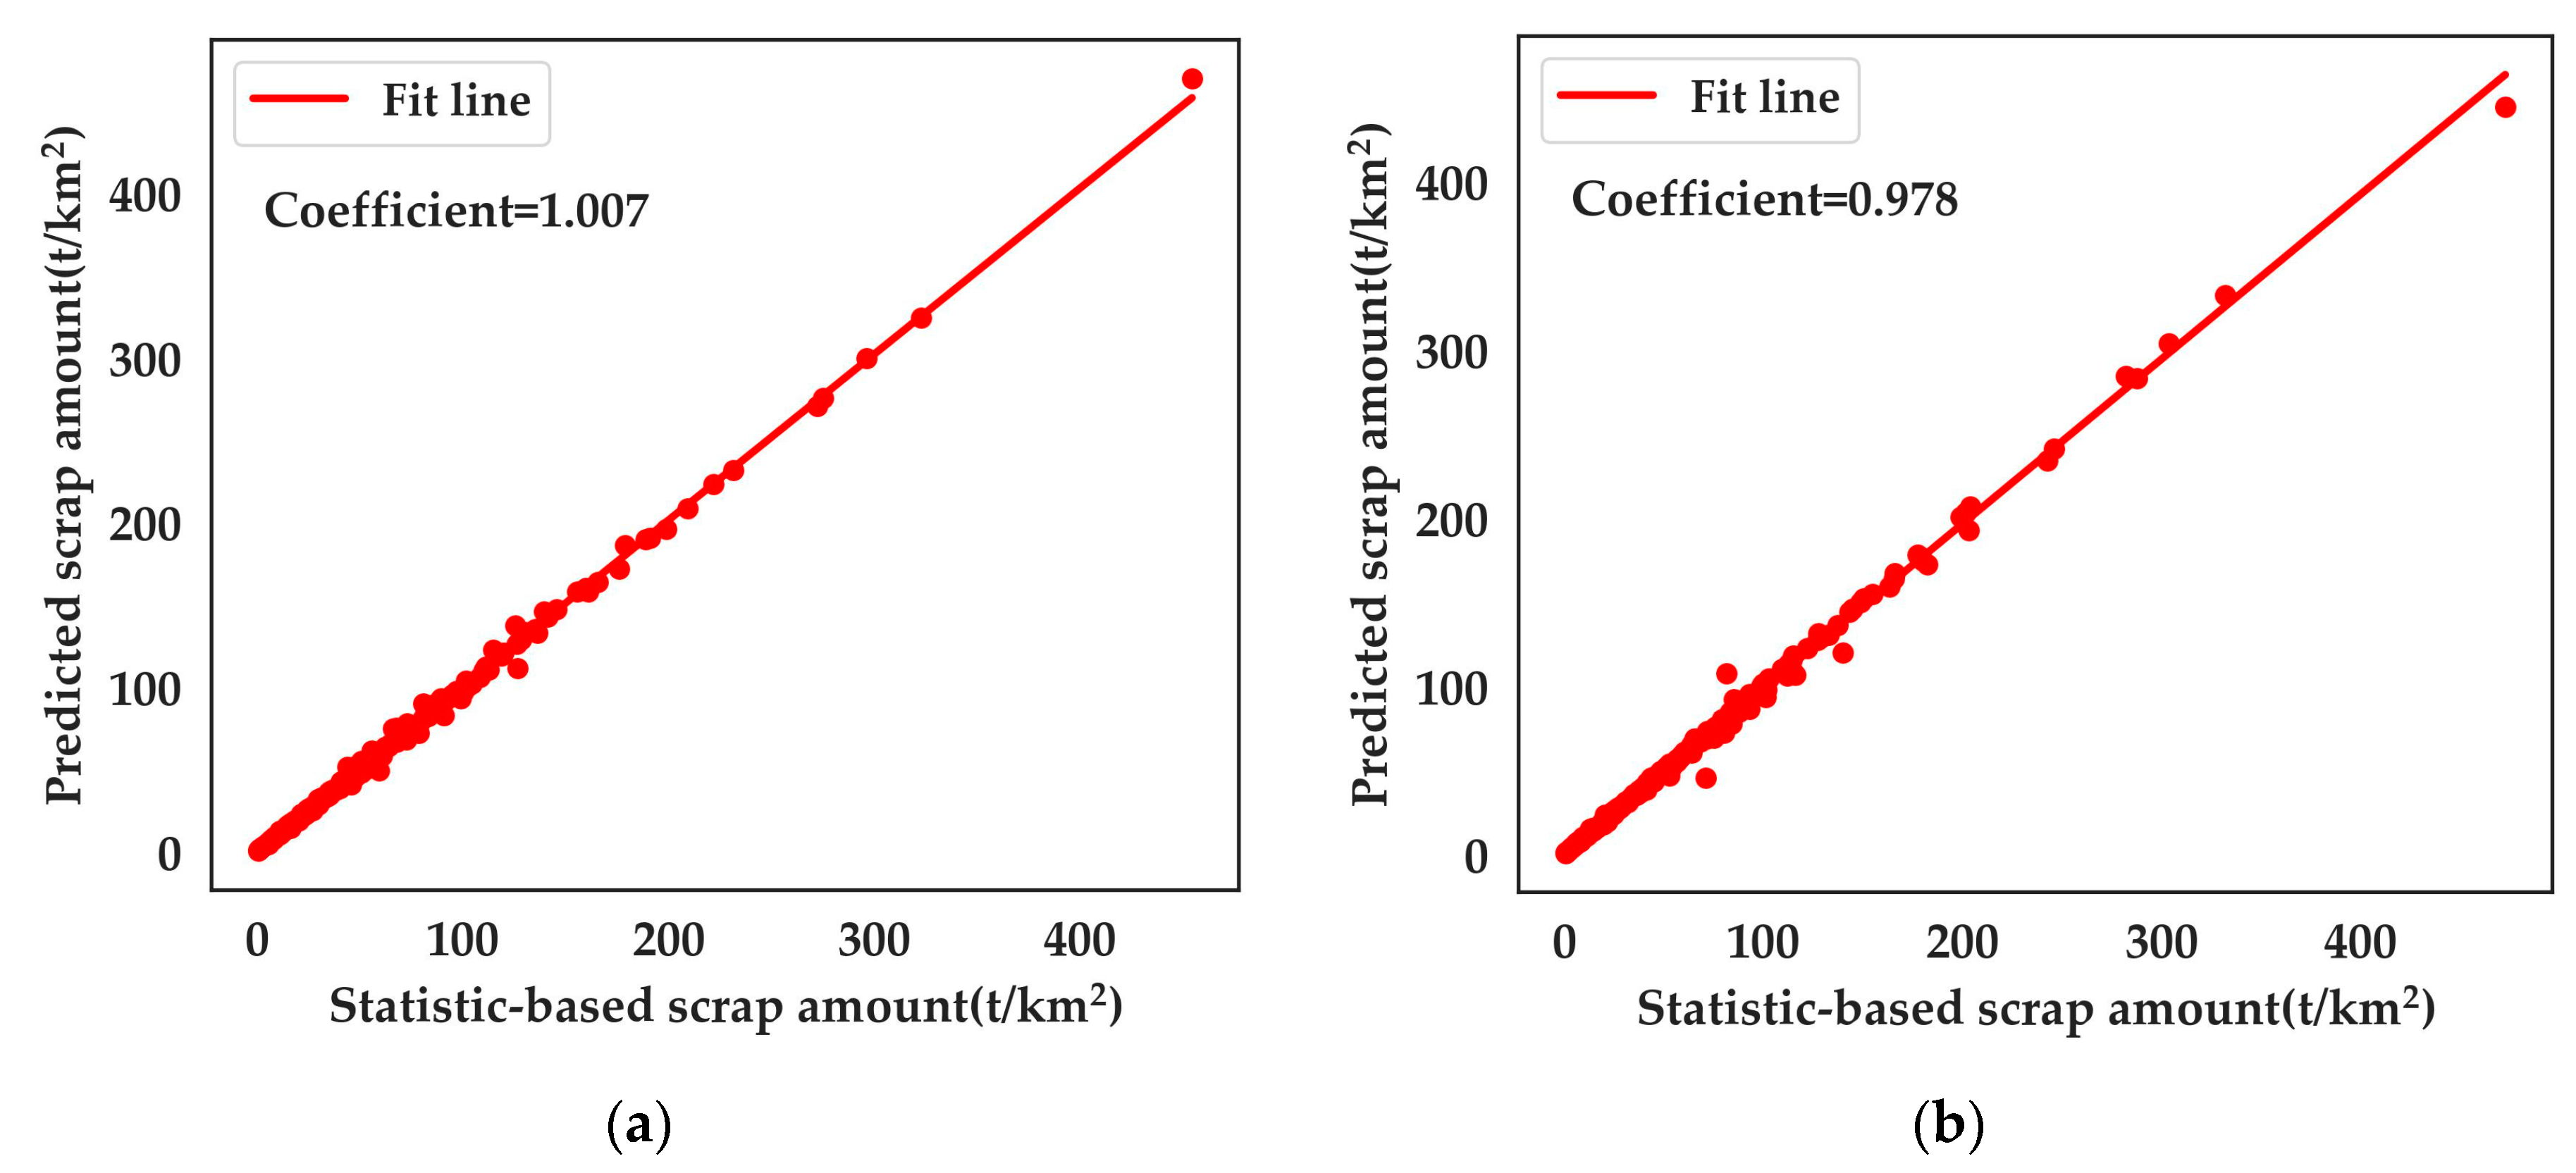
Then, a multiple linear regression model between scrap and these three variables was developed by region. Data from 2010 to 2018 were used as the training set for the model, and data from 2019 and 2020 were used as the test set for the model. We compared the statistically obtained data with the data predicted by the model (Figure 11). The results showed that the goodness-of-fit R2 was 0.996 with a coefficient of 1.007 for 2019 and that R2 was 0.997 with a coefficient of 0.978 for 2020. Most of the points are more uniformly distributed along the 1:1 line. This also implies that the multiple linear regression model constructed in this study is robust at grid scales.
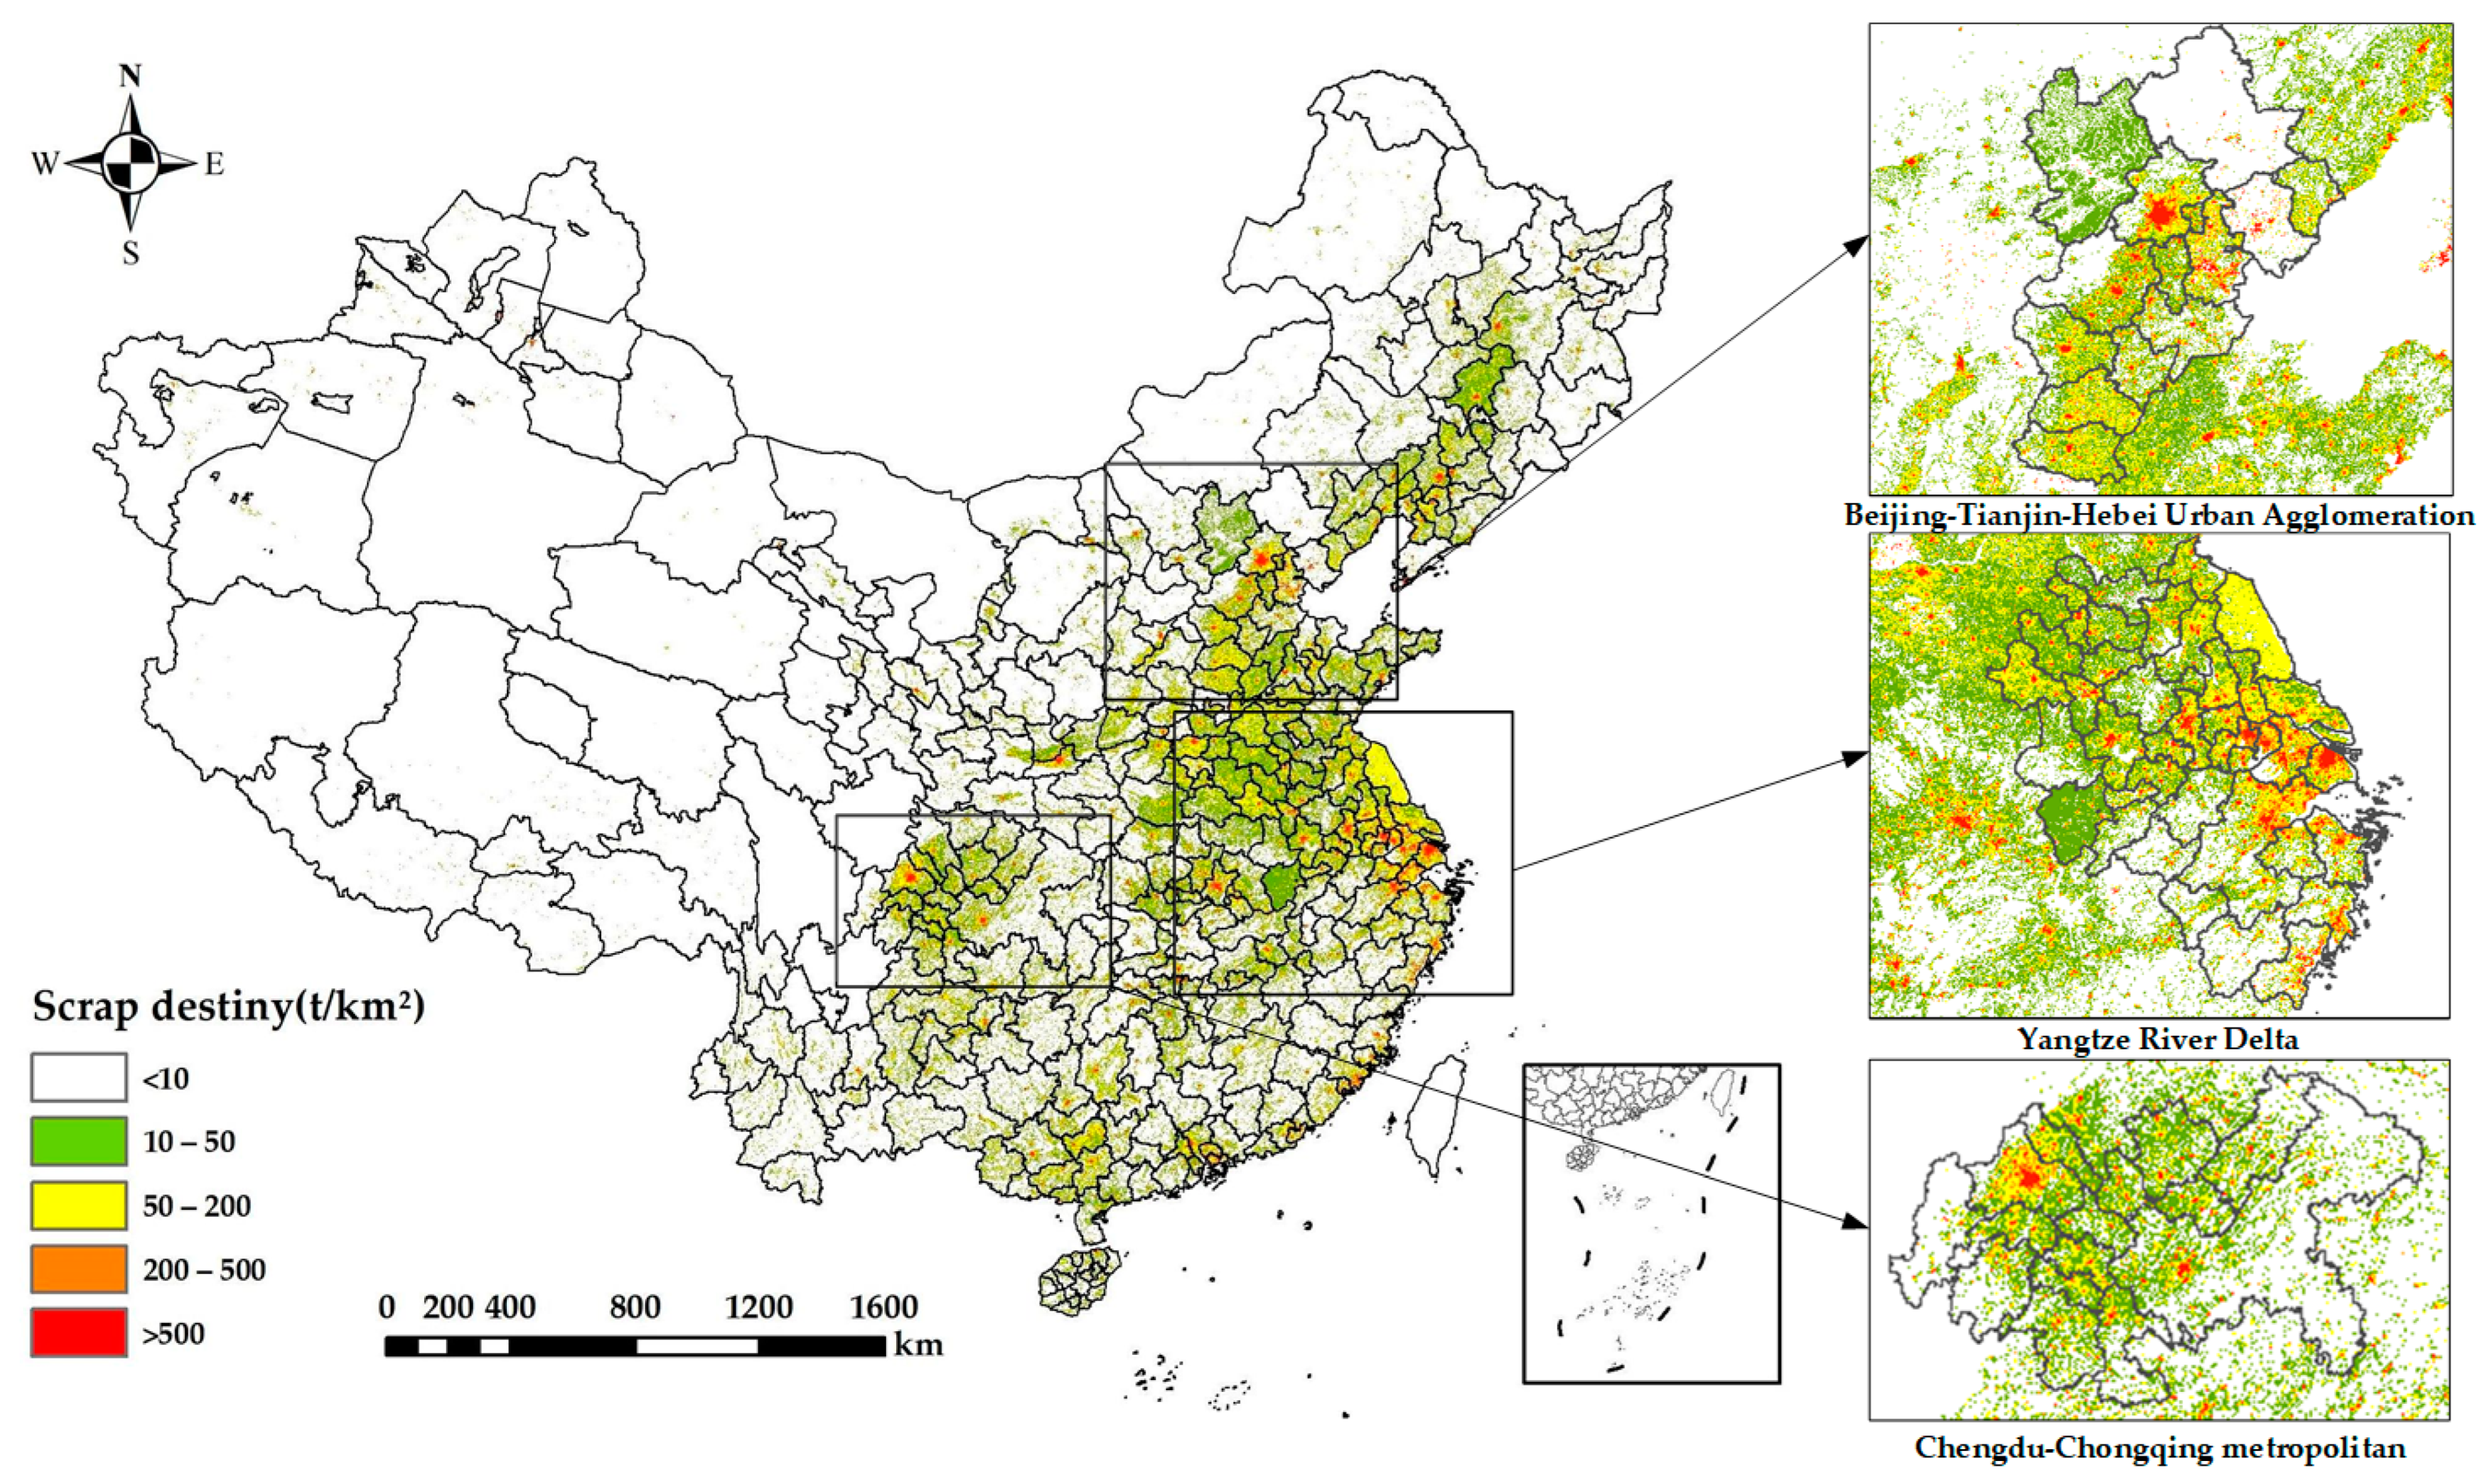
The use of the model described above allows the prediction of metal scraps and the expression of the downscaling of metal scraps by socio-economic nomenclature variables. However, the process of spatializing the metal scraps using multiple data sources is followed by certain errors due to the variability of the data scales. Therefore, pixel-wise corrections to the dedicated high-resolution metal-scrap data are required. First, the estimated negative image element that does not match the actual situation is set to 0. After that, the error correction method in Section 3.1.2 was used to correct the error of each image element. The error-corrected high-resolution raster data for the 2020 metal-scrap density is shown in Figure 12.
The distribution of scrap resources in the Chinese mainland shows a clear pattern of more in the east and less in the west, and the overall distribution is not balanced. This is because the amount of scrap is generally widely distributed in human-settled areas, and the location advantage of the eastern region has led to large population migrations and rapid urbanization. In contrast, western China has a lower level of urbanization, slower economic growth, and correspondingly scarce resources for metal scrap amount. In the Beijing–Tianjin–Hebei urban agglomeration, the distribution of the amount of scrap shows a pattern of radiated outwards, with Beijing as the center. The high value of scrap amount in Beijing is concentrated in the urban ring, especially in the economic centers such as Haidian District and Chaoyang District. The distribution of the amount of scrap in the Yangtze River Delta region is mainly concentrated in the coastal and coastal surrounding areas, such as Shanghai, Hangzhou, and Suzhou, and the rapidly developing economic areas, such as Nanjing and Wuxi. In contrast, the corresponding values were lower in most parts of Anhui, especially in the northern and inland regions. In the Chengdu–Chongqing metropolitan area, the amount of scrap was mainly concentrated in the Chongqing and Chengdu urban areas.

4.2. Spatial Layout Assessment of the UMPB Based on Accessibility

4.2.1. Accessibility Measure Based on the 2SFCA Method

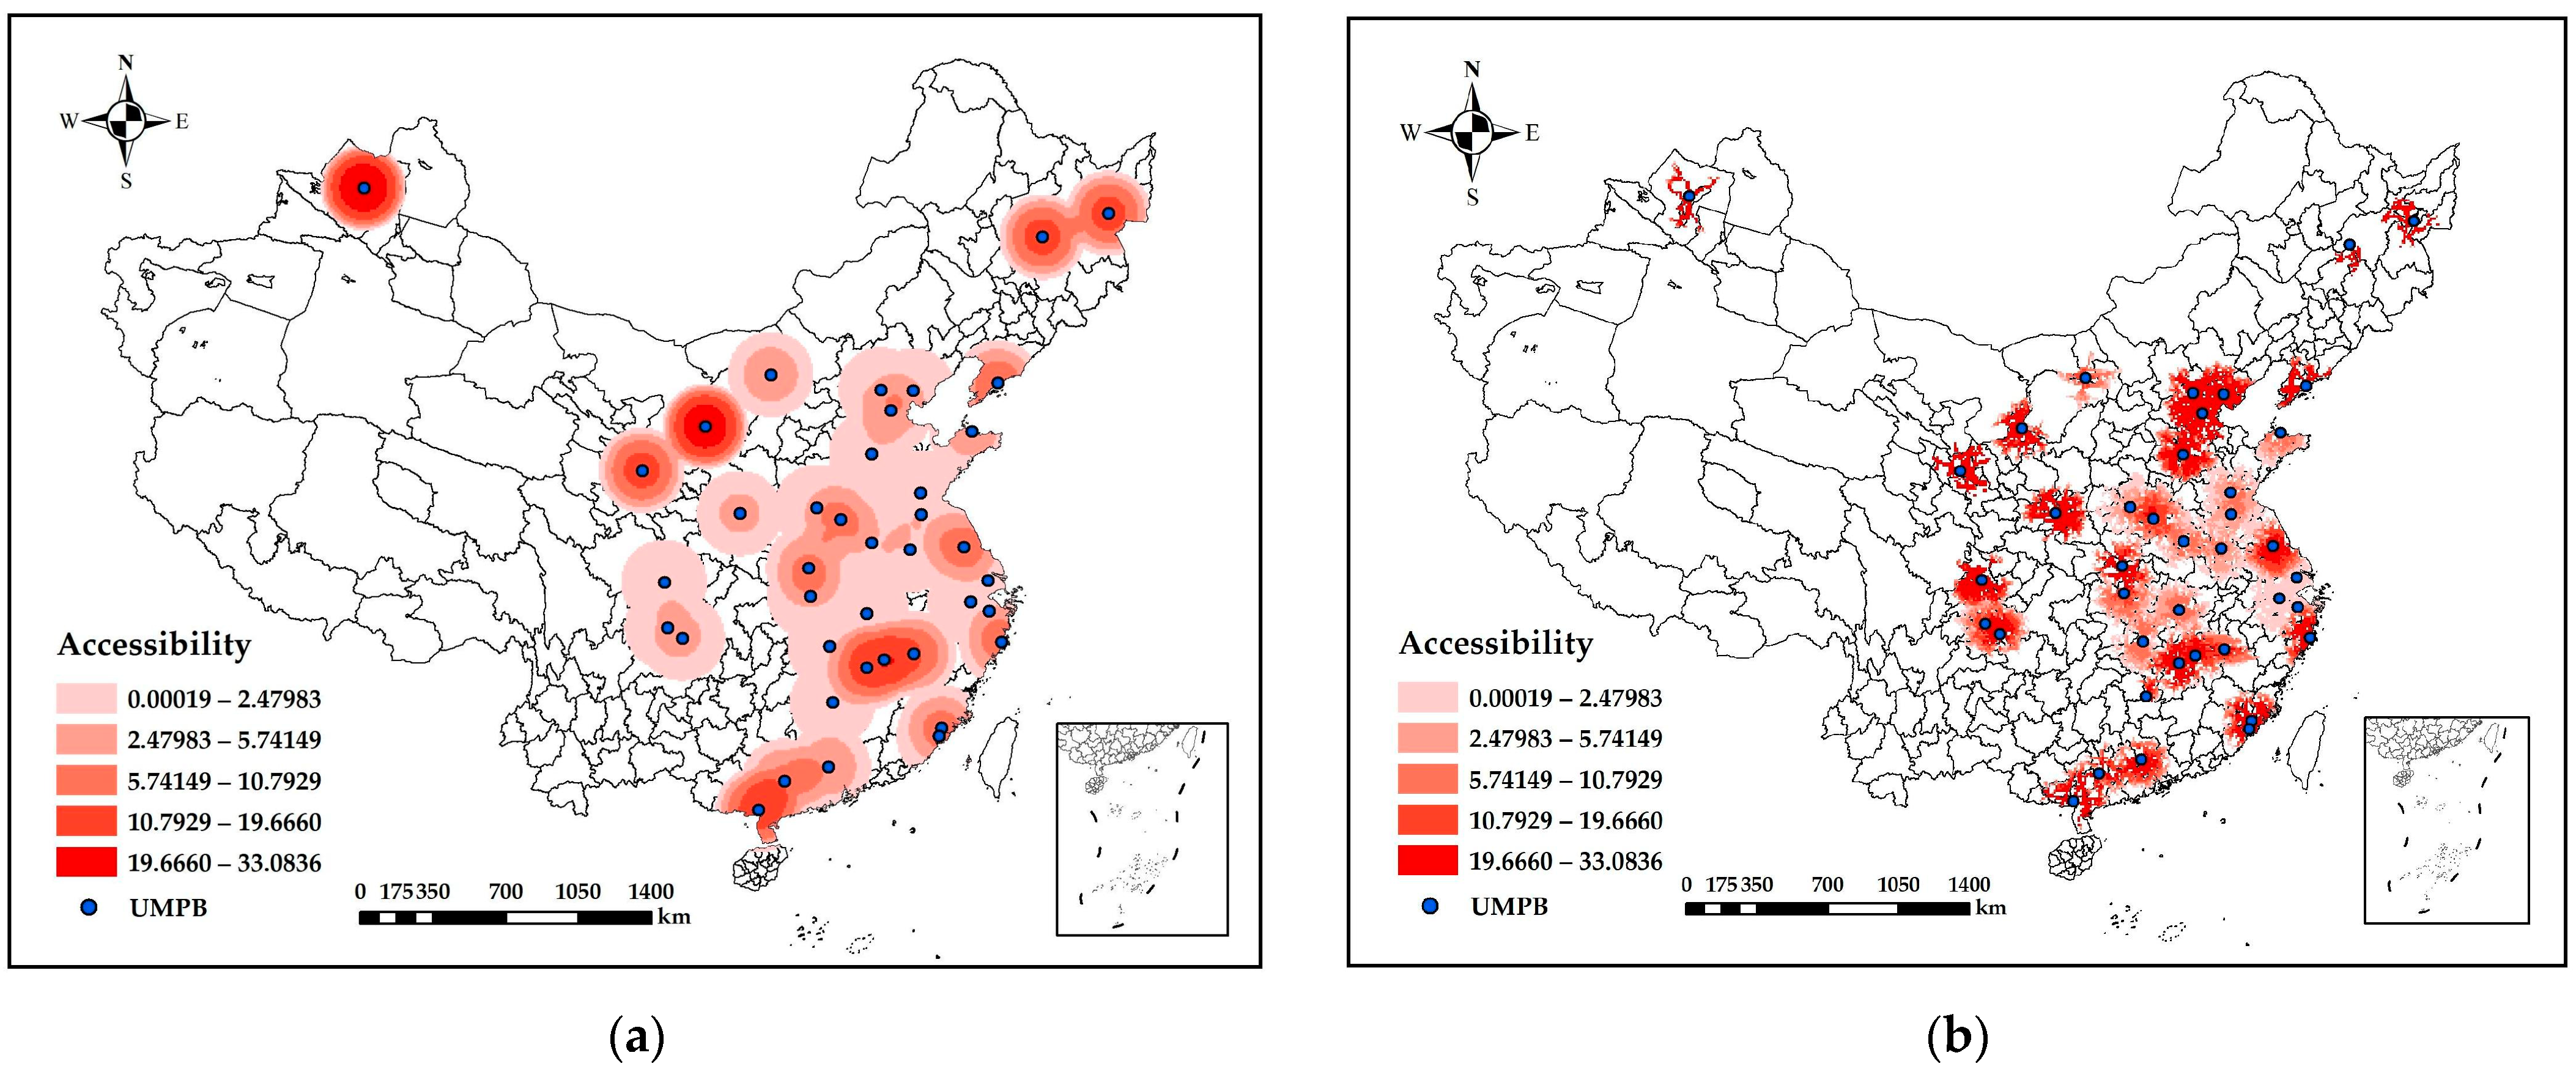
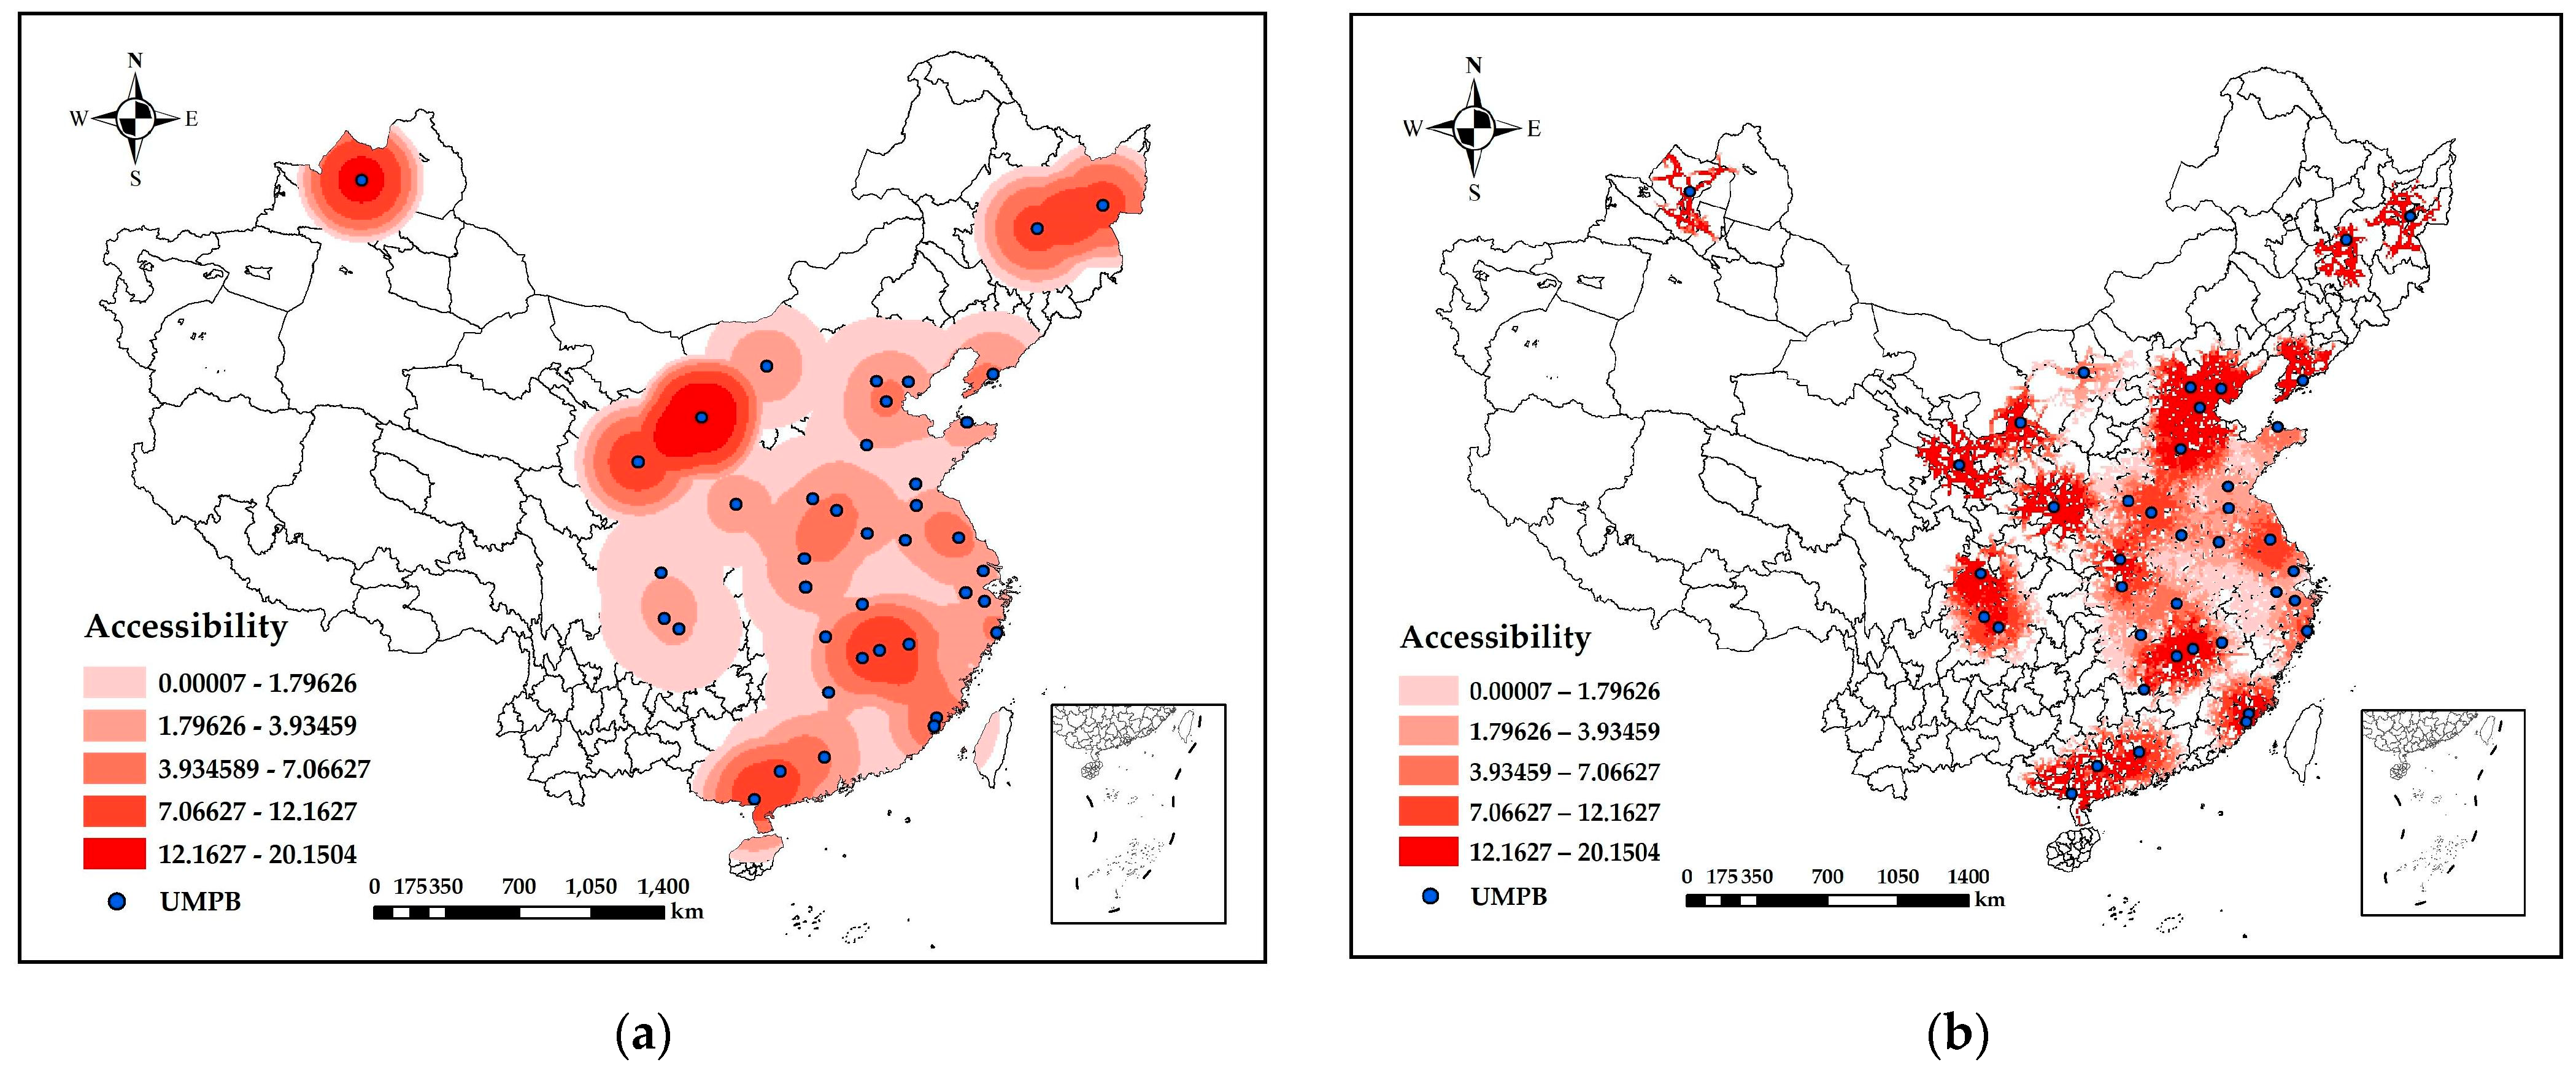
Accessibility is a metric used to measure how easy it is for a demand point to obtain resources from the UMPB for recycling services. The magnitude of the value itself has no practical meaning, and only the comparison of the accessibility values across locations in a particular region has explanatory power. Firstly, we divide the three circles according to the theory of concentric zones and choose Euclidean distance and road network distance for comparison experiments. According to Equations (9)–(11), the accessibility of the corresponding demand points was calculated, and, then, the points were converted into surfaces for visualization. In the accessibility grading, we used the natural breakpoint method to classify accessibility into five levels.
The results of the accessibility classification of the inner circle are shown in Figure 13. The accessibility distribution based on the Euclidean distance presented a circle with the UMPB as the center spreading outward. For the surrounding area of a single UMPB, the closer to the circle, the greater the accessibility. At the same time, the accessibility around it varied due to some variability in the service resources provided by different UMPBs. For example, accessibility was highest in areas near UMPBs in Xinjiang and Gansu due to lower demand in the vicinity. The achievable rate based on road network distance calculation has a lower coverage area compared to the achievable rate based on the Euclidean distance calculation. This is because the road network distance between two points is often larger than the Euclidean distance.
The results of the accessibility classification for the middle circle are shown in Figure 14. Below this service radius, the accessibility based on Euclidean distance largely covered the eastern part of mainland China. However, the area covered by the road-network-based accessibility is smaller than the area covered by the Euclidean-distance-based inner circle accessibility. The accessibility coverage of UMPB, especially in Xinjiang and northeast China, is minimal due to the sparse road networks in the locations. However, the accessibility based on the distance of the road network was relatively high in all the areas covered. This also means that both road network density and road network distance affect the level of accessibility value. The higher the density of the road network near the demand point, or the shorter the distance of UMPB from the road network to the demand point, the higher the accessibility will be accordingly.
The results of the accessibility classification for the outer circle are shown in Figure 15. With this service radius, the coverage area based on Euclidean distance accessibility was already the vast majority of eastern China and part of western China. Of these, the achievable values are mostly average in central China, while the achievable values are higher around the UMPB in western and northeastern China. The road network distance accessibility distribution in the outer circle was more similar to the Euclidean distance accessibility distribution in the middle circle. Both of them mainly cover most of the eastern part of China. However, the accessibility range of the road network distance was more irregular.

4.2.2. Spatial Layout Assessment from the Perspective of Supply–Demand Balance

Due to practical considerations, we use the road network distance accessibility for further work. In particular, the road network accessibility coverage area was too small to be realistic due to the division of the inner circular layer. Therefore, in the spatial layout assessment work, only the road network accessibility calculated in the middle and outer circle layers was selected for correlation analysis with the scrapped amount in 2020 (Figure 16).
The results based on the middle circle division had the highest number of insignificant and low-low value clusters with 45.30% and 46.12%, respectively. In addition, the number of cells with high-high clustering, low-high clustering, and high-low clustering accounted for 0.67%, 6.32%, and 1.59%, respectively. The low-high clustering and high-low clustering cell data show an imbalance between supply and demand. Of these, the low-high clustering units were the sectors of greater interest to us, with lower supply and higher demand in these areas. The clustering results based on the outer circle division had an overall high similarity with the corresponding distribution of the middle circle. However, due to the larger service range set by the UMPB, the corresponding low-high value clustering units have fewer results compared to the middle circle division, with a 0.43% lower percentage. This also means that some areas with lower supply and demand are receiving a greater supply of service resources.
By performing a bivariate autocorrelation analysis of the accessibility and metal scrap quantity, we detected areas of imbalance between the supply and demand for UMPB service resources in mainland China. The results of this evaluation also provide an answer to the question of whether the spatial layout of UMPBs in China is reasonable. In addition, the results of this study may provide directions for the site optimization of UMPBs in China.

5. Conclusions

Based on the bottom-up approach, this study estimates the in-use stocks of steel, copper, and aluminum in 366 regions in mainland China. Over the time horizon of this study, the country’s in-use stocks of steel, copper, and aluminum increased by 1458 million tons, 299 million tons, and 273 million tons, respectively. Using the provincial metal in-use stock and metal scrap data published in the literature, we indirectly calculate the quantity of metal scraps at the prefecture-level municipal scale. In this study, we propose a more refined method to estimate the amount of metal scraps at the grid scale by constructing a linear regression model between metal scraps and population, GDP, and built-up area based on prefecture-level urban statistics. The grid map of metal scraps shows that the metal scrap volume is clustered in large urban agglomerations. Meanwhile, the amount of scraps is much higher in metropolitan areas and provincial capitals than in other regions.
In this study, we perform further applications with UMPBs as objects, based on the spatially resolved data of the scrapped volumes. We divide the service radius for UMPBs of three different sizes and use Euclidean distance and road network distance to calculate the accessibility of the area where the scrapped volume was distributed in mainland China. The accessibility coverage under a 150 km service radius was smaller, and the 200 km and 300 km service radii were more in line with the actual situation. We consider the UMPB as the facility that provides the service resources and the area where the scrap resources were located as the demand area, and based on this, we carried out a spatial layout assessment of the existing UMPB. Based on the bivariate spatial autocorrelation method, we identified the supply and demand imbalance regions under different service radii. These areas of imbalance between supply and demand are the areas that need to be optimized. Therefore, this study contributes to our understanding of the spatial and temporal dynamics of steel, copper, and aluminum inventories and scrap volumes and supports more efficient recycling of scrap metals.
Based on the findings of this paper, we further provide some suggestions to guide the spatial layout adjustment of scrap metal recycling as well as UMPB, as follows:
(1)
Introduce scrap metal recycling and treatment technologies from advanced countries and increase funding for national technology research. The level of technology and equipment is an important bottleneck that limits the recycling of urban mineral resources. Strict pollution control and environmental management standards need to be set in all aspects of the treatment of scrap metals to achieve the synergistic development of high recycling efficiency and low pollution.
(2)
Explore the spatial and temporal distribution pattern of urban minerals and realize the intelligent supervision of the industry. Apply emerging information technologies such as big data and cloud computing to the field of urban minerals to monitor the changes in urban mineral resources. Encourage the introduction of local industry policies and promote successful urban mineral informatization cases nationwide.
(3)
Increase the number of UMPB constructions and improve the processing capacity of UMPB to meet the increasing demand for scrap metal recycling. The existing UMPBs are mainly distributed in the eastern region, and the number of UMPBs in the western region is too small to meet the demand for scrap metal recycling in the surrounding areas. It is suggested to build several new UMPBs in some cities in the west with better economic and resource bases so as to promote the development of a circular economy in the west while making the level of scrap metal recycling in China more equitable in the region.
However, this study is not without limitations. In the accessibility calculation section, we classify circles mainly based on experience and previous studies. In addition, the spatial layout evaluation in this study provides the detection of the supply–demand imbalance region of the existing UMPB but does not give a practical optimization scheme. In future research, we plan to develop an adaptive service radius determination method for a more accurate measurement of the accessibility of the areas surrounding the UMPB. In addition, optimizing the spatial layout of the existing UMPB is another direction for future research.

Author Contributions

Conceptualization, M.X., X.Y., H.L. and Y.S.; data curation, M.X.; methodology, H.L., M.X. and X.Y.; visualization, M.X., H.L. and X.Y.; writing—original draft, H.L. and M.X.; writing—review and editing, H.L., M.X., X.Y. and M.D. All authors have read and agreed to the published version of the manuscript.

Funding

This research was supported by grants from the Hunan High-Tech Industry Scientific and Technological Innovation Leading program (2020SK2007), the National Natural Science Foundation of China (42271485 and 42171459), the Natural Science Foundation of Hunan Province (2022JJ40585), the Scientific Research Project of Education Department of Hunan Province (22B0015), and the Scientific Research Project of Natural Resources Department of Hunan Province (2013-17, 2014-12, 2015-09, and 2017-15).

Institutional Review Board Statement

Not applicable.

Informed Consent Statement

Not applicable.

Data Availability Statement

Not applicable.

Acknowledgments

This work was carried out in part using computing resources at the High-Performance Computing Platform of Central South University.

Conflicts of Interest

The authors declare no conflict of interest.

References

  1. Muñoz, E.; Navia, R. Circular economy in urban systems: How to measure the impact? Waste Manag. Res. 2021, 39, 197–198. [Google Scholar] [CrossRef] [PubMed]
  2. Greedy, D. The challenge of the circular economy and the fourth industrial revolution. Waste Manag. Res. 2021, 39, 1329–1330. [Google Scholar] [CrossRef] [PubMed]
  3. Rauch, J.N. Global mapping of Al, Cu, Fe, and Zn in-use stocks and in-ground resources. Proc. Natl. Acad. Sci. USA 2009, 106, 18920–18925. [Google Scholar] [CrossRef]
  4. Chen, W.-Q.; Graedel, T.E. In-use product stocks link manufactured capital to natural capital. Proc. Natl. Acad. Sci. USA 2015, 112, 6265–6270. [Google Scholar] [CrossRef] [PubMed]
  5. Jacobs, J. The Economy of Cities; Random House: New York, NY, USA, 1969. [Google Scholar]
  6. Chen, C.; Liu, Y. Construction and demolition wastes in Beijing: Where they come from and where they go? Waste Manag. Res. 2021, 39, 555–560. [Google Scholar] [CrossRef]
  7. Mao, R.; Bao, Y.; Huang, Z.; Liu, Q.; Liu, G. High-Resolution Mapping of the Urban Built Environment Stocks in Beijing. Environ. Sci. Technol. 2020, 54, 5345–5355. [Google Scholar] [CrossRef]
  8. Wiedenhofer, D.; Steinberger, J.K.; Eisenmenger, N.; Haas, W. Maintenance and Expansion: Modeling Material Stocks and Flows for Residential Buildings and Transportation Networks in the EU25. J. Ind. Ecol. 2015, 19, 538–551. [Google Scholar] [CrossRef] [PubMed]
  9. Zhang, K.; Schnoor, J.L.; Zeng, E.Y. E-waste recycling: Where does it go from here? Environ. Sci. Technol. 2012, 46, 10861–10867. [Google Scholar] [CrossRef]
  10. Widmer, R.; Oswald-Krapf, H.; Sinha-Khetriwal, D.; Schnellmann, M.; Böni, H. Global perspectives on e-waste. Environ. Impact Assess. Rev. 2005, 25, 436–458. [Google Scholar] [CrossRef]
  11. Liu, K.; Tan, Q.; Yu, J.; Wang, M. A global perspective on e-waste recycling. Circ. Econ. 2023, 2, 100028. [Google Scholar] [CrossRef]
  12. Van Eygen, E.; De Meester, S.; Tran, H.P.; Dewulf, J. Resource savings by urban mining: The case of desktop and laptop computers in Belgium. Resour. Conserv. Recycl. 2016, 107, 53–64. [Google Scholar] [CrossRef]
  13. Guo, X.; Yan, K. Estimation of obsolete cellular phones generation: A case study of China. Sci. Total Environ. 2017, 575, 321–329. [Google Scholar] [CrossRef] [PubMed]
  14. Parajuly, K.; Habib, K.; Liu, G. Waste electrical and electronic equipment (WEEE) in Denmark: Flows, quantities and management. Resour. Conserv. Recycl. 2017, 123, 85–92. [Google Scholar] [CrossRef]
  15. Zhang, L.; Yang, J.; Cai, Z.; Yuan, Z. Understanding the Spatial and Temporal Patterns of Copper In-Use Stocks in China. Environ. Sci. Technol. 2015, 49, 6430–6437. [Google Scholar] [CrossRef]
  16. Müller, E.; Hilty, L.M.; Widmer, R.; Schluep, M.; Faulstich, M. Modeling Metal Stocks and Flows: A Review of Dynamic Material Flow Analysis Methods. Environ. Sci. Technol. 2014, 48, 2102–2113. [Google Scholar] [CrossRef]
  17. Chen, W.-Q.; Graedel, T. Improved Alternatives for Estimating In-Use Material Stocks. Environ. Sci. Technol. 2015, 49, 3048–3055. [Google Scholar] [CrossRef]
  18. Wang, T.; Müller, D.B.; Graedel, T.E. Forging the Anthropogenic Iron Cycle. Environ. Sci. Technol. 2007, 41, 5120–5129. [Google Scholar] [CrossRef]
  19. Pauliuk, S.; Wang, T.; Müller, D.B. Steel all over the world: Estimating in-use stocks of iron for 200 countries. Resour. Conserv. Recycl. 2013, 71, 22–30. [Google Scholar] [CrossRef]
  20. Augiseau, V.; Barles, S. Studying construction materials flows and stock: A review. Resour. Conserv. Recycl. 2017, 123, 153–164. [Google Scholar] [CrossRef]
  21. Zhang, L.; Yuan, Z.; Bi, J. Estimation of copper in-use stocks in Nanjing, China. J. Ind. Ecol. 2012, 16, 191–202. [Google Scholar] [CrossRef]
  22. Zhang, L.; Cai, Z.; Yang, J.; Chen, Y.; Yuan, Z. Quantification and spatial characterization of in-use copper stocks in Shanghai. Resour. Conserv. Recycl. 2014, 93, 134–143. [Google Scholar] [CrossRef]
  23. Liang, H.; Tanikawa, H.; Matsuno, Y.; Dong, L. Modeling in-use steel stock in China’s buildings and civil engineering infrastructure using time-series of DMSP/OLS nighttime lights. Remote Sens. 2014, 6, 4780–4800. [Google Scholar] [CrossRef]
  24. Song, L.; Zhang, C.; Han, J.; Chen, W.-Q. In-use product and steel stocks sustaining the urbanization of Xiamen, China. Ecosyst. Health Sustain. 2019, 5, 110–123. [Google Scholar] [CrossRef]
  25. Hansen, W.G. How Accessibility Shapes Land Use. J. Am. Inst. Plan. 1959, 25, 73–76. [Google Scholar] [CrossRef]
  26. Talen, E.; Anselin, L. Assessing Spatial Equity: An Evaluation of Measures of Accessibility to Public Playgrounds. Environ. Plan. A Econ. Space 1998, 30, 595–613. [Google Scholar] [CrossRef]
  27. Dai, D. Racial/ethnic and socioeconomic disparities in urban green space accessibility: Where to intervene? Landsc. Urban Plan. 2011, 102, 234–244. [Google Scholar] [CrossRef]
  28. Shao, Y.; Luo, W. Supply-demand adjusted two-steps floating catchment area (SDA-2SFCA) model for measuring spatial access to health care. Soc. Sci. Med. 2022, 296, 114727. [Google Scholar] [CrossRef]
  29. Liu, L.; Lyu, H.; Zhao, Y.; Zhou, D. An Improved Two-Step Floating Catchment Area (2SFCA) Method for Measuring Spatial Accessibility to Elderly Care Facilities in Xi’an, China. Int. J. Environ. Res. Public Health 2022, 19, 11465. [Google Scholar] [CrossRef]
  30. Yang, Y.; He, R.; Tian, G.; Shi, Z.; Wang, X.; Fekete, A. Equity Study on Urban Park Accessibility Based on Improved 2SFCA Method in Zhengzhou, China. Land 2022, 11, 2045. [Google Scholar] [CrossRef]
  31. Wang, T.; Müller, D.B.; Hashimoto, S. The ferrous find: Counting iron and steel stocks in China’s economy. J. Ind. Ecol. 2015, 19, 877–889. [Google Scholar] [CrossRef]
  32. Recalde, K.; Wang, J.; Graedel, T. Aluminium in-use stocks in the state of Connecticut. Resour. Conserv. Recycl. 2008, 52, 1271–1282. [Google Scholar] [CrossRef]
  33. Song, L.; Han, J.; Li, N.; Huang, Y.; Hao, M.; Dai, M.; Chen, W.-Q. China material stocks and flows account for 1978–2018. Sci. Data 2021, 8, 303. [Google Scholar] [CrossRef] [PubMed]
  34. Ji, X. Potential Analysis and Layout Optimization for Urban Mining in China. Master’s Thesis, Tsinghua University, Beijing, China, June 2013. [Google Scholar]
  35. Liu, Q.; Cao, Z.; Liu, X.; Liu, L.; Dai, T.; Han, J.; Duan, H.; Wang, C.; Wang, H.; Liu, J.; et al. Product and metal stocks accumulation of China’s megacities: Patterns, drivers, and implications. Environ. Sci. Technol. 2019, 53, 4128–4139. [Google Scholar] [CrossRef] [PubMed]
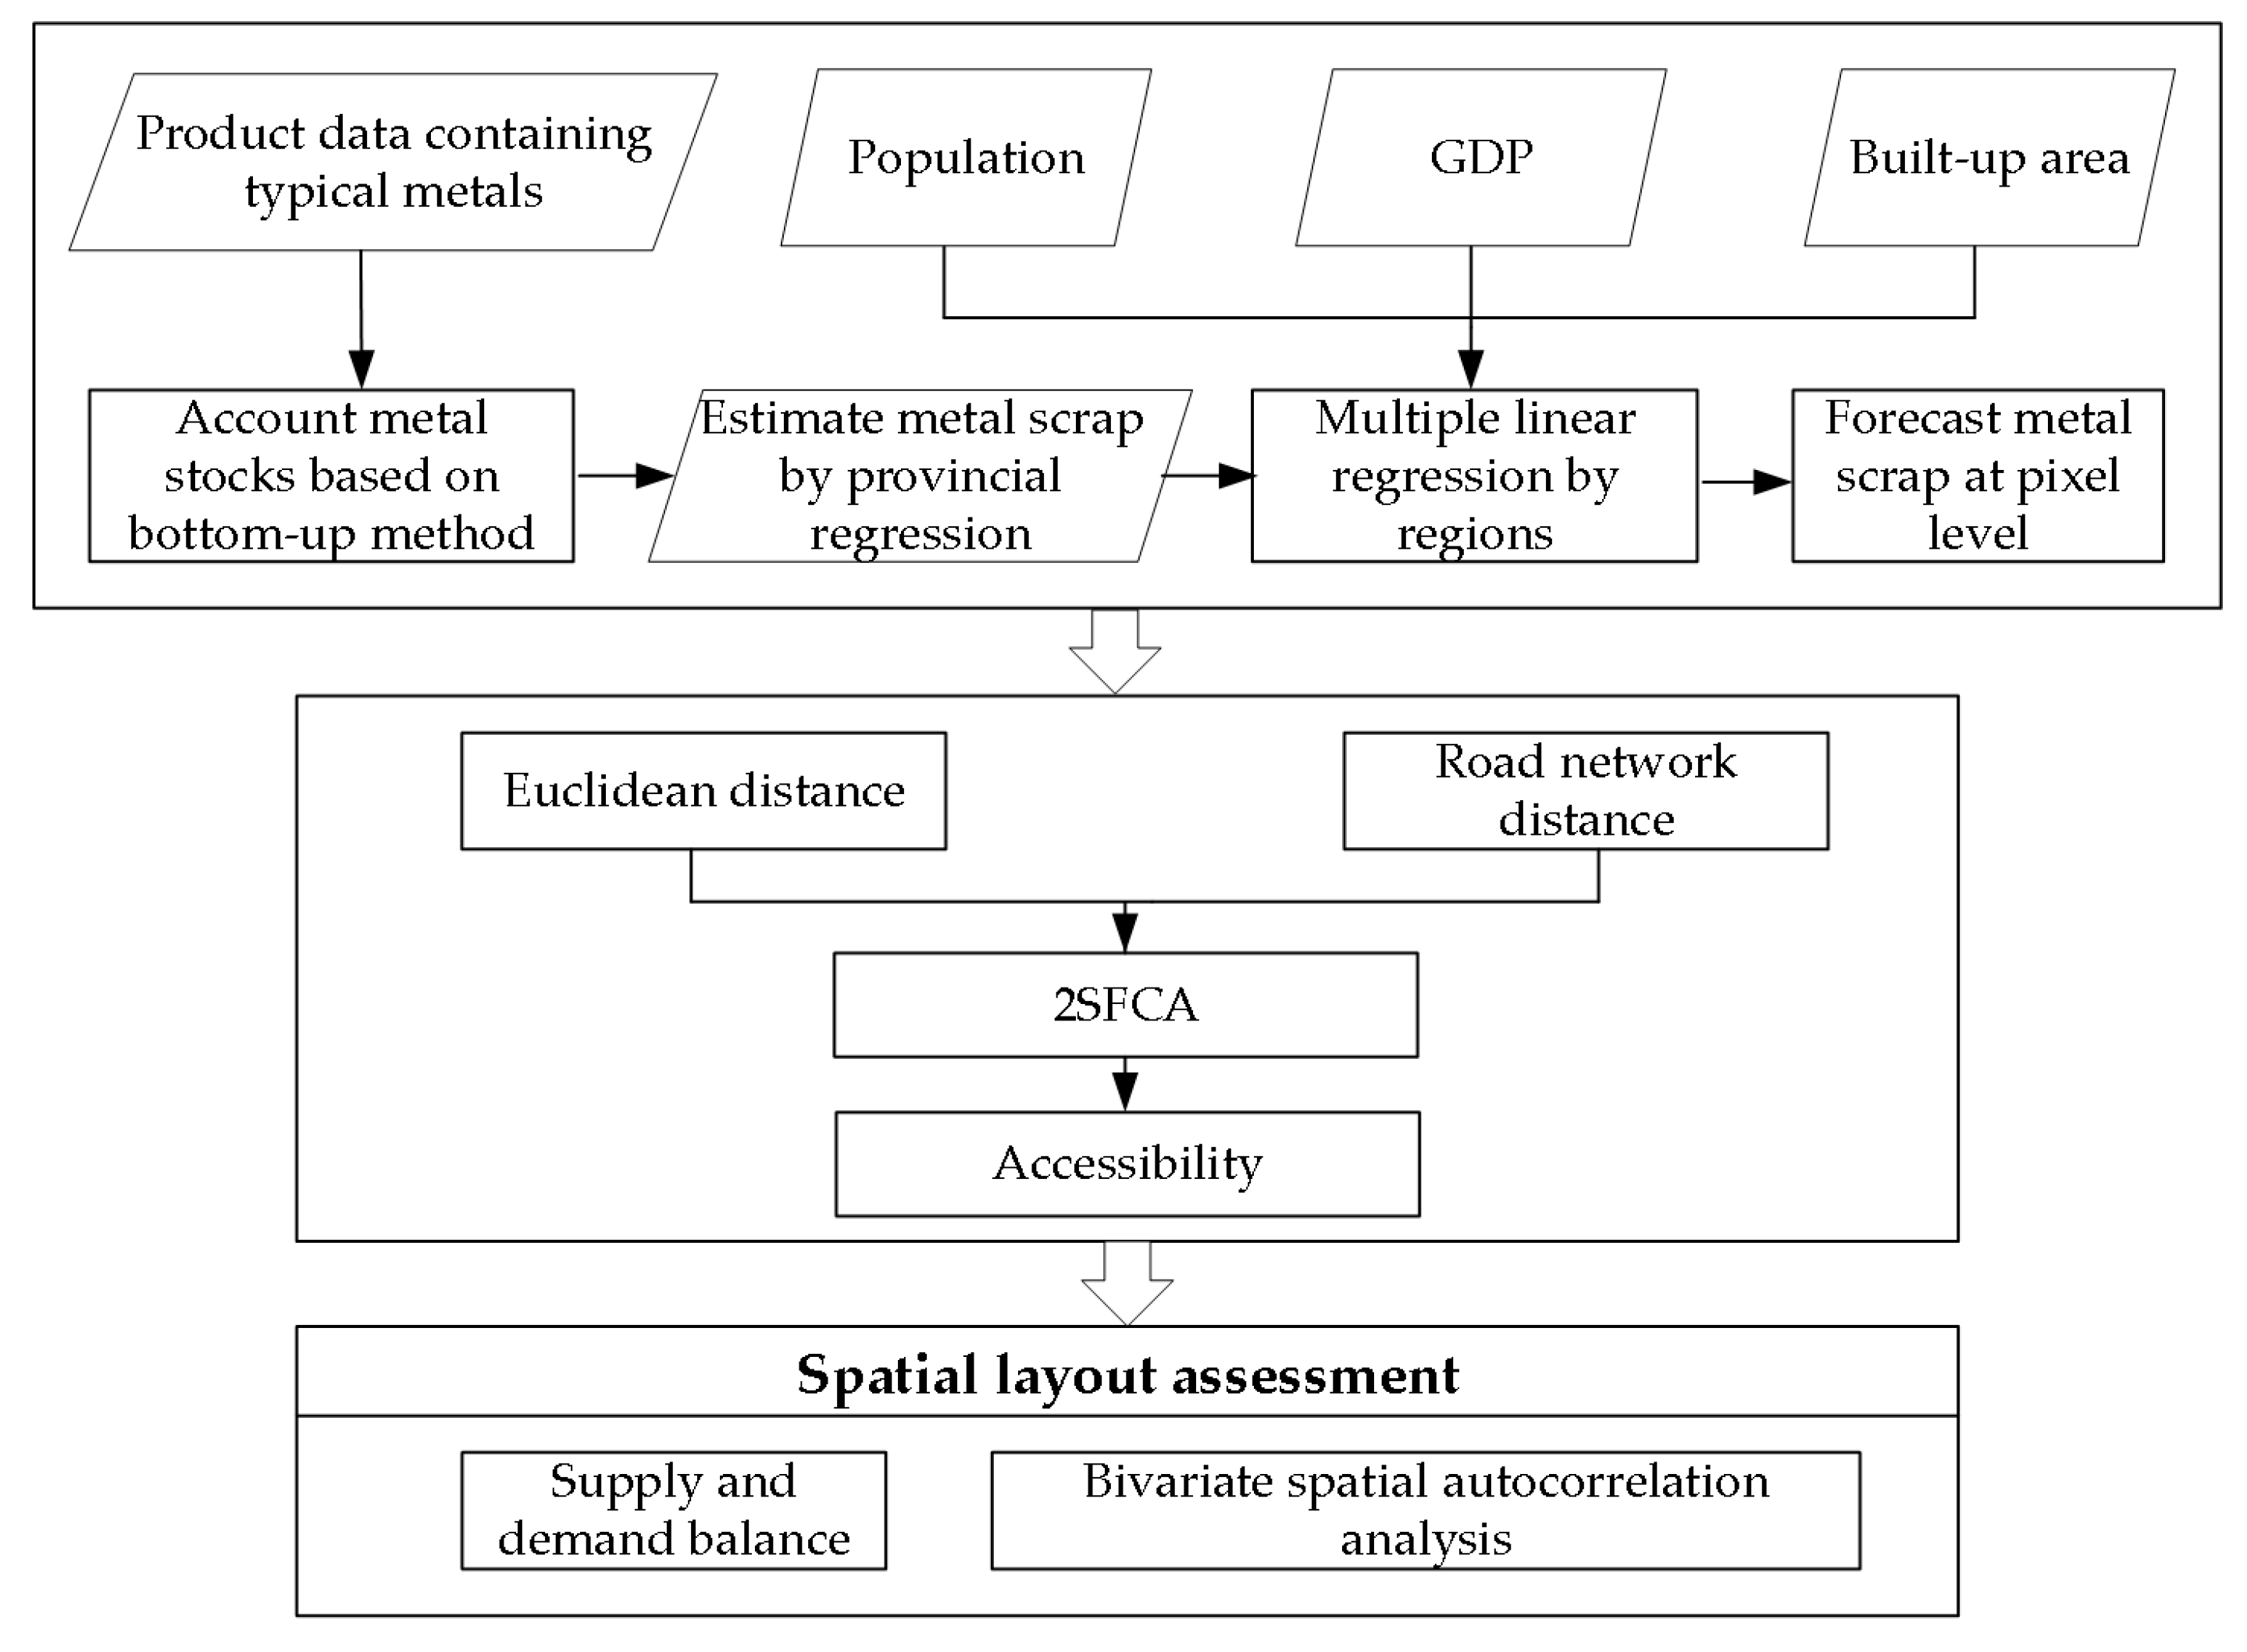
Figure 1. Framework for spatial layout assessment.
Sustainability 15 07977 g001
Figure 2. Categories and subcategories of steel, copper, and aluminum in-use stocks.
Sustainability 15 07977 g002
Figure 3. The connection line between the UMPB and the demand point in the three circles.
Sustainability 15 07977 g003
Figure 4. The in-use stocks of steel, copper, and aluminum in mainland China.
Sustainability 15 07977 g004
Figure 5. The metal in-use stocks at the provincial level.
Sustainability 15 07977 g005
Figure 6. In-use stocks per capita at the provincial level in mainland China. (a) Provinces of northeast China and east China; (b) provinces of central China and west China.
Sustainability 15 07977 g006
Figure 7. In-use stocks and per capita stocks at the city level in mainland China in 2020. (a) Steel; (b) copper; (c) aluminum.
Sustainability 15 07977 g007
Figure 8. The scrap amount and per capita scrap amount.
Sustainability 15 07977 g008
Figure 9. Provincial metal scrap in mainland China.
Sustainability 15 07977 g009
Figure 10. Relationship of metal scrap density with socioeconomic variables for Tianjin. (a) Population; (b) GDP; (c) built-up area.
Sustainability 15 07977 g010
Figure 11. Comparison of predicted metal scrap with statistical-based metal scrap for 366 regions in China. (a) Results in 2019; (b) results in 2020.
Sustainability 15 07977 g011
Figure 12. The metal scrap density in 2020.
Sustainability 15 07977 g012
Figure 13. Inner circle accessibility. (a) Euclidean distance; (b) road network distance.
Sustainability 15 07977 g013
Figure 14. Middle circle accessibility. (a) Euclidean distance; (b) road network distance.
Sustainability 15 07977 g014
Figure 15. Outer circle accessibility. (a) Euclidean distance; (b) road network distance.
Sustainability 15 07977 g015
Figure 16. Results of UMPB spatial layout assessment from the perspective of supply and demand balance. (a) Overlay analysis of accessibility and metal scrap distribution based on middle circle classification and road network distance calculation; (b) overlay analysis of accessibility and metal scrap distribution based on outer circle classification and road network distance calculation.
Sustainability 15 07977 g016
Table 1. Comparison of stock estimation between our results and previous studies.
RegionMethodYearMaterialEarlier StudiesThis StudyDifference
ChinaBottom-up2010Steel3.2 Gt [31]2.4 Gt−33%
WuhanBottom-up2011Steel24.5 Mt [35]25.6 Mt−4%
XiamenBottom-up2015Steel10 ± 3 Mt [24]12.4 Mt−5%~77%
BeijingBottom-up2016Steel+Copper+Aluminum60.5 Mt [35]82.5 Mt27%
GuangdongBottom-up2018Copper7.5 Mt [33]5.6 Mt−25%
HenanBottom-up2010Aluminum7.2 Mt [33]7.7 Mt7%
Disclaimer/Publisher’s Note: The statements, opinions and data contained in all publications are solely those of the individual author(s) and contributor(s) and not of MDPI and/or the editor(s). MDPI and/or the editor(s) disclaim responsibility for any injury to people or property resulting from any ideas, methods, instructions or products referred to in the content.