Article

Data-Driven Modeling of Vehicle-to-Grid Flexibility in Korea

1
Smart Power Distribution Laboratory of Korea Electric Power Research Institute, Korea Electric Power Corporation, Daejeon 34056, Republic of Korea
2
Basic Research Center for Electric Power of Korea Electric Power Research Institute, Korea Electric Power Corporation, Seoul 08826, Republic of Korea
3
Department of Electrical and Electronic Engineering, School of Aviation Multidisciplinary, Hanseo University, Seosan 31962, Republic of Korea
*
Author to whom correspondence should be addressed.
Sustainability 2023, 15(10), 7938; https://doi.org/10.3390/su15107938
Submission received: 16 April 2023 / Revised: 2 May 2023 / Accepted: 10 May 2023 / Published: 12 May 2023

Abstract

:
With the widespread use of electric vehicles (EVs), the potential to utilize them as flexible resources has increased. However, the existing vehicle-to-grid (V2G) studies have focused on V2G operation methods. The operational performance is limited by the amount of availability resources, which represents the flexibility. This study proposes a data-driven modeling method to estimate the V2G flexibility. A charging station is a control point connected to a power grid for V2G operation. Therefore, the charging stations’ statuses were analyzed by applying the basic queuing model with a dataset of 1008 chargers (785 AC chargers and 223 DC chargers) from 500 charging stations recorded in Korea. The basic queuing model obtained the long-term average status values of the stations over the entire time period. To estimate the V2G flexibility over time, a charging station status modeling method was proposed within a time interval. In the proposed method, the arrival rate and service time were modified according to the time interval, and the station status was expressed in a propagated form that considered the current and previous time slots. The simulation results showed that the proposed method effectively estimated the actual value within a 10% mean absolute percentage error. Moreover, the determination of V2G flexibility based on the charging station status is discussed herein. According to the results, the charging station status in the next time slot, as well as that in the current time slot, is affected by the V2G. Therefore, to estimate the V2G flexibility, the propagation effect must be considered.

1. Introduction

1.1. Motivation

Power systems have been decentralized, decarbonized, and digitized [1]. In particular, renewable power generation is rapidly increasing. By 2021, the share of renewable-power generation in the global power generation trend had reached 28.7% [2]. A 1% increase in renewable power generation is estimated to reduce CO2 emissions by 0.2% [3]. However, the penetration of renewable power generation causes problems in maintaining the stability of power systems, owing to the intermittent and unpredictable characteristics of renewable resources [4]. Thus, a high share of renewable power generation requires flexibility of the system and resources to ensure power system stability [5].
Demand-side management, such as demand response (DR) programs, is considered an important factor in providing flexible resources [6]. The DR can provide economic, technical, marketing, and environmental benefits by operating in combination with distributed flexible resources [7]. The amount of resources determines the room in which the DR can operate. Therefore, sufficient resources must be secured to operate the DR. Moreover, the characteristics of the aggregated resources must be analyzed [8].
With the widespread use of electric vehicles (EVs), the potential to utilize them as flexible resources has increased [9]. The charging rate of EVs is controllable within a very short response time, so they can potentially inject power to the grid under vehicle-to-grid (V2G) technology. By participating in DR programs, EV owners can help to reduce energy usage during peak periods by discharging their vehicles or by reducing the amount of charging during times of peak demand. These actions help to balance the electricity load on the grid and maintain reliable and affordable electricity services. In exchange for their participation, EV owners may receive various incentives, such as reduced electricity rates or credits on their utility bills. Additionally, flexibility provision by EVs can be utilized for general considerations regarding flexibility services to solve local congestion and voltage control issues [10].
The flexibility provided by EVs is also determined by the amount of EV resources. Therefore, in order to utilize EVs stably as a flexibility resource, the characteristics of the resource must be analyzed and the flexibility, which is the amount of controllable resources, must be estimated.

1.2. Prior Works

Various studies have been conducted on the use of EVs as flexible resources, including on V2G technology. Several studies have organized the V2G technology from various perspectives, as summarized in Table 1 [10,11,12,13]. However, these studies involved reviews focusing on the general availability of V2G as a flexibility resource [10], grid architecture to integrate V2G and the grid [11], and V2G operation technologies [12,13]. Thus, the research on V2G is focused on its utilization as a flexibility resource.
Various studies have shown that the flexibility of V2G can be useful and beneficial in terms of cost minimization [14,15,16,17,18], profit maximization [19,20], and grid reliability enhancement [21], as presented in Table 2. However, although the V2G flexibility, which is the amount of available resources, is an important factor in determining performance, these studies have been conducted based on simple assumptions using historical data [14,15], fixed given values [16], stochastic random models [17,18,19,20], and parametric models such as battery size [21].
Only a few empirical studies have investigated V2G flexibility [22,23,24,25], as presented in Table 3. However, these simple estimations of V2G flexibility based on a long-term average model [22], a data-dependent model [23,24], and a stochastic random model [25] are limited in terms of their general use.

1.3. Contribution

This study was focused on data-driven modeling of V2G flexibility. The main objectives were to analyze the charging station status using a dataset in Korea and to propose a queuing-based V2G flexibility model that could be extended to the general case. The main contributions of this study can be summarized as follows:
  • A queuing-based charging station status modeling method was developed. A charging station is a control point of V2G connected to the power grid. The charging station status represents the status of the available V2G resources. The charging station status can be expressed using a queuing model. The basic queuing model takes the long-term average values over the entire time. However, to implement V2G as a grid resource, the station status must be analyzed within a truncated time interval, such as 1 h. In the proposed method, the queuing model is modified by taking into account the situation in which EVs newly entering the current time slot and EVs arriving in the previous time slot appear, but do not completing the service. Accordingly, the charging station status is modeled as a propagated form that considers the current time slot as well as previous time slots. The simulation results demonstrate that the proposed method effectively represents the actual value within a 10% mean absolute percentage error.
  • The V2G flexibility was estimated using the proposed charging station status model. As the V2G flexibility is the amount of available resources participating in the DR program, it depends on the charging station’s status. However, resource participation in the DR program affects the charging station status as well. Therefore, the V2G flexibility was expressed in the form of restricting the charging station status change. The simulation results show that the V2G flexibility is limited by resources in the low-utilization period and is restricted by system constraints, such as the blocking probability in the high-utilization period. Moreover, the usefulness of V2G flexibility is discussed based on the time-of-use (ToU) tariff in Korea according to the different time zone.
The remainder of this paper is organized as follows. Section 2 provides an analysis of the charging station data recorded in Korea, and Section 3 discusses the design method of the proposed V2G flexibility model. Section 4 presents the measurement studies applied to the proposed model and discusses the lessons and future research directions. Finally, Section 5 summarizes the conclusions of this study.

2. Data Analysis in Korea

The V2G-based DR uses vehicle batteries as DR resources. However, a charging station is a control point connected to a power grid. Therefore, to estimate the V2G flexibility, the status of the charging station must be analyzed. Hence, this section presents an analysis of the statuses of charging stations using a Korean dataset. The results of the analysis form the basis for the V2G flexibility modeling described in Section 3.

2.1. Dataset Description

The dataset in the analysis was based on the EV charging station information provided by the Korea Environment Corporation, which is a public sector organization with the mission of contributing to eco-friendly national development [26]. The analysis was performed on 1008 chargers (785 AC chargers with 7 kW charging power and 223 DC chargers with 50 kW charging power) from 500 charging stations in Seoul, Korea. These data were the averages of two chargers installed per charging station. A total of 635,247 charging events were recorded for 36 months from 2019 to 2021.

2.2. Data Analysis Results

The EV charging event at the charging station is a birth–death process; that is, the charging station’s status increases as the EV arrives and decreases as the EV departs [27]. By applying Little’s law, the charging station status L , which is the average number of charging EVs at the charging station, is given by [28]
L = λ h ,
where λ is the average arrival rate of the EV and h is the average service time. By considering m chargers per charging station, the utilization of the charging station, ρ , is expressed as
ρ = L / m .
Table 4 presents the analysis results of the EV charging station status for the AC and DC charger stations, as well as for all stations. The number of EVs arriving at the DC charger stations was approximately three times greater than that arriving at the AC charger stations. Conversely, depending on the difference in the charging powers of the AC and DC chargers, the average service time of an EV at an AC charger station was approximately five times longer than that at a DC charger station. Consequently, the utilization of the AC and DC charger stations showed similar values of 5% and 4%, respectively. Overall, the station utilization was approximately 5%. The data collection period from 2020 to 2021 was during the period of the COVID-19 pandemic [29]. Considering this aspect, the resulting trend is similar to the 7.6% utilization observed in NYC [28].

2.3. Station Segmentation

To utilize V2G as a flexible resource for DR, the appropriate capacity and responsiveness within the required time must be ensured [30]. Low utilization can be limited to guarantee these conditions, which can be achieved by segmenting the stations and using them as flexible resources.

2.3.1. AC Charger Station Case

Figure 1 shows station status L for the 380 AC charger stations. Figure 1a,b depict the sorted AC charger station status in descending order and its cumulative distribution function (CDF), respectively. The maximum station status was 2.99 for a station with 14 AC chargers, as depicted in Figure 1a. However, approximately 90% of the station statuses had statuses less than 0.2, and the average station status was approximately 0.11, as demonstrated in Figure 1b. As a simple estimation, according to the 7 kW charging power of an AC charger, the average V2G flexibility of AC charger stations in Korea was approximately 0.77 kW.
The power system operates according to the time span. Therefore, an analysis over time and an overall characteristic analysis are required. Based on the changes in utilization over time, four representative AC utilization profiles were analyzed, and the results are presented in Figure 2. The profile was selected in the following manner. First, Pearson’s linear correlation coefficients (PLCCs) [31] for the utilization of 380 AC charger stations were measured. Stations with PLCCs of 0.9 or higher were grouped, and the average utilization of stations within the group was calculated.
In Korea, most charging stations are in the parking lots of buildings. Despite the separation based on changes over time, each profile was created according to the location of the station, categorized by factors such as the building type. This result is reasonable, because the numbers of visitors and visiting times vary depending on the building type.
The utilization profiles for the AC charger stations can be described as follows:
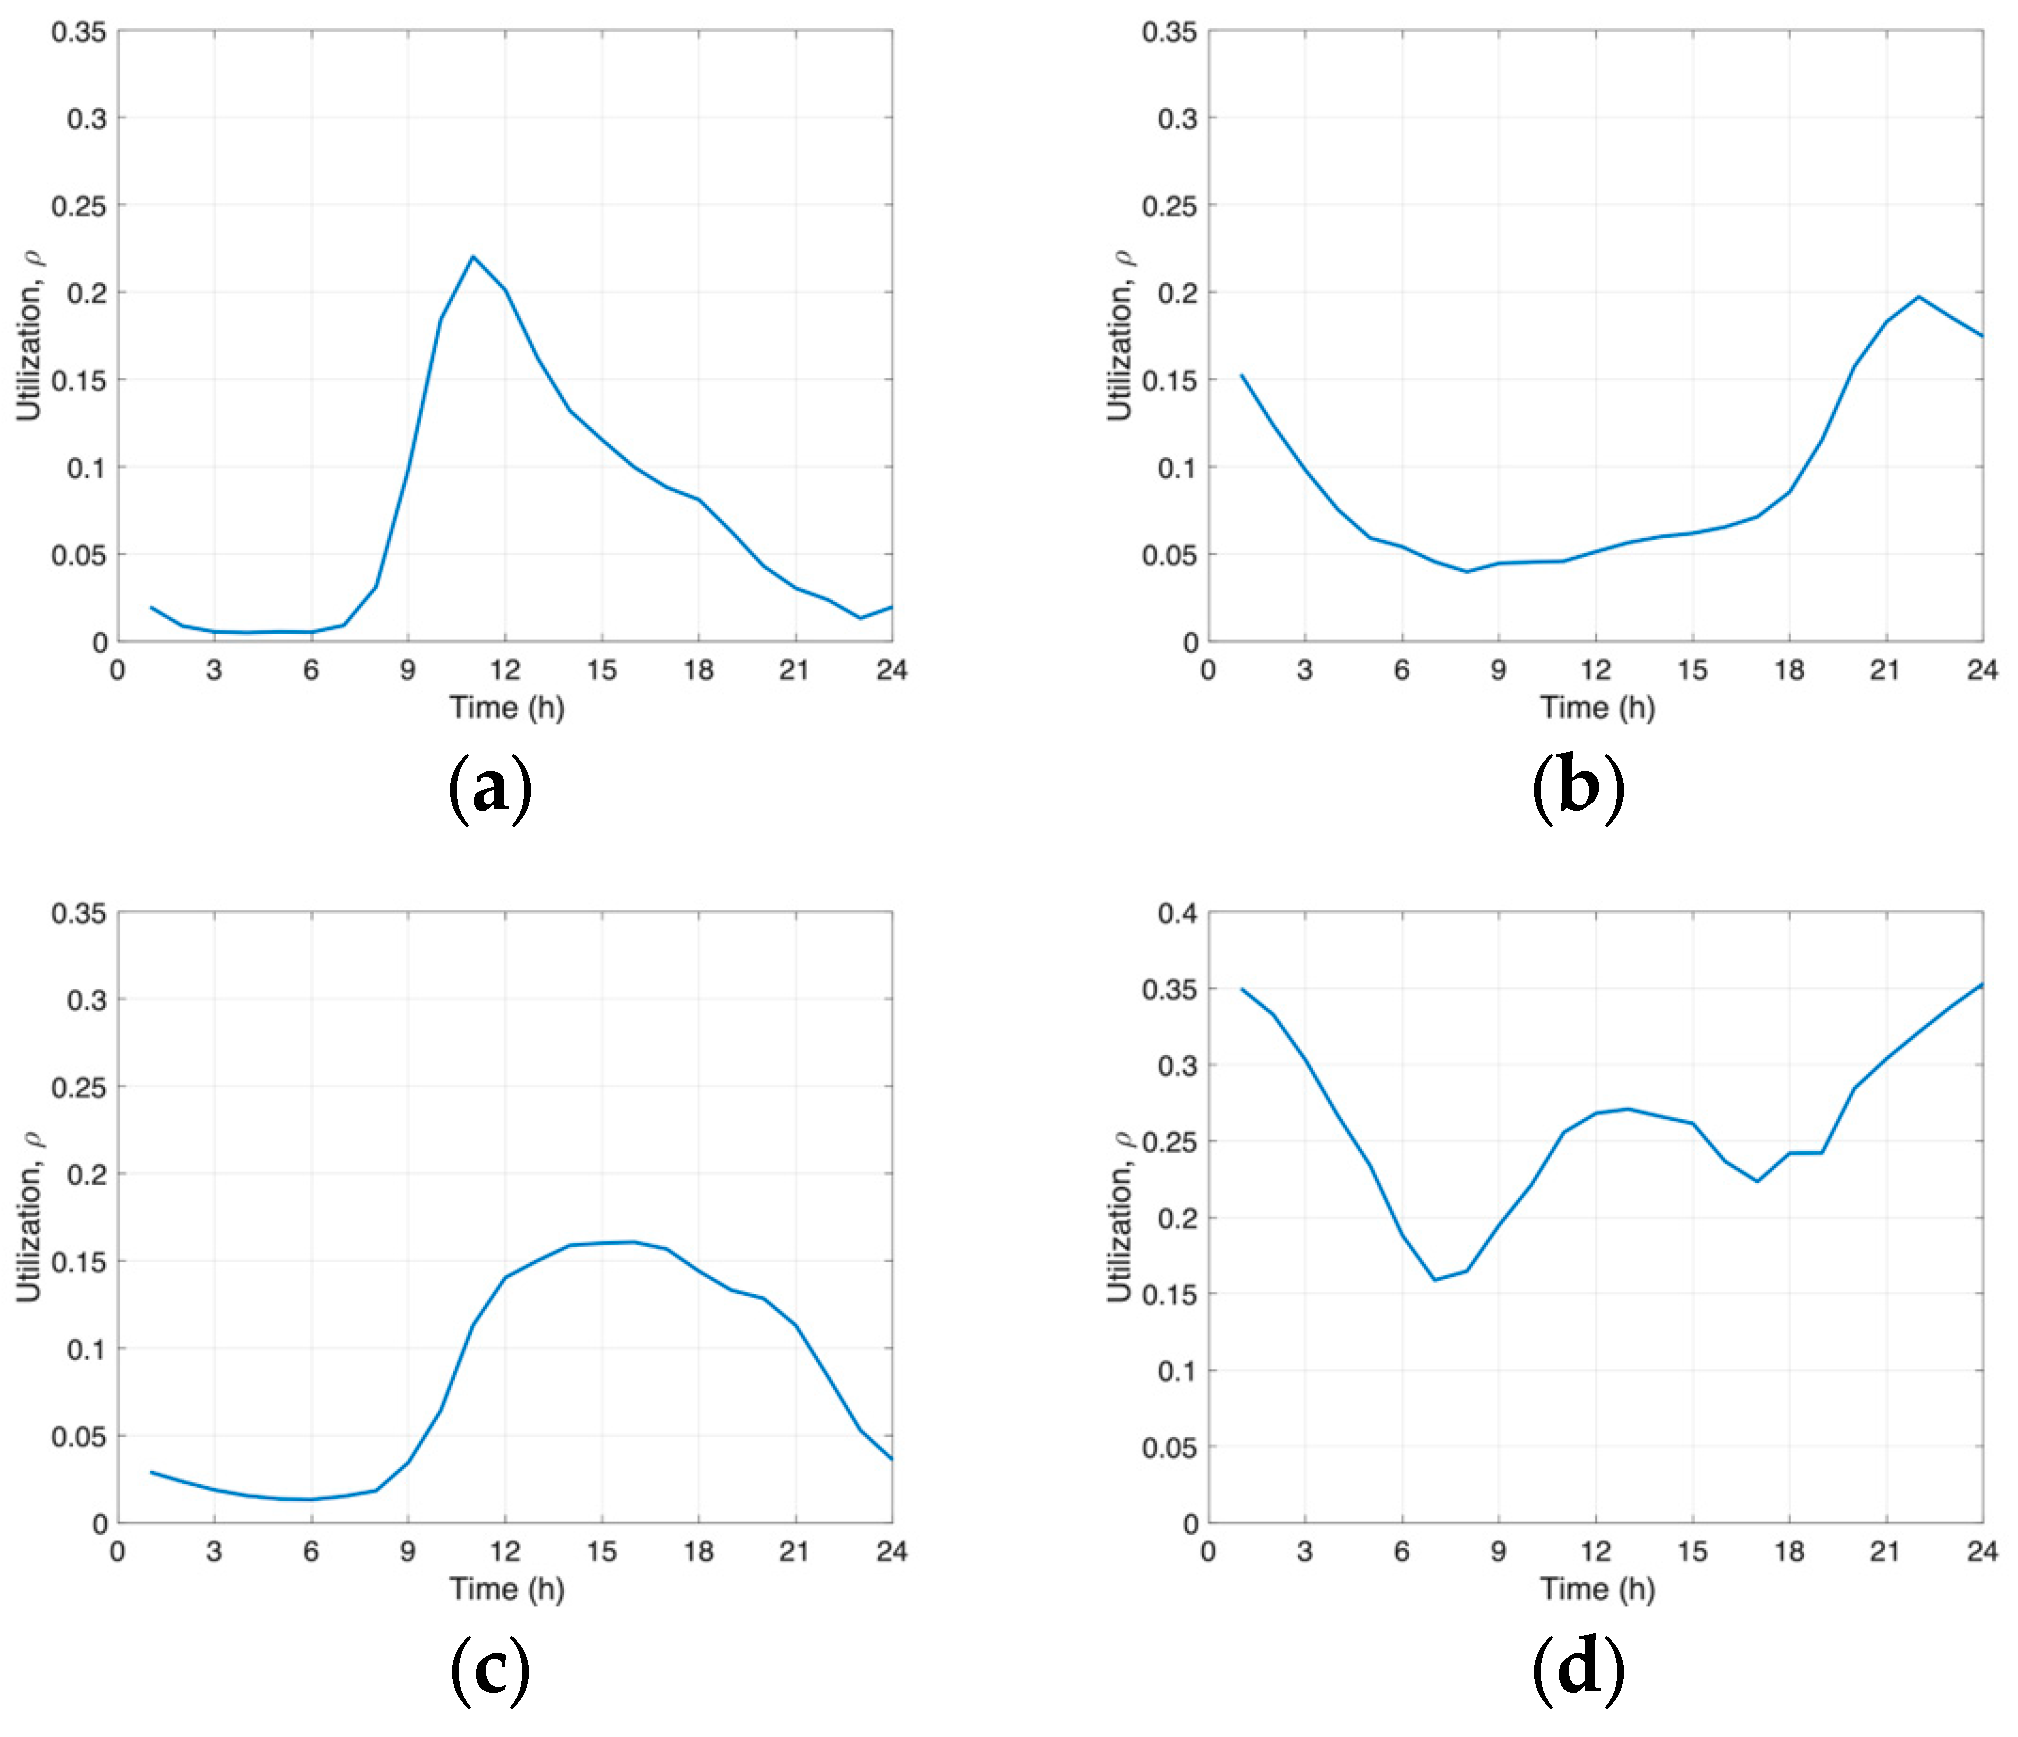
  • (PAC1) is the utilization profile of AC charger stations in office buildings, presented in Figure 2a. The overall utilization of stations in office buildings is 0.070. The utilization rapidly increases from 8 a.m. to noon, and then slowly decreases until 10 p.m. The highest utilization occurs at 11 a.m. This shows that the utilization of stations in office buildings is closely related to the working time. If the cutoff utilization is set to 0.1, the time period that exceeds the cutoff point is between 9 a.m. and 4 p.m. Thus, stations in office buildings can provide flexible daytime V2G resources.
  • (PAC2) is the utilization profile of AC charger stations in residential buildings, presented in Figure 2b. The overall utilization of stations in residential buildings is 0.094. This utilization shows an opposite trend over time compared to that of the utilization of stations in office buildings. Applying a 0.1 cut-off utilization condition, the time range exceeding the cutoff point is from 6 p.m. to 3 a.m. This finding indicates that stations in residential buildings can provide flexible V2G resources at night.
  • (PAC3) is the utilization profile of AC charger stations in supermarkets, presented in Figure 2c. The overall utilization of stations in supermarkets is 0.083. The business hours of supermarkets in Korea generally range from 10 a.m. to 11 p.m. During business hours, the utilization has a stable value. The utilization from 11 a.m. to 9 p.m. exceeds the 0.1 cut-off utilization point. This result shows that stations in supermarkets can provide flexible V2G resources in the afternoon and evening.
  • (PAC4) is the utilization profile of AC charger stations in community service centers, presented in Figure 2d. The overall utilization of stations in community service centers is 0.262, which is the highest value among the four utilization profiles. This result was obtained because EVs are supplied to public offices as part of the policies in Korea [32]. These EVs formed the baseline for their utilization. In addition, the utilization of stations in community service centers appears to be a combination of PAC1 and PAC2. This characteristic exists because the parking lots of community service centers are used as office parking lots during the day, but are open and used as parking lots for residents at night. Depending on the baseline and combination characteristics, stations in community service centers can provide V2G flexibility resources for the entire day.

2.3.2. DC Charger Station Case

An investigation of 145 DC charger stations was performed by analyzing the AC charger stations. In this study, 500 charging stations were considered. As 25 charging stations had both AC and DC chargers installed, they were classified as individual stations. The sorted DC charger station status and its cumulative distribution functions are presented in Figure 3a,b, respectively. The maximum station status was 0.27 for a station with two DC chargers, shown in Figure 3a. In Figure 3b, it can be observed that approximately 90% of the station statuses were less than 0.15, and the average station status was approximately 0.06. As a simple estimation, according to the 50 kW charging power of the DC charger, the average V2G flexibility of DC charger stations in Korea was approximately 3 kW. This value is approximately four times larger than that of an AC charger station. DC charger stations have low utilization; however, they are expected to provide more V2G flexibility resources because of the high charging power of DC chargers.
In the same manner as in the case of the AC charger station, two representative DC utilization profiles were analyzed, as shown in Figure 4. The AC charger stations were classified according to the building type. However, unlike the AC charger station case, the two profiles exhibited similar trends. This finding indicates that the utilization of DC charger stations is less dependent on the building type than that of AC charger stations.
The utilization profiles for the DC charger stations can be described as follows:
  • (PDC1) is the utilization profile of DC charger stations in supermarkets, presented in Figure 4a. The overall utilization of stations in supermarkets is 0.065. This utilization value exhibits the same characteristics as that of PAC3, which is the utilization value of AC charger stations in supermarkets. During business hours, the utilization has a stable value. Therefore, V2G flexibility resources can be provided in the afternoon and evening.
  • (PDC2) is the utilization profile of DC charger stations in district offices, presented in Figure 4b. The overall utilization of stations in the district offices is 0.100. Similarly to the PAC4 for AC charger stations in community service centers, stations in district offices, which are public institutions, have utilization values higher than 0.041, which is the average utilization of DC charger stations. This utilization reveals a temporally similar trend to that of PDC1. However, owing to its ease of access, it shows higher utilization than PDC1 at dawn and during non-business hours. This finding means that stations in district offices can provide V2G flexibility resources for longer periods than stations in supermarkets can.

3. Method of V2G Flexibility Modeling

3.1. Queuing-Based Charging Station Status Model

As discussed above, the EV charging event at the charging station is a birth–death process; thus, the status of the charging station is expressed as a basic queuing method, as shown in Equations (1) and (2). These expressions are the long-term average values over the entire period. However, to use V2G as a flexible resource, the status of the stations on time should be analyzed, as shown in Figure 2 and Figure 4.
To separate a long-term average value with an infinite time span into multiple values with finite time spans, factors affecting the current time slot must be analyzed. For this purpose, the proposed method involves analyzing the factors that affect the phenomena occurring in the current time slot and in the past time slots. Considering these factors, the charging station status model was developed.
Figure 5 illustrates the concept of the V2G flexibility modeling method using an example. It can be assumed that the station status is analyzed in a time slot divided by a time interval Δ T , such as 1 h. The first EV arrives at timeslot t 1 and departs at time slot t after completing the service. The second EV arrives at time slot t and departs at time slot t . In this case, the number of arriving EVs in time slot t 1 is one, but it is two in time slot t . The first EV arriving at timeslot t 1 does not complete its service within the time slot; thus, it affects the arrival of the next EV in timeslot t . The service time is also modified. The service of the first EV starts at timeslot t 1 and ends at timeslot t . In this case, only the service time within each time slot affects the measurement of the service time for each time slot. This result implies that the service time is divided into time intervals.
Based on the design rationale, the utilization of the charging station at time slot t , ρ t , consists of two parts: utilization according to be newly arrived EVs, ρ t N e w , and utilization according to existing EVs that arrived but did not complete the service before the time slot t , ρ t E x :
ρ t = ρ t N e w + ρ t E x .
The utilization according to the newly arrived EVs is measured under the arrival rate and service rate during the time slot and can be expressed as
ρ t N e w = λ t m m i n { h t , ζ t } ,
where λ t is the arrival rate of the newly arrived EVs in time slot t , h t is its service time, and ζ t is the average service time during the time slot t . Note that the average service time during the time slot t , ζ t , is obtained through the mean value according to the probabilistic distribution of the arrival rate and service time of EVs. However, in this study, it was approximated as a time interval, as ζ t = Δ T , for simplicity. The effect of this approximation is discussed in the Results section.
In a similar manner, the utilization of the existing EVs is given by
ρ t E x = i = t 1 λ i m m i n { h i R , Δ T } ,
where h i R is the residual service time of the existing EVs, as h i R = m a x { h i t i Δ T , 0 } .
Substituting Equations (4) and (5) into Equation (3), the utilization of the charging station at time slot t , ρ t , is modeled as
ρ t = λ t m m i n { h t , Δ T } + i = t 1 λ i m m i n { h i R , Δ T } .
Considering the blocking probability, which describes the probability of EV losses occurring because all chargers are busy, the effective utilization of the charging station with m chargers at time slot t is modified as
ρ ~ t = ρ t { 1 P b ( ρ t , m ) } ,
and the blocking probability of the loss system can be calculated according to [33]
P b ρ t , m = ρ t m / m ! i = 0 m ρ t i / i ! .

3.2. V2G Flexibility Estimation

The station status was modeled to estimate the V2G flexibility. To estimate the V2G flexibility, we measured the V2G flexibility resource, which is defined as the capacity to participate in a DR program. The V2G flexibility is related to available resources such as EV numbers and the behavior of the EVs participating in the DR program. The available resource can be estimated based on the utilization of the charging station status. It is assumed that all EVs using the service in the station participate in the DR program. Thus, the estimated V2G flexibility in this study is the maximum value that the station can provide.
Using the effective utilization and charging power of the station, the V2G flexibility resource at time slot t , C t , is given by
C t = c Δ C m ρ t { 1 P b ρ t , m } ,
where c kW is the charging power of the charger installed at the station and Δ C ( Δ T ) is the participation time duration in the DR program.
If discharging is performed for the DR, charging is required to return to the original level. Therefore, the service time increases by twice the participation time, as follows:
h t + = h t + 2 Δ C .
and
h i R + = h i t i Δ T + 2 Δ C , when   h i R > 0 , 0 , when   h i R 0 .
This increases the utilization at time slot t and continues with the utilization of the next time slot. However, because the participation time is limited to the time interval, it affects up to two time slots.
The maximum participation time in the DR program, Δ C , can be determined by applying the blocking probability constraint as follows:
P b ρ i + , m P b ( ρ i , m ) γ T h , | | | i { t , t + 1 , t + 2 } ,
where ρ i + is the utilization of Equation (6), with the service time-modified Equations (10) and (11).
Using this, the V2G flexibility at time slot t can be estimated as
F t = c Δ C m ρ t { 1 P b ρ t , m } .
Note that, in Equation (13), the V2G flexibility is estimated as the maximum capacity of the V2G flexibility resource that satisfies the blocking probability constraint. To calculate this value, the utilization assuming participation in the DR program, ρ i + , is used in Equation (12). The V2G flexibility is the resource capacity that can participate in the DR program. Therefore, it is measured based on the utilization before participating in the DR program, ρ t , in Equation (13).

4. Results and Discussion

4.1. Queuing-Based Charging Station Status

To verify the effectiveness of the modeling, the utilization gap between the actual and the analyzed values was measured using the mean absolute error (MAE), root mean squared error (RMSE), and mean absolute percentage error (MAPE), which can be calculated as follows [28]:
MAE = E ρ t A ρ t , RMSE = E ρ t A ρ t 2 , MAPE = 100 × E ρ t A ρ t ρ t A ,
where ρ t A is the actual utilization at time slot t and E is the expected value operator.
The performance was averaged for each representative profile. The representative profiles of PAC1, PAC2, PAC3, PAC4, PDC1, and PDC2 had 16, 14, 28, 4, 14, and 22 charging stations, respectively. This corresponded to 16.3% of the AC charger stations and 25.7% of the DC charger stations for which data analysis was performed. For the simulation, a charging station event dataset with 1 s time resolution, provided by the Korea Environment Corporation, which is a public sector organization, was employed. The simulations were implemented on a 64-bit PC with a 4 GHz Quad-Core Intel Core i7 CPU and 32 GB RAM, using MATLAB R2022a.
Table 5 shows the performance loss of the proposed queuing-based charging station status model with a 1 h time interval, Δ T = 1 . The MAE and RMSE represent the first- and second-order characteristics of the loss, respectively. In Table 5, the RMSE is marginally larger than the MAE. Thus, the queuing-based charging station status modeling showed a stable performance, even if the utilization changed in each time slot. In addition, the AC charger station cases from PAC1 to PAC4 had MAPEs larger than 10%, but the MAPE was approximately 7% for the DC charger station cases of PDC1 and PDC2. As shown in Table 4, the average service time of the AC charger stations was longer than the time interval; however, this was not the case for the DC charger stations. In status modeling, the service time is truncated by the time interval, and the truncated value was approximated as the time interval in this study. This assumption increased the loss of the AC charger stations. By increasing the time interval to one day, the proposed method modeled the actual value without performance loss. This is because the service time did not exceed 24 h. In this case, the approximation error of the truncated value did not occur according to the time interval.
Figure 6 provides examples of the actual utilization and the utilization obtained by status modeling for PAC1 and PDC1. In the figure, the blue and dashed red lines represent the actual and analyzed utilization, respectively. Figure 6a,b reveal a time discrepancy between the actual and analyzed utilization. The utilization obtained from the analyzed results was faster than the actual utilization by about 20 min. This is also a result of the assumption of a truncated service time. In this study, the truncated service time, which is the time served during the time interval, was set as the time interval. This was the maximum service value. This models the case in which the EVs arrive at the start of the time interval and receive service during the time interval. However, in the actual case, EVs arrive at some point in the time interval and receive service only for the remaining duration of the time interval in the current time slot. Thus, the truncated service time can be modeled with a conditional probability of the arrival time for more accurate modeling. Alternatively, it can be adjusted by weighting the truncated service time to, for example, ζ t = 0.8 Δ T . However, as shown in Figure 6a,b, the analyzed utilization had the same slope as the actual utilization. The PLCC between the analyzed utilization and actual utilization was 0.99. This result verifies that the queuing-based charging station status model accurately represents the actual charging station status.

4.2. V2G Flexibility Estimation

The V2G flexibility resource was measured using a queuing-based charging station status model. Figure 7 shows an example of the station status change of PDC1 when it participated in the DR program at 11 a.m. for 0.5 h; hence, Δ C = 0.5 . In Figure 7a, the solid and dashed lines represent the utilization without and with DR program participation, respectively. As shown in this figure, the utilization after participating in the DR program increased not only at 11 a.m., but also at 12 p.m., compared to that without participating in the DR program. As discussed above, the increase in service time according to participation in the DR program propagates an effect not only in the current time slot, but also in the next time slot. Therefore, the blocking probabilities of the current and subsequent time slots increase, as shown in Figure 7b.
Figure 8 presents the V2G flexibility estimation results for PDC1 according to the blocking probability constraint, with γ T h = 5 % in Figure 8a and γ T h = 10 % in Figure 8b. The V2G flexibility had the lowest value at approximately 4 a.m., because the utilization was low at that time. In the afternoon, at approximately 3 p.m., the utilization, presented as a dashed circle, was high, as shown in Figure 7a, but the V2G flexibility had a low value, as shown in Figure 8a. However, by relaxing the blocking probability constraint to γ T h = 10 % , as depicted in Figure 8b, the V2G flexibility increased further in the time slot of high utilization. This means that V2G flexibility is limited by the utilization itself in low-utilization intervals, and is limited by the blocking probability in high-utilization intervals. Consequently, the highest V2G flexibility was observed at approximately 10 a.m. and 11 p.m., when the utilization in the current time slot was not low, and the utilization in the subsequent time slot was not high.
To confirm its usefulness, the average V2G flexibility was calculated by dividing it by the time zone, as shown in Table 6. The time zone was set with reference to the ToU tariff of Korea [34]; the off-peak time was from 10 p.m. to 8 a.m., the on-peak time was from 11 a.m. to 6 p.m., and all the other times were the mid-peak times. The AC charger stations had less flexibility than the DC charger stations, owing to the difference in the charging power of the chargers. For the same reason, the DC charger stations showed greater performance improvement with the relaxation of the constraint condition. In particular, in the case of PAC4, the change in V2G flexibility according to the constraint relaxation was marginal. The utilization of PAC4 was 0.262, which was the highest value among all the cases. A busy station with high utilization may have many available resources. However, considering station preferences such as blocking probability, the V2G flexibility of the station was limited. Consequently, when the utilization was approximately 0.15 at the on-peak times of PAC1, PAC3, PDC1, and PDC2, the greatest V2G flexibility was shown.

4.3. Brief Summary

From these results, some lessons can be summarized, as follows:
  • The proposed queuing-based charging station status model is useful for modeling the status of each time slot. In the model, the arrival rate was measured according to the newly arrived EVs in the current time slot; existing EVs arrived, but did not complete service before the time slot, and the service time was truncated to the time interval;
  • In the proposed model, the current charging station status was determined by the condition of the past time slot as well as that of the current time slot. Thus, a change in the current charging station status affected the next time interval. Therefore, this propagation effect should be considered in the study of V2G operation that changes the charging station’s status;
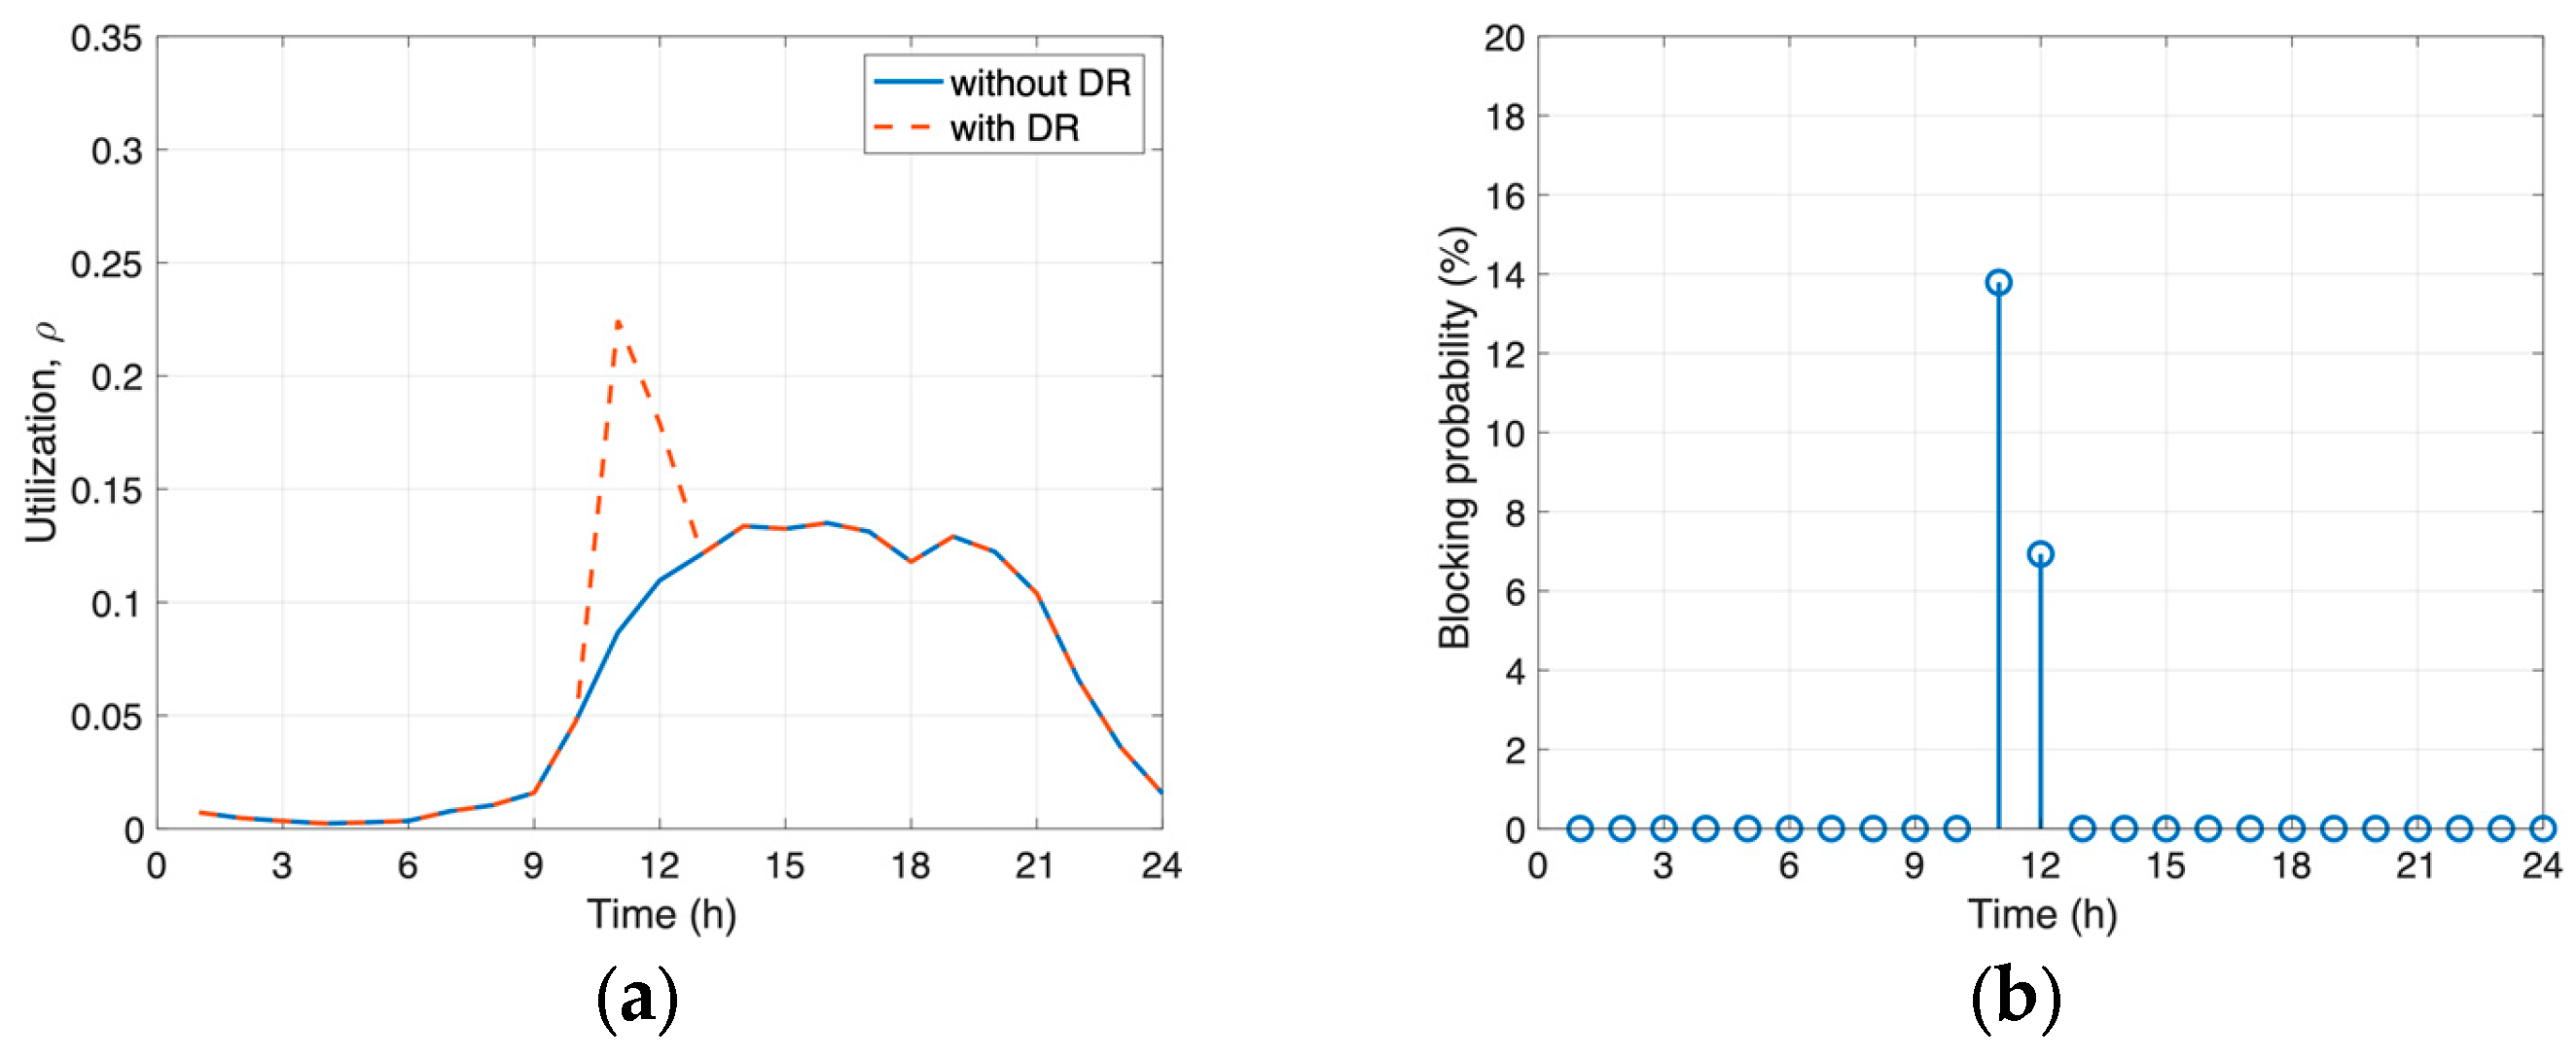
  • V2G participation in the DR program increases the service time, and the resulting effect is extended to the next time slot in addition to the current time slot. Moreover, it affects system parameters such as blocking probability. The simulation results demonstrate that the proposed model can reflect the effects of system parameter changes. Using this information, the V2G flexibility can be estimated appropriately;
  • V2G flexibility is defined as available resources. However, in this study, it was shown that the V2G flexibility cannot be determined only by the amount of resources. V2G flexibility is limited by resources in the low-utilization period, but it is restricted by system constraints, such as blocking probability, in the high-utilization period. Thus, an appropriate utilization point exists that shows the highest V2G flexibility while considering resources and constraints;
  • The proposed model was able to measure the charging station status by utilizing the arrival rate and service time based on historical data. Moreover, the change can be confirmed by applying various assumptions, according to which these values change. This approach can be applied to various studies related to charging stations, as well as the V2G flexibility considered in this study.
This study presented a queuing-based charging station status model to estimate V2G flexibility. Future research directions could be suggested by extending this study.
  • The proposed model made some assumptions for simplicity. Realistic environments can be considered to improve its performance. For example, the truncated service time was set as a time interval. It can be modified by applying the conditional probability model according to the arrival time. In addition, the capacity of V2G flexibility estimation was measured based on the charger power. This can also be modified by using a model that considers the charger’s characteristics and the grid condition;
  • This study focused on V2G flexibility estimation in order to assess the amount of available resources. Using this, V2G scheduling problems can be solved by determining how to operate and manage the available resources according to the objective. For this problem, it will be possible to conduct a study that considers the propagation effect differently from the existing studies;
  • As the results show, each station has different V2G flexibility resources. The resources can be combined to form a virtual power plant (VPP), considering the risk of VPP implementation and energy balance during VPP operation [35].

5. Conclusions

This study proposes a data-driven charging station status modeling method for V2G flexibility. In the data analysis for modeling using the Korean dataset, the charging station status was segmented into four AC charger stations and two DC charger station profiles, according to the time correlation of utilization. Each profile was created according to the location of the station, including factors such as the building type, despite the separation based on changes over time. The statuses of the charging station were modeled using the queuing method by considering the truncated time interval. In the model, the arrival rate at each time slot was measured according to the newly arrived EVs in the time slot and the existing EVs that arrived, but did not complete the service before the time slot. The service rate was truncated into the time interval. The simulation results showed that the proposed method effectively estimated the time-divided charging station status with a MAPE of approximately 10%. In addition, the usefulness of the V2G flexibility in each ToU time zone was discussed.
Moreover, a charging station status modeling method for V2G flexibility was presented, which can be extended to various applications. For demand-side management, dynamic V2G scheduling can be investigated by considering the modeled flexible resource and its effects. For flexible resource management, the modeled V2G flexibility can be considered as an implementation resource for VPP in combination with multiple stations.
The two main lessons of this study are as follows. The first is the fact that changes in the current charging station status affect the next time slot, called the propagation effect, and the second is that the V2G flexibility is determined not only by the amount of resources, but also by constraints such as the station blocking probability. Therefore, in the study of V2G operation, these aspects should be considered.
Although the proposed method estimated the actual values well, it requires some improvements for real-world applicability. First, during modeling, the truncated service time must be modified by applying the conditional probability model according to the arrival time during the time interval. Second, during V2G flexibility estimation, the charger characteristics and grid condition to discharge to the grid should be considered. Moreover, the behavior model of EVs participating in DR programs can be considered.

Author Contributions

Conceptualization, M.-J.J., T.K. and E.O.; methodology, E.O.; software, E.O.; validation, M.-J.J., T.K. and E.O.; formal analysis, E.O.; investigation, E.O.; resources, E.O.; data curation, E.O.; writing—original draft preparation, M.-J.J., T.K. and E.O.; writing—review and editing, M.-J.J., T.K. and E.O.; visualization, E.O.; supervision, M.-J.J.; project administration, M.-J.J.; funding acquisition, T.K. All authors have read and agreed to the published version of the manuscript.

Funding

This research was supported by the Korea Electric Power Corporation (Grant number: R22XO02-23).

Institutional Review Board Statement

Not applicable.

Informed Consent Statement

Not applicable.

Data Availability Statement

Publicly available datasets were analyzed in this study. This data can be found here: https://www.data.go.kr/data/15076352/openapi.do, (accessed on 15 April 2023).

Conflicts of Interest

The authors declare no conflict of interest.

Abbreviations

ACAlternating current
CDFCumulative distribution function
DCDirect current
DRDemand response
EVElectric vehicle
MAPEMean absolute percentage error
MAEMean absolute error
PACxx-th representative utilization profile of AC charger station
PDCxx-th representative utilization profile of DC charger station
PLCCPearson’s linear correlation coefficient
RMSERoot-mean-squared error
ToUTime of use
V2GVehicle-to-grid
VPPVirtual power plant

References

  1. Kamwa, I. Dynamic Wide Area Situational Awareness: Propelling Future Decentralized, Decarbonized, Digitized, and Democratized Electricity Grids. IEEE Power Energy Mag. 2023, 21, 44–58. [Google Scholar] [CrossRef]
  2. International Energy Agency. Renewable Electricity. 2022. Available online: https://www.iea.org/reports/renewable-electricity (accessed on 13 April 2023).
  3. Mujtaba, A.; Jena, P.K.; Bekun, F.V.; Sahu, P.K. Symmetric and asymmetric impact of economic growth, capital formation, renewable and non-renewable energy consumption on environment in OECD countries. Renew. Sustain. Energy Rev. 2022, 160, 112300. [Google Scholar] [CrossRef]
  4. Niu, S.; Zhang, Z.; Ke, X.; Zhang, G.; Huo, C.; Qin, B. Impact of renewable energy penetration rate on power system transient voltage stability. Energy Rep. 2022, 8, 487–492. [Google Scholar] [CrossRef]
  5. Guerra, K.; Haro, P.; Gutiérrez, R.; Gómez-Barea, A. Facing the high share of variable renewable energy in the power system: 354 Flexibility and stability requirements. Appl. Energy 2022, 310, 118561. [Google Scholar] [CrossRef]
  6. MacDonald, J.; Cappers, P.; Callaway, D.; Kiliccote, S. Demand Response Providing Ancillary Services: A Comparison of Opportunities and Challenges in US Wholesale Markets; Lawrence Berkeley National Laboratory: Berkeley, CA, USA, 2023.
  7. Ibrahim, C.; Mougharbel, I.; Kanaan, H.Y.; Abou Daher, N.; Georges, S.; Saad, M. A review on the deployment of demand response programs with multiple aspects coexistence over smart grid platform. Renew. Sustain. Energy Rev. 2022, 162, 112446. [Google Scholar] [CrossRef]
  8. Golmohamadi, H. Demand-Side Flexibility in Power Systems: A Survey of Residential, Industrial, Commercial, and Agricultural Sectors. Sustainability 2022, 14, 7916. [Google Scholar] [CrossRef]
  9. Pirouzi, A.; Aghaei, J.; Pirouzi, S.; Vahidinasab, V.; Jordehi, A.R. Exploring potential storage-based flexibility gains of electric vehicles in smart distribution grids. J. Energy Storage 2022, 52, 105056. [Google Scholar] [CrossRef]
  10. Knezović, K.; Marinelli, M.; Codani, P.; Perez, Y. Distribution grid services and flexibility provision by electric vehicles: A review of options. In Proceedings of the 2015 50th International Universities Power Engineering Conference (UPEC), Stoke on Trent, UK, 1–4 September 2015. [Google Scholar]
  11. Yu, H.; Niu, S.; Shang, Y.; Shao, Z.; Jia, Y.; Jian, L. Electric vehicles integration and vehicle-to-grid operation in active distribution grids: A comprehensive review on power architectures, grid connection standards and typical applications. Renew. Sustain. Energy Rev. 2022, 168, 112812. [Google Scholar] [CrossRef]
  12. Sevdari, K.; Calearo, L.; Andersen, P.B.; Marinelli, M. Ancillary services and electric vehicles: An overview from charging clusters and chargers technology perspectives. Renew. Sustain. Energy Rev. 2022, 167, 112666. [Google Scholar] [CrossRef]
  13. Zou, W.; Sun, Y.; Gao, D.c.; Zhang, X.; Liu, J. A review on integration of surging plug-in electric vehicles charging in energy-flexible buildings: Impacts analysis, collaborative management technologies, and future perspective. Appl. Energy 2023, 331, 120393. [Google Scholar] [CrossRef]
  14. Corinaldesi, C.; Lettner, G.; Schwabeneder, D.; Ajanovic, A.; Auer, H. Impact of Different Charging Strategies for Electric Vehicles in an Austrian Office Site. Energies 2020, 13, 5858. [Google Scholar] [CrossRef]
  15. Lauvergne, R.; Perez, Y.; Francon, M.; De La Cruz, A.T. Integration of electric vehicles into transmission grids: A case study on generation adequacy in Europe in 2040. Appl. Energy 2022, 326, 120030. [Google Scholar] [CrossRef]
  16. Fei, L.; Shahzad, M.; Abbas, F.; Muqeet, H.A.; Hussain, M.M.; Bin, L. Optimal Energy Management System of IoT-Enabled Large Building Considering Electric Vehicle Scheduling, Distributed Resources, and Demand Response Schemes. Sensors 2022, 22, 7448. [Google Scholar] [CrossRef]
  17. Hemmatpour, M.H.; Koochi, M.H.R.; Dehghanian, P.; Dehghanian, P. Voltage and energy control in distribution systems in the presence of flexible loads considering coordinated charging of electric vehicles. Energy 2022, 239, 121880. [Google Scholar] [CrossRef]
  18. Chai, Y.T.; Che, H.S.; Tan, C.; Tan, W.N.; Yip, S.C.; Gan, M.T. A two-stage optimization method for Vehicle to Grid coordination considering building and Electric Vehicle user expectations. Int. J. Electr. Power Energy Syst. 2023, 148, 108984. [Google Scholar] [CrossRef]
  19. Harsh, P.; Das, D. Optimal coordination strategy of demand response and electric vehicle aggregators for the energy management of reconfigured grid-connected microgrid. Renew. Sustain. Energy Rev. 2022, 160, 112251. [Google Scholar] [CrossRef]
  20. Mansouri, S.A.; Nematbakhsh, E.; Jordehi, A.R.; Marzband, M.; Tostado-Véliz, M.; Jurado, F. An interval-based nested optimization framework for deriving flexibility from smart buildings and electric vehicle fleets in the TSO-DSO coordination. Appl. Energy 2023, 341, 121062. [Google Scholar] [CrossRef]
  21. Yu, Z.; Lu, F.; Zou, Y.; Yang, X. Quantifying energy flexibility of commuter plug-in electric vehicles within a residence–office coupling virtual microgrid. Part II: Case study setup for scenario and sensitivity analysis. Energy Build. 2022, 254, 111552. [Google Scholar] [CrossRef]
  22. Han, H.S.; Oh, E.; Son, S.Y. Study on EV charging peak reduction with V2G utilizing idle charging stations: The Jeju Island case. Energies 2018, 11, 1651. [Google Scholar] [CrossRef]
  23. Divshali, P.H.; Evens, C. Behaviour analysis of electrical vehicle flexibility based on large-scale charging data. In Proceedings of the 2019 IEEE Milan PowerTech, Milan, Italy, 23–27 June 2019. [Google Scholar]
  24. Demirci, A.; Tercan, S.M.; Cali, U.; Nakir, I. A Comprehensive Data Analysis of Electric Vehicle User Behaviors toward Unlocking Vehicle-to-Grid Potential. IEEE Access 2023, 11, 9149–9165. [Google Scholar] [CrossRef]
  25. Li, X.; Wang, Z.; Zhang, L.; Sun, F.; Cui, D.; Hecht, C.; Figgener, J.; Sauer, D.U. Electric vehicle behavior modeling and applications in vehicle-grid integration: An overview. Energy 2023, 268, 126647. [Google Scholar] [CrossRef]
  26. Korea Environment Corporation. Korea Environment Corporation-Electric Vehicle Charging Station Information. 2022. Available online: https://www.data.go.kr/data/15076352/openapi.do (accessed on 13 April 2023).
  27. Liu, B.; Pantelidis, T.P.; Tam, S.; Chow, J.Y. An electric vehicle charging station access equilibrium model with M/D/C queueing. Int. J. Sustain. Transp. 2022, 1, 228–244. [Google Scholar] [CrossRef]
  28. Leon-Garcia, A. Probability, Statistics, and Random Processes for Electrical Engineering, 3rd ed.; Pearson: London, UK, 2021. [Google Scholar]
  29. Szczepanek, W.K.; Kruszyna, M. The impact of COVID-19 on the choice of transport means in journeys to work based on the selected example from Poland. Sustainability 2022, 14, 7619. [Google Scholar] [CrossRef]
  30. Annala, S.; Lukkarinen, J.; Primmer, E.; Honkapuro, S.; Ollikka, K.; Sunila, K.; Ahonen, T. Regulation as an enabler of demand response in electricity markets and power systems. J. Clean. Prod. 2018, 195, 1139–1148. [Google Scholar] [CrossRef]
  31. Lee Rodgers, J.; Nicewander, W.A. Thirteen ways to look at the correlation coefficient. Am. Stat. 1988, 42, 59–66. [Google Scholar] [CrossRef]
  32. Ministry of Trade, Industry and Energy. Act on Promotion of Development and Distribution of Environment-Friendly Vehicles; Ministry of Trade, Industry and Energy 390 (MOTIE): Sejong-si, Republic of Korea, 2014. [Google Scholar]
  33. Gautam, N. Analysis of Queues: Methods and Applications; CRC Press: Boca Raton, FL, USA, 2012. [Google Scholar]
  34. Korea Electric Power Corporation. Electric Rates Table. 2023. Available online: https://home.kepco.co.kr/kepco/EN/F/htmlView/393ENFBHP00102.do?menuCd=EN060201 (accessed on 13 April 2023).
  35. Oh, E. Risk-based virtual power plant implementation strategy for smart energy communities. Appl. Sci. 2021, 11, 8248. [Google Scholar] [CrossRef]
Figure 1. AC charger station status. (a) AC charger station status sorted in descending order; (b) CDF of AC charger station status. Note that, in Figure 1b, the CDF presented on the y-axis is the probability that the station status is less than or equal to the given station status presented on the x-axis. The maximum x-value is 2.99 in Figure 1a. However, because the case in which the station status exceeds 1 is very rare, as shown in Figure 1a, only values up to 1 are displayed in Figure 1b.
Sustainability 15 07938 g001
Figure 2. Representative utilization profiles for AC charger stations. (a) Office building; (b) residential building; (c) supermarket; and (d) community service center.
Sustainability 15 07938 g002
Figure 3. DC charger station status. (a) DC charger station status sorted in descending order; (b) CDF of DC charger station status.
Sustainability 15 07938 g003
Figure 4. Representative utilization profiles for DC charger stations. (a) Supermarket; (b) district office.
Sustainability 15 07938 g004
Figure 5. Constitution of V2G flexibility modeling method.
Sustainability 15 07938 g005
Figure 6. Comparisons of the actual utilization and utilization obtained by status modeling. (a) PAC1; (b) PDC1.
Sustainability 15 07938 g006
Figure 7. Station status change of PDC1 according to DR program participation of 0.5 h, Δ C = 0.5 . (a) Utilization; (b) blocking probability.
Sustainability 15 07938 g007
Figure 8. V2G flexibility estimation of PDC1 according to the blocking probability constraint. The dashed circles represent the high utilization region in Figure 7a. (a) γ T h = 5 % ; (b) γ T h = 10 % .
Sustainability 15 07938 g008
Table 1. Review articles to organize the V2G technology.
ReferenceYearContributionLimitation
[10]2015
  • Shows how EVs could be efficient flexibility providers for both voltage control and congestion issues and introduces studies to solve these issues
  • Suggests technical and economic market design requirements for efficient provision of flexibility services
Conceptual discussion
[11]2022
  • Reviews distribution grid architectures, grid connection infrastructures, and standards from the perspective of EV–grid integration and V2G operation
Focusing on the grid architecture to integrate EV and grid
[12]2022
  • Reviews the impacts of and co-management technologies for EVs charging in buildings
Focusing on the impact of EV charging operation
[13]2023
  • Reviews ancillary services based on power system operational challenges and highlights the flexibility provision of EVs according to V2G technology.
Focusing on the impact of EV chargers control approaches
Table 2. Articles on the use of V2G flexibility.
ReferenceYearObjectiveApproachContributionV2G Flexibility Model
[14]2020Cost minimization, including day-ahead market, grid, and storage costsOptimizationAnalyzes the effects of different EV charging strategiesHistorical data
[15]2022Power system operation cost minimizationScenario base studyAnalyzes the impacts of EV smart charging adoption on power systems in 2040Historical data-driven
expectation model
[16]2022Power system operation cost minimizationOptimizationProposes an energy management system considering EVs and DRFixed given value
[17]2022Distribution system cost minimizationOptimizationProposes an improved mixed real and binary vector-based swarm optimization algorithm for EV charging schedulingStochastic random model
[18]2023Electricity bill minimization of buildingsOptimizationProposes a two-stage algorithm combining day-ahead and real-time operationStochastic random model
[19]2022Profit maximization of DR participantsOptimizationProposes coordinated scheduling of DR and EV aggregators in a microgridStochastic random model
[20]2023Profit maximization of DR participantsOptimizationProposes a two-stage algorithm considering transmission and distribution system operationsStochastic random model
[21]2022Microgrid reliability enhancement using EV and RESScenario-based studyInvestigates the energy flexibility of commuter EVs operating on a microgrid systemParameter base
generation
Table 3. Articles on V2G flexibility.
ReferenceYearObjectiveApproachLimitation
[22]2018Forecasting V2G flexibility
in Jeju in 2030
Queuing methodLong-term average model
[23]2019Behavioral analysis of EV
flexibility in Helsinki
Data curve fittingData-dependent model
[24]2023Data analysis of EV behaviorsData analysis for
various time steps
Data-dependent model
[25]2023EV behavior modelMonte Carlo simulation base
generation model
Stochastic random model
Table 4. Analysis results of EV charging station status.
All StationsAC Charger StationDC Charger Station
Arrival rate (/hour)0.0480.0290.091
Service time (hour)2.0963.7720.700
Station status, L 0.1010.1090.064
Utilization, ρ 0.0500.0530.041
Table 5. Performance loss of the proposed queuing-based charging station’s status modeling.
PAC1PAC2PAC3PAC4PDC1PDC2
MAE0.00740.00990.00970.03340.00450.0063
RMSE0.00990.01200.01160.04010.00630.0086
MAPE10.6210.5911.7912.747.016.29
Table 6. V2G flexibility at each ToU time zone in Korea.
γ T h = 5 % γ T h = 10 %
Off-PeakMid-PeakOn-PeakOff-PeakMid-PeakOn-Peak
PAC10.080.300.510.090.480.65
PAC20.210.390.390.400.740.40
PAC30.260.260.270.271.111.30
PAC40.270.610.440.280.690.44
PDC10.871.160.961.392.912.76
PDC21.621.511.232.184.945.26
Disclaimer/Publisher’s Note: The statements, opinions and data contained in all publications are solely those of the individual author(s) and contributor(s) and not of MDPI and/or the editor(s). MDPI and/or the editor(s) disclaim responsibility for any injury to people or property resulting from any ideas, methods, instructions or products referred to in the content.

