Article

Analysis of the Influencing Factors of Power Demand in Beijing Based on the LMDI Model

1
Geospatial Big Data Application Research Center, Chinese Academy of Surveying & Mapping, Beijing 100036, China
2
Engineering Department, Beijing Geo-Vision Information Technology Co., Ltd., Beijng 100070, China
3
Handan Key Laboratory of Natural Resources Spatial Information, Handan 056038, China
*
Author to whom correspondence should be addressed.
Sustainability 2023, 15(10), 7913; https://doi.org/10.3390/su15107913
Submission received: 17 March 2023 / Revised: 14 April 2023 / Accepted: 8 May 2023 / Published: 11 May 2023

Abstract

:
Since the reform and opening-up, under the new economic situation and policy, the rapid growth of power demand in Beijing is threatening the sustainable development of China’s economy and environment. To recognize the driving factors of electricity consumption growth and offer policy implications, based on the data of electricity consumption, the Gross Domestic Product (GDP) and the resident population in Beijing from 1990 to 2021, this research used the Kaya-equation and logarithmic mean divisia index (LMDI) model to decompose the growth of power demand in Beijing into the quantitative contribution of each driving factor from the perspective of industrial electricity consumption and residential electricity consumption. The results of the decomposition analysis show that, as far as industrial electricity consumption is concerned, the contribution rates of economic growth, electricity consumption intensity and output value structure to industrial electricity growth are 234.26%, −109.01% and −25.25%, respectively, which shows that economic growth is the primary driving force promoting the growth of industrial electricity demand. Power consumption intensity is the main reason for restraining the growth of industrial power demand, the growth rate is sliding and the contribution of the industrial structure is relatively small; as far as residential power consumption is concerned, the contribution rates of per capita power consumption and population size to residential power growth are 68.13% and 31.87%, respectively, which indicates that per capita power consumption is the main factor promoting the growth of residential power demand, followed by the total population. The study results show that the consumption of electric power would increase if Beijing’s economy and urbanization keep developing, and optimizing the industry structure, improving the efficiency of electric energy utilization and adopting clean power energy are the main approaches to making Beijing’s consumption of electric power decrease.

1. Introduction

The power industry is the basic industry for the national economy and social development, and stable and sufficient supply is a powerful guarantee for urban economic construction and development. With the accelerated process of urbanization and the rapid growth of the population, the power demand of the three industries in Beijing increased from 14.099 billion kW.h in 1990 to 94.653 billion kW.h in 2021, with an average annual year-over-year percent increase of 6.43%. The electricity demand of Beijing residents increased from 949 million kW.h in 1990 to 28.639 billion kilowatts per hour in 2021, with an average annual year-over-year percent increase of 11.86%. As the capital of China, Beijing is a densely populated and economically developed city. In recent years, with the transition of the power structure to green and low-carbon and the sustained and rapid growth of power energy consumption, the energy crisis, climate change and pollutant problems threaten the sustainable development of cities. Therefore, under the premise of the current green economy, the study of the impact of various factors on urban power demand and the exploration of the inherent law of power demand have practical significance for the Beijing’s future electricity planning and resource allocation, and they are also conducive to promoting the implementation of energy saving and emission reduction strategies.
Since the “12th Five-Year Plan”, Beijing’s economy has achieved remarkable development, based on the new stage of development, practicing new development concepts, integrating new development models, focusing on the replacement of old growth drivers with new ones and achieving outstanding results in industrial transformation, but the continuous increase in electricity consumption has led to a “power shortage” situation in the city. Therefore, it is of great theoretical and practical significance to identify and quantify the factors affecting power demand for the realization of energy saving and the sustainable and healthy development of the economy.
Because the change in urban power demand is mainly affected by many factors such as GDP, industrial structure, population size and the mixed effect of them, different factors play different roles in power consumption; some factors play a long-term and stable role in power consumption, while some factors play a periodic role, which makes power consumption uncertain and fluctuating. It is necessary to scientifically analyze the internal relationship between power demand and key factors. Among the factor analysis methods, Index Decomposition Analysis (IDA) is a widely used research method [1,2], which was first used to quantify the impact of changes in product structure and sectoral energy intensity on industrial comprehensive energy consumption intensity in industrial energy consumption. In recent years, it has been widely used in the fields of carbon dioxide emission influencing factors research, energy efficiency detection and energy supply and demand [3,4]. In contrast, the research of factor decomposition technology in the field of electric energy is still relatively rare. It is used in this paper as a tool to analyze the contribution value of different power influencing factors to the change in power demand. The basic idea is to decompose a target variable into a combination of several influencing factors and then calculate the contribution rate of these influencing factors and distinguish each influencing factor according to the contribution rate so as to determine several influential factors that have a greater impact [5].
Commonly used IDA [6] decomposition methods include Laspeyres and Divisia, where the Laspeyres index studies the percentage change of a variable based on the weight of the base year; its advantage is that it is easy to understand the role of each decomposition factor, and the disadvantage is that there are residual terms in the decomposition; the Divisia index presents the logarithmic growth rate in a line integral, and its weight is the share of different factors in the total value [7]. Two common methods of Divisia index decomposition ar thee Arithmetic Mean Divisia Index (AMDI) Decomposition Method and the LMDI Decomposition Method [8,9,10]. AMDI adopts the arithmetic mean, which is usually simpler than LMDI, and the calculation result is very close to that of LMDI. However, AMDI has two shortcomings that cannot be overcome: one is that when the number of factors is large, the decomposition result has a residual remainder; the other is that it cannot deal with the “0” value problem [11]. LMDI is the most widely used factor decomposition model because this method has the characteristics that the decomposition results do not contain unexplained residual terms and can simplify the interpretation of the results. Related research includes: F. Q. Zhang [11] has analyzed and studied the decomposition methods in the energy domain and compared them with specific arithmetic examples and finally concluded that LMDI may be more suitable for decomposition research in the energy domain. B. W. Ang [12] compares and analyzes the Laspeyres index decomposition method, AMDI decomposition method and LMDI decomposition method, respectively, and considers LDMI decomposition analysis because of its superiority in theoretical foundations, adaptability, ease of use and result interpretation, along with some other desirable properties in the context. Ang [13] found that the multiplicative decomposition result of the LMDI algorithm can obtain the additive characteristic by taking the logarithm, and the multiplicative decomposition result is easily related to the additive decomposition result. Second, the decomposition results can form a whole, and the sub-domain can be summarized to analyze the impact of the whole domain. It is considered that the LMDI method is very suitable for the decomposition analysis of energy consumption and carbon emission. In summary, the algorithm is suitable for the decomposition of power energy change factors and belongs to the complete decomposition technology, but the main defect is that there is a logarithmic assignment problem limited by zero and negative values in the logarithmic weight allocation, and there is no negative value problem in this study. As a result, the LMDI decomposition method is selected in this research.
At present, domestic and foreign scholars use the LMDI decomposition method to analyze and study electricity consumption in few works of literature; most of them were limited to the national level, and there is a lack of city-level research. For example, Ma and Shen [14] studied the change in China’s electricity consumption between 1984 and 2004, and the results showed that the influence of economic growth and intensity change was the main driving force. Zhang et al. [15] found that the effect of economic activity is the main driving force of the growth of China’s electricity consumption, while the energy intensity effect is the hindering factor for the growth of electricity consumption. In addition, they only focused on the industrial electricity consumption, while they ignored the residential electricity consumption. Based on this, this paper takes Beijing as the research object and adds residential electricity consumption into the three industrial electricity consumption decomposition models with the LMDI method, thus further constructing a more detailed model of the total electricity consumption decomposition and focusing on identifying important drivers factors of industrial and residential power demand growth. This will provide more targeted suggestions for the implementation of energy conservation and emission reduction policies in Beijing in the future, which also has a certain reference value for other cities.

2. Actuality of Power Demand in Beijing and Economic Development

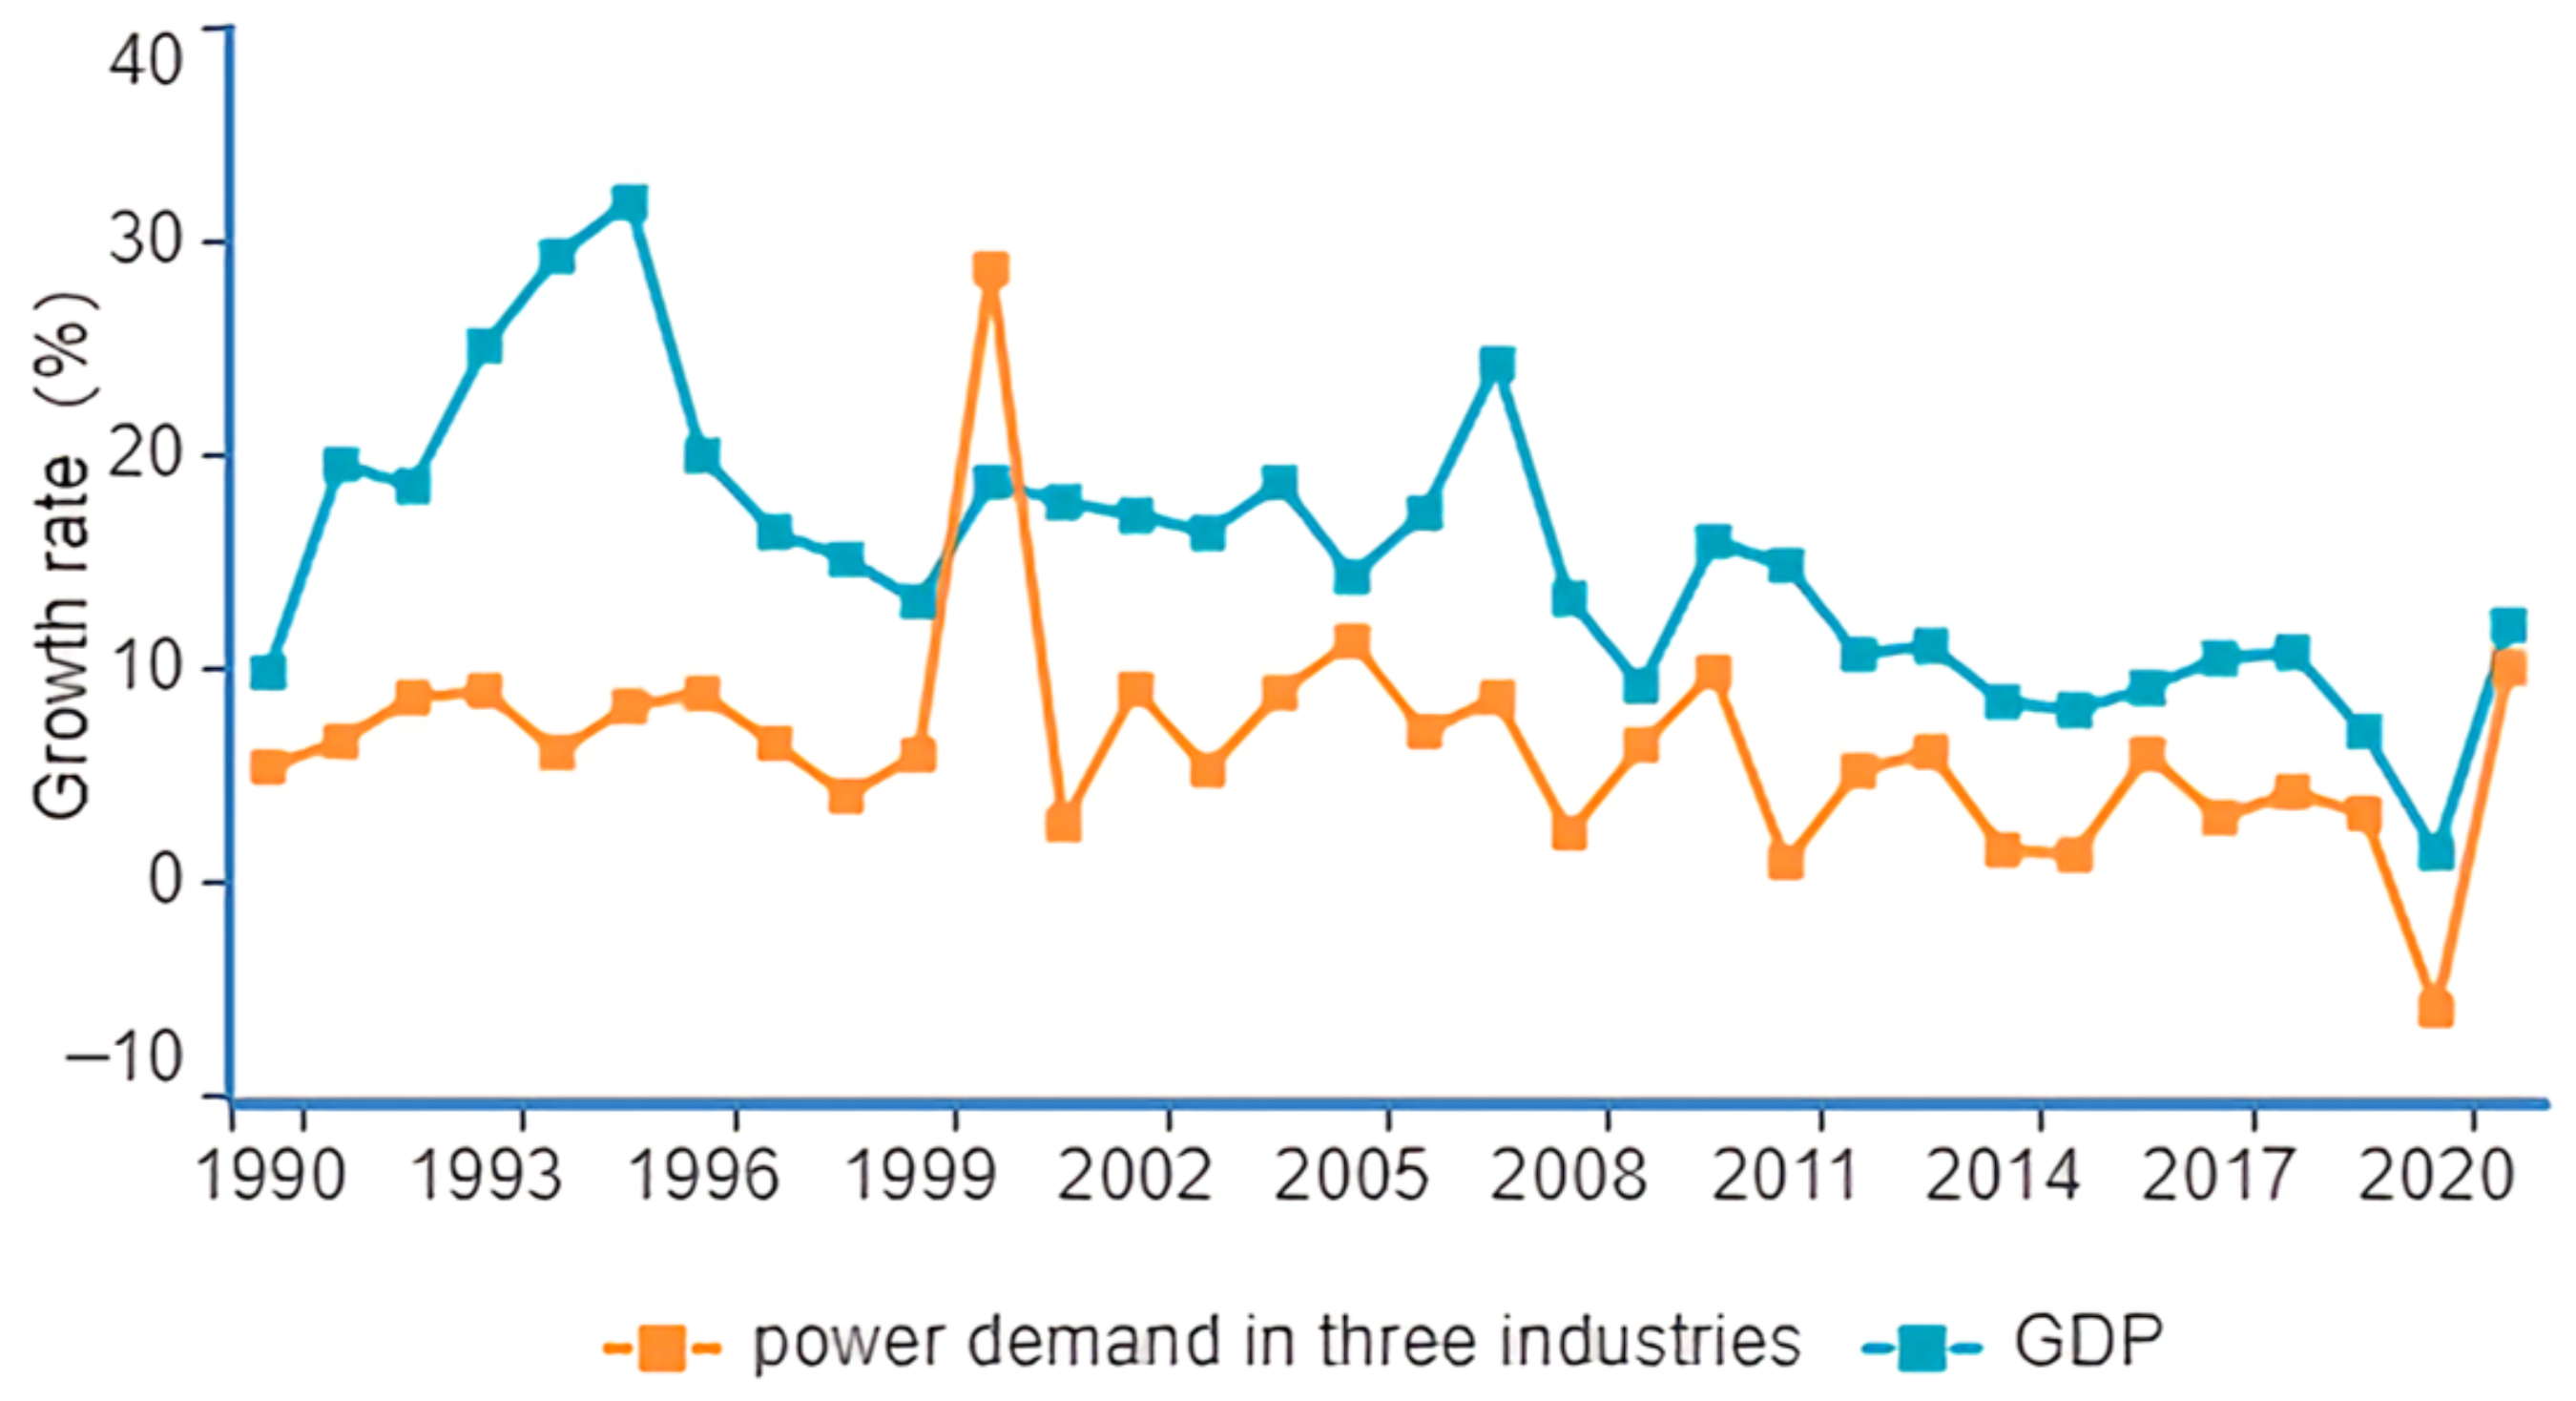
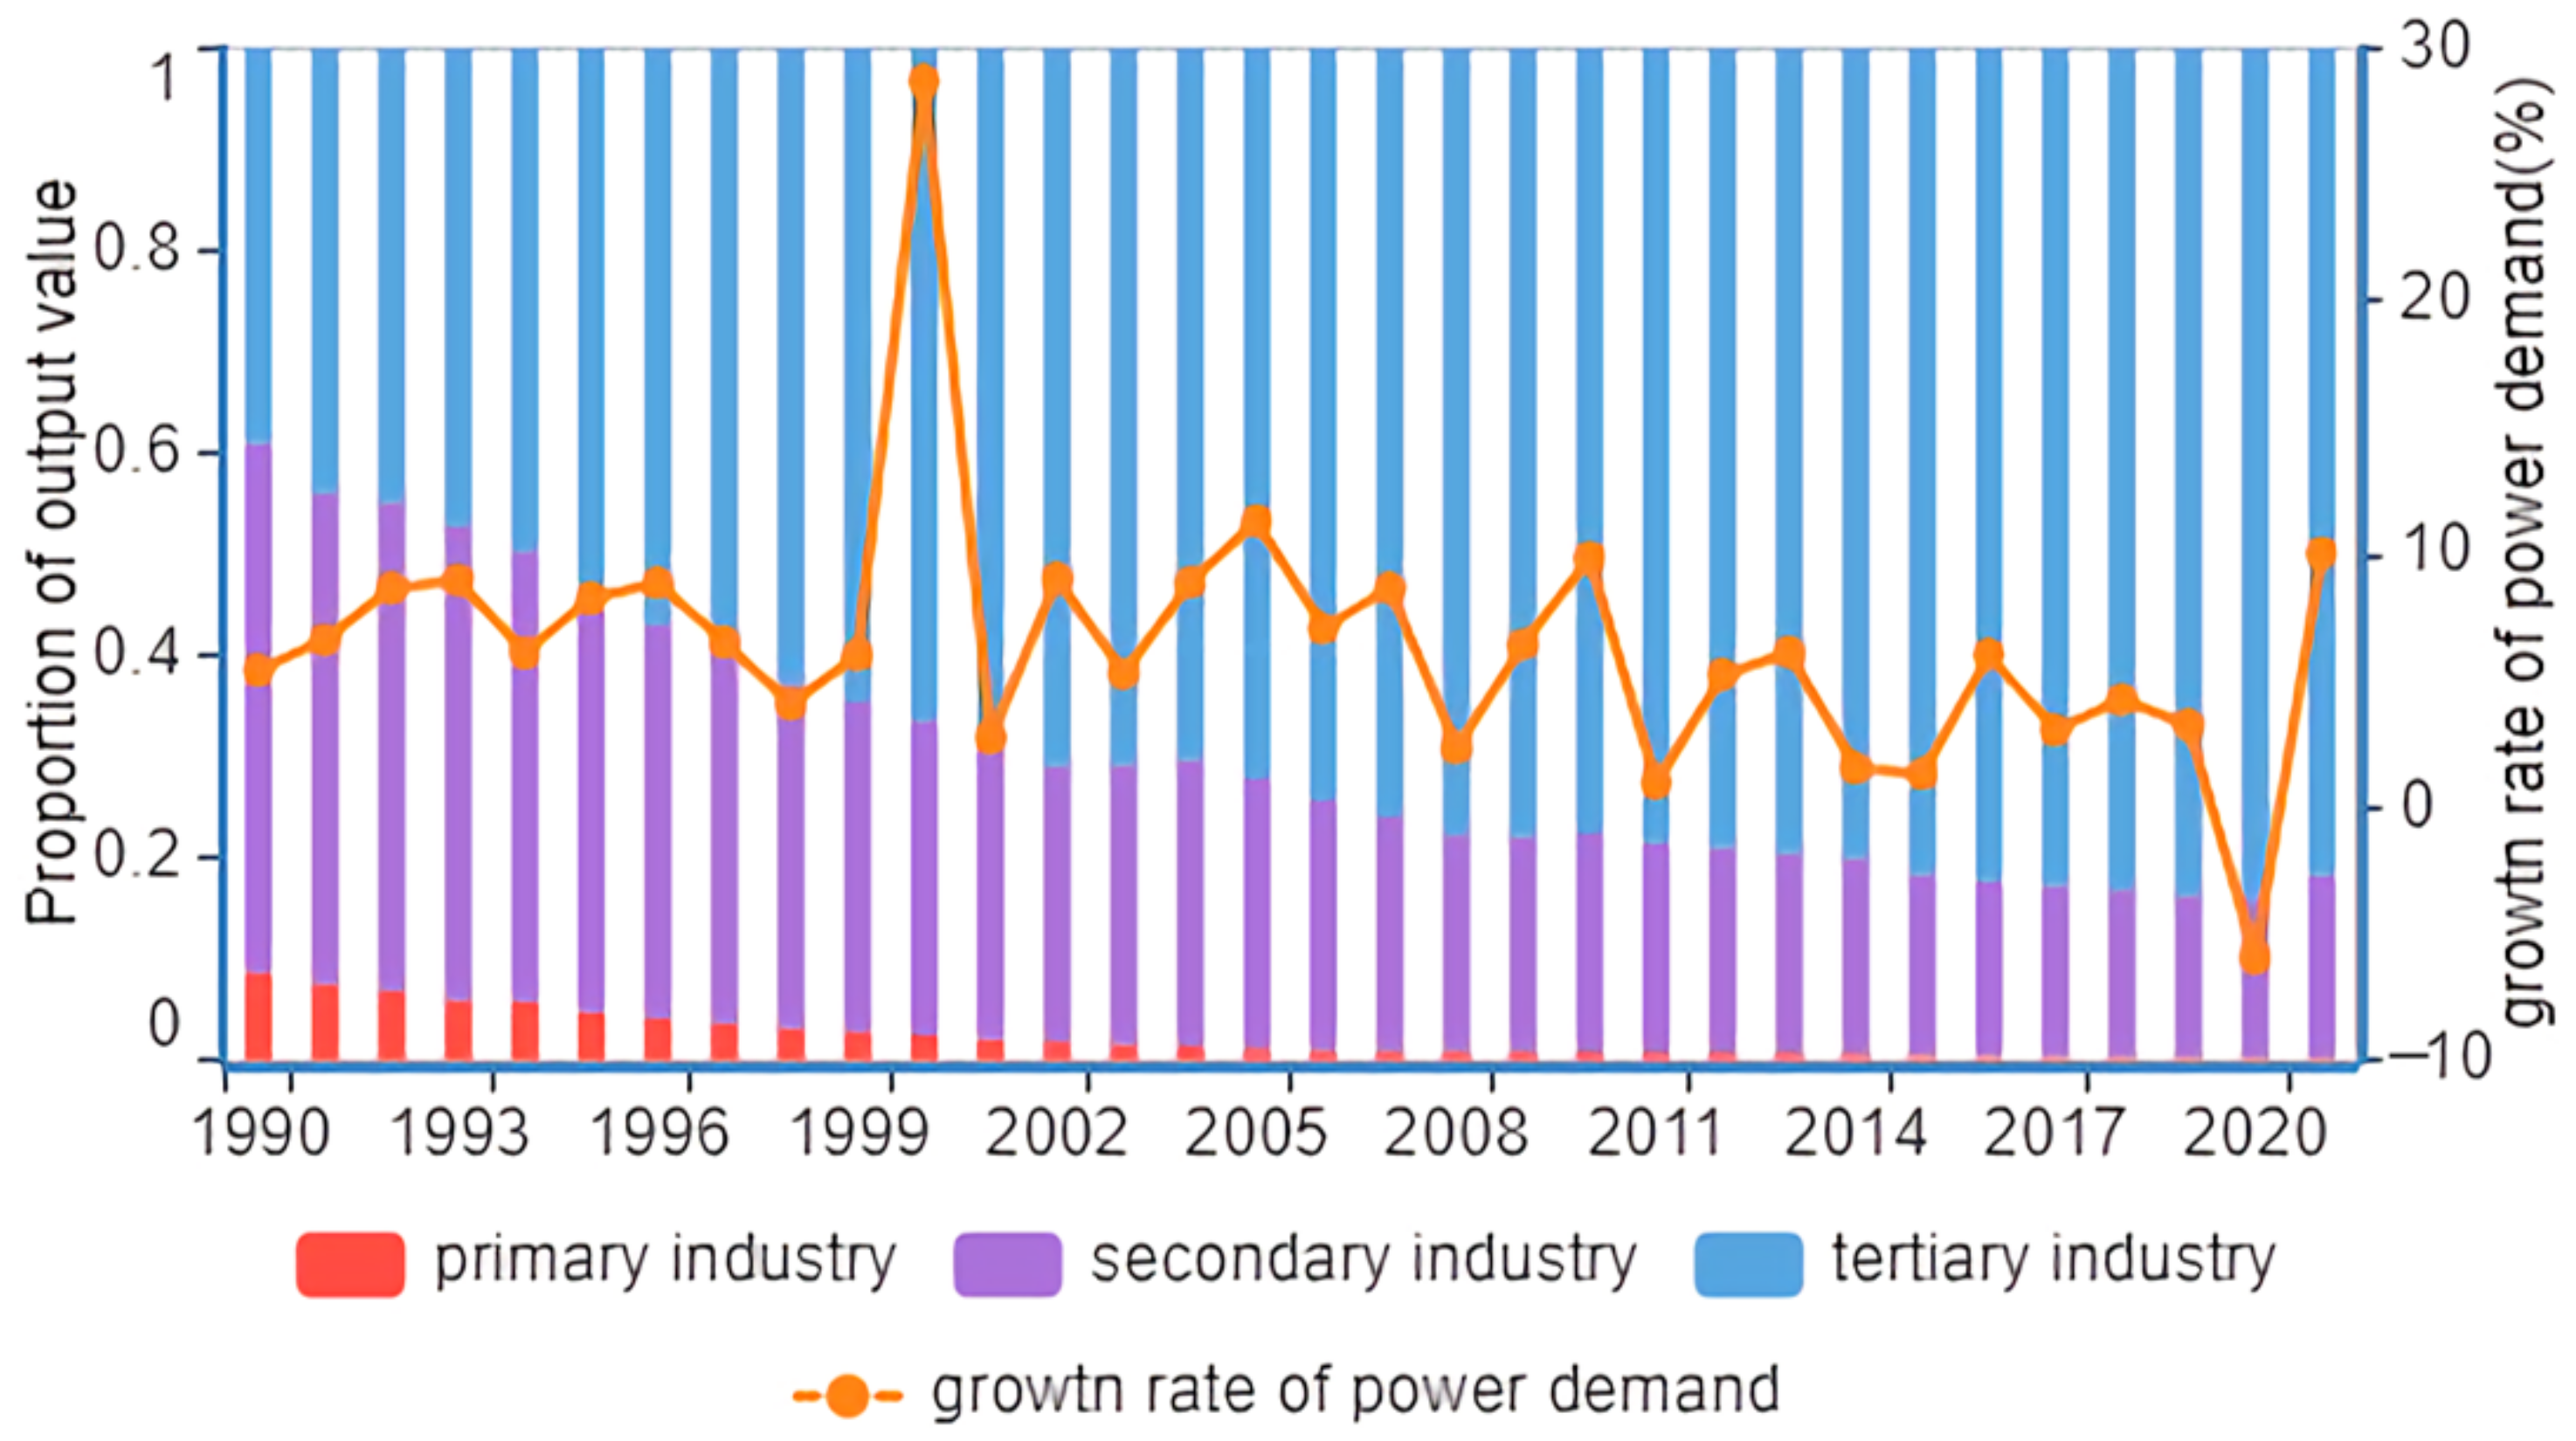
2.1. Economic Development and Transformation of the Industrial Structure

According to the data of the Beijing Statistical Yearbook over the years, Beijing’s economy has maintained a sustained growth trend since 1990, experienced a high growth stage before 2011, with an average annual growth rate of 18.06%, and gradually changed to a high-quality growth mode in the following 10 years [16]. Under the macro trend of steady economic growth, GDP growth will still be the main driving force for the growth of power demand in Beijing.
Over the past 30 years, with the rapid rise in the total economic volume, the industrial structure of Beijing’s economy has also undergone major changes [9]. The three industrial structures of the whole city have changed from 8.73:52.32:38.95 in 1990 to 0.28:18.05:81.67 in 2021. The proportion of the primary industry and the secondary industry tends to decline, while the tertiary industry gradually occupies a dominant position, and the industrial structure has been continuously optimized. The period from 1990 to 2000 was a decade of great industrial restructuring in Beijing, with the proportion of the primary industry continuing to decline from 8.73% in 1990 to 0.28% in 2021, a decrease of 8.5 percentage points. While the proportion of the secondary industry is declining rapidly, the proportion of the tertiary industry is rising rapidly. In 1995, the added value of the tertiary industry in Beijing exceeded the sum of the added value of the primary industry and the secondary industry for the first time. Since 2001, the proportion of the primary industry has steadily dropped, while the proportion of the tertiary industry has continued to rise, breaking through 70% for the first time in 2002.

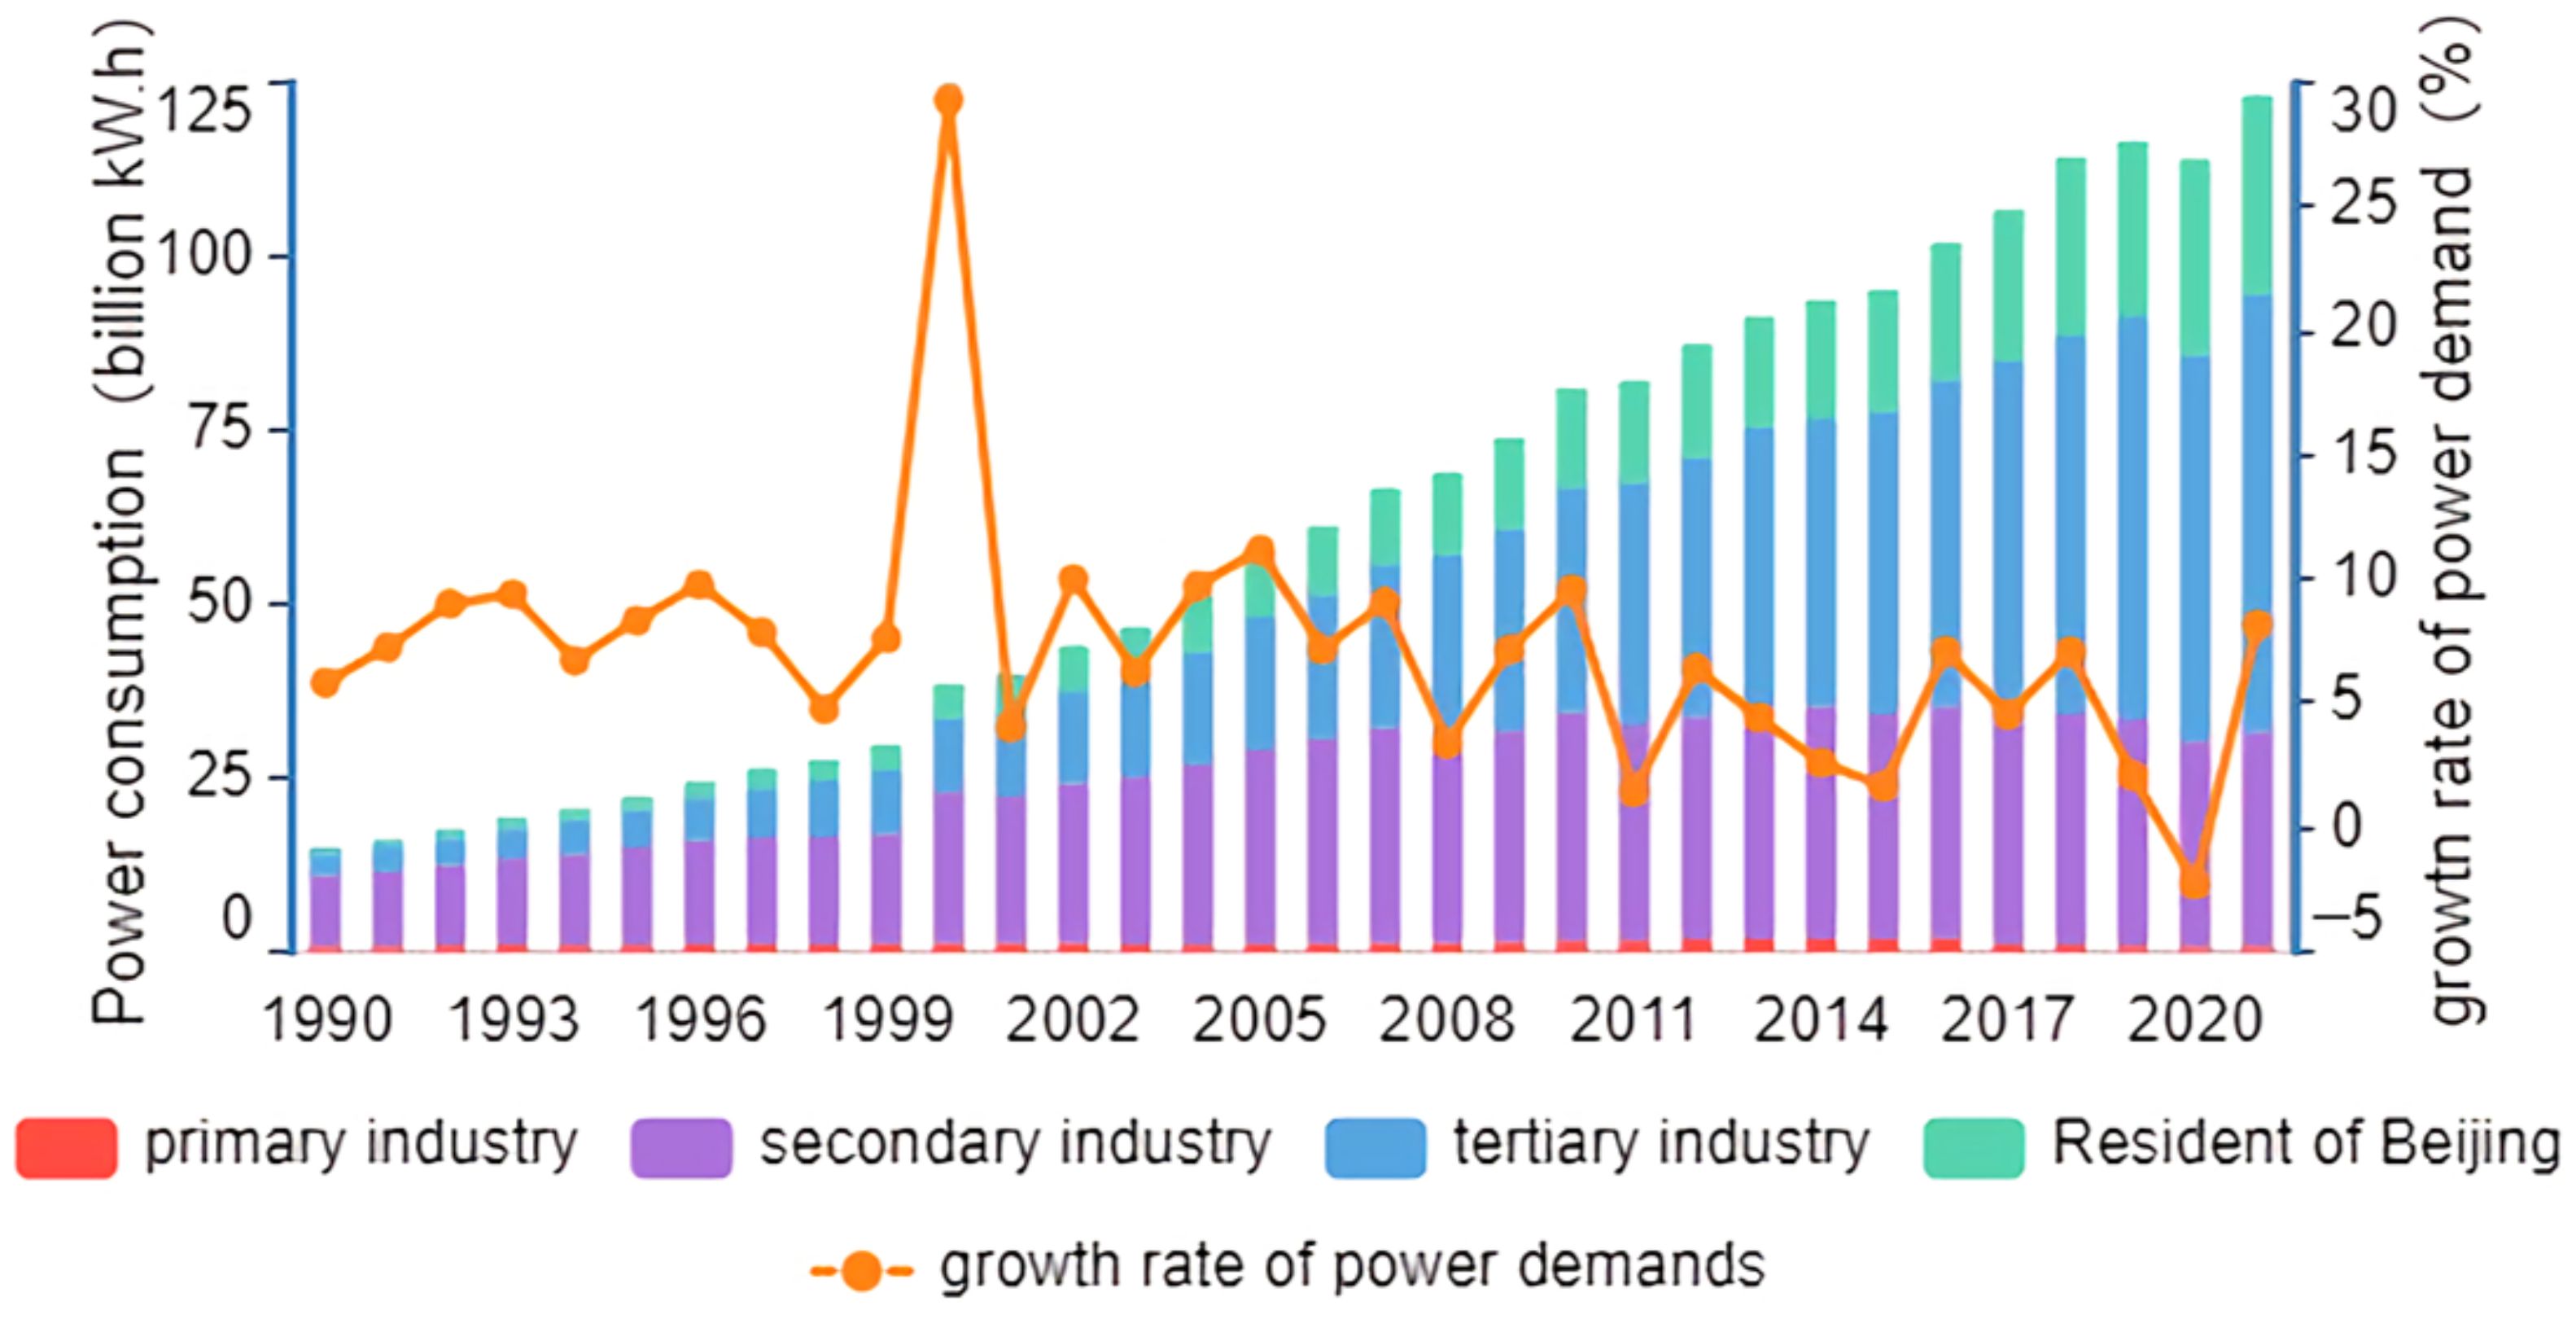
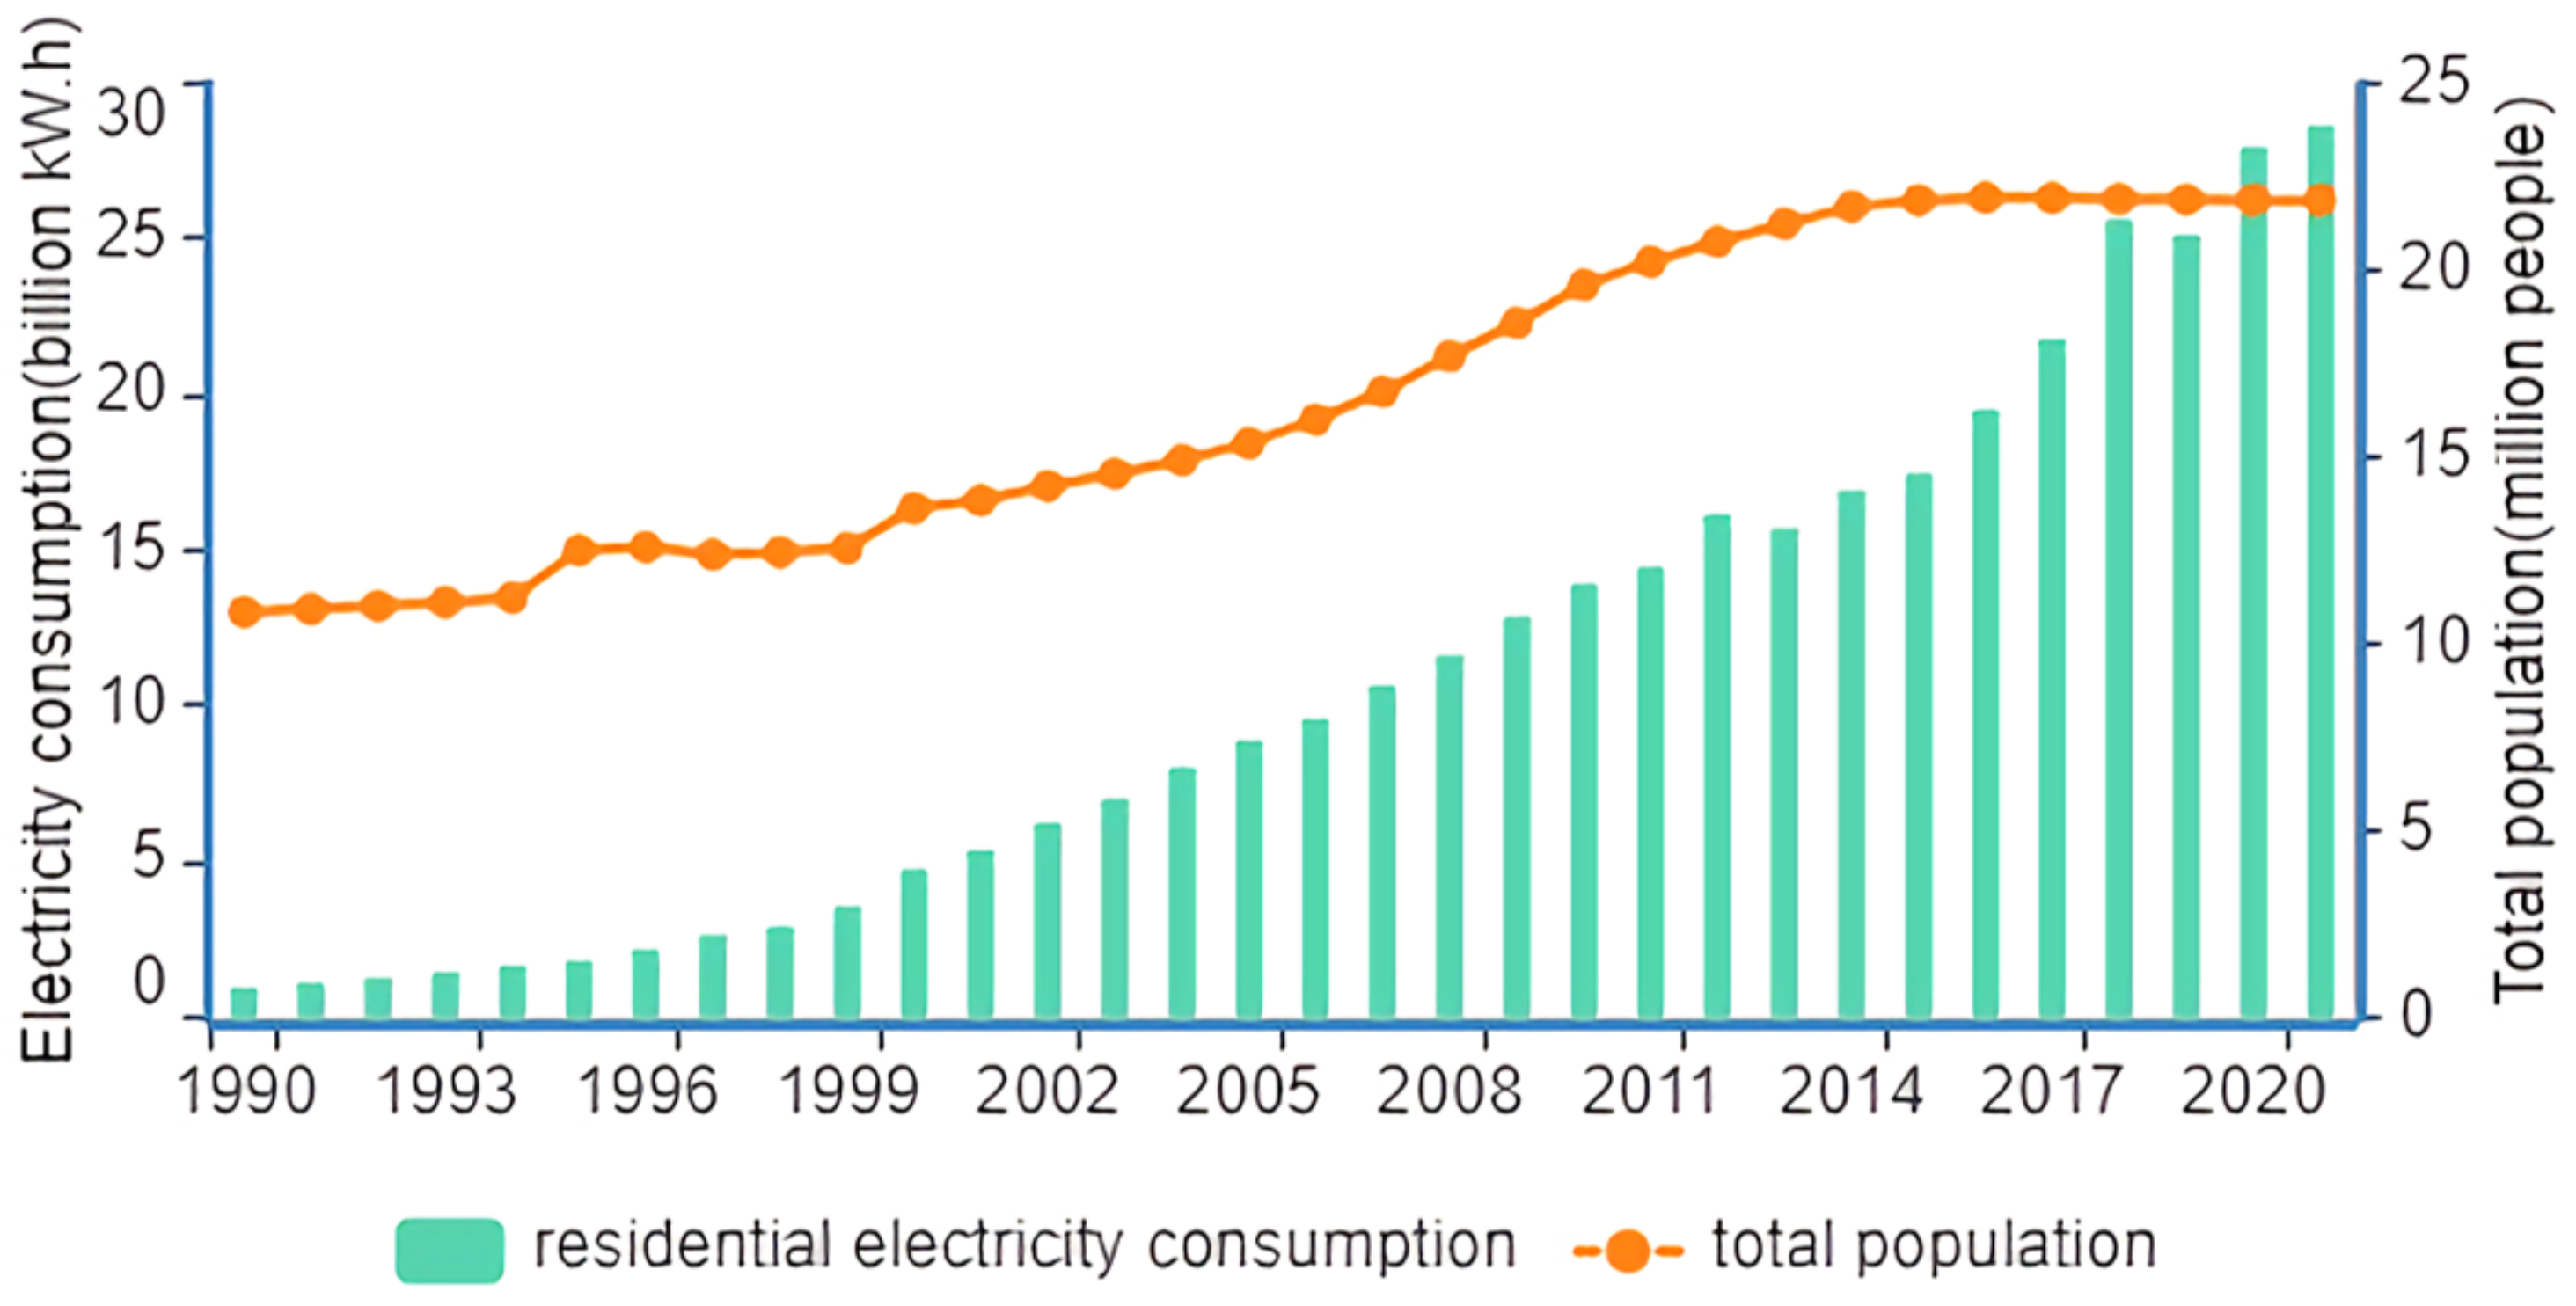
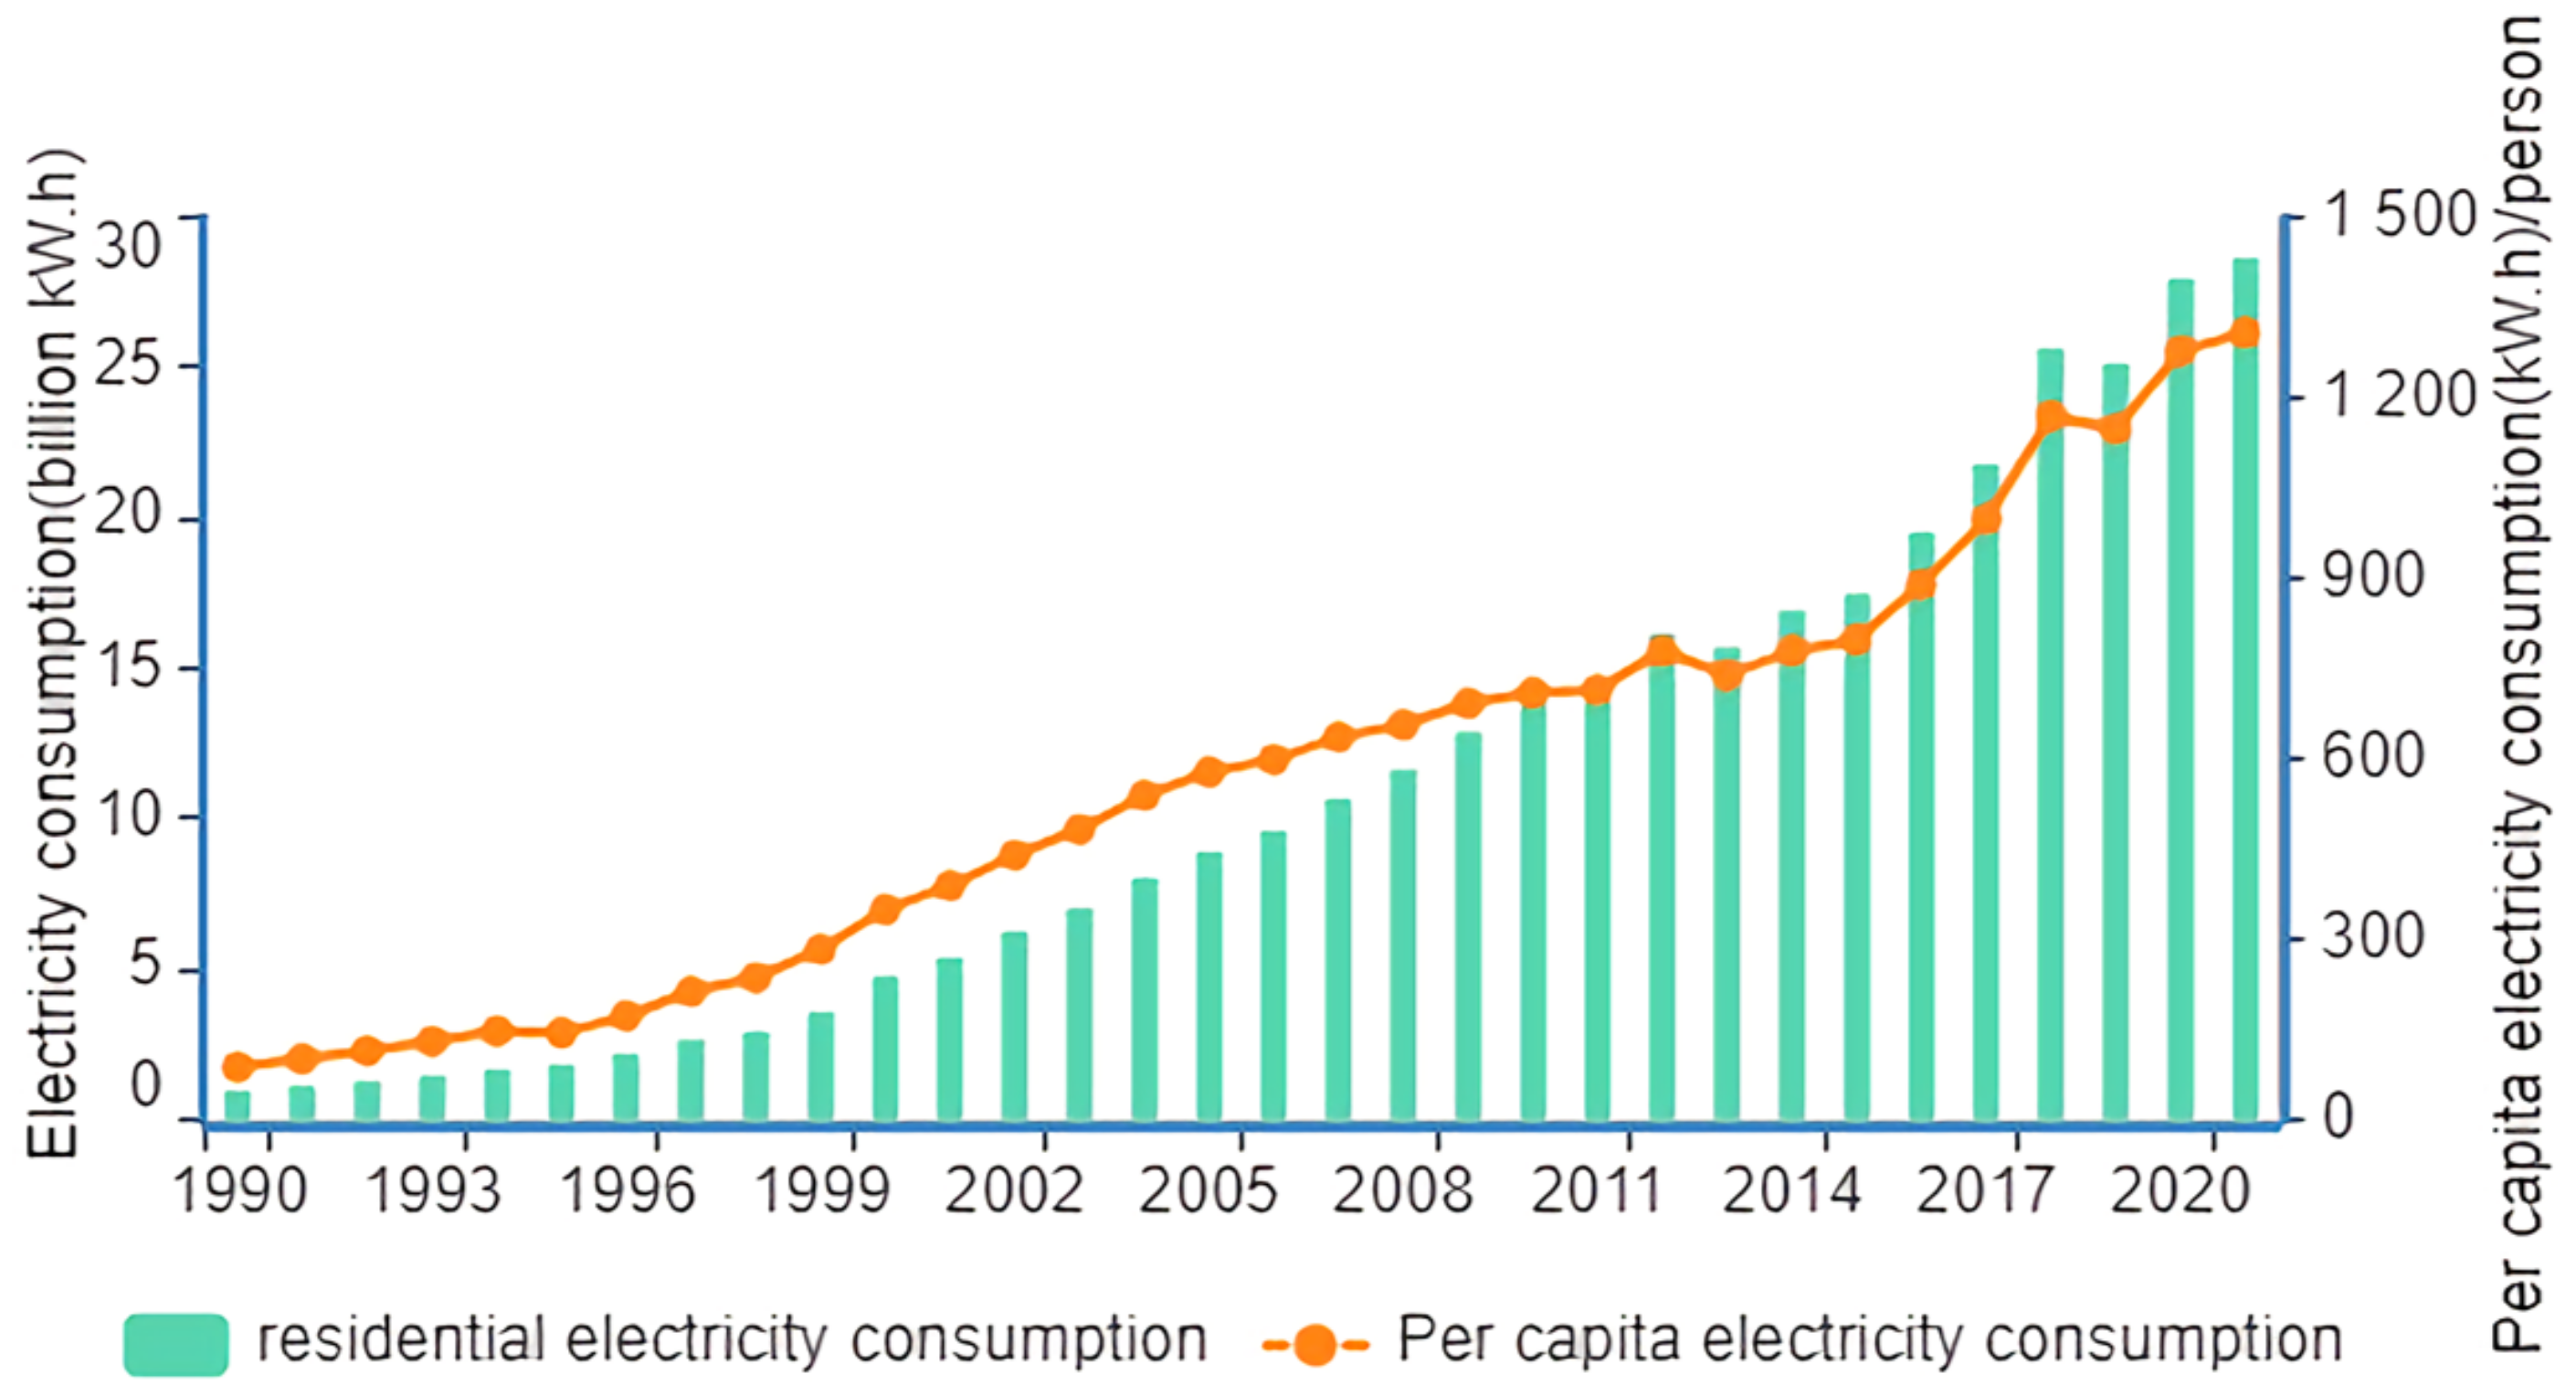
2.2. Significant Increase in Power Demand

The electricity consumption of the whole society in Beijing mainly includes the primary, secondary and tertiary industry as well as the residents, and electric energy supports the economic and social development of Beijing. As shown in Figure 1, (1) In addition to the decrease in electricity consumption due to the shutdown of production due to the novel coronavirus epidemic in 2020, the overall electricity consumption of the whole society in Beijing is on the rise, with an average annual growth rate of 7.13%; (2) The proportion of electricity consumption in the primary industry is relatively stable, the proportion of electricity consumption in the secondary industry has a small increase and has a downward trend after 2000 and the proportion of electricity consumption in the tertiary industry and residential sector has steadily increased; (3) The primary industry accounts for the smallest proportion of electricity consumption, less than 3%, followed by residential electricity consumption. The proportion of electricity consumption in the secondary and tertiary industries in the whole society of Beijing was switched in 2011. Since 2011, the proportion of electricity consumption in the tertiary industry has become the largest industry in Beijing. This is related to Beijing’s policy of promoting the shift from industry-led to service-led after the reform and opening-up.

3. Materials and Methods
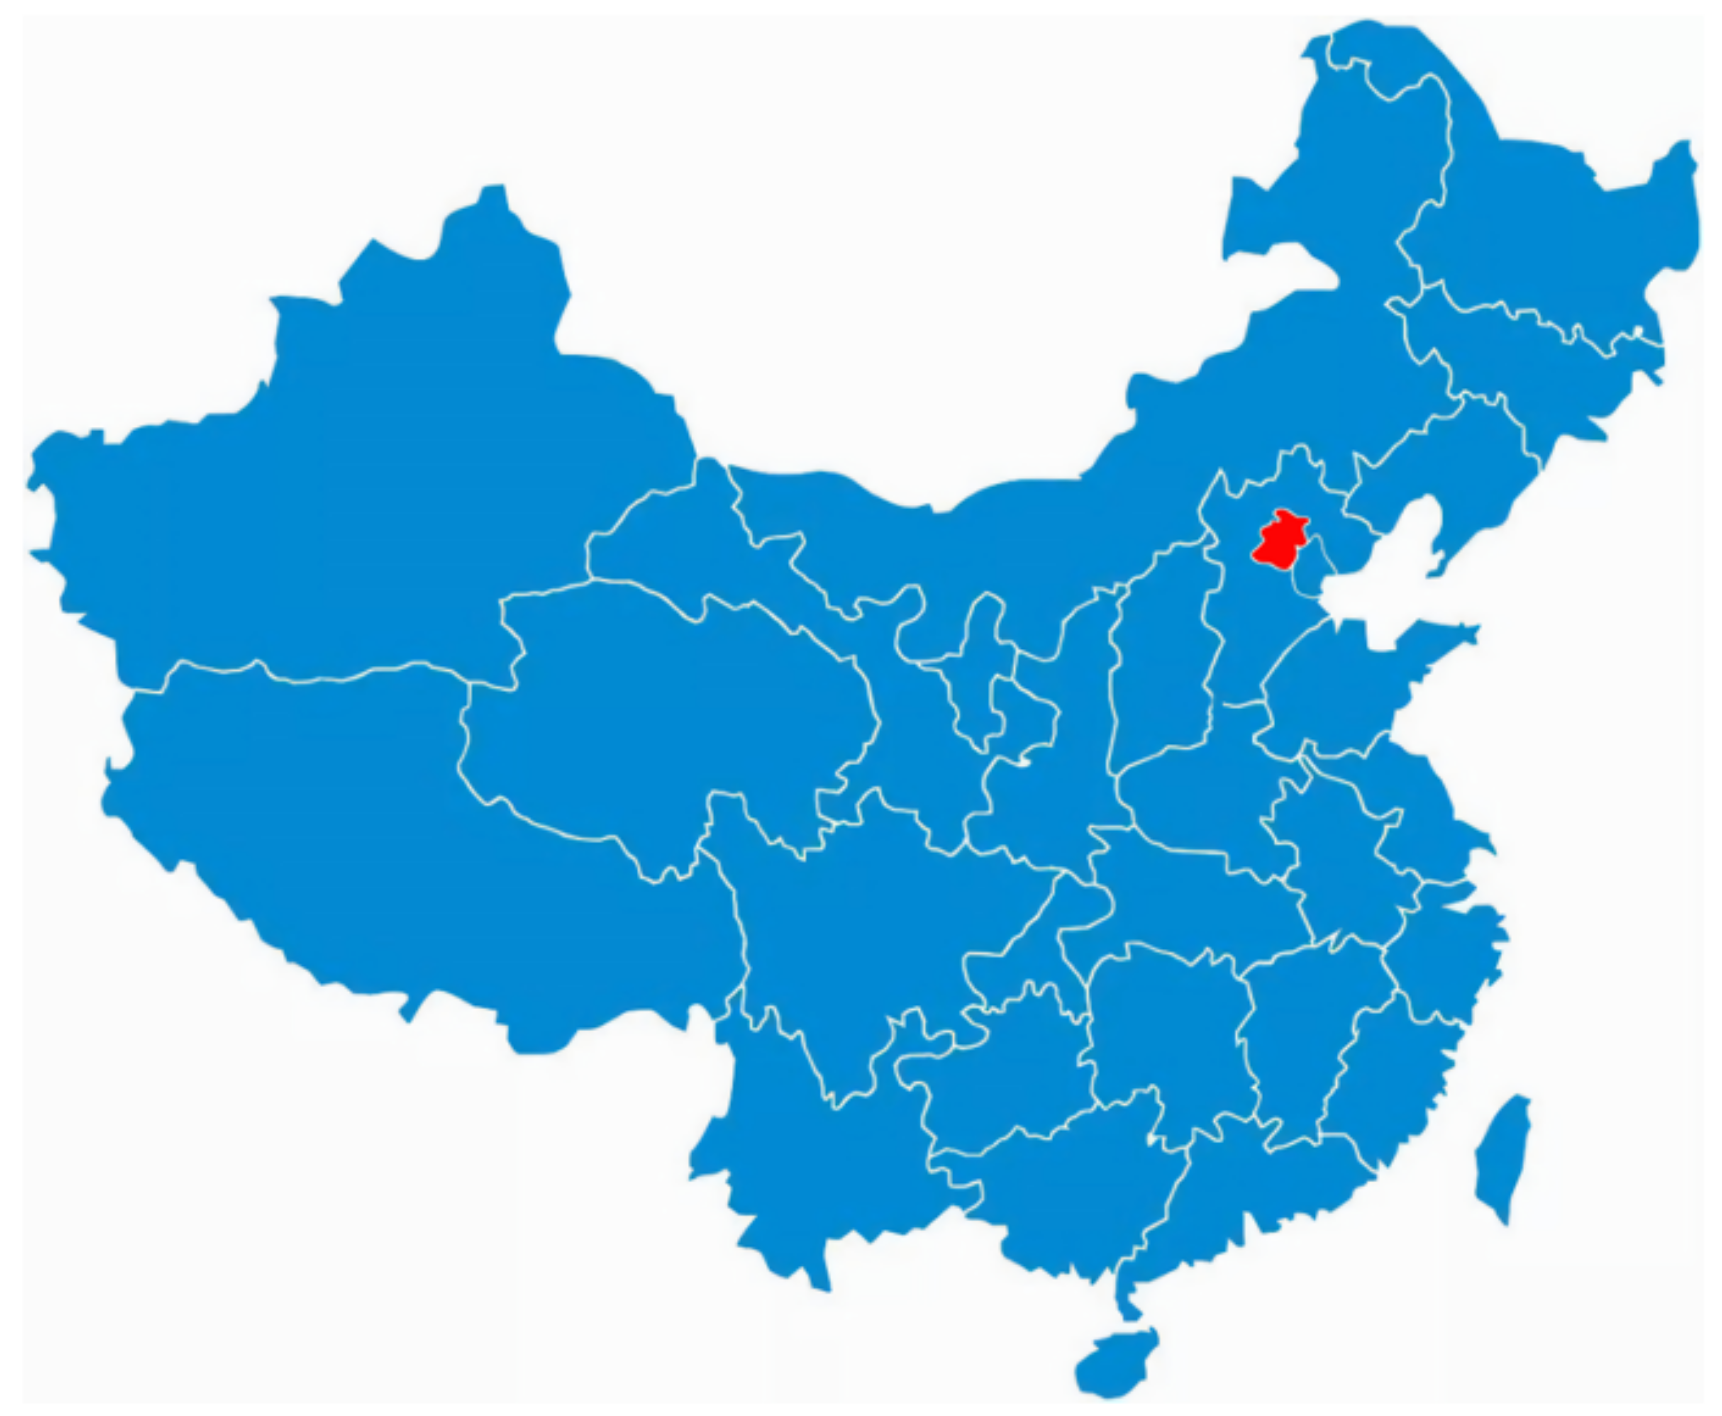
3.1. Study Area

Beijing is located in the north-east of China, bordering the city of Tianjin to the east and Hebei province to the west (Figure 2). As the political, economic and cultural center of China, Beijing is far ahead in terms of economic and social development [17]. However, with the continuous advancement of urbanization, energy consumption management is not in place, population agglomeration and industrial development are not balanced and in recent years, it has also begun to face the situation of power shortage. Since 1990, Beijing has continuously adjusted the existing industrial structure and introduced high and new technologies to improve the efficiency of power utilization, creating conditions for sustainable development in the future. In recent years, with the implementation of a series of policies such as “to relieve Beijing of functions non-essential to its role as China’s capital”, high-consumption industries that do not match Beijing’s capital function will be gradually relieved, and a number of emerging industries and high-tech enterprises will be attracted to Beijing for development so that Beijing’s economic structure and industrial structure will be greatly optimized and upgraded, while joining hands with Tianjin and Hebei. The goals are to reduce the population density of Beijing, promote the economic and social development to adapt to the population, resources and environment and alleviate the pressure of power demand in Beijing.
According to the Beijing Statistical Yearbook, the total electricity consumption of the whole society in Beijing in 2021 was 123.292 billion kW.h. Beijing’s gross domestic product in 1990 was CNY 50.08 billion, and in 2021 it will be CNY 4026.96 billion, with an economic growth of nearly 80 times. With such rapid economic growth, power demand change is an important basis on which to judge whether Beijing’s industrial structure is reasonable, whether its electricity consumption and utilization efficiency are appropriate and whether its economic growth is achieved at the expense of the environment. Beijing city has entered a golden age of rapid economic development, and its economy and society are undergoing major changes. If the industrial structure is unsustainable and electricity consumption increases too quickly, Beijing city will be unable to achieve sustainable development in the future. Therefore, by exploring the relationship between power demand and economic development and analyzing the important factors influencing the changes in industrial and residential power demand in Beijing, it can provide a reference for the sustainable development and power planning of Beijing city and other cities.

3.2. Data Resource

This paper selects the data of total social electricity consumption, industrial electricity consumption, residents’ electricity consumption, regional GDP, sub-industrial GDP and population size (take the number of permanent residents) in Beijing from 1990 to 2021; all data are from Beijing Statistical Yearbook 2022 [16]. Almost 100 sub-industries in the China national economy were divided and categorized into three major industrial sectors for analysis in accordance with the National Economic Classification of Industries (GB/T 4754-2017). The three major industrial sectors were: the primary industry refers to farming, forestry, animal husbandry and fishery (excluding farming, forestry, animal husbandry and fishery professional and auxiliary activities); the secondary industry refers to mining (excluding mining professional and auxiliary activities), manufacturing (excluding metal products, machinery and equipment repair), electricity, heat, gas and water production and supply industries; the tertiary industry is the service industry, which refers to other industries except for the primary industry and the secondary industry.
According to the classification standard of China’s three industries, the national economy sectors are divided into the primary industry, secondary industry and tertiary industry. According to the LMDI model, the decomposition of the power demand of the whole society needs two basic variables: the power demand of each industry ( E i , t , all industries in Beijing are divided into the tertiary industry, secondary industry and primary industry, marked as “i”) and the power demand of residents ( P t ). The basic data are from the Beijing Statistical Yearbook over the years, and the sample period was selected from 1990 to 2021 in order to maintain the comparability and validity of the data.

3.3. Analysis of the LMDI Model

In the field of influencing factor decomposition research, the LMDI algorithm is widely used because it can not only eliminate the unexplained residual terms but also deal with the zero-value problem in the data [18]; along with the simplicity of the calculation process and the intuitiveness of the resulting decomposition results, the LMDI method can make the model results more convincing. The LMDI decomposition model selects economic growth, industrial structure, electric energy intensity, population size and per capita power consumption as the five decomposition factors of power demand. The specific reasons are as follows.

3.3.1. Impact of Economic Development on Electricity Consumption in Three Industries

Among the many factors affecting electricity consumption, the level of economic development is the most important decision-making factor. GDP as an important indicator for measuring the level of regional economic development, and it has a close relationship with electricity consumption. The growth rate of GDP in most years is higher than that of electricity consumption, and the slowdown of GDP growth in recent years has slowed down the growth rate of electricity demand. During the 32 years from 1990 to 2021, the average annual growth rate of GDP was 15.20%. At the same time, the power demand of the three industries also increased year by year, from 14.099 billion kW.h in 1990 to 94.653 billion kW.h in 2021, with an average annual growth rate of 6.43%. There is a strong correlation between the power demand of the three industries and the GDP growth. Generally speaking, the two have the same cycle shape; especially, the bottom of the two is basically the same, but they are not completely synchronized. In most cases, the two increase and decrease at different rates, and in some special years (such as 1994), there is even a significant deviation, as shown in Figure 3. In 2020, due to the impact of the epidemic, the economic growth rate declined significantly, hitting a new low in the past 30 years. In 2021, under the effective epidemic prevention and steady growth measures, the economy bottomed out and rebounded, reaching 12.04%.

3.3.2. Impact of Industrial Structure on Electricity Consumption in Three Industries

Combined with the functional orientation of Beijing, Beijing realizes the adjustment of the industrial structure by optimizing and upgrading, vacating industries, raising the entry standards of enterprises and strictly controlling the increment of enterprises. The adjustment of the industrial structure will inevitably have an impact on electricity demand. As shown in Figure 4, it reflects the change in Beijing’s industrial structure and the growth rate of the power demand from 1990 to 2021. The development trend of the three industries is that the proportion of the primary and secondary industries is gradually decreasing, while the proportion of the tertiary industry is gradually increasing, which is mainly due to the policy of actively promoting the transformation of the industrial structure and vigorously developing the tertiary industry in Beijing in recent years. Since the “Ninth Five-Year” Plan, the tertiary industry has gradually replaced the status of the secondary industry and has become the pillar industry of Beijing. Correspondingly, the electricity consumption of the three industries is also growing continuously. According to statistical data, in recent years, the proportion of electricity consumption of the tertiary industry in Beijing is the largest, followed by that of the secondary industry and, finally, that of the primary industry. However, due to the rapid development of the tertiary industry in Beijing, the growth rate of electricity consumption in the secondary industry has slowed down, and its proportion in the total social electricity consumption is also gradually decreasing.

3.3.3. Impact of Electric Energy Intensity on Electricity Consumption in Three Industries

Electric energy intensity, namely, electricity consumption per unit of GDP, is one of the important indicators for measuring the efficiency of electric utilization in a region. As shown in Figure 5, from 1990 to 2020, the overall electric energy intensity in Beijing continued to decline, but it did not fail to rise in 2000. Influenced by many factors such as the industrial structure, the improvement of energy efficiency and alternative energy, the electricity energy intensity per unit output value of each industry fluctuates to varying degrees from year to year, but the overall trend is downward, with the secondary and tertiary industries declining by a big margin. Among them, the main reason why the growth rate of power demand from 1999 to 2000 is much higher than the average level is that the intensity of electricity energy per unit output value of GDP in that year increases, while the intensity of electricity energy per unit output value of GDP in other years decreases year by year (that is, the growth rate of electricity energy intensity per unit output value of GDP is negative).

3.3.4. Impact of Population Size on Residential Electricity Consumption

The number of permanent residents refers to the total number of people who have actually lived in an area for more than half a year. As a macro indicator of population measurement, a change in the number of permanent residents will directly affect the total demand for electricity for residents. As can be seen in Figure 6, from 1990 to 2010, the population growth rate of Beijing gradually slowed down, but the population still grew. After 2010, the population size basically stabilized, which is related to the policies of “to relieve Beijing of functions non-essential to its role as China’s capital” and “talents introduction”, with one rising and one dropping, keeping the population in Beijing within a stable range.

3.3.5. Impact of Per Capita Electricity Consumption on Residential Electricity Consumption

The level of per capita electricity consumption reflects the current growth or tightening trend of residential electricity consumption and will also affect the power demand to a certain extent. As shown in Figure 7, with the increase in residential electricity consumption, the per capita electricity consumption grows rapidly. The per capita electricity consumption in 2021 was 1308.5 kW.h, which is 15 times the per capita electricity consumption in 1990: 87.4 kW.h.

3.4. Model Setting

Under the theoretical framework of IDA, the total electricity consumption in the tth year is first decomposed, including industrial electricity consumption and residential electricity consumption, as shown in Formula (1).
E t = I t + P t
According to the extended Kaya-equation [19], this paper decomposes the variation in the electricity consumption of the three industries and the residential electricity consumption, as shown in Formulas (2) and (3), in which the electricity consumption of the three industries is mainly affected by the GDP of the region, the weight of related industries in the total production value and the intensity level of the electric energy of related industries. The change in residential electricity consumption mainly depends on the change in population and the change in per capita electricity consumption.
I t = i = 1 3 E i , t = i = 1 3 E i , t · G i , t G t · G t G i , t = i = 1 3 E i , t G i , t · G i , t G t · G t = i = 1 3 S i , t · I i , t · G t
P t = P t · P t Q t · Q t P t = P t Q t · Q t = R t · Q t ,
where E t is the total electricity consumption of the whole society; I t is the total electricity consumption of the three industries; P t is the residential electricity consumption; E i , t is the electricity consumption of the ith industry; S i , t is the electric energy intensity of the ith industry; I i , t is the proportion of the output value of the ith industry; G t is the regional GDP; R t is the per capita electricity consumption; Q t is the total resident population. Thus, we attribute the impact of power demand to economic growth ( G t ), industrial structure ( I i , t ), electric energy intensity ( S i , t ), population size ( Q t ) and per capita electricity consumption ( R t ).
Considering that the LMDI decomposition method has no residual and ranges of applicability, the LMDI algorithm is used to further decompose Formula (1) as follows:
E = E t E 0 = I + P ,
Considering that electricity consumption is an aggregate indicator, the addition form method is more suitable. Therefore, the addition form of LMDI can decompose the change in total industrial electricity consumption ( I ) and the change in total residential electricity consumption ( P ) in a period of time into the following formula:
I = I t I 0 = E S + E I + E G ,
P = P t P 0 = E R + E Q ,
where E S , E I , E G , E R and E Q , respectively, represent the contribution values of the five factors to the change in electricity consumption in Beijing from the 0th year (base year) to the tth year (target year). The five factors are electric energy intensity, industrial structure, economic growth, per capita electricity consumption and population size. The formula for calculating the contribution value of each factor is as follows:
E S = S i , t S i , 0 = i = 1 3 E i , t E i , 0 ln E i , t ln E i , 0 × ln S i , t S i , 0 ,
E I = I i , t I i , 0 = i = 1 3 E i , t E i , 0 ln E i , t ln E i , 0 × ln I i , t I i , 0 ,
E G = G t G 0 = I t I 0 ln I t ln I 0 × ln G t G 0 ,
E R = R t R 0 = P t P 0 ln P t ln P 0 × ln R t R 0 ,
E Q = Q t Q 0 = P t P 0 ln P t ln P 0 × ln Q t Q 0 ,
The formula for calculating the contribution rate of different factors is as follows:
m 1 = E s I × 100 % ,
m 2 = E I I × 100 % ,
m 3 = E G I × 100 % ,
m 4 = E R P × 100 % ,
m 5 = E Q P × 100 % ,
where, m 1 , m 2 , m 3 , m 4 and m 5 are the contribution rates of five factors to the growth of electricity demand: electric energy intensity, industrial structure, economic growth, per capita electricity consumption and population size.

4. Decomposition Results & Analysis

4.1. Factor Decomposition Result

According to the LMDI theory, the change in power demand should be the power demand of the target year minus the power demand of the base year. According to Formulas (5) and (6), this paper uses the LMDI decomposition method to decompose the influencing factors of the industrial electricity consumption and residential electricity consumption changes in Beijing from 1990 to 2021 year by year and obtains the quantitative contribution of each driving factor to the growth of industrial and residential electricity consumption, as shown in Table 1.
Table 1 shows the quantitative impact of driving factors on the change in industrial electricity consumption and the change in residential electricity consumption. From the table, it can be seen that the total electricity consumption (except for the impact of the epidemic in 2020) and the contribution value of economic growth are positive in all periods, which shows that Beijing has really achieved economic growth and sustained growth in electricity demand in recent years. Overall, the electricity consumption of the whole society in Beijing increased by 108.115 billion kW.h in 2021 compared with 1990, and the industrial electricity consumption accounted for the largest share of the total electricity demand change, reaching 74%, which means that 74% of the increase in electricity consumption in Beijing from 1990 to 2021 was contributed by the growth of industrial electricity consumption. That is to say, industrial electricity consumption is the main driving force for the growth of electricity consumption in Beijing.
It can be seen from Table 1 that by 2021, industrial electricity consumption increased by 80.43 billion kW.h, of which economic development is the most important factor for the increase in industrial electricity consumption, and the intensity of electricity consumption has the greatest inhibitory effect on the increase in industrial electricity consumption, followed by industrial structure. By 2021, residential electricity consumption increased by 27.685 billion kW.h, of which per capita electricity consumption is the most important factor for the increase in residential electricity consumption, and population size has less of an impact on the increase in residential electricity consumption. Overall, economic growth, total population and per capita electricity consumption have a positive impact on the growth of electricity demand, while the industrial structure and electricity consumption intensity have a negative impact.

4.2. Concrete Analysis

From the decomposition results of industrial electricity consumption and residential electricity consumption, as each factor is in a fluctuating state, the contribution rate of each factor to electricity consumption is more intuitively expressed through the histogram. See Figure 8 and Figure 9 for the contribution rate of each factor to the electricity consumption of three industries and residents.

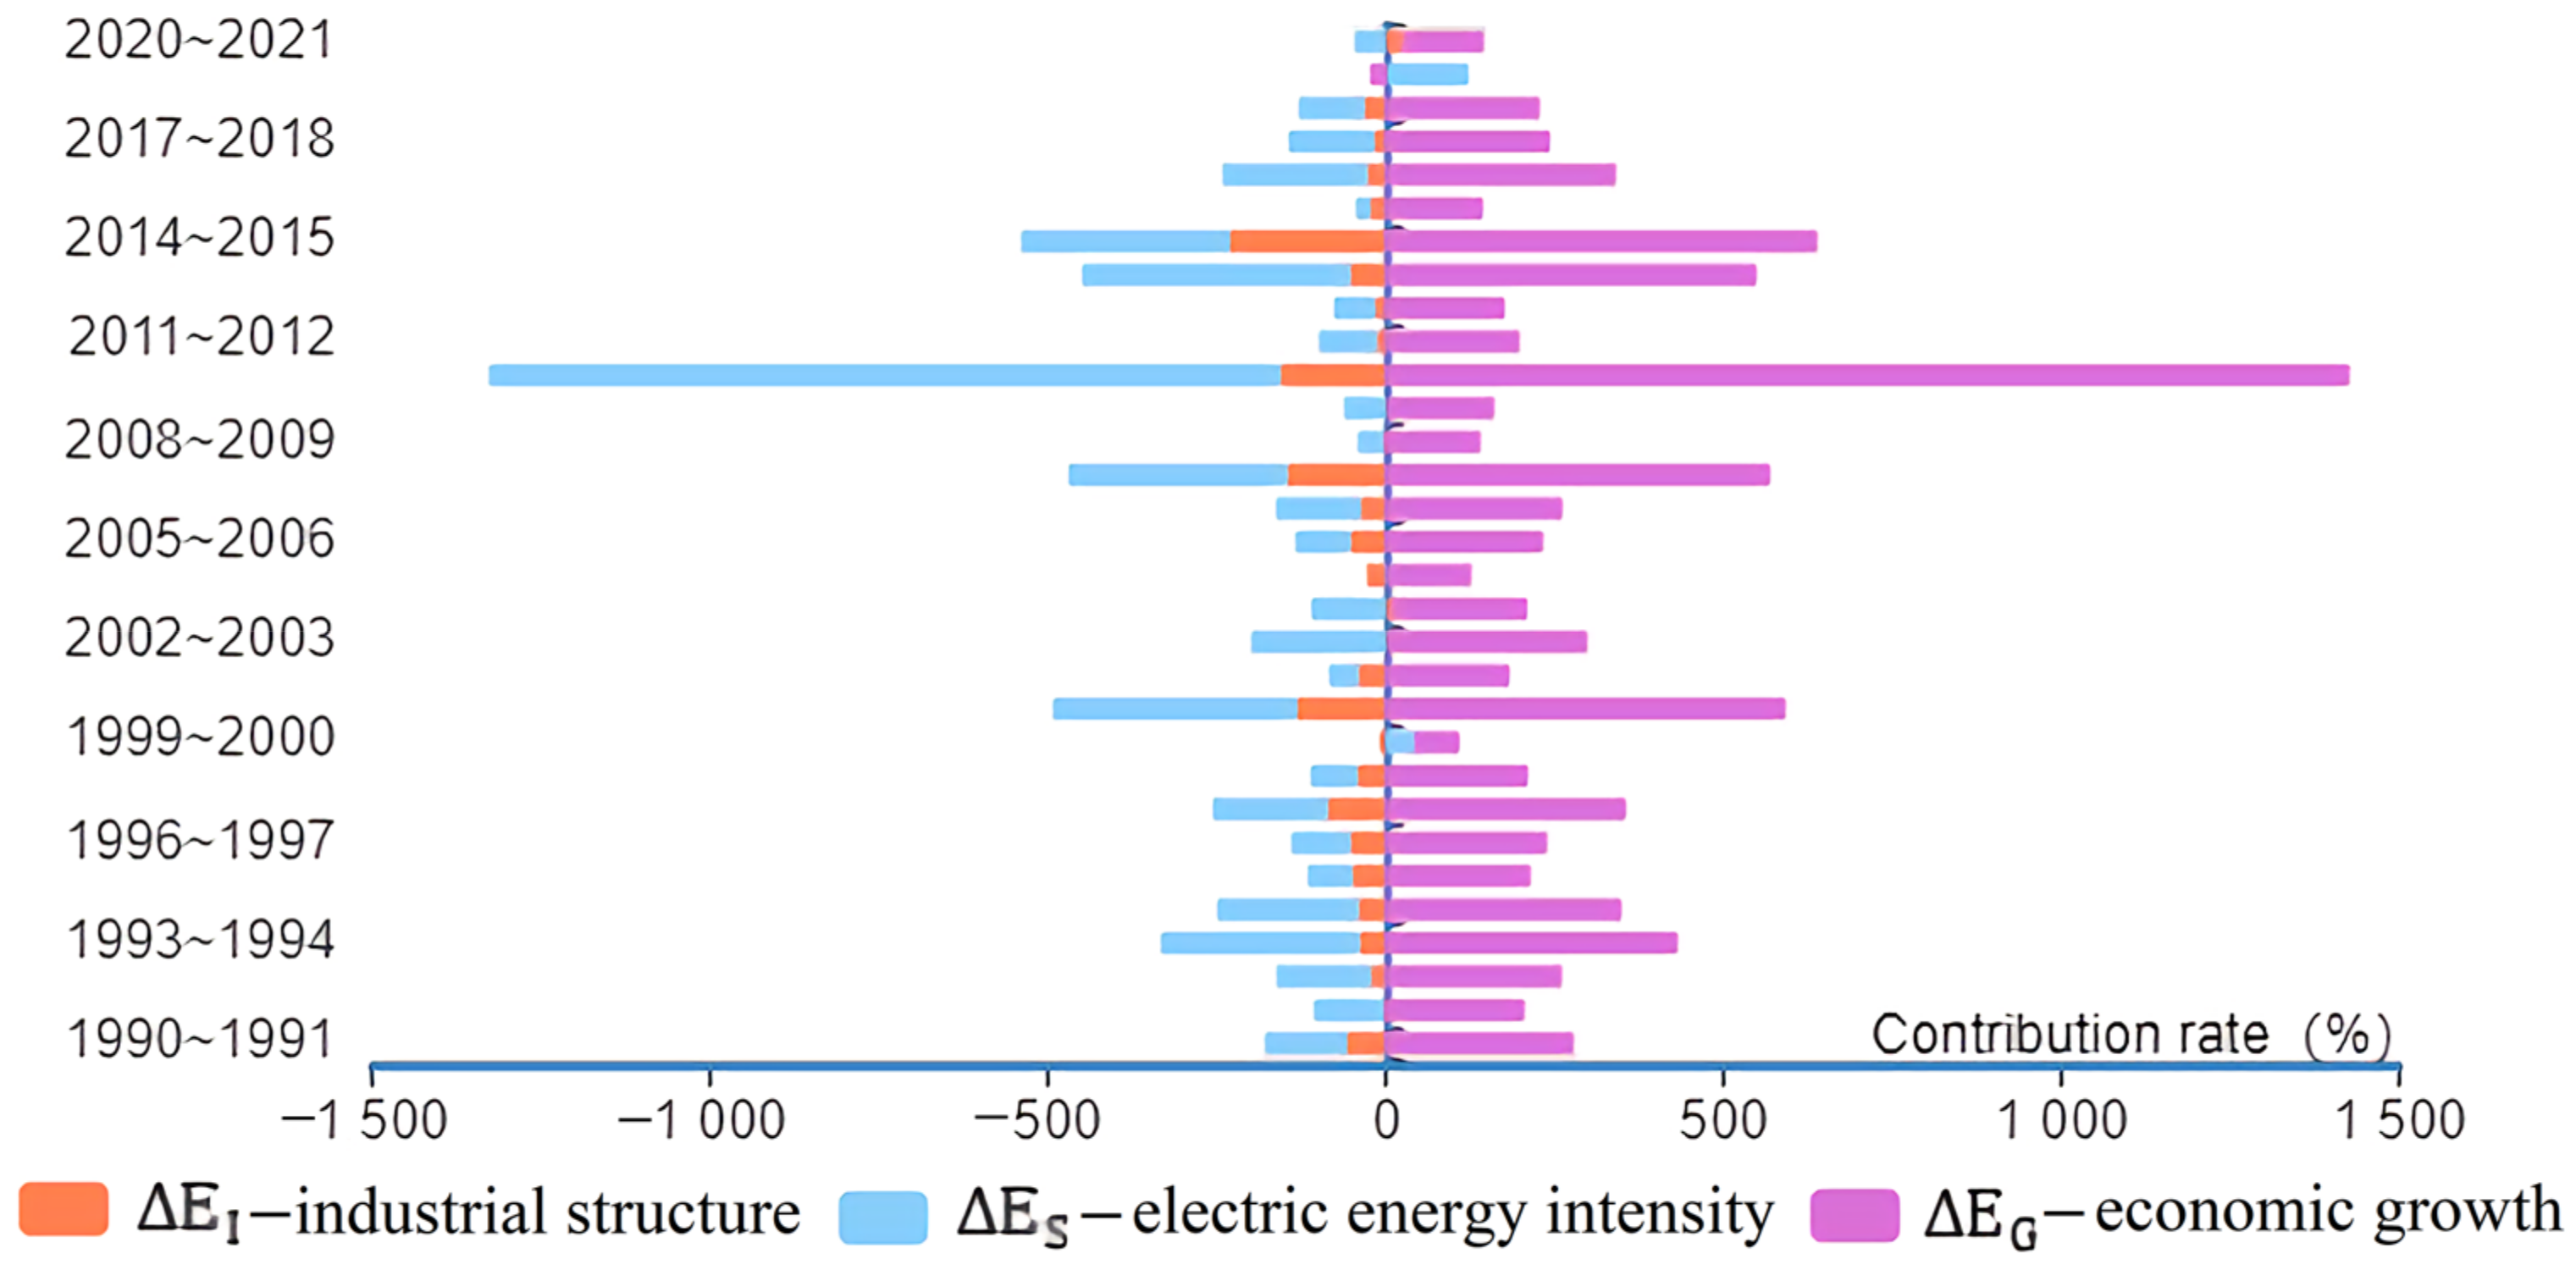
4.2.1. Analysis of the Effect of Each Influencing Factor of Industrial Electricity Consumption

From the perspective of economic factors, the changes in electricity consumption of the industries brought about by economic growth are all positive effects and have always accounted for the largest proportion, indicating that economic growth is the main driving force for the growth of power demand in various industries. From 1990 to 2021, the electricity consumption in the industries increased by 80.430 billion KW.h, of which the contribution rate of economic growth reached 234.26%, which is the only factor with a positive contribution rate. This is related to the rapid economic development of Beijing, and it is expected that the contribution value of economic growth to power demand will further increase in the future. Since the slowdown of economic growth in 2011, the contribution rate of economic growth to the power demand of the three industries has changed gently, and its pulling rate to the growth of power demand has shown a slowly descending trend.
The industrial structure has an impact on industrial electricity consumption, mainly through the adjustment of the industrial structure. Except for a few years, the industrial structure has led to a decline in industrial electricity consumption every year, but the impact is not obvious. By 2021, the cumulative contribution rate is only −25.25%. Since the reform and opening-up, Beijing is in a period of rapid industrialization; specifically, the scale of industry is expanding, and the industrial structure is continuously optimized and adjusted. The ratio of the tertiary industry increased from 38.96% in 1990 to 81.67% in 2021 and exceeded the secondary industry for the first time in 1993. It can be seen that the industrial structure adjustment of Beijing city is gradually realized, and the reduction in the proportion of the secondary industry is conducive to the suppression of power demand. However, the proportion of manufacturing, heavy industry and three high enterprises in the industry is still large, and in the process of green development, electricity, as an important source of clean energy, has been promoted and used, and the inclination of the energy structure within the industry to electricity has offset some of the inhibitory effects of the industrial structure.
Electric energy intensity has the greatest contribution to the reduction in industrial electricity and has a significant inhibitory effect on industrial electricity consumption in the whole period. According to the cumulative effect from 1990 to 2021, the annual contribution rate of electric energy intensity is negative, reaching −109.01%, and the cumulative reduction in industrial electricity consumption is 87.67 billion kW.h. Electric energy intensity reflects the overall efficiency of electricity energy consumption in industrial economic activities. As shown in Figure 7, as the output of the existing capacity of high energy-consuming industries is easily affected by external factors such as policies and markets, the electric energy intensity fluctuates greatly between years, but the overall trend is downward, indicating that with the improvement of power energy utilization efficiency, the power consumption per unit output value is declining.

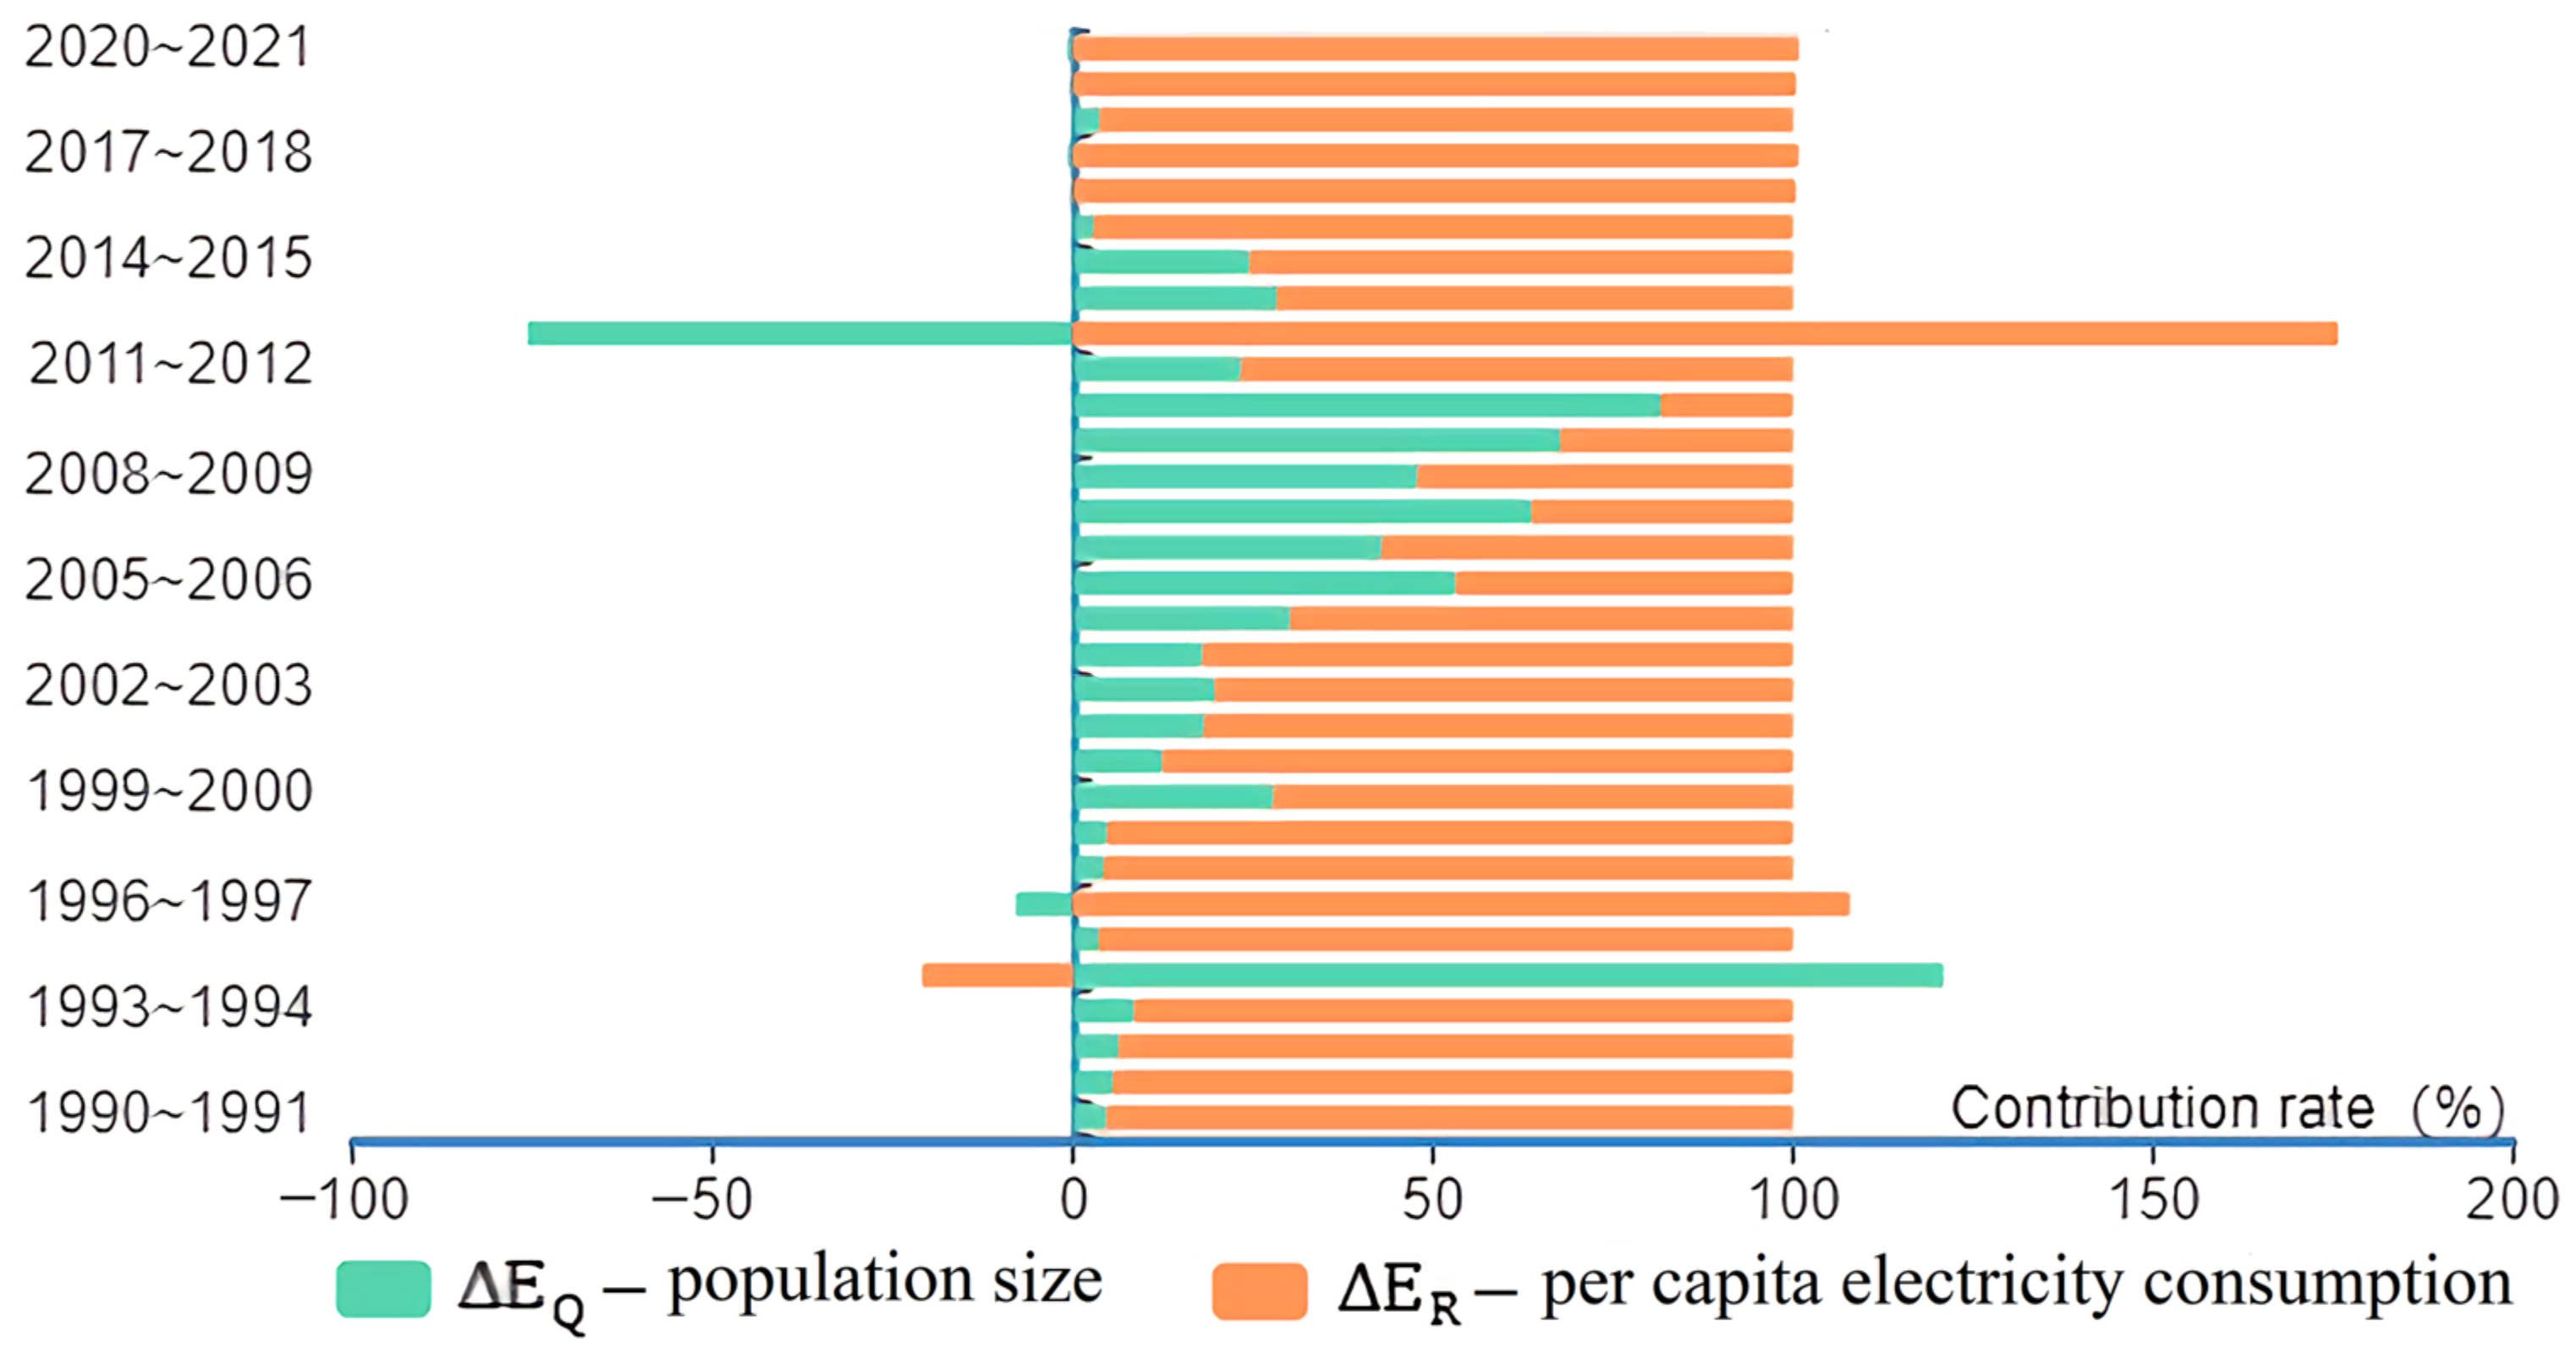
4.2.2. Analysis of the Effect of Each Influencing Factor of Residential Electricity Consumption

It can be seen from Figure 9 that the contribution rate of the population size to the residential electricity demand increases first and then decreases, and it tends to be zero after 2015. The contribution rate of population size to the growth of residential electricity consumption from 1990 to 2021 is 31.87%. Due to the limitation of Beijing’s carrying capacity, the implementation of policies such as “to relieve Beijing of functions non-essential to its role as China’s capital” and “population size control” has led to a decline in the total population, which is also the main reason for the decline in the contribution of population size factors after 2010.
Per capita electricity consumption is the most important factor affecting the increase in residential electricity consumption, and the annual contribution rate is positive. Overall, residential electricity consumption increased by 18.59 billion kW.h from 1990 to 2021, of which the contribution rate of per capita electricity consumption reached 68.13%. With the rapid economic development of Beijing, the use of intelligent electrical appliances has significantly improved the quality of life of residents, which is reflected in the increase in the contribution value of residential electricity consumption.

5. Discussion and Conclusions

5.1. Limitations and Future Studies

This paper still has some limitations, which makes future study possible. First, in this study, the factors affecting the total power demand of Beijing are divided into five factors: economic growth, industrial structure, electric energy intensity, population size and per capita electricity consumption. However, these factors are relatively common in the study of power demand impact factors and have not been expanded in combination with the specific situation of Beijing city. In future research, we can consider the special geographical location of Beijing city and introduce foreign trade, per capita living area, population density and other factors to make the research more practical. Second, this paper only studies the power of Beijing city. Future research can analyze the impact of policies in different provinces on power demand by comparing Beijing city with other provinces to make the research results more convincing.

5.2. Conclusions

Based on the above analysis, it can be seen that economic growth, electric energy intensity, industrial structure, population size and per capita power consumption all have an impact on the power demand in Beijing. Some factors have always maintained a positive role in promoting the growth of power demand, while other factors have promoted and inhibited the growth of power demand in different years. In this paper, the LMDI method is used to decompose the power demand data of Beijing from 1990 to 2021, and the results show that the LMDI method has achieved good results in analyzing the factors affecting power demand and quantifying their contribution values.
Therefore, this paper uses the LMDI factor decomposition method to decompose and analyze the influencing factors of Beijing’s electricity demand growth from 1990 to 2021 from the two levels of industry, electricity consumption and residents and draws the following conclusions combined with the factor decomposition results:
  • From 1990 to 2021, the contribution rate of economic growth to the change in power demand in the three industries was 234.26%, which is the primary factor and main driving force promoting the growth of power demand in the three industries. On the one hand, it shows that economic growth plays an important role in the growth of power demand; on the other hand, it also fully reflects that the essential role of electricity in Beijing’s economic development is becoming more and more significant. Therefore, vigorously promoting the use of electricity can not only meet the needs of economic development but also promote economic development. Considering the need of energy saving and emission reduction, the power worth developing should be clean power energy such as hydropower and nuclear power.
  • From 1990 to 2021, the contribution rate of electric energy intensity to the change in power demand in the three industries is −109.01%, which is the main factor restraining the growth of power demand in the three industries, and the potential of electricity saving is obvious. The research of this paper shows that since 1990, the changes in electric energy intensity in various industries have shown different degrees of energy-saving effects, which fully confirms that the fundamental way to save electricity is to vigorously improve the efficiency of electricity utilization and reduce the electricity consumption per unit of output value. Relatively speaking, the secondary industry has the highest electric energy intensity and accounts for the highest proportion of electricity consumption. Therefore, reducing the electric energy intensity of industry and exploring the energy-saving potential of industry should be the focus of reducing electricity consumption and improving electricity energy efficiency in Beijing in the future.
  • From 1990 to 2021, the contribution rate of industrial structure to the change in power demand in the three industries was −25.25%, which indicates that the change in industrial structure (the proportion of the primary and secondary industries decreases, and the proportion of the tertiary industry increases) is generally in the direction of inhibiting the growth of power demand, but the impact is small. Since 1990, the proportion of the output value of the tertiary industry has gradually increased. The adjustment of industrial structure has restrained the increase in industrial power demand in Beijing, which is mainly caused by the structural change in the secondary industry. Considering that the electric energy intensity of the secondary industry is much higher than that of the primary and tertiary industries, the overall energy-saving effect will be more significant by properly controlling the development of industries with high electricity consumption or vigorously promoting the development of other industries, especially the tertiary industry.
  • From 1990 to 2021, the contribution value of the population size to the change in residential electricity consumption was 5.848 billion kW.h, and the contribution rate was 31.87%. After the rapid growth of the permanent population from 2006 to 2010, the growth rate of the permanent population in Beijing slowed down year by year in recent years, and limited by the carrying capacity of the social environment, the future population growth will be more strictly controlled, but the trend of continuous increase will not change.
  • From 1990 to 2021, the contribution rate of per capita electricity consumption to the change in residential electricity consumption is 68.13%, which is the key factor affecting the growth of residential power demand in Beijing. Both the population size and per capita electricity consumption play an obvious role in promoting the growth of power demand. With the improvement of residents’ living standards and the urbanization process, the impact of per capita electricity consumption on residential electricity consumption will continue to increase in the future. At the same time, Beijing’s per capita electricity consumption is currently at a high level in China (second only to Shanghai), but with the development of science and technology and social progress, compared with developed countries, the per capita electricity consumption level still has a larger room for growth. Therefore, the proportion of residential electricity consumption in Beijing will be further increased in the future.

Author Contributions

Conceptualization, D.S.; methodology, B.T.; software, A.Z. and Y.H.; writing—original draft preparation, B.T.; writing—review and editing, D.S., B.T. and A.Z.; supervision, A.Z. and Y.H. All authors have read and agreed to the published version of the manuscript.

Funding

This research was funded by the National Key R&D Program of China (No. 2018YFB2100601) and the Fundamental Research Funds for the Ministry of Natural Resources (No. Q2136).

Institutional Review Board Statement

Not applicable.

Informed Consent Statement

Informed consent was obtained from all subjects involved in the study.

Data Availability Statement

Data are available on request.

Conflicts of Interest

The authors declare no conflict of interest.

References

  1. Wang, Q.; Liu, S.; Lin, J.; Cheng, H.; Gu, J. Dcomposition analysis and load forecasting in East China considering energy saving and emission reduction policy. Water Resour. Power 2010, 28, 164–166. [Google Scholar]
  2. Perez-García, J.; Moral-Carcedo, J. Analysis and long term forecasting of electricity demand through a decomposition model: A case study for Spain. Energy 2016, 97, 127–143. [Google Scholar] [CrossRef]
  3. Zhengge, T. Strategic measures to reduce China carbon emissions based on index decomposition-analysis of carbon emission in eight industries. Soc. Sci. China 2014, 35, 158–173. [Google Scholar] [CrossRef]
  4. Rao, R.; Shen, S.; Tan, Z. Beijing’s power consumption analysis based on factor decomposition model. North China Electr. Power 2012, 392, 1–4. [Google Scholar]
  5. Yan, F.; Li, X.; Tan, Z. Research on the main factors for changes in electric energy intensity based on factor decomposition model. Power Demand Side Manag. 2010, 12, 15–18. [Google Scholar]
  6. Zhang, W.; Zhou, Y.; Tan, Z. An empirical analysis of the increment of CO2 emission from energy consumption in Beijing: Based on LMDI technique of IDA method. Prog. Geogr. 2013, 32, 514–521. [Google Scholar]
  7. Ang, B.W. The LMDI approach to decomposition analysis: A practical guide. Energy Policy 2005, 33, 867–871. [Google Scholar] [CrossRef]
  8. Wang, W.; Mu, H.; Kang, X.; Song, R.; Ning, Y. Changes in Industrial Electricity Consumption in China from 1998 to 2007. Energy Policy 2010, 38, 3684–3690. [Google Scholar] [CrossRef]
  9. Sun, N.; Xu, J. Decomposed analysis of affecting factors about electric power consumption of three main industries in China. Resour. Environ. Yangtze Basin 2011, 20, 918–921. [Google Scholar]
  10. Xu, L.; Tang, L. LMDI-Based analysis on electricity demand growth rate of industrial sectors in China. Power Syst. Technol. 2012, 36, 236–241. [Google Scholar]
  11. Zhang, F.Q.; Ang, B.W. Methodological issues in cross-country/region decomposition of energy and environment indicators. Energy Econ. 2001, 23, 179–190. [Google Scholar] [CrossRef]
  12. Ang, B.W. Decomposition analysis for policy making in energy: Which is the preferred method. Energy Policy 2004, 32, 1131–1139. [Google Scholar] [CrossRef]
  13. Ang, B.W.; Liu, F.L. A new energy decomposition method: Perfect in decomposition and consistent in aggregation. Energy 2001, 26, 537–548. [Google Scholar] [CrossRef]
  14. Ma, J.; Shen, S. Factor decomposition and demonstration of Chinese power consumption growth. Stat. Decis. 2007, 240, 77–79. [Google Scholar]
  15. Zhang, C.; Su, B.; Zhou, K.; Yang, S. Analysis of electricity consumption in China (1990–2016) using index decomposition and decoupling approach. J. Clean. Prod. 2019, 209, 224–235. [Google Scholar] [CrossRef]
  16. Beijing Municipal Bureau of Statistics. Beijing Statistical Yearbook; China Statistics Press: Beijing, China, 2021. [Google Scholar]
  17. Cui, G.; Yu, Y.; Zhou, L.; Zhang, H. Driving forces for carbon emissions changes in Beijing and the role of green power. Sci. Total Environ. 2020, 728, 138688. [Google Scholar] [CrossRef] [PubMed]
  18. Ang, B.W.; Zhang, F.Q.; Choi, K.H. Factorizing changes in energy and environment indicators through decomposition. Energy 1998, 23, 489–495. [Google Scholar] [CrossRef]
  19. Kaya, Y. Impact of Carbon Dioxide Emission on GNP Growth: Interpretation of Proposed Scenarios. Presentation to the Energy and Industry Subgroup; Response Strategies Working Group, IPCC: Paris, France, 1989. [Google Scholar]
Figure 1. Load power demands of primary, secondary and tertiary industries as well as the residents in Beijing city.
Sustainability 15 07913 g001
Figure 2. Location of Beijing city in China.
Sustainability 15 07913 g002
Figure 3. Trends in power demand and GDP growth in three industries in Beijing city.
Sustainability 15 07913 g003
Figure 4. Trends in industrial structure and power demand in three industries in Beijing city.
Sustainability 15 07913 g004
Figure 5. Trends in electric energy intensity of three industries and electric energy intensity per unit GDP in Beijing city.
Sustainability 15 07913 g005
Figure 6. Residential electricity consumption and population size in Beijing city.
Sustainability 15 07913 g006
Figure 7. Residential electricity consumption and the per capita electricity consumption level of Beijing city.
Sustainability 15 07913 g007
Figure 8. The contribution rate of each factor change to the growth of power demand in the three industries.
Sustainability 15 07913 g008
Figure 9. The contribution rate of each factor change to the growth of residential electricity consumption.
Sustainability 15 07913 g009
Table 1. Year-by-year decomposition results of power demand change in Beijing city (contribution value).
PeriodTotal Electricity ConsumptionIndustrial Electricity ConsumptionResidential Electric Consumption
E I E S E G I E Q E R P
1990~199110.92−5.25−11.4326.019.330.081.511.59
1991~199214.48−0.64−13.0826.6512.930.091.461.55
1992~199316.58−3.17−20.4838.3514.700.121.761.88
1993~199412.99−4.28−32.0247.2110.910.181.902.08
1994~199517.07−6.31−32.4654.3215.551.84−0.321.52
1995~199621.76−8.76−12.0238.8918.110.133.523.65
1996~199719.31−7.75−12.6234.9714.60−0.375.084.71
1997~199812.53−8.32−16.2334.149.590.132.812.94
1998~199921.11−6.16−10.4131.4214.860.305.956.25
1999~200087.15−7.3531.3251.1975.163.368.6311.99
2000~200115.73−12.37−34.1555.979.450.795.496.28
2001~200239.79−12.67−13.5557.3531.121.587.098.67
2002~200327.751.24−39.9058.7220.061.536.167.69
2003~200445.843.75−39.3271.1735.601.858.3910.24
2004~200557.41−13.251.0761.2249.042.535.848.37
2005~200641.01−18.06−27.4179.5434.073.703.246.94
2006~200755.48−15.93−56.41117.0244.684.636.1710.80
2007~200822.07−18.20−40.1670.8012.446.153.489.63
2008~200949.53−2.25−12.8552.1337.046.006.4912.49
2009~201071.402.96−37.0394.9460.867.153.3910.54
2010~201111.95−10.15−76.7193.406.554.410.995.40
2011~201252.56−4.98−30.0570.4935.464.0113.0917.10
2012~201338.87−6.70−26.8377.2043.673.63−8.43−4.80
2013~201423.51−6.01−44.6861.9811.283.478.7612.23
2014~201514.90−21.57−29.1060.079.401.364.145.50
2015~201669.01−10.64−11.1069.9948.340.6020.0720.67
2016~201746.03−6.72−52.4283.6824.54−0.0921.5921.49
2017~201875.83−5.84−46.6588.8936.40−0.3039.7239.43
2018~201922.16−8.48−26.0661.4626.92−0.19−4.57−4.76
2019~2020−25.14−0.73−65.0012.38−53.34−0.1328.3328.20
2020~202191.6021.47−39.07102.6185.01−0.056.656.59
1990–20211081.15−203.11−876.721884.13804.3058.48218.37276.85
Note: E S —Electric energy intensity; E I —Industrial structure; E G —Economic growth; E R —Per capita electricity consumption; E Q —Population size; I —Change in total industrial electricity consumption; P —Change in total residential electricity consumption. Unit: 108 KW.h.
Disclaimer/Publisher’s Note: The statements, opinions and data contained in all publications are solely those of the individual author(s) and contributor(s) and not of MDPI and/or the editor(s). MDPI and/or the editor(s) disclaim responsibility for any injury to people or property resulting from any ideas, methods, instructions or products referred to in the content.

