Article

Strategies for Sustainable Urban Renewal: Community-Scale GIS-Based Analysis for Densification Decision Making

1
Department of Urban Planning and Design, Xi’an Jiaotong-Liverpool University, Suzhou 215123, China
2
School of Environmental Sciences, University of Liverpool, Liverpool L69 3BX, UK
3
School of Art, Design and Architecture, University of Plymouth, Plymouth PL4 8AA, UK
4
School of Architecture and Urban Planning, Suzhou University of Science and Technology, Suzhou 215009, China
*
Author to whom correspondence should be addressed.
Sustainability 2023, 15(10), 7901; https://doi.org/10.3390/su15107901
Submission received: 6 April 2023 / Revised: 8 May 2023 / Accepted: 9 May 2023 / Published: 11 May 2023
(This article belongs to the Topic Sustainability in Heritage and Urban Planning)

Abstract

:
China is gradually shifting towards more sustainable urban development, and the local governments are increasingly promoting social and environmentally sustainable spatial planning practices. This article debates the potential contradiction between the goal of a constantly growing urban population and the limits to the consumption of land planned by this new direction of urban development. The analysis focuses on the wealthy city of Suzhou in the Yangtse River Delta region and explores the opportunities for densification of the residential areas as a possible solution for this contradiction, as already tested by some Chinese cases for land use efficiency. The research applies GIS-based spatial analysis and identifies some of the sites that can be efficiently redeveloped in the resettlement communities for their low floor area ratio (FAR) and obsolescent conditions, which do not correspond to the increasingly middle-class status of the residents in the urban region. The article investigates the different options of a densification strategy in the frame of the policies of urban renewal promoted in China in recent years for improving the quality of the built environment.

1. Background

1.1. The New Urbanization “Beyond Mere Growth” in China

Since 2014, the Chinese central government has promoted new-type urbanization in the National New-type Urbanization Plan (2014–2020) [1,2,3]. The direction of the plan “beyond mere growth” supports green and low-carbon development and requires avoiding urban sprawl, low efficiency in land use, the proliferation of useless urban districts, and waste of urban space in over-dimensioned infrastructures [4,5]. Consistent with the goals of new-type urbanization, the national guidelines on urban planning released in 2016 prohibit expanding cities beyond what their natural resources can support, enforcing urban growth boundaries [6]. In other words, to be sustainable urban development should not expand beyond a planned threshold, as also required by the environmental protection laws issued since 2015. This limit to expansion is also known as the “red line of China’s cultivated land”, and was first drafted by the National Land Planning Outline issued by the Ministry of Land and Natural Resources in 2009, which also specifies that the impermeabilization of the ground should be diminished [7].
These policies for preserving agricultural land are combined with the regulations for controlling land supply and the real estate market. Since 2003, the central government established year-by-year construction land development quotas for every local government according to the assessment of the local demand–supply situation [8,9,10].
Together with the sustainability goals, the increase in the urbanization rate is a key national priority in China. It has been one of the most significant drivers of economic, political, and social progress since the reform was promoted at the end of the 1970s [11,12,13,14]. So far, urban population growth has followed economic growth because economic development and city growth are strongly related to Chinese policies. The massive urbanization process has transformed millions of farmers into city dwellers, attracting an essential workforce into the expanding city [15,16].
These recent policies promoted by the Chinese government—on one side the goal of a growing economy and on the other side the limits to urbanization to protect fertile land and natural environments—can produce a contradiction and urban concentration: probable newcomers in growing cities and industrial districts versus a not expanding city.

1.2. The Solution of High Density for Growing Cities and Sustainability

Multiple actions should be considered for promoting urban sustainability, such as limits to new urbanizations and conservation of agricultural land, investments in public transportation [17], limits to car-oriented projects [18], reduction in energy consumption and greenhouse gases emission in all sectors of production, water management [19], and improving water, soil, and air quality [20]. Of the multiple elements that impact the sustainability of urban development, this paper focuses on the quantitative parameter of population density on urbanized land, more specifically on the opportunity to increase the dwelling units in existing residential neighborhoods. The research presented in this paper applies urban-scale GIS analysis to make some hypotheses on densification at the community scale.
Density is neither a good nor a bad indicator: too much can result in overcrowding and eventual urban decay; too little can deprive the dwelling environment of the chance of social interaction and public transport efficiency [21]. The definition of density is, nevertheless, closely connected to sustainability because land is a limited resource; urbanization is “sustainable” when valuable agricultural land is saved, and the ecosystem is not jeopardized.
High density has both positive and negative effects. Many scholars have presented evidence that higher density in urban areas is associated with a variety of desirable outcomes, including increased use of public transportation, improved financial stability for local governments, walkable and healthy living environments, housing diversity and affordability, enhanced community character, and cultural vitality [9,10,11,12,13,22,23,24,25,26,27,28]. Other scholars, on the contrary, have noted how some high-density neighborhoods produce excessive concentration and congestion, difficult management, and inefficient facilities. The issue cannot be assessed in general terms because the output of high-density conditions depends on several context-related factors, such as urban planning strategies, technical capacity, building regulations, infrastructure, public utilities, regional services, and the economic conditions of the residents [29]. For example, the interplay between density and building types must be considered because the same FAR realized by different architectural forms and open spaces produces different urban environments. In China, the different ranges of FAR—usually classified as low, medium, and high in building regulations and master plans—often correspond to specific building types; for example, medium density is realized with multilayer condos [30,31,32,33].
Over the last two decades, the idea of urban densification has been explored worldwide in several large cities and also in medium or high-density cases [34,35,36,37,38]. These densification projects are promoted mainly for the following reasons:
  • The high value of the land combined with the increased demand for housing is a potential profit for the developer if what exists is demolished and rebuilt at a higher density.
  • The available buildable land is either scarce due to geographical conditions or limited by the local regulations for protecting agricultural land.
Both reasons justify the actions of densification promoted in dense cities, such as Paris [39,40], Seoul [41,42,43], Rotterdam [44,45,46], or London [47,48,49]; policies and projects differ among cities because they adapt to local conditions, including the socio-cultural approach to dwelling.
Regarding China's concerns, often urban land expands faster than population growth. In recent years, this trend has impacted several Chinese cities, which have experienced declining densities, very likely due to the rising average income leading to the demand for more residential space per capita, and for the restrictions due to the hukou system (a household registration which prevents the change of residence in order to limit the number of permanent residents in cities) [50,51]. According to the World Bank, even though China underwent massive urban population growth, its urban population density in 2010 was lower than the average of the rest of the East Asia region [52].

1.3. The Case Study: Suzhou’s Shift in City Planning and Manufacturing

Suzhou is a prefecture-level city in the Yangtze River Delta region and has greatly developed since the reform and the establishment of the Suzhou Wuzhong Economic Development Zone in 1993 [53]. In fact, in 1990, its gross domestic product (GDP) was RMB 20.214 billion (USD 4.23 billion), and in 2019 it skyrocketed to RMB 1.92 trillion (USD 290 billion) with a registered foreign capital of RMB 646 billion (USD 99.9 billion) and per capita GDP of USD 25,900, ranking third in China. In 1990, the population of permanent residents in the metro area was 1,067,000; in 2019, it was 7,070,000 [54].
Suzhou is a production hub in the Yangtze River Delta area and China’s third-largest manufacturing city [53]. In the future, it will keep attracting new inhabitants if it remains competitive. With this goal, the local government is promoting the re-branding of its manufacturing, a shift to creative and innovative productions according to the policy of the central government [8]. To realize this shift, Suzhou needs to attract the ones who can support this digital empowerment: talents and high-level professionals with their families [55]. In fact, according to the report Chinese Cities of Opportunity 2021, by the China Development Research Foundation, Suzhou is in a good position for technical maturity but not for intellectual capital and innovation. The city established some policies to attract talent and train graduates in 2020 [56]. Together with these high-skill jobs, the city will attract lower-income workers such as babysitters, cooks, cleaners, carpenters, and health and well-being workers: every high-skill job produces at least five jobs in other sectors [57,58]. These newcomers must find a long-term accommodation that fits their expectations in the city.
In compliance with the national guidelines for supporting sustainability, the recent Master Plan for Suzhou 2020–2035 promotes the preservation of natural resources and stops massive urbanization. This master plan does not establish the future threshold of population growth; this is because in the past development proved that each planned threshold of the total number of inhabitants was underestimated [59].

1.4. Sustainability Versus Growth: A Potential Contradiction in the Development Goals

In a city becoming wealthier such as Suzhou, if the limits to new urbanization are implemented, a problem in quantities of the housing stock can be foreseen, as well as in the quality of the built environment. Very probably, the middle class in Suzhou will keep increasing in number and spending capacity, and very likely, the low-income people will increase their income and their requirements in choosing the family house [60,61,62].
Suzhou has a significant housing vacancy rate; the data are unavailable, but likely it is around 20%, as in similar cities in China [63,64]. This could be considered for future demand, but in general, the empty stock cannot be considered for renting, mainly because the real estate investment target is quick and consistent value increase, not rental returns, which decreased to less than 3% in 2018 [65,66].
Given these premises, the implication of the policies is that a larger population must occupy a limited urban land, but at the same time, a wealthier society requires higher living standards. Starting from the hypothesis that in Suzhou land must be used efficiently and that housing quality should improve, this research discusses the issue of density. If the GDP per capita of Suzhou and its population keep growing while the city wants to avoid sprawl, Suzhou could consider renewing some already developed areas, increasing density, housing offers, and overall livability.

1.5. The Structure of the Paper

This research explores the possibilities of densification in Suzhou to accommodate a larger quantity of population of different incomes and consume less agricultural land for urbanization. This paper discusses a strategy for sustainable urban renewal with densification; the strategy defines three options of intervention, which answer the main research question: where, how, and why requalification with densification can be applied.
This paper has the following structure. The first part presents the background of the research: the new-type urbanization policy in China, the idea of high density as a solution for sustainability, the growing population in Suzhou and its increasingly middle-class status, and the possible contradiction caused by the limits of land consumption in the Chinese context. The second part of the paper explains the reasons for urban densification in high-density urban areas and introduces some examples. The third part presents the resettlement communities in Suzhou as a relevant case for the densification strategy. The fourth and fifth parts investigate the case study with GIS-based analysis and propose some options for densification, combined with improving the built environment’s quality. The last part proposes some conclusions about the potentialities of densification in a specific context, and the research limits.

2. Growing Population, Land Consumption, and Densification

2.1. Density Parameter

As introduced in paragraph 1.2, the parameter of density is a quantity and results from the combination of housing types and compactness. Usually, the quantities of population density and floor area ratio (FAR) are used to indicate density level. FAR is the parameter adopted in the regulatory plans in China to calculate built-up area density: it expresses the ratio between the total built surface and the dimension of the site where the buildings are [67]. FAR varies among the various urban areas in Suzhou, and the city as a whole cannot be classified as a high-density city if the rankings of some authoritative institutions are considered such as the World Atlas [68], UN-Habitat, Demographia World Urban Areas, the Atlas of Urban Expansion, and the Global City Power Index [29].
Population density expresses the ratio between the quantity of the population and the location [69,70,71]. The population density in the central district of Suzhou and the five adjacent districts (Gusu, Xiangcheng, Suzhou Industrial Park, Wuzhong, Suzhou New District, and Wujiang) was 2315 people/sq km according to the local government in 2021. The ratio between urban population/urban area in the metropolitan area is roughly less than 1/3 of the ratio in Singapore (generally ranked around 10,000 people/sq km), half the density of Shanghai, which is not ranked as one of the densest in the world (Table 1). These quantities allow us to claim that Suzhou is not a high-density city and to call the recent expansions of Suzhou “high-density sprawl” [30,31,32,33].

2.2. Densification in High-Density Cities in China: The Direction already Taken

Actions for densification have already been taken in China: in 2003, the “prohibition of land supply for villas” was issued to stop low-dense developments by the Ministry of Land and Natural Resources. The rule had to be repeated five times because it was not fully implemented. In 2019, the Ministry of Housing and Construction issued an urgent notice requesting the suspension of the approval of projects proposing villas. Subsequently, the limit to the minimum FAR was extended to all low-density typologies such as villas, double-family row houses less than four stories, and townhouses.
The “prohibition of villas” is justified by China’s arable land sharply decreasing [72]. The National Land Planning Outline required in 2006 that by 2020 the amount of cultivated land would be maintained at 1.865 billion mu, a goal implemented by the “red line of cultivated land” and the construction land quotas mentioned in paragraph 1.2. The goal was achieved, and the same amount of 1.8 billion mu is set for the future [73].
Beyond the prohibition of low-density developments and the red line, densification processes are happening: two very relevant cases are Shenzhen and Shanghai.
Shenzhen is running out of land supply for development: only 2.23% of the 195,284 hectares of the city is still available for growth, and real estate prices have skyrocketed. Therefore, Shenzhen is demolishing and densifying some already high-density residential areas. This phenomenon interests mostly the “villages in the city”, where in the 1980s, after opening up, the original 1-story buildings were extruded to several stories and almost to the whole lot, forming in several stages a hyper-compact urban fabric [74,75]. An example of this process is Dachong village (Table 2). The area used to house 931 families in 1400 buildings on 69 ha (13.5 families per ha), but in 2011 the whole village was demolished, the building type changed, and the density increased from 1.1 million sqm to 2.8 million sqm and 7382 residential units (107 units per ha). The transformation also increased the land uses, shifting from residential to mixed-use conditions. These actions of densification can be controversial because they often start gentrification [76,77].
In Shanghai, the FAR of low-rise and high-density houses has generally increased. In recent years densification has happened mostly along the metro lines and central streets, for example, in Hengshan Street, where towers have substituted the original low-rise urban tissue [78].
Moreover, resettlement communities are impacted by densification. High rises fill empty lots, such as the “Vertical courtyards apartments” in Hangzhou by Wang Shu [79] and “The third space” in Tangshan by Li Xing Gang or entire parts are demolished and rebuilt, such as the Tuanjie Village in Kunshan, Jiangsu province. A trend of increasing the FAR of the resettlement communities can also be noted in Suzhou over the years after 1999: the new communities are designed to be slightly denser than the previous ones.

3. Data Acquisition and Research Method

The research focused on the resettlement communities in Suzhou for several qualitative and quantitative reasons:
-
They are spread all over the municipality and occupy already urbanized land;
-
They house a large population, but some of them are low density;
-
They offer different conditions in relation to accessibility;
-
They are becoming obsolete in absolute terms and in relation to the growing income of households.

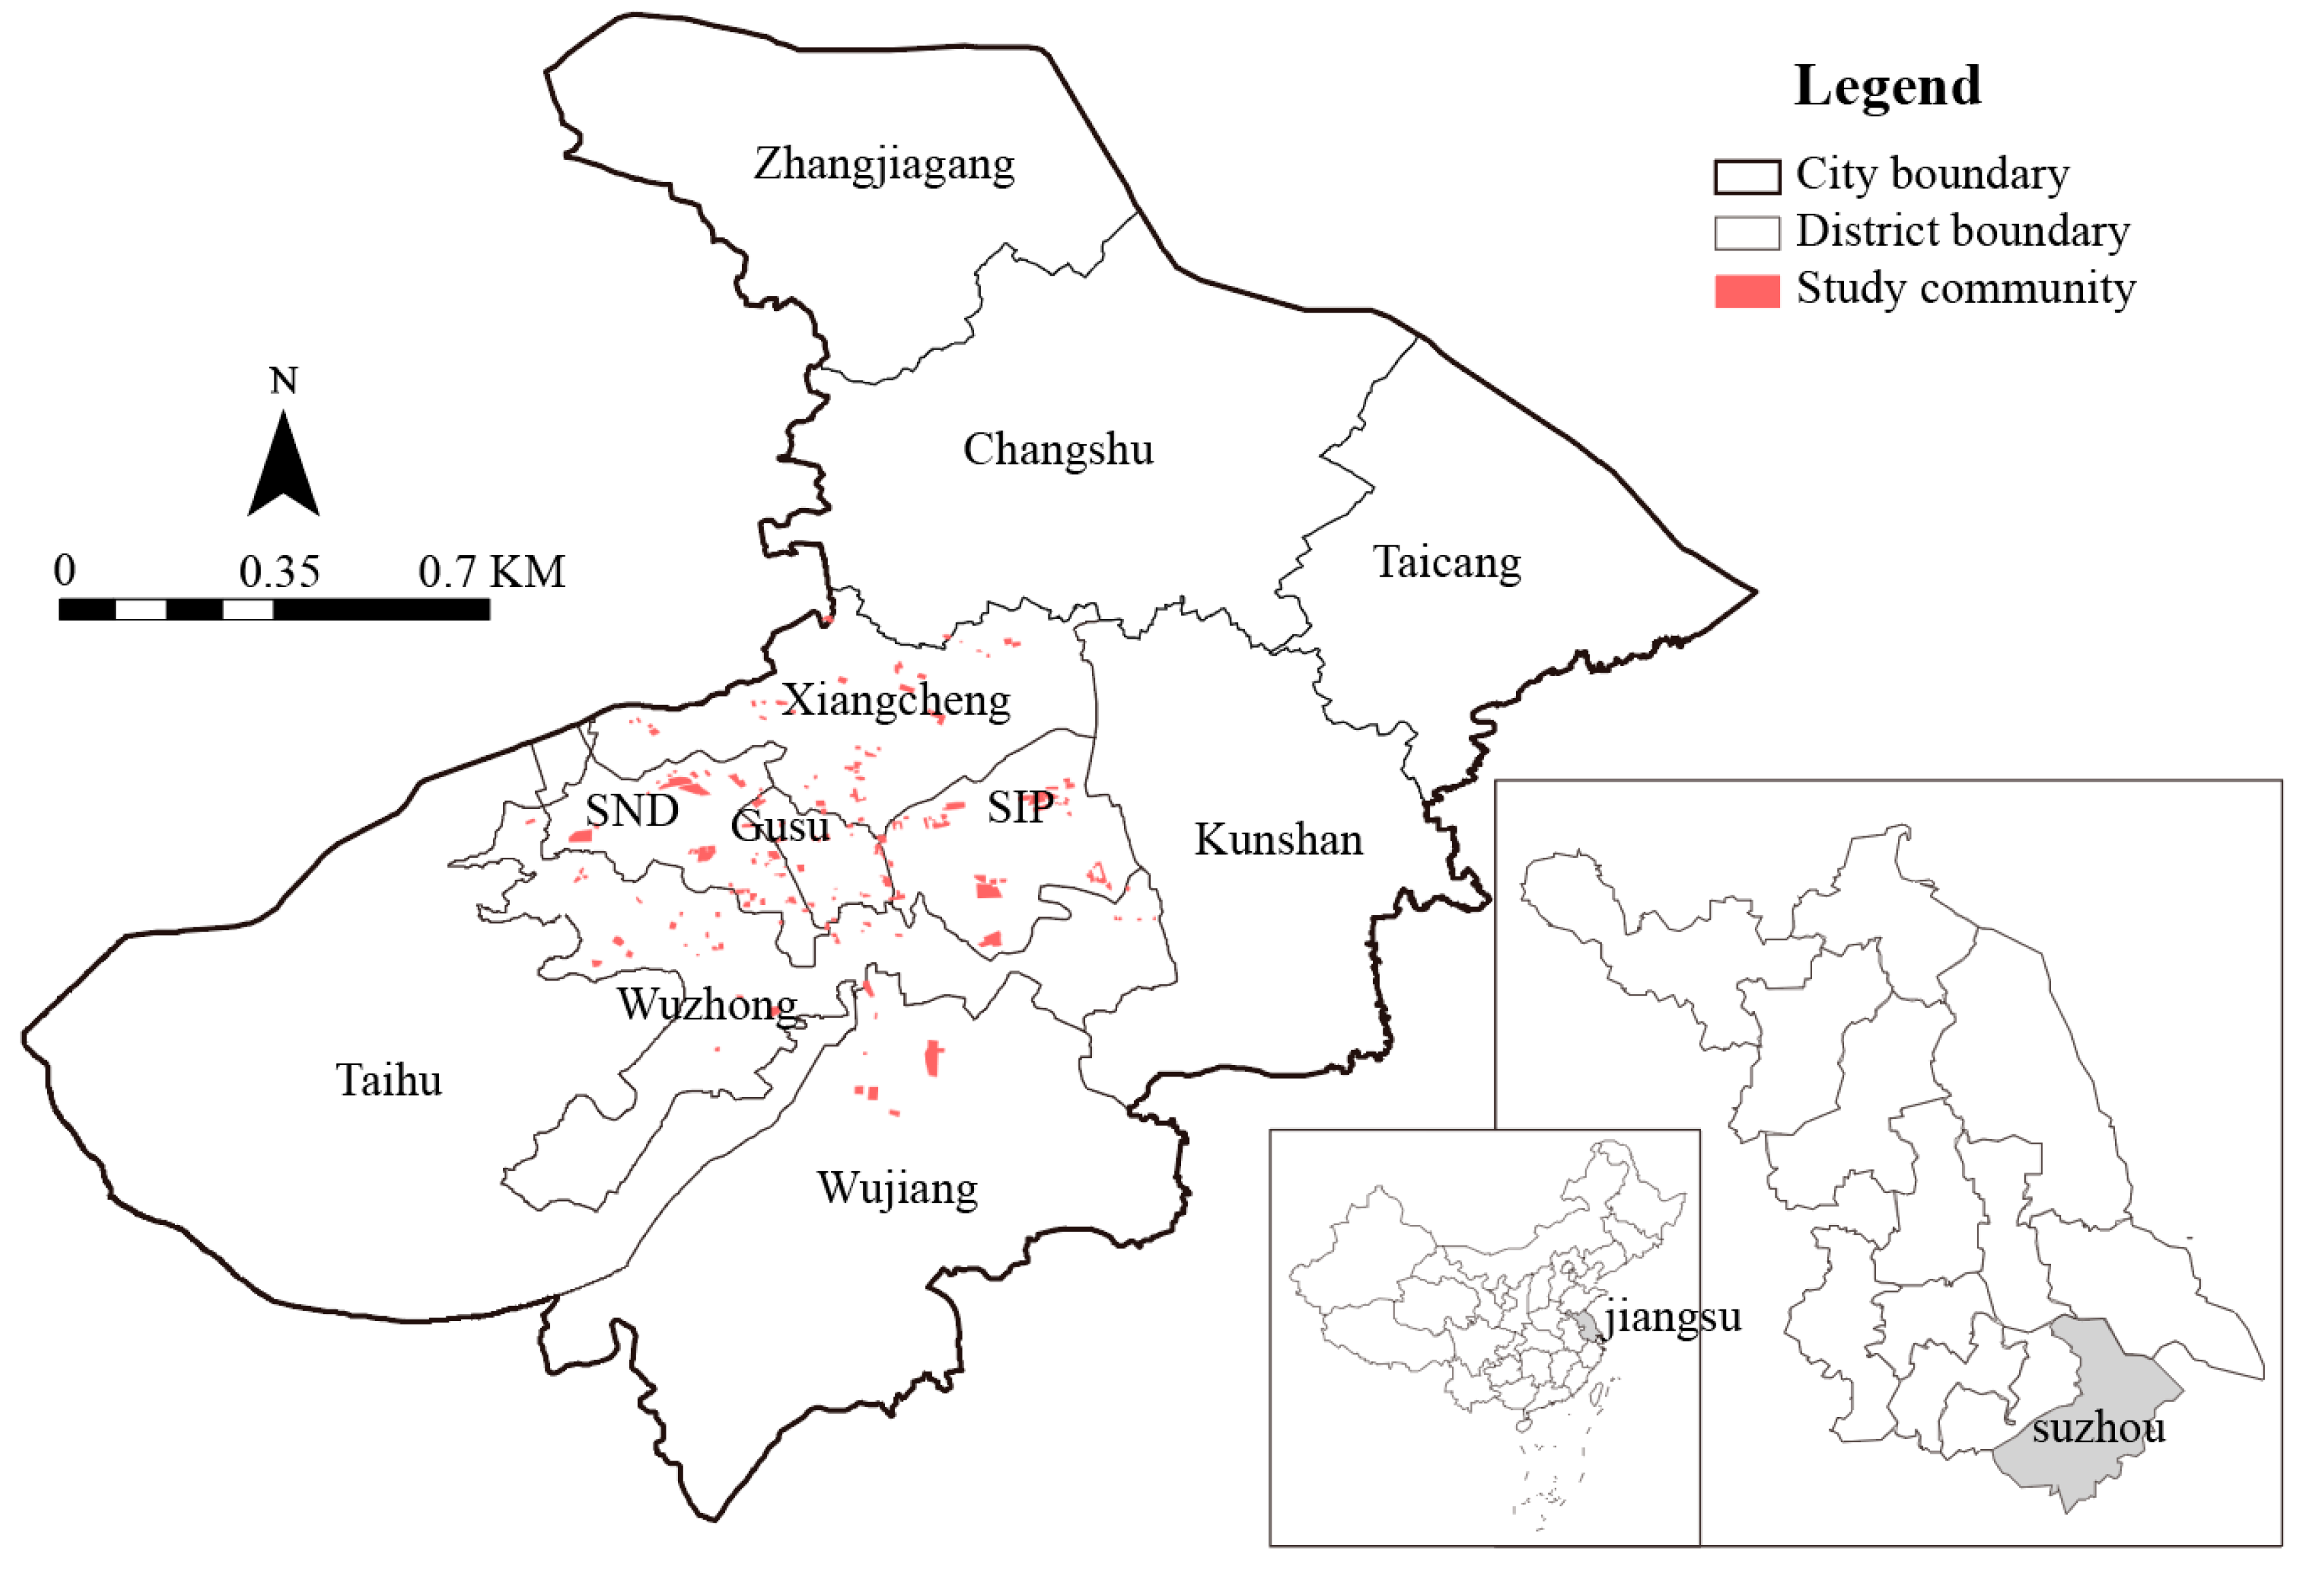
3.1. GIS Spatial Analysis: Location, FAR, Accessibility, and Housing Conditions

Resettlement communities are where the government relocated the farmers who lived in the demolished villages. Suzhou’s urbanization process demolished many rural villages, and the inhabitants resettled in urban communities built cheaply and quickly for this purpose [80,81,82,83,84].
The research has identified 176 resettlement communities in a 50 km diameter area centered in Suzhou old town and involving the central 6 districts of Suzhou (Gusu, Xiangcheng, Suzhou Industrial Park, Wuzhong, Wujiang, and Suzhou New District) (Figure 1). They were built in the late 1980s, occupy more than 2200 ha, and consist of almost 360,000 residential units with approximately 1 million people. Still, their population is floating as these communities include a large percentage of immigrants. The average number of units is around 2000; the largest community has 14,000 units, and the smallest has 112 units.
Official data about the resettlement communities are not available. A general survey of the resettlement communities was conducted with site visits and GIS analysis of the built stock, the green spaces, and the mobility system using satellite images from 3 platforms [85,86]: Google Earth, Baidu maps, and Suzhou map 512, which is the official website of the Suzhou Natural Resources and Planning Bureau. This analysis defined the essential land-use parameters of every community: the area of the occupied land, the building coverage, the green coverage, and the gross floor area (GFA).
The data available online on the webpages of the real estate agencies managing the communities stock allowed us to identify the construction year, the total number of residential units, the minimum and the maximum units’ dimensions, the GFA, and the number of floors of the different buildings (Table 3 and Table 4). According to these data, the FAR was calculated in every community.
The basic spatial data were analyzed with the POI (point of interest) and AOI (area of interest) data. Community basic data refer to the list of resettlement communities, community construction years, average housing prices, number of building floors, and real-life photos obtained from the Anjuke lnc. (a second-hand housing trading website) and the Renting website. POI and AOI data were sourced from the open platform of Goddard, and the POI points in the Suzhou area were crawled from the API interface. There are 20 categories of POI on the map of Goddard, such as catering, shopping, life, sports, leisure, medical care, accommodation, public facilities, etc. Each significant category also has secondary and tertiary subdivisions. AOI refers to POIs with planar and regional characteristics, including but not limited to industrial parks, school campuses, commercial districts, residential communities, scenic spots, train stations, airports, and other types of POIs.
The calculation formula (Table 4) mainly includes three aspects: FAR, community accessibility and housing conditions. The calculation formula for FAR is based on the number of layers and AOI calculations verified by satellite images. Community accessibility is, on the one hand, the road reachability calculated by spatial design network analysis (sDNA), and on the other hand, the calculated public transport allocation level around the community. Road accessibility and public transport were added at the data level, and the final results were presented in five categories using the natural discontinuity method throughout the entire research scope. The housing conditions evaluation includes metrics such as housing price, number of households, and greening rate. The housing price, number of houses, and green rate were added at the data level, and the final results were presented in five categories using the natural discontinuity method throughout the entire research scope. In addition, we also calculated the combination of three indicators: FAR, housing price, and accessibility, and the results were visually overlaid by three indicators, presenting different results based on different colors.

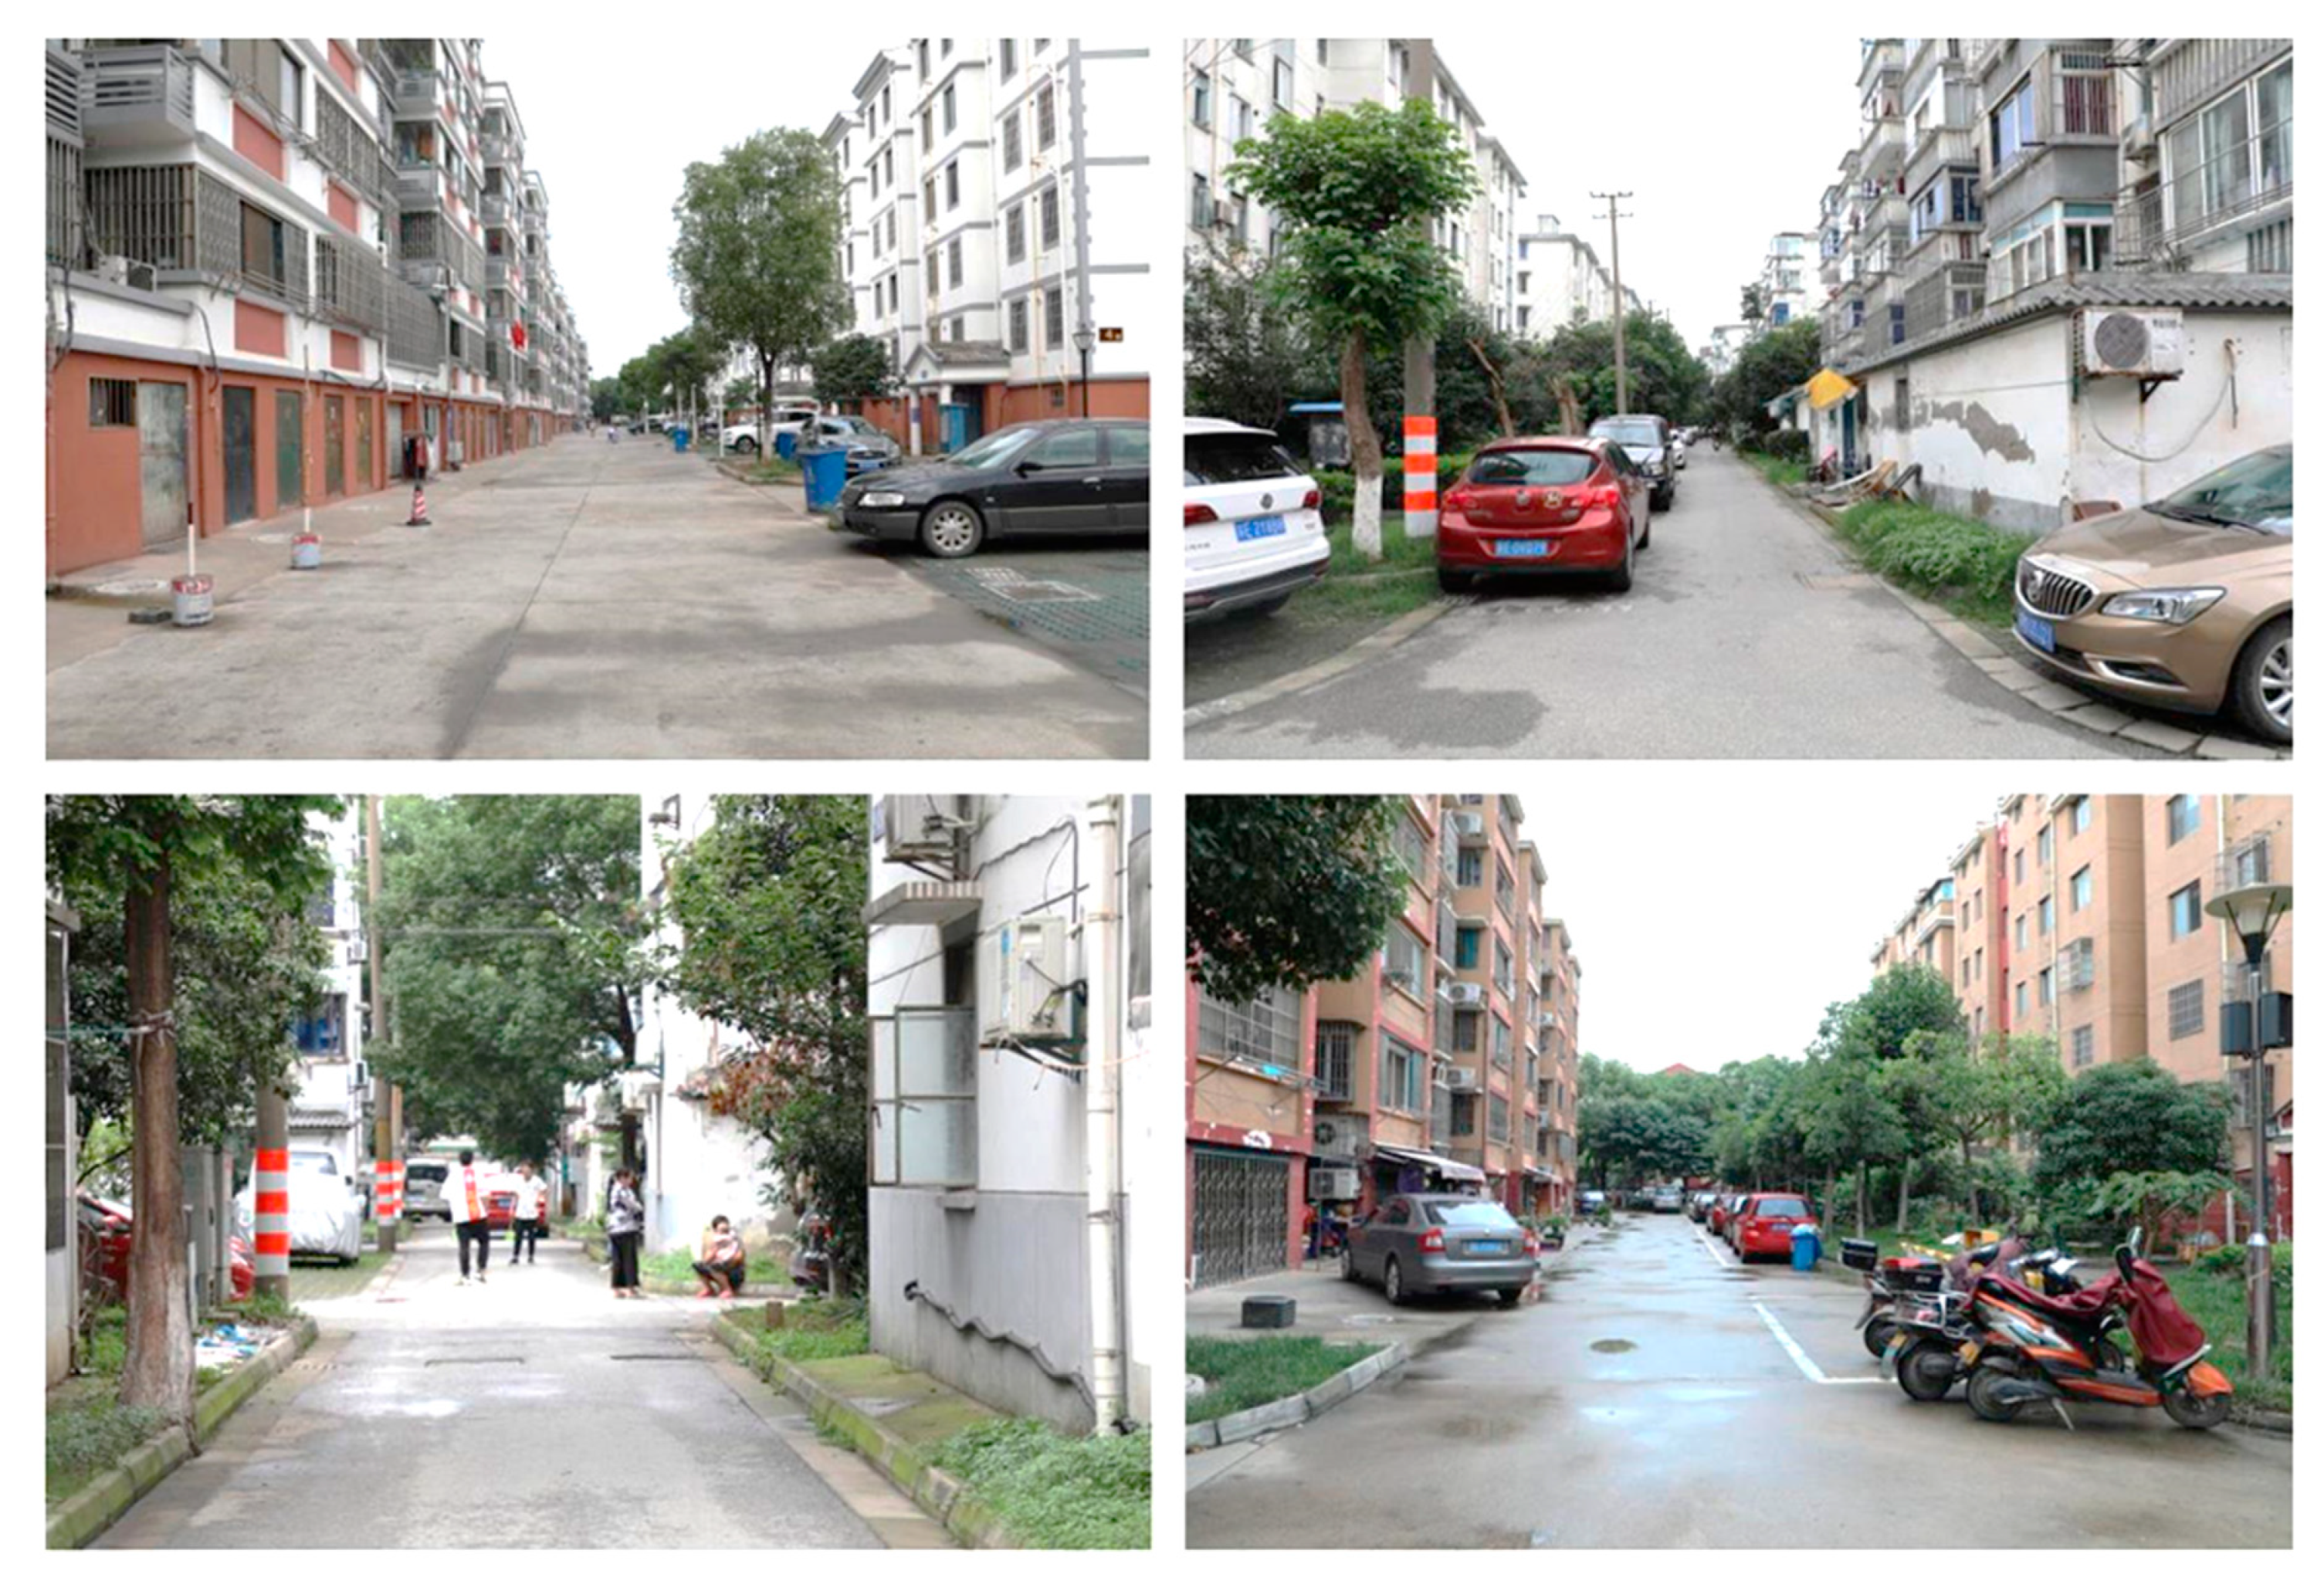
3.2. Empirical Observation and Field Study: The Obsolescence of the Existing Resettlement Communities

A detailed analysis of the spatial features of six communities was carried out, which represents well the characteristic conditions of this kind of settlement in Suzhou (Figure 2). The communities are:
  • Li He Village, started in 1994 in Gusu District;
  • Nanhuan Community, started in 1996 in Gusu District;
  • Dengyun Community, started in 2000 in Xiangcheng District;
  • Lotus Village, started in 2002 in Suzhou Industrial Park;
  • Bibo Community, started in 2001 in Wuzhong District;
  • Mabang Community, started in 2002 in Suzhou New District.
Figure 2. The typical inner courtyards of the resettlement communities.
Sustainability 15 07901 g002
The direct observation of the resettlement communities highlights how some elements and standards are constantly repeated:
  • Standards in building characteristics: housing type (multi-story with central staircase and 2 apartments on every floor), number of floors (4–6), depth of buildings (8–12 m with verandas);
  • Standards in the spatial layout: orientation and alignment (east–west), distances between buildings (the minimum provision is that the sunshine must enter the ground floor for at least 2 h every day according to the regulation), functions (mono-functional: residential with some public facilities for gathering), and dimensions and features of the common open space;
  • Standards in construction quality in compliance with local regulations [87].
The direct observation of the spatial characteristics of the case study was combined with some data on urbanization in Suzhou, such as the rapid growth of the wealthy middle-class population, the rapid adjustment of the economic structure, and the constant attraction of new residents over the years. This allows concluding that resettlement communities can be considered a potentially transformable part of a city for four reasons:
  • Buildings often have problems with poor construction quality and outdated equipment and appliances. When the building is more than 15 years old, which is often the case in Suzhou resettlement communities, sewage, pipelines, heating and cooling systems, waste management, water and electricity, and waterproof and acoustic equipment should be updated. Regarding the quality of building structures, the Unified Standard for Reliability Design of Building Structures (GB50068-2001) in 2001 first proposed the concept of design service life: it defined the design service life of building structures and structural components as 30 years; in recent years, this service life has increased to 50–70 years [88].
  • Residential units and public spaces have problems connected to the low standards of their construction period. This includes a lack of elevators, insufficient parking spaces, units often too small to accommodate a comfortable kitchen with a dishwasher and two bathrooms with washing machines [89]. Therefore, the local government is taking measures to address these issues. For example, in October 2018, the local government launched the “Suggestions on Installing Elevators in Existing Multi-story Residential Buildings in Suzhou” to adapt to economic and social development, improve the functionality of existing housing, and improve living standards [90].
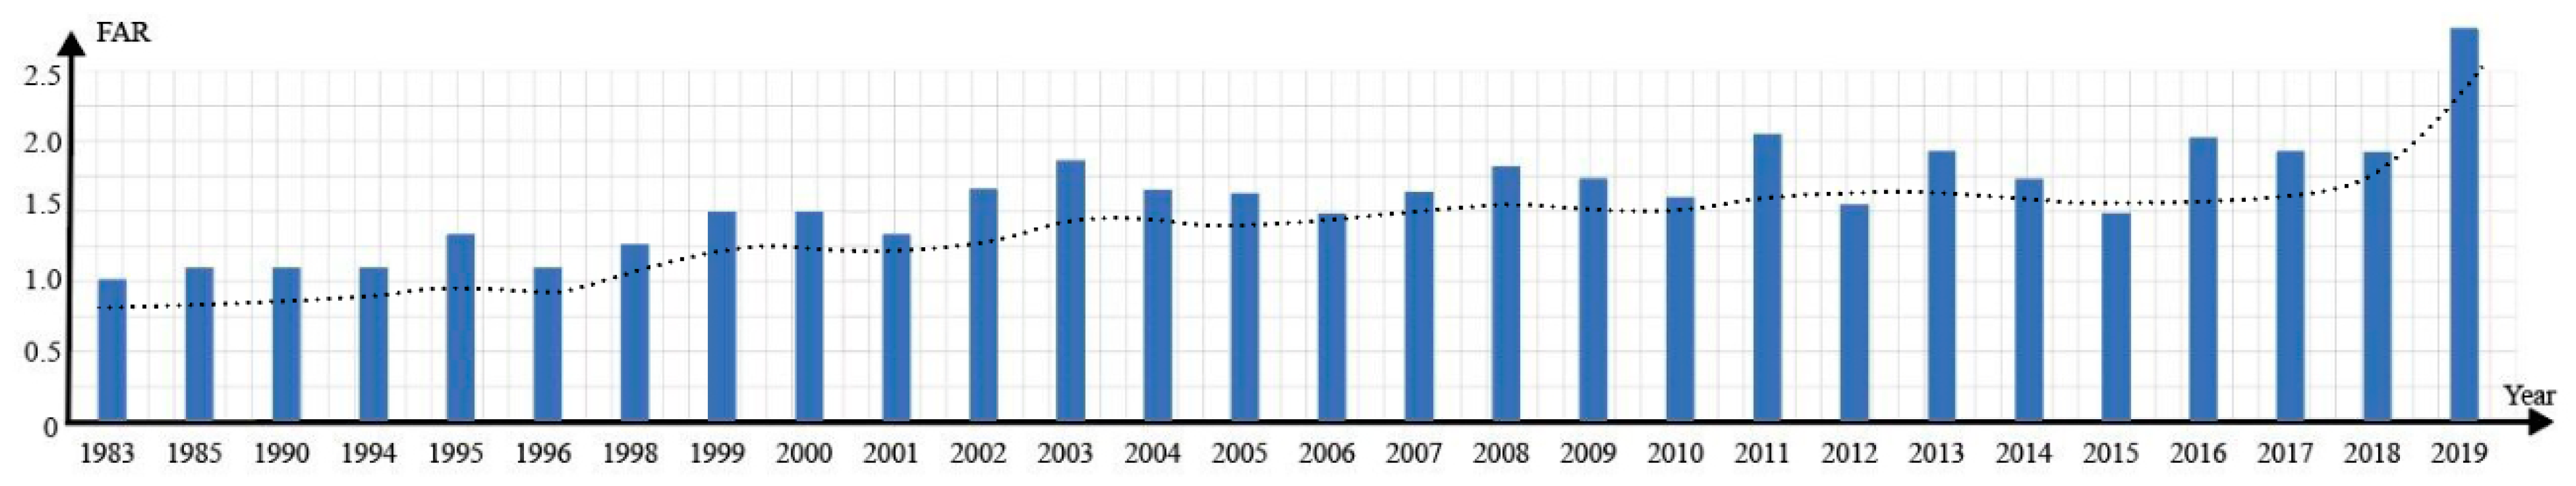
  • The value range of FAR is relatively low, indicating that these communities have a small population density and belong to low-density communities. This situation is not due to the age of construction, but rather to the project conditions and the number of people that need to be accommodated [91].
  • The construction method usually adopted a “copy-paste” method to provide similar living conditions while reducing costs and accelerating speed. However, in the future, with the development of China’s economy and the improvement of people’s living standards, these demolished and rebuilt communities may be considered low-level housing environments. Therefore, there is a need to reassess these communities and explore their sustainable development potential, including investigating possible personalized schemes to provide housing for more and different types of residents and promote community diversity and sustainable development.
One element to take into consideration for the definition of the densification level is the existing regulation. At the national level, when the resettlements started to be designed in large quantities in the special economic zones, the Code of Urban Residential Areas Planning & Design GB50180-93 (updated in 2002, issued by the Ministry of Housing and Urban-Rural Development), article 5.0.6.2 [92], decided that the communities designed as the resettlement communities—the multilayer housing—must not have a FAR higher than 1.8. The most updated version of this code for the same kind of communities issued in 2018 defines a range of 1.6–1.8, but these national limits can be exceeded and should be reassessed at the municipal government level to become context driven.

4. Research Results: The Resettlement Communities as an Opportunity for Renewal

In a fast-changing China, where the middle class is rapidly increasing and consumption is encouraged, and especially in Suzhou, a city that wants to shift to creative and innovative productions and attract talents, the existing obsolescent resettlement communities—initially built for farmers and families with a low income—are not considered housing environments able to provide an up-to-date standard of living in the near future. Considering the obsolescence on one side and the improvement of economic conditions on the other side, the resettlement communities can be considered a part of the city to renew.
This idea of renewal is coherent with the guidelines of the national government established in the 14th Five-Year Plan 2021–2025 for the national economic and social development of the People’s Republic of China. In the Outline of Long-term Goals for 2035, for the first time, China has officially promoted an urban renewal approach to improve the existing built environment next to the usual large-scale incremental development. The plan supports the renewal of the communities built before 2000 and the policy of regeneration that targets the “three-old”—that is, the old village, the old town, the old factory—by “encouraging intensive land use” that started in Guangdong province in 2008 and spread to the whole country [93,94]. Suzhou is included in the demonstration sites for old town renewal.

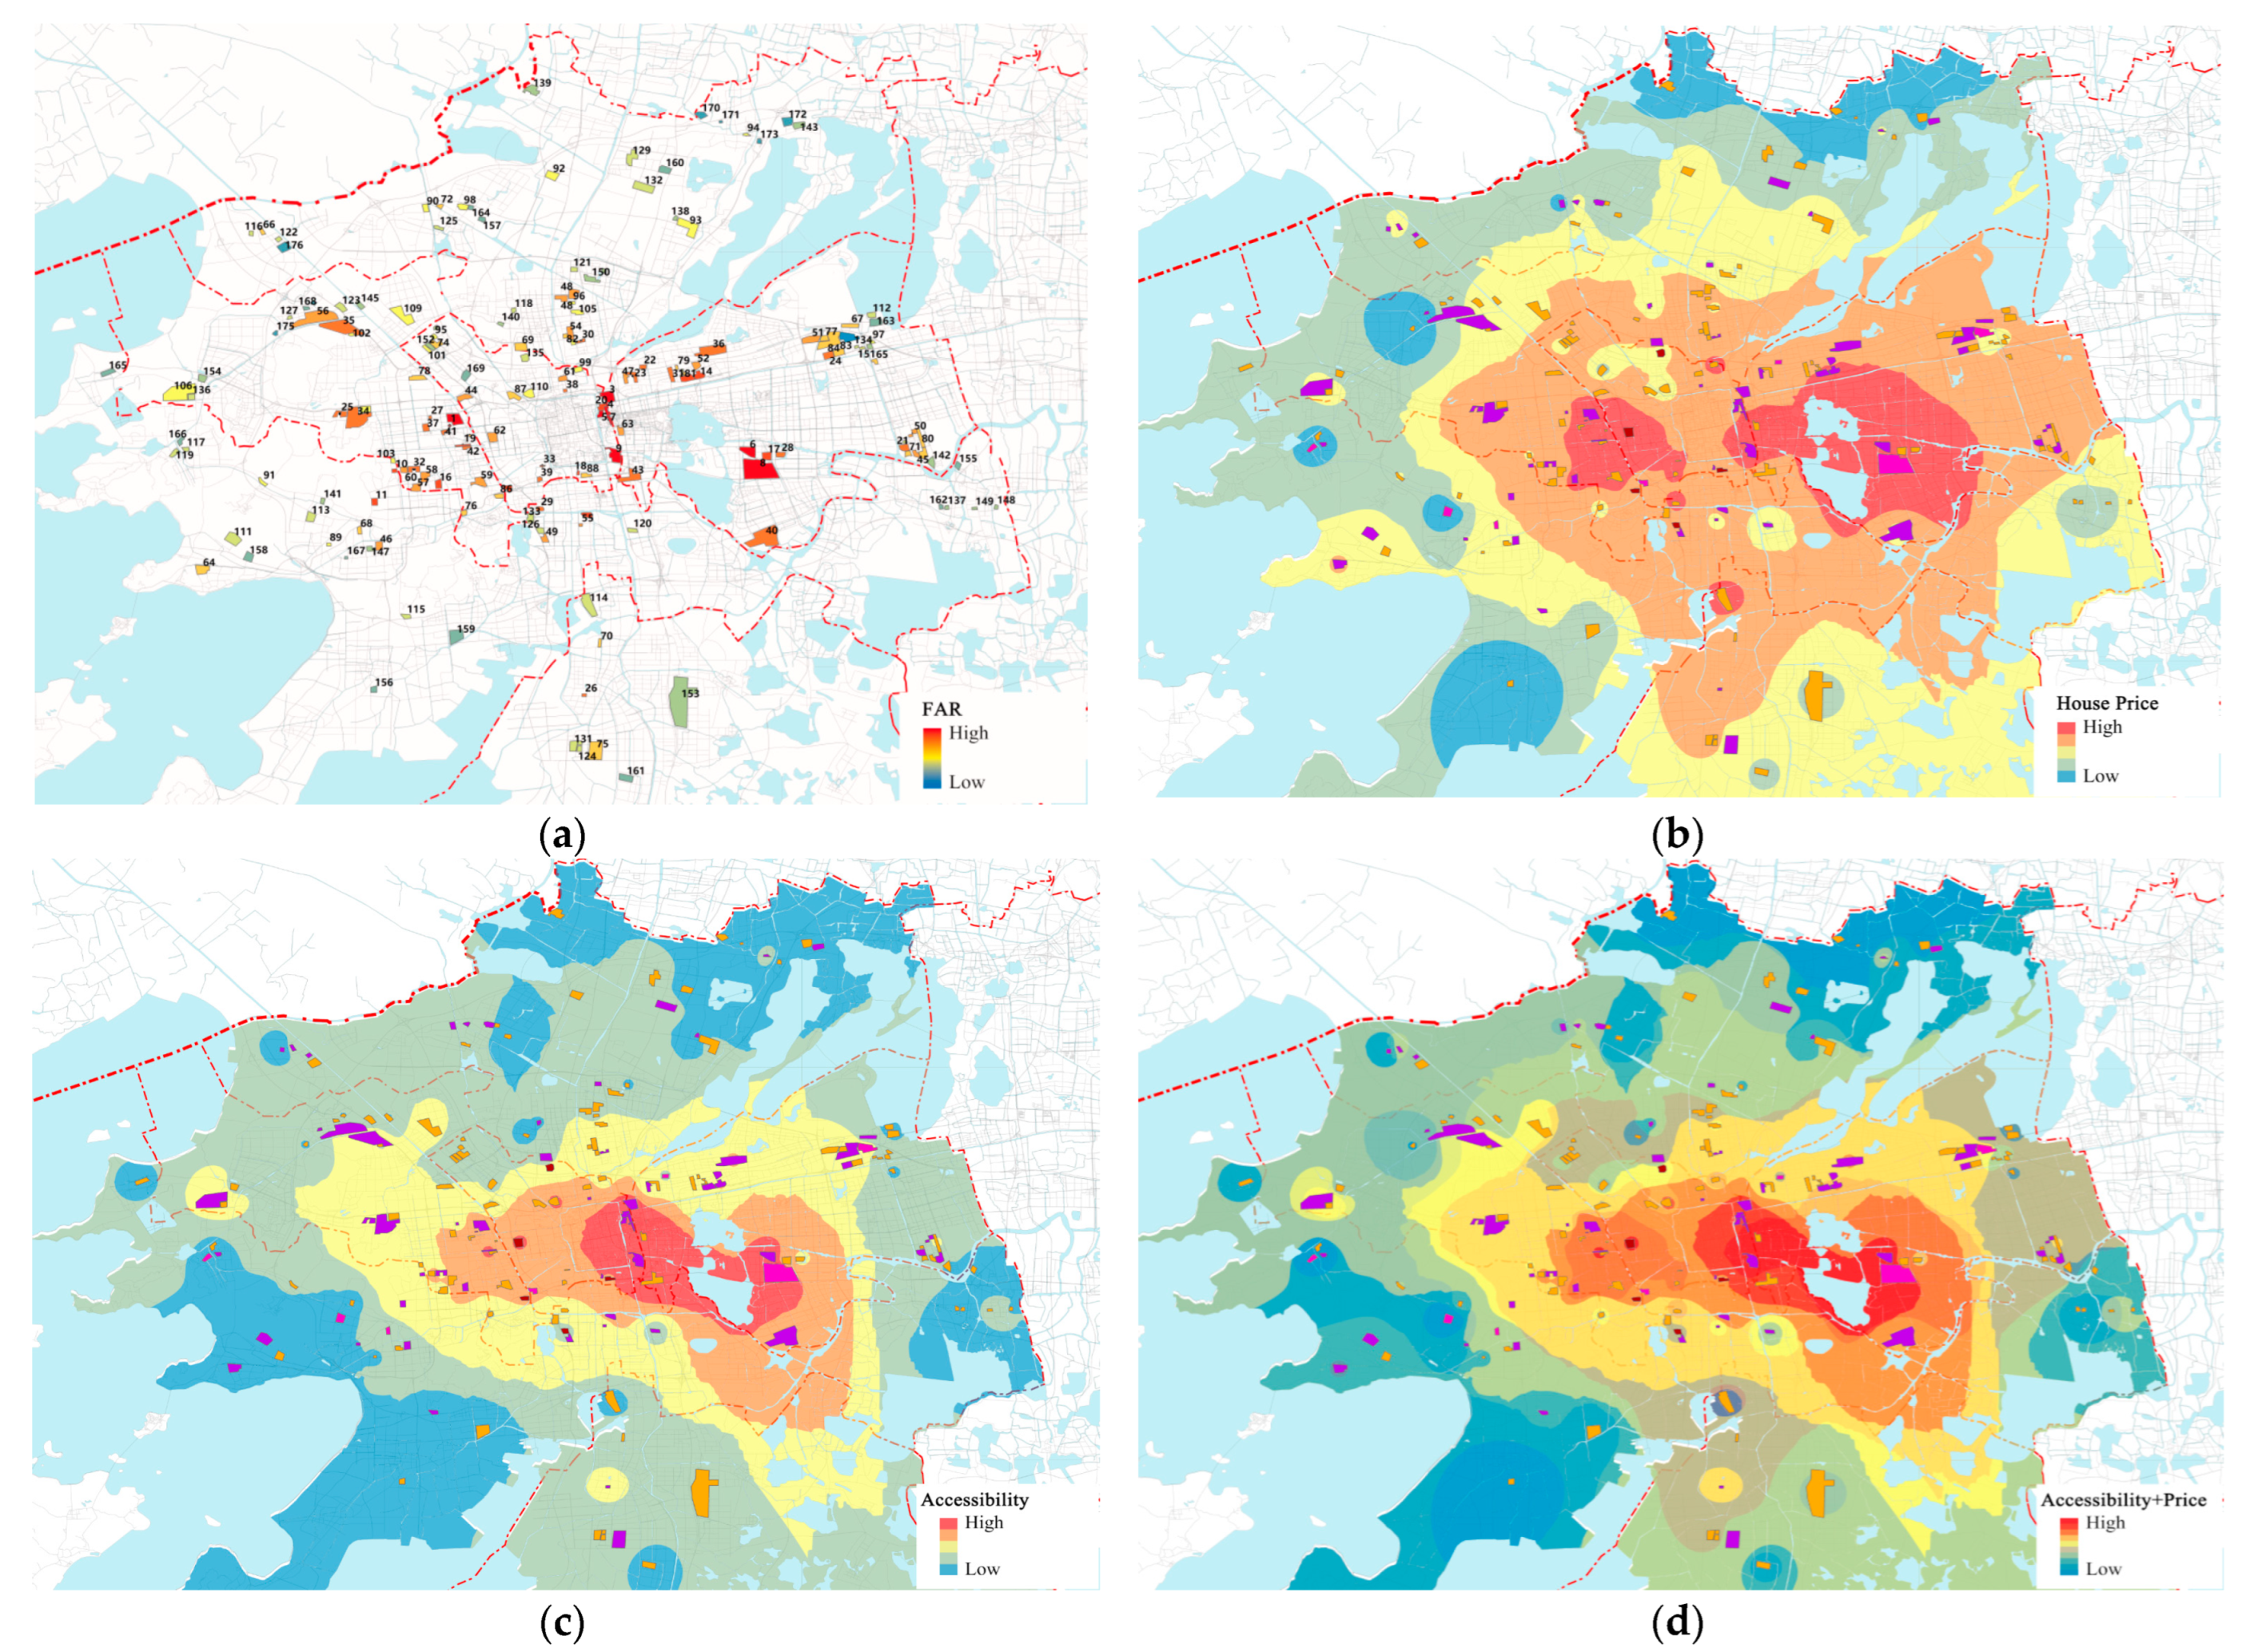
4.1. GIS Spatial Analysis Results

In this transformation, densification can be considered to increase land-use efficiency, renew the obsolescent stock, and provide housing to more diversified inhabitants. The analysis of the parameter of the density of the 176 resettlement communities in Suzhou already shows a small trend of densification over 30 years. In the early years of urbanization, the units were smaller, and the FAR was lower, less than 1.3; the cases with a FAR higher than 1.5 were realized after 1999, but in the 2000s, FARs higher than 2 and lower than 1.5 coexisted. After 2008, almost no communities had a FAR lower than 1.5. Since 2016, nearly all cases have had a FAR higher than 2, with some also reaching more than 3, and units becoming larger (Figure 3).
According to the FAR calculation via GIS (Figure 4a), 42% of the resettlement communities have a FAR between 1.0 and 1.5; a total of 35% have a FAR between 1.6 and 2; a total of 19% have a FAR higher than 2; and 4% have a FAR lower than 1. The analysis does not show a general rule in the distribution of the resettlement communities in the city, and neither can reasons be found for the different FARs of the cases, if not a higher FAR in proximity to the edges of Gusu, the oldest district of Suzhou, and a lower FAR in the most distant ones from Gusu.
For the house conditions calculation (Figure 4b), the areas with the highest housing conditions are located around Jinji Lake and Dushu Lake in the industrial park, at the junction of Gusu District and the industrial park, near Xinqu Road, and exhibit a typical centrality, with lower housing conditions occurring further to the periphery. Compared with areas with high housing prices, areas with lower housing conditions have wider coverage and cover the complete urban development boundaries. Low-density resettlement communities tend to concentrate in areas with slightly higher urban housing conditions.
For community accessibility analysis (Figure 4c), the highest area is located in the area west of Jinji Lake in the industrial park and at the junction of the ancient city, as well as the area around Dushu Lake. Similar to housing prices, it shows a clear centrality. However, compared with housing prices, its coverage area is relatively small, located in the city’s core area. In addition, there is no obvious consistency with reachability for low-density and high-density resettlement communities.
According to the integration analysis of accessibility and house conditions superposition (Figure 4d), the area with high house conditions and accessibility is the area where the industrial park is close to Gusu District, which has a strong centrality in the overall distribution. However, because the two are not completely superimposed in space, the core area radiates from the industrial park to the new area, forming a larger radiation area.

4.2. Statistical Analysis of Six Communities and Nanhuan Community

The 6 communities analyzed in detail have a floor area ratio that ranges from 0.95 to 1.75, on average 1.27, while the average FAR of all 176 cases is 1.73, the minimum is 0.7, and the maximum is 3.87 (Table 5).
For example, the Nanhuan New Village in Suzhou is a noteworthy case of densification. It is a demolition and reconstruction project in Suzhou, which was completed in 2013. Unlike the original community, the new community uses high-rise building types and different green space layouts, increasing the FAR value from 1.1 to 3.87 and tripling the total number of units. This attempt has shown that renewal is also a viable option when reassessing and transforming demolished and rebuilt communities, which can promote sustainable urban development while providing more housing.
The highest FAR is in Nanhuan New Village, Gusu District, which is the only case in Suzhou of the renewal with densification of a resettlement community, Nanhuan Community, initially built in 1996 on agricultural land. In 2013, the former community was partially demolished and rebuilt with a different housing type, high-rise buildings, a different layout of open space and green areas, and a FAR more than 3 times the former one, which was 1.1.

5. Discussion: A Strategy for Renewal and Densification

If the resettlement villages are chosen as targets for renewal and densification because of their architectural and urban characteristics, which ones should be selected and why? This paper proposes three options and evaluates their possible significance.
Based on the GIS analysis, some rationalities for selecting which communities to densify can be proposed, together with a process of gradual transformation in the medium term according to the existing policies. The project of densification should be site-specific and take into account multiple factors; that is to say, each specific renewal can define how to optimize the FAR in the re-design of the site, but some general conditions where densification should happen can be identified.
The paper considers the residential neighbourhood’s main quantitative factors—number of units and residents, dimensions of the area, public transportation, and period of realization—for a quantitative investigation of the possibilities of transformation with densification with the goal of using more intensively the land already urbanized. Before real actions are promoted, every proposal of densification will assess if the land is suitable for densification due to soil and seismic conditions, the land carrying capacity, and the land subsidence risks. The potential impact of natural disaster on the increased concentration of residents will also be explored to assess the possibility of safety in an emergency. During the decision-making phase, feasible mitigation and compensation measures will be studied to balance the impact on the environment of the demolition and building activities [4,5,7,17,19,20,69,70,71,72].

5.1. Densification according to FAR and Accessibility

The first option is the selection of cases to renew according to the intensity of land use expressed as FAR. Renewal and densification should be proposed in the resettlement communities which:
  • Do not efficiently use the land they occupy because the FAR is much lower than the average of the communities: the ones where FAR is lower or equal to 1 (8 cases) should be the first to be renewed; the ones with FAR lower or equal to 1.2 (18 cases) should be considered as the second group. In total, the communities with FAR lower or equal to 1.2 now accommodate almost 128,000 people in 40,423 units;
  • Were built before 2000 (12 cases), as proposed by the national guidelines, which today in the cases in Suzhou accommodate almost 78,000 people in 25,956 units;
  • Next to metro stations or transport interchanges (within 400 m from one of the community gates) and have a FAR lower or equal to 2 to fully exploit the transport capacity and accessibility of the site. Specific projects should define the most proper threshold of FAR according to the local conditions and the transport capacity.
The analysis of the available GIS data of the built fabric and the public transit infrastructures allows us to determine which resettlement communities are both low-density and within a radius of 400 m from a subway gate or a bus interchange, or a terminal (Figure 4c).
These first groups of communities can be pilot projects to test potentialities and obstacles to realize the optimum potential of sites. To what extent the FAR can be increased must be assessed in the local context, and multiple factors must be considered, including social infrastructures.
Other indicators can be considered to propose a community renewal, such as the quantity and quality of the open and recreational space. The communities with a building coverage higher than 25% and a green coverage of less than 30%, which means the open area of the community is mostly for mobility, should be investigated to assess the quality of the open space they offer combined with the FAR.
If this renewal happens, the value of the redeveloped estate will exceed the original value of the estate plus the cost of change, which is the expense, the temporary problems for the inhabitants, and the impact on the environment for the demolition and rebuilding. The upheaval of people’s lives and improvement of living conditions should be included in the viability assessments, and some form of subsidy should be provided. These concerns are partially reflected in China’s national compensation policy, which considers the residents’ needs while dislocated; its main elements are:
  • It grants financing for rental payments depending on the number of family members;
  • It compensates N times (n > 1.2) the value of the former residential area;
  • The resettlement solution is either in the same place as the original community or not far from it;
  • The indoor decoration of what is lost is compensated in cash [95].
In general, the evaluation of increased density should be in relation to the perception of the urban environment from the inhabitants, and high density must avoid extreme living conditions [24] (Figure 4b). Local public participation processes should be organized to involve the inhabitants in the decision making processes, but this is still rather rare in China.

5.2. Densification according to Housing Conditions

Considering the relevant investment needed, the social trade off, and the fact that new constructions are resource intensive and have high environmental impacts, the second option evaluates a non-destructive solution and the upgrading and retrofitting of the existing structures [96]: actions of densification that maintain the existing structures can be designed. The examples of Seoul and Rotterdam show it is possible to infill, build over, and build in-between existing buildings, even though these actions usually cannot substantially increase the number of people in the communities. They invest a few resources, do not demolish the houses of those who have already experienced one resettlement, and reduce the impact of reconstruction on the environment [97].
Specific projects must define these punctual actions of densification and their contribution to the whole city housing offer cannot be esteemed without a general plan that sets goals and targets. These kinds of actions indicate that to grow denser might be to build a compact city, not a super-density city [98,99], and might be to realize different housing types than the ones usually built in Suzhou, such as the compact superblock. A research-by-design or a design competition for new housing types in Suzhou should be promoted (Figure 4c).

5.3. A Radical Scenario of Densification

The third option proposes a radical impact in quantity and quality: the renewal and densification of all the resettlement communities. The transformation of all the resettlement communities requires a general citywide plan of interventions with priorities and phases. It implies social, environmental, and economic costs, but if all the resettlement villages in Suzhou were densified, for example, by duplicating the floor area ratio, it would accommodate 1 million people, which is a very relevant contribution to the existing stock considering that the growth of the population of the city over the past 5 years was 2.16 million people. In a strategic approach, the new FAR is advisable to be higher than double the existing one, as in the Nanhuan New Village case, which was increased by three times. In fact, replacing the existing buildings, which were modern when the first inhabitants arrived, but today are, or soon will be, middle-class, goes along with the challenge of the definition and implementation of a new standard of residential environment promoted by the state. What was good enough for just resettled people was decided when the resettlement operations started, so it should not be repeated when new conditions emerge.
The large investment needed for the replacement must increase the number of people in the same area but also:
  • Enhance the open spaces in quantity and quality: given the small and scattered green-blue spaces in the existing communities and the surrounding areas, the action of densification should re-design these resources, so that they can also play a role in fulfilling the needs of the interaction of the community. The plan will consider the contribution of the open spaces to the thermal and light comfort and to mitigate the heat island effect;
  • Realize an integrated transportation system, integrating public transport, pedestrian and cycling lanes, and car parking places connected to the pedestrian and bike network; limit the extension of the road network; and improve the accessibility to the compounds with a more permeable system of gates;
  • Diversify the units to match the needs and preferences of the different households and new lifestyles; diversify the housing types: higher density housing does not always require high-rise developments;
  • Mix land use to create an attractive street life;
  • Implement the “sponge city” guidelines for rainwater retention and water purification [100] and include systems for saving and producing renewable energy (Figure 4d).
  • Obviously, in addition to these specific improvements, the capacity of infrastructures, utilities, and public services will be increased according to the quantity of residents and users.

6. Conclusions

In the conditions of a growing urban population, the intensity of land use is an essential planning decision in promoting environmental sustainability. Chinese local governments are increasingly encouraging compact and mixed-used developments mainly to maximize land revenues and capture commercial and residential land value [101], but not yet mainly to balance economic interests and sustainability purposes. Still, the planning approach in the country is gradually and steadily shifting towards more sustainable development and a high-quality urban environment. In this process, for enhanced use of resources, the renewal of some built areas that do not perform efficiently can be considered. In this direction, the Chinese central government has promoted the regeneration and renewal of what was built before 2000, which is a massive undertaking if the whole country is considered.
This research explored the opportunity of regeneration with densification of what is already built in Suzhou to diminish the consumption of agricultural land and offer a better living environment than what was realized in the early years of massive urbanization. The research concluded that some resettlement communities could be appropriate sites for renewal. In fact, these communities in Suzhou are quickly deteriorating and offer inadequate services and poor housing conditions if the increased wealth of the population is considered, and more so if the actions for further improving the living conditions the government is working on are successful.
This research found that the densification of the resettlement communities can significantly impact the intensification of land use in the whole of Suzhou, given the large number of such communities and their low or medium floor area ratios. The densification project should be site specific, but a general citywide plan of interventions should be drafted with priorities and phases. Densification should be promoted, especially in the resettlement communities with low FAR and good transport capacity and accessibility. The local government should encourage dense and compact development and should have explicit goals to be respected by every development project; specifically, which option of densification is feasible and most suitable for each condition must be decided on a case-by-case basis.
Urban regeneration is costly and the reconstruction itself uses resources, but it can be convenient for the local government because it concerns already urbanized areas. Therefore, it does not occupy agricultural land or consume the land development quotas that the central governments allocate to the local governments. In addition, the increased renewal density contributes to the economic sustainability of the transformation because it can generate sufficient funds for the renewal itself and the compensation of the inhabitants, similar to what has already been experimented with as an example in the renewal of the urban villages in Guangdong [102].
The goal of the transformations with densification analyzed and proposed in this research is not gentrification, profit, or revenue maximization [84,85] but another step in improving the built environment and land value appreciation, benefits that can be shared with the current inhabitants.

7. Limitations

The article has some limitations. Firstly, the main one is the quality and accuracy of the GIS data: in fact, it is often difficult to obtain comprehensive and reliable data for research from public institutions and authorities in China. The research targets resettlement communities in Suzhou, but data are fragmented, not homogeneous and only partially available, so the authors created one dataset ad hoc starting from the dataset available and adding what is missing according to various direct and indirect sources.
Secondly, China’s current urbanization rate reached 65.22% in 2022 and large-scale construction is slowing down, leading to a slowdown in the densification process in most regions. It is still unclear whether the densification scenarios proposed in this article could also be applied to areas with less-developed economic growth. In future research, we will try to address these limitations.

Author Contributions

Conceptualization, P.P. and J.C.; methodology, P.P., J.C. and H.W.; software, J.C. and H.W.; analysis and investigation, P.P. and J.C.; resources and data curation, J.C., H.W. and Z.Y.; writing, J.C. and P.P.; visualization, J.C., H.W. and Z.Y.; supervision, P.P.; funding acquisition, P.P. All authors have read and agreed to the published version of the manuscript.

Funding

This research was funded by Xi’an Jiaotong-Liverpool University, RDF-17-02-25.

Informed Consent Statement

Informed consent was obtained from all subjects involved in the study.

Data Availability Statement

As official data about the resettlement communities and their floating populations is not available, data about the resettlement communities were obtained from the webpages of the largest real estate agencies in China: Anjuke lnc., Lianjia.com, and Soufun.com, and from visual information obtained from the most current satellite images. The authors can provide the data and the analysis upon request.

Conflicts of Interest

The authors declare no conflict of interest.

References

  1. Chen, M.; Liu, W.; Lu, D.; Chen, H.; Ye, C. Progress of China’s New-Type Urbanization Construction since 2014: A Preliminary Assessment. Cities 2018, 78, 180–193. [Google Scholar] [CrossRef]
  2. Chen, M.; Liu, W.; Lu, D. Challenges and the Way Forward in China’s New-Type Urbanization. Land Use Policy 2016, 55, 334–339. [Google Scholar] [CrossRef]
  3. Planning Department Implementation Plan for New Urbanization in the 14th Five Year Plan. Available online: http://www.gov.cn/zhengce/zhengceku/2022-07/12/content_5700632.htm (accessed on 8 May 2023).
  4. Van Timmeren, A.; Kristinsson, J.; Roling, L.C. Existing Infrastructures: A Restriction for Real Sustainable Development? WIT Transactions on Ecology and the Environment; WIT Press: Billerica, MA, USA, 2004. [Google Scholar]
  5. Cruz, M. Material Stock of Infrastructure-Comparative Analysis between Swedish and Mexican Cities. Master’s Thesis, Chalmers University of Technology, Gothenburg, Sweden, 2016. [Google Scholar]
  6. The State Council. The State Council Issued the National Land Planning Outline (2016–2030). Available online: http://www.gov.cn/zhengce/content/2017-02/04/content_5165309.htm (accessed on 8 May 2023).
  7. Huang, R.; Nie, Y.; Duo, L.; Zhang, X.; Wu, Z.; Xiong, J. Construction Land Suitability Assessment in Rapid Urbanizing Cities for Promoting the Implementation of United Nations Sustainable Development Goals: A Case Study of Nanchang, China. Environ. Sci. Pollut. Res. 2021, 28, 25650–25663. [Google Scholar] [CrossRef] [PubMed]
  8. Lin, G.C.S. China’s Landed Urbanization: Neoliberalizing Politics, Land Commodification, and Municipal Finance in the Growth of Metropolises. Environ. Plan. A 2014, 46, 1814–1835. [Google Scholar] [CrossRef]
  9. Shen, X.; Huang, X.; Li, H.; Li, Y.; Zhao, X. Exploring the Relationship between Urban Land Supply and Housing Stock: Evidence from 35 Cities in China. Habitat Int. 2018, 77, 80–89. [Google Scholar] [CrossRef]
  10. Jiang, L.; Deng, X.; Seto, K.C. The Impact of Urban Expansion on Agricultural Land Use Intensity in China. Land Use Policy 2013, 35, 33–39. [Google Scholar] [CrossRef]
  11. The State Council National New Urbanization Plan of China (2014–2020). Available online: http://www.gov.cn/gongbao/content/2014/content_2644805.htm (accessed on 8 May 2023).
  12. Xinhua Website National Congress of the Chinese Communist Party. Available online: https://www.chinacourt.org/article/detail/2022/10/id/6975843.shtml (accessed on 8 May 2023).
  13. Peterson, E.W.F. The Role of Population in Economic Growth. Sage Open 2017, 7, 2158244017736094. [Google Scholar] [CrossRef]
  14. Wu, F. Planning for Growth: Urban and Regional Planning in China; Routledge: Abingdon, UK, 2015; ISBN 0203067347. [Google Scholar]
  15. Li, Q.; Wu, J. Factors Affecting the Lower Limit of the Safe Mud Weight Window for Drilling Operation in Hydrate-Bearing Sediments in the Northern South China Sea. Geomech. Geophys. Geo-Energy Geo-Resour. 2022, 8, 82. [Google Scholar] [CrossRef]
  16. Li, Q.; Wang, F.; Wang, Y.; Zhou, C.; Chen, J.; Forson, K.; Miao, R.; Su, Y.; Zhang, J. Effect of Reservoir Characteristics and Chemicals on Filtration Property of Water-Based Drilling Fluid in Unconventional Reservoir and Mechanism Disclosure. Environ. Sci. Pollut. Res. 2023, 30, 55034–55043. [Google Scholar] [CrossRef]
  17. Yang, Y.; Zhang, L.; Ye, Y.; Wang, Z. Curbing Sprawl with Development-Limiting Boundaries in Urban China: A Review of Literature. J. Plan. Lit. 2020, 35, 25–40. [Google Scholar] [CrossRef]
  18. Hooi, E.; Pojani, D. Urban Design Quality and Walkability: An Audit of Suburban High Streets in an Australian City. J. Urban Des. 2020, 25, 155–179. [Google Scholar] [CrossRef]
  19. Xu, H.; Zhao, G. Assessing the Value of Urban Green Infrastructure Ecosystem Services for High-Density Urban Management and Development: Case from the Capital Core Area of Beijing, China. Sustainability 2021, 13, 12115. [Google Scholar] [CrossRef]
  20. Chen, J.; Pellegrini, P.; Wang, H. Comparative Residents’ Satisfaction Evaluation for Socially Sustainable Regeneration—The Case of Two High-Density Communities in Suzhou. Land 2022, 11, 1483. [Google Scholar] [CrossRef]
  21. Rowe, P.G.; Kan, H.Y. Urban Intensities: Contemporary Housing Types and Territories; Birkhäuser: Basel, Switzerland, 2014; ISBN 303821101X. [Google Scholar]
  22. Davidson, C.H.; Johnson, C.; Lizarralde, G.; Dikmen, N.; Sliwinski, A. Truths and Myths about Community Participation in Post-Disaster Housing Projects. Habitat Int. 2007, 31, 100–115. [Google Scholar] [CrossRef]
  23. David, O. Green Metropolis: Why Living Smaller, Living Closer, and Driving Less Are the Keys to Sustainability; Riverhead Books: New York, NY, USA, 2010. [Google Scholar]
  24. Ng, E. Designing High-Density Cities: For Social and Environmental Sustainability; Routledge: Abingdon, UK, 2009; ISBN 1136546006. [Google Scholar]
  25. Clark, G.; Moir, E. Density: Drivers, Dividends and Debates; Urban Land Institute: London, UK, 2015. [Google Scholar]
  26. Whittemore, A.H.; BenDor, T.K. Talking about Density: An Empirical Investigation of Framing. Land Use Policy 2018, 72, 181–191. [Google Scholar] [CrossRef]
  27. Ray, M.-A.; Sherman, R.; Zardini, M. The Dense-City: After the Sprawl; Electa Editrice: Milan, Italy, 1999; ISBN 8828909897. [Google Scholar]
  28. Hao, T.; Chang, H.; Liang, S.; Jones, P.; Chan, P.W.; Li, L.; Huang, J. Heat and Park Attendance: Evidence from “Small Data” and “Big Data” in Hong Kong. Build. Environ. 2023, 234, 110123. [Google Scholar] [CrossRef]
  29. Hansen, R.; Olafsson, A.S.; Van Der Jagt, A.P.N.; Rall, E.; Pauleit, S. Planning Multifunctional Green Infrastructure for Compact Cities: What Is the State of Practice? Ecol. Indic. 2019, 96, 99–110. [Google Scholar] [CrossRef]
  30. Yang, J.; Ren, J.; Sun, D.; Xiao, X.; Xia, J.C.; Jin, C.; Li, X. Understanding Land Surface Temperature Impact Factors Based on Local Climate Zones. Sustain. Cities Soc. 2021, 69, 102818. [Google Scholar] [CrossRef]
  31. Pasquay, T. Natural Ventilation in High-Rise Buildings with Double Facades, Saving or Waste of Energy. Energy Build. 2004, 36, 381–389. [Google Scholar] [CrossRef]
  32. Gunawardena, K.R.; Wells, M.J.; Kershaw, T. Utilising Green and Bluespace to Mitigate Urban Heat Island Intensity. Sci. Total Environ. 2017, 584, 1040–1055. [Google Scholar] [CrossRef]
  33. Ampatzidis, P.; Kershaw, T. A Review of the Impact of Blue Space on the Urban Microclimate. Sci. Total Environ. 2020, 730, 139068. [Google Scholar] [CrossRef]
  34. Carbajal Velazco, N.A. New Trends in Densification Projects within the Million Homes Programme Areas 2018. Available online: http://mau.diva-portal.org/smash/get/diva2:1483782/FULLTEXT01.pdf (accessed on 8 May 2023).
  35. Plitt, A. NYC’s Supertall Skyscraper Boom, Mapped. Available online: https://ny.curbed.com/maps/new-york-skyscraper-construction-supertalls (accessed on 8 May 2023).
  36. The President’s Design Award 1000 Singapore a Model of The Compact City. Available online: https://pda.designsingapore.org/presidents-design-award/award-recipients/2011/1000-singapore-a-model-of-the-compact-city.html (accessed on 8 May 2023).
  37. Centre for Liveable Cities and Urban Land Institute. 10 Principles for Liveable High Density Cities Lessons from Singapore; Centre for Liveable Cities Singapore: Singapore, 2013; Volume 1.
  38. Huang, J.; Cui, Y.; Li, L.; Guo, M.; Ho, H.C.; Lu, Y.; Webster, C. Re-Examining Jane Jacobs’ Doctrine Using New Urban Data in Hong Kong. Environ. Plan. B Urban Anal. City Sci. 2023, 50, 76–93. [Google Scholar] [CrossRef]
  39. Touati-Morel, A. Hard and Soft Densification Policies in the Paris City-Region. Int. J. Urban Reg. Res. 2015, 39, 603–612. [Google Scholar] [CrossRef]
  40. Eric, H. Paris/Ile-De-France Region Facing Climate Change. ISOCARP Rev. 2018, 14, 29–41. [Google Scholar]
  41. Sibylle, K. Design Solutions for Urban Densification; Braun Publishing: Salenstein, Switzerland, 2018. [Google Scholar]
  42. Henning Larsen Seoul Valley. Available online: https://henninglarsen.com/en/projects/1900-1999/1990-seoul-valley (accessed on 8 May 2023).
  43. Jang, M.; Kang, C.-D. Urban Greenway and Compact Land Use Development: A Multilevel Assessment in Seoul, South Korea. Landsc. Urban Plan. 2015, 143, 160–172. [Google Scholar] [CrossRef]
  44. Nico, T. Rotterdam- People Make the Inner City: Densification + Greenification = Sustainable City. Available online: https://www.academia.edu/41492761/Rotterdam_People_make_the_inner_city_densification_greenification_sustainable_city (accessed on 8 May 2023).
  45. Broitman, D.; Koomen, E. Residential Density Change: Densification and Urban Expansion. Comput. Environ. Urban Syst. 2015, 54, 32–46. [Google Scholar] [CrossRef]
  46. Claassens, J.; Koomen, E. Housing Trends the Netherlands: Urban Densification Continues. Available online: https://spatialeconomics.nl/en/housing-trends-the-netherlands-urban-densification-continues/ (accessed on 8 May 2023).
  47. Hanna, K.; Oduwaiye, A.; Redman, P. Another Storey: The Real Potential for Estate Densification; Center for London: London, UK, 2016. [Google Scholar]
  48. Greater London Authority the City Hall Building. Available online: https://www.london.gov.uk/who-we-are/city-halls-buildings-and-squares/city-hall-building (accessed on 8 May 2023).
  49. Andrew, C. Urban Densification is Key to Tackling Cities’ Biggest Challenges. Available online: https://www.themj.co.uk/Urban-densification-is-key-to-tackling-cities-biggest-challenges/222108# (accessed on 8 May 2023).
  50. The Economist Modern Cities Become Less Dense as They Grow. Available online: https://www.economist.com/graphic-detail/2019/10/05/modern-cities-become-less-dense-as-they-grow? (accessed on 8 May 2023).
  51. Xu, G.; Jiao, L.; Yuan, M.; Dong, T.; Zhang, B.; Du, C. How Does Urban Population Density Decline over Time? An Exponential Model for Chinese Cities with International Comparisons. Landsc. Urban Plan. 2019, 183, 59–67. [Google Scholar] [CrossRef]
  52. World Bank World Bank Open Data. Available online: https://data.worldbank.org/ (accessed on 8 May 2023).
  53. Wang, Y.; Wu, W.; Boelens, L. City Profile: Suzhou, China—The Interaction of Water and City. Cities 2021, 112, 103119. [Google Scholar] [CrossRef]
  54. Suzhou Goverment Suzhou Statistical Yearbook. Available online: http://tjj.suzhou.gov.cn/sztjj/tjnj/nav_list_2.shtml (accessed on 8 May 2023).
  55. Suzhou People’s Government Consolidate talent support and empower innovation and development. Available online: https://www.suzhou.gov.cn/szsrmzf/szyw/202109/2066e1becae84830b65edc6a229ad302.shtml (accessed on 8 May 2023).
  56. Issued by the Jiangsu Provincial Committee Suzhou Enterprise and Public Institution Talent Introduction and Employment Incentive Measures. Available online: https://sme.sipac.gov.cn/epservice/techsub/Apps/psp/index.php?s=/PolicySearch/policydetail/id/111012 (accessed on 8 May 2023).
  57. Moretti, E. The New Geography of Jobs; Houghton Mifflin Harcourt: Boston, MA, USA, 2012; ISBN 0547750110. [Google Scholar]
  58. Sawicki, D. The Rise of the Creative Class: And How It’s Transforming Work, Leisure, Community and Everyday Life. Am. Plan. Assoc. J. Am. Plan. Assoc. 2003, 69, 90. [Google Scholar]
  59. Suzhou People’s Government Suzhou City Land and Space Master Plan (2021–2035). Available online: https://www.suzhou.gov.cn/szsenglish/szcymb/202108/fe7c6774e9b745739161e97f348264a5.shtml (accessed on 8 May 2023).
  60. Goodman, D.S.G.; Chen, M. Middle Class China: Identity and Behaviour; Edward Elgar Publishing: Cheltenham, UK, 2013; ISBN 1781005710. [Google Scholar]
  61. Zhang, L. In Search of Paradise. In Search of Paradise; Cornell University Press: Ithaca, NY, USA, 2011; ISBN 0801459435. [Google Scholar]
  62. Chen, C.; Qin, B. The Emergence of China’s Middle Class: Social Mobility in a Rapidly Urbanizing Economy. Habitat Int. 2014, 44, 528–535. [Google Scholar] [CrossRef]
  63. Gan, L.; Yin, Z.; Jia, N.; Xu, S.; Ma, S. Analysis of Urban Housing Vacancy of China in 2017. 2018. Available online: https://chfs.swufe.edu.cn/info/1031/1471.htm (accessed on 8 May 2023).
  64. Tan, Z.; Wei, D.; Yin, Z. Housing Vacancy Rate in Major Cities in China: Perspectives from Nighttime Light Data. Complexity 2020, 2020, 5104578. [Google Scholar] [CrossRef]
  65. Huuhka, S. Vacant Residential Buildings as Potential Reserves: A Geographical and Statistical Study. Build. Res. Inf. 2016, 44, 816–839. [Google Scholar] [CrossRef]
  66. Hagen, D.; Hansen, J. Rental Housing and the Natural Vacancy Rate. J. Real Estate Res. 2010, 32, 413–434. [Google Scholar] [CrossRef]
  67. Brueckner, J.K.; Fu, S.; Gu, Y.; Zhang, J. Measuring the Stringency of Land Use Regulation: The Case of China’s Building Height Limits. Rev. Econ. Stat. 2017, 99, 663–677. [Google Scholar] [CrossRef]
  68. WorldAtlas The World’s Most Densely Populated Cities. Available online: https://www.worldatlas.com/articles/the-world-s-most-densely-populated-cities.html (accessed on 8 May 2023).
  69. Monson, K. String Block vs Superblock Patterns of Dispersal in China. Archit. Des. 2008, 78, 46–53. [Google Scholar] [CrossRef]
  70. Hassenpflug, D. The Urban Code of China; De Gruyter: Berlin, Germany, 2010; ISBN 3034605722. [Google Scholar]
  71. Calthorpe, P. Urbanism and Global Sprawl. In State World Can a City Be Sustain; Island Press: Washington, DC, USA, 2016; pp. 91–108. [Google Scholar]
  72. World Bank. East Asia’s Changing Urban Landscape: Measuring a Decade of Spatial Growth; World Bank Publications: Washington, DC, USA, 2015; ISBN 1464803633. [Google Scholar]
  73. The State Council 14th Five-Year Plan (2021–2025) for National Economic and Social Development of the People’s Republic of China. Available online: http://www.gov.cn/xinwen/2021-03/13/content_5592681.htm (accessed on 8 May 2023).
  74. Al, S.; Shan, P.C.H.; Juhre, C.; Valin, I.; Wang, C. Villages in the City: A Guide to South China’s Informal Settlements; Hong Kong University Press: Hong Kong, China, 2014; Volume 1, ISBN 9888208233. [Google Scholar]
  75. Urbans in the 21st Year of Shenzhen: Urban Practice. Available online: http://www.urbanus.com.cn/writings/21-years-in-shenzhen-urbanus/?lang=en (accessed on 8 May 2023).
  76. Chen, T. A State beyond the State: Shenzhen and the Transformation of Urban China; Nai010 Publishers: Rotterdam, The Netherlands, 2017; ISBN 9462083495. [Google Scholar]
  77. Meng, C. Research on Planning and Design of High Floor Area Ratio Affordable Housing. Master’s Thesis, Suzhou University of Science and Technology, Suzhou, China, 2011. [Google Scholar]
  78. Pan, X.-Z.; Zhao, Q.-G.; Chen, J.; Liang, Y.; Sun, B. Analyzing the Variation of Building Density Using High Spatial Resolution Satellite Images: The Example of Shanghai City. Sensors 2008, 8, 2541–2550. [Google Scholar] [CrossRef]
  79. Lam, S. Focus: Wang Shu. Available online: https://www.archdaily.cn/cn/801319/jiao-dian-wang-shu (accessed on 8 May 2023).
  80. Chuang, J. Urbanization through Dispossession: Survival and Stratification in China’s New Townships. J. Peasant. Stud. 2015, 42, 275–294. [Google Scholar] [CrossRef]
  81. Wu, F. Residential Relocation under Market-Oriented Redevelopment: The Process and Outcomes in Urban China. Geoforum 2004, 35, 453–470. [Google Scholar] [CrossRef]
  82. Jiang, Y.; Waley, P.; Gonzalez, S. ‘Nice Apartments, No Jobs’: How Former Villagers Experienced Displacement and Resettlement in the Western Suburbs of Shanghai. Urban Stud. 2018, 55, 3202–3217. [Google Scholar] [CrossRef]
  83. Gomersall, K. Resettlement Practice and the Pathway to the Urban Ideal. Geoforum 2018, 96, 51–60. [Google Scholar] [CrossRef]
  84. Xu, Y.; Tang, B.; Chan, E.H.W. State-Led Land Requisition and Transformation of Rural Villages in Transitional China. Habitat Int. 2011, 35, 57–65. [Google Scholar] [CrossRef]
  85. Chen, J.; Tian, W.; Xu, K.; Pellegrini, P. Testing Small-Scale Vitality Measurement Based on 5D Model Assessment with Multi-Source Data: A Resettlement Community Case in Suzhou. ISPRS Int. J. Geo-Inf. 2022, 11, 626. [Google Scholar] [CrossRef]
  86. Chen, J.; Pellegrini, P.; Ma, G. Identifying Resettlement Communities’ Urban Regeneration Opportunity Through GIS-Based Spatial Analysis in Suzhou Metropolitan Area. Urban Reg. Plan. 2021, 6, 146. [Google Scholar] [CrossRef]
  87. SIP Planning and Construction Committee Technical Regulations on Urban Planning Management of Suzhou Industrial Park. Available online: http://www.sipac.gov.cn/szghjswyh/tzgg/202007/d82649ae11e74a75b725193facf3497f.shtml (accessed on 8 May 2023).
  88. The Ministry of Housing and Urban-Rural Development Unified Standard for Reliability Design of Building Structures. Available online: https://www.mohurd.gov.cn/gongkai/zhengce/zhengcefilelib/201903/20190315_239764.html (accessed on 8 May 2023).
  89. Teaford, J.C. Urban Renewal and Its Aftermath. Hous. Policy Debate 2000, 11, 443–465. [Google Scholar] [CrossRef]
  90. Chan, E.H.W.; Lee, G.K.L. Contribution of Urban Design to Economic Sustainability of Urban Renewal Projects in Hong Kong. Sustain. Dev. 2008, 16, 353–364. [Google Scholar] [CrossRef]
  91. Li, X.; Zhang, F.; Hui, E.C.; Lang, W. Collaborative Workshop and Community Participation: A New Approach to Urban Regeneration in China. Cities 2020, 102, 102743. [Google Scholar] [CrossRef]
  92. Ministry of Construction of the People’s Republic of China Code of urban Residential Areas Planning & Design. Available online: http://www.planning.org.cn/law/uploads/2013/1383999145.pdf (accessed on 8 May 2023).
  93. Zeng, G. A Preliminary Study on the Construction Strategy of Suzhou’s Modern Internationalized Metropolis Based on the Integration of the Yangtze River Delta Region. Available online: http://sutt.suda.edu.cn/fd/40/c23317a458048/page.htm (accessed on 8 May 2023).
  94. Li, F.; Huang, H. The “Three-Old” Policy of Community Renewals in China: Based on Cases in the Pearl River Delta Region. In Proceedings of the Conference proceeding of the 49th ISOCARP Congress, Brisbane, QLD, Australia, 1–4 October 2013. [Google Scholar]
  95. Ding, C. Policy and Praxis of Land Acquisition in China. Land Use Policy 2007, 24, 1–13. [Google Scholar] [CrossRef]
  96. Birkeland, J. Positive Development: From Vicious Circles to Virtuous Cycles through Built Environment Design; Routledge: Abingdon, UK, 2012; ISBN 1136559442. [Google Scholar]
  97. Chen, J.; Pellegrini, P.; Xu, Y.; Ma, G.; Wang, H.; An, Y.; Shi, Y.; Feng, X. Evaluating Residents’ Satisfaction before and after Regeneration. The Case of a High-Density Resettlement Neighbourhood in Suzhou, China. Cogent Soc. Sci. 2022, 8, 2144137. [Google Scholar] [CrossRef]
  98. Williams, K.; Jenks, M.; Jenks, M.; Burton, E. Achieving Sustainable Urban Form; Taylor & Francis: Abingdon, UK, 2000. [Google Scholar]
  99. OECD. Compact City Policies a Comparative Assessment; OECD Publishing: Paris, France, 2012. [Google Scholar]
  100. Nguyen, T.T.; Ngo, H.H.; Guo, W.; Wang, X.C.; Ren, N.; Li, G.; Ding, J.; Liang, H. Implementation of a Specific Urban Water Management-Sponge City. Sci. Total Environ. 2019, 652, 147–162. [Google Scholar] [CrossRef]
  101. Wu, F. State Dominance in Urban Redevelopment: Beyond Gentrification in Urban China. Urban Aff. Rev. 2016, 52, 631–658. [Google Scholar] [CrossRef]
  102. Li, B.; Liu, C. Emerging Selective Regimes in a Fragmented Authoritarian Environment: The ‘Three Old Redevelopment’Policy in Guangzhou, China from 2009 to 2014. Urban Stud. 2018, 55, 1400–1419. [Google Scholar] [CrossRef]
Figure 1. Resettlement communities’ location in Suzhou.
Sustainability 15 07901 g001
Figure 3. Average resettlement communities’ FAR change from 1983–2019 in Suzhou city. (The dashed line is the trend of the column chart).
Sustainability 15 07901 g003
Figure 4. The GIS analysis. (a) The location and the FAR of the 176 resettlement communities identified in Suzhou. (b) The resettlement communities and the areas with different housing conditions. (c) The resettlement communities and the areas with different accessibility (bus stops and subway stations): the red areas represent the best accessibility in Suzhou. Note: accessibility is calculated using sDNA from the urban road axis model. (d) The combination of three indicators: FAR, housing conditions, and accessibility.
Sustainability 15 07901 g004
Table 1. Area and population indicators of each district in Suzhou.
District2021 (Million)Area (km2)Pop Density
Metropolitan Area12.7488657.321472.5
Suzhou City 6.71482899.382315.9
Gusu0.92483.4211,076.5
Wuzhong1.38897451864.3
Xiangcheng0.891489.961818.5
Suzhou New District0.832332.372503.2
Suzhou Industrial Park1.1339278.194076.0
Wujiang 1.545970.441592.1
Table 2. Comparison of Three Typical Update Project Indicators.
Village NameSite AreaTotal Building Area (Before)Total Building Area (After)FAR (Before)FAR (After)
Dachong village36.40 ha160.52 ha280.00 ha4.41 7.70
Jianyeli Shikumen1.79 ha2.33 ha4.77 ha1.302.51
Tuanjie Village2.80 ha4.43 ha14.11 ha1.585.04
Table 3. A detailed description of the data source used in the research.
ItemSourceTime
Basic informationData acquisition source is Gaode, Suzhou Map, Accessed from: https://1bs.amap.com/ (accessed on 1 September 2020).2020
POI, AOI dataSuzhou Anjuke Second-hand Housing Trading Website. Accessed from: https://su.fang.anjuke.com/ (accessed on 1 September 2020).2020
Table 4. Measurement method and analysis equation.
Measurement ItemEquationMeaning
FAR   F x = F × L
  F A R = F x A x
F is the single-story building area, L is the number of floors of the building  F x  is the total building area,  A x  is the plot area
Community accessibilityCA = NQPDAn in sDNA +   N C 1 NQPDAn is an indicator in sDNA that calculates global accessibility, reflecting the accessibility level of roads based on its numerical value.  N C 1 , Number of transportation stations within 300 m around the community. CA means community accessibility.
Housing conditions   H C = T H 1 + N H 2 + S g S T H 1 ,  the community house price;  N H 2 ,  the number of households in the community;  S g ,  greening area of the community;  S ,  area of the community; and HC means housing conditions.
Table 5. Comparison of the main characteristics of the traditional resettlement village in Suzhou with Nanhuan New Village.
Average of 6 Case StudiesNanhuan New Village
FAR1.273.87
Housing typeMulti-storyHigh rise
Number of floors4–628–32
Green coverage0.350.25
Construction cost1200 RMB/sqm2500 RMB/sqm
Car ParkingNo structures nor areas for parking in the original master plan; parking was obtained in recent years in
the green spaces.
Underground parking,
0.8 car parking for every unit
ComfortNo elevatorElevator
No heating or air conditioningHeating or air Conditioning
No soundproof wallsSoundproof elements
No thermal insulationThermal insulation
Fragmented open spaceContinuous open space
Disclaimer/Publisher’s Note: The statements, opinions and data contained in all publications are solely those of the individual author(s) and contributor(s) and not of MDPI and/or the editor(s). MDPI and/or the editor(s) disclaim responsibility for any injury to people or property resulting from any ideas, methods, instructions or products referred to in the content.

