Article

Rule Study on the Risk of Floor Water Inrush Based on the Plate Model Theory

1
School of Resources, Environment and Materials, Guangxi University, Nanning 530004, China
2
State Key Laboratory of Featured Metal Materials and Life-Cycle Safety for Composite Structures, Nanning 530004, China
3
Guangxi Higher School Key Laboratory of Minerals Engineering, Nanning 530004, China
*
Author to whom correspondence should be addressed.
Sustainability 2023, 15(10), 7844; https://doi.org/10.3390/su15107844
Submission received: 30 March 2023 / Revised: 5 May 2023 / Accepted: 8 May 2023 / Published: 10 May 2023
(This article belongs to the Special Issue Advances in Coal Mine Disasters Prevention)

Abstract

:
In order to mitigate the potential issue of abrupt water inrush in coal mining operations, the elastic-plastic mechanics theory was employed to simplify the water barrier of the floor strata into a thin rectangular plate. Subsequently, a fluid-solid coupling damage model was designed through the utilization of COMSOL Multiphysics software to investigate the coupled seepage and damage effects of the rock mass in an equivalent continuous medium. The results indicate that (1) the analysis of the theoretical equation of elastic mechanics shows that the fracture position of the four-sided clamped thin plate is in the center of the four sides, and the theoretical limit span and the theoretical limit water pressure formula are derived. (2) The damage factor is used to characterize the damaging effect of different mining distances and different pore water pressures on the rock mass of the floor aquiclude in the numerical simulation. It is found that the damage tends to the open-off cut and stop-mining line of the floor waterproof layer and the center position on both sides of the coal wall, and the stress is the most concentrated. (3) The results obtained by the two research methods are highly consistent, which provides a theoretical basis for the prevention and control of water in ground mining mines, so as to realize safe mining above the confined aquifer.

1. Introduction

Coal remains one of the world’s primary fossil fuels, making significant contributions to the global economy [1,2]. China is one of the largest coal producers in the world [3]. In particular, China’s southwestern region is abundant in coal resources; however, it is also characterized by karst terrain, which includes regions such as Sichuan, Guizhou, and Guangxi [4]. This type of terrain is fragile, and underground mining can easily cause water to flood the workings. Mining disturbances can cause pressure water to flow through conduits into voids, resulting in sudden mine flooding. As mining depth increases and geological conditions become more complex, the risk of floor water inrush, combined with excavation effects, poses a significant threat to coal seam mining [5,6,7,8,9,10,11,12,13,14]. To mitigate this risk, scholars have proposed various predictive solutions [15,16,17,18,19] and numerical simulations to study rock damage and faulted coal seam structures for advancing the coal face [20,21,22]. the field of mechanics, scholars have successively studied the identification of key overburden layers under linear loads for four-sided support rectangular plates and the loading of key layers before failure. Using plate theory, a hydraulic model for key layers was established, and a floor key layer water inrush evaluation model was proposed [23], which verified the water inrush location [24] and analyzed the stress distribution, fracture characteristics, and risk zones of key layers [25]. Water inrush criteria and minimum water-containing thickness were determined [26,27], and a mathematical model for analyzing horizontal crack changes were proposed based on the plate theory [28], which calculated the internal force and deflection of the rock layer and revealed the development law of horizontal cracks in rock layer separation [29]. Based on the plate theory, the thick plate theory was extended to establish a model of pillar collapse water inrush mechanics and obtained the expression for the critical water pressure of water-resistant layers under hydraulic pressure and the deformation of the water-resistant layer and collapse column water inrush [30,31].
In summary, previous studies have made significant contributions to the prevention and control of floor water inrush and have important implications. This paper uses the prediction of floor water inrush hazards as the research focus, applies a combination of mechanical theory and numerical simulation methods, establishes a plate mechanics model, deduces the maximum span and theoretical head pressure at the center of the plate based on strength theory, and then calculates the maximum water pressure. The actual geological conditions of Heshan Mine are embedded into the COMSOL Multiphysics software to establish a fluid-solid damage model to study the effects of mining distance and pore water pressure on floor damage.

2. Methods

2.1. Plate Model Theoretical Analysis

The original rock stress was destroyed and the ground stress was redistributed because of coal seam mining. The mining failure zone, rock layer waterproof zone, and pressurized water guide zone appeared on the floor of the goaf, as shown in Figure 1a.
The rock strata of the floor aquifer were simplified as a thin rectangular plate with four edges clamped and subject to uniform load, moreover, the coordinate system was established, see Figure 1b,c. Based on the elastic thin plate theory, the mechanical analysis was made by using the thin plate model, combining with shear strength and tensile strength criteria.
Set the boundary conditions:
x = ± a 2 ,   ω = 0 ,   ω x x = ± a = 0 , y = ± a 2 ,   ω = 0 ,   ω y y = ± b = 0 , ω = m C m ω m
where a is the length of the long side of the plate, b is the length of the short side of the plate, m is a positive integer, and Cm is a coefficient.
By the elastic mechanics theory [25], all boundary conditions can be satisfied regardless of the value of Cm.
Assume the deflection function:
ω = C x 2 a 2 4 2 y 2 b 2 4 2
From Equation (2):
ω x = 4 C x x 2 a 2 4 y 2 b 2 4 2
ω y = 4 C y y 2 b 2 4 x 2 a 2 4 2
Laplace operators can be obtained from Equations (3) and (4).
4 ω = 4 ω x 4 + 4 ω y 4 + 2 4 ω x 2 y 2 = 8 C 3 x 2 a 2 4 2 + 3 y 2 b 2 4 2 + 4 3 x 2 a 2 4 3 y 2 b 2 4
According to the Galerkin method:
D 4 ω q δ ω d x d y = 0
a a b b D 4 ω f x , y = 14 a 9 b 5 + 8 a 7 b 7 + 14 a 5 b 9 11025 C D
C = 49 q 8 D ( 7 a 4 + 4 a 2 b 2 + 7 b 4 )
where D is the bending stiffness.
The deflection equation can be obtained by simplifying the water-resisting layer of the bottom plate into a thin plate with a uniform load around it.
ω = 49 q x 2 a 2 4 2 y 2 b 2 4 2 D 56 a 4 + 32 a 2 b 2 + 56 b 4
According to the flexural equation, it can be derived that
M x = D 2 ω x 2 + ν 2 ω y 2 = 7 q y 2 b 2 4 3 x 2 a 2 4 2 + ν x 2 a 2 4 2 3 y 2 b 2 4 2 a 4 + 4 7 a 2 b 2 + b 4
M y = D ν 2 ω x 2 + 2 ω y 2 = 7 q ν y 2 b 2 4 3 x 2 a 2 4 2 + x 2 a 2 4 2 3 y 2 b 2 4 2 a 4 + 4 7 a 2 b 2 + b 4
In the formula, D = E h 2 3 12 ( 1 ν 2 )
From (10) and (11), the bending moment value around the rectangular thin plate can be known
x = ± a 2 , M x | x = ± a 2 = 7 q a 2 y 2 b 2 4 2 4 a 4 + 4 7 a 2 b 2 + b 4
y = ± b 2 , M y | y = ± b 2 = 7 q b 2 x 2 a 2 4 2 4 a 4 + 4 7 a 2 b 2 + b 4
The peak position of the bending moment can be obtained by derivation:
M x | x = ± a 2 = 0 ,   M y | y = ± b 2 = 0
It can be seen that the peak position of the bending moment is at the center of the four sides of the thin plate, which are:
M x | x = ± a 2 , y = 0 = 7 q a 2 b 4 64 a 4 + 4 7 a 2 b 2 + b 4
M y | y = ± b 2 , x = 0 = 7 q a 4 b 2 64 a 4 + 4 7 a 2 b 2 + b 4
According to the analysis of the above bending moment equation, the bending moment value is the largest at the thin plate position (0, ± b 2 , 0). Bond strength theory:
α t = 6 M y max h 2 2
where αt is the ultimate tensile strength, Mymax is the maximum bending moment at the long side position (0, ± b 2 , 0) of the thin plate, and h2 is the thickness of the aquiclude.
The limit span was obtained simultaneously:
a = 4 4 α t h 2 2 3 D C b 2
where C = 49 q 8 D ( 7 a 4 + 4 a 2 b 2 + 7 b 4 ) , D = E h 2 3 12 ( 1 ν 2 ) , q is theoretical load, q = 32 a t h 2 2 7 a 4 + 4 a 2 b 2 + 7 b 4 147 a 4 b 2 .
After analyzing the equation presented above, it can be observed that the bending moment generated on the four edges of the thin plate is related to both the aspect ratio and load of the plate. The maximum bending moment is found at the center position and along the longer edge. In the event of failure of the rectangular thin plate, the bottom rock layer fractures, creating a water inrush channel that triggers a sudden water accident. Hence, the ultimate span of the thin plate has been derived based on its ultimate strength.

2.2. Control Equations

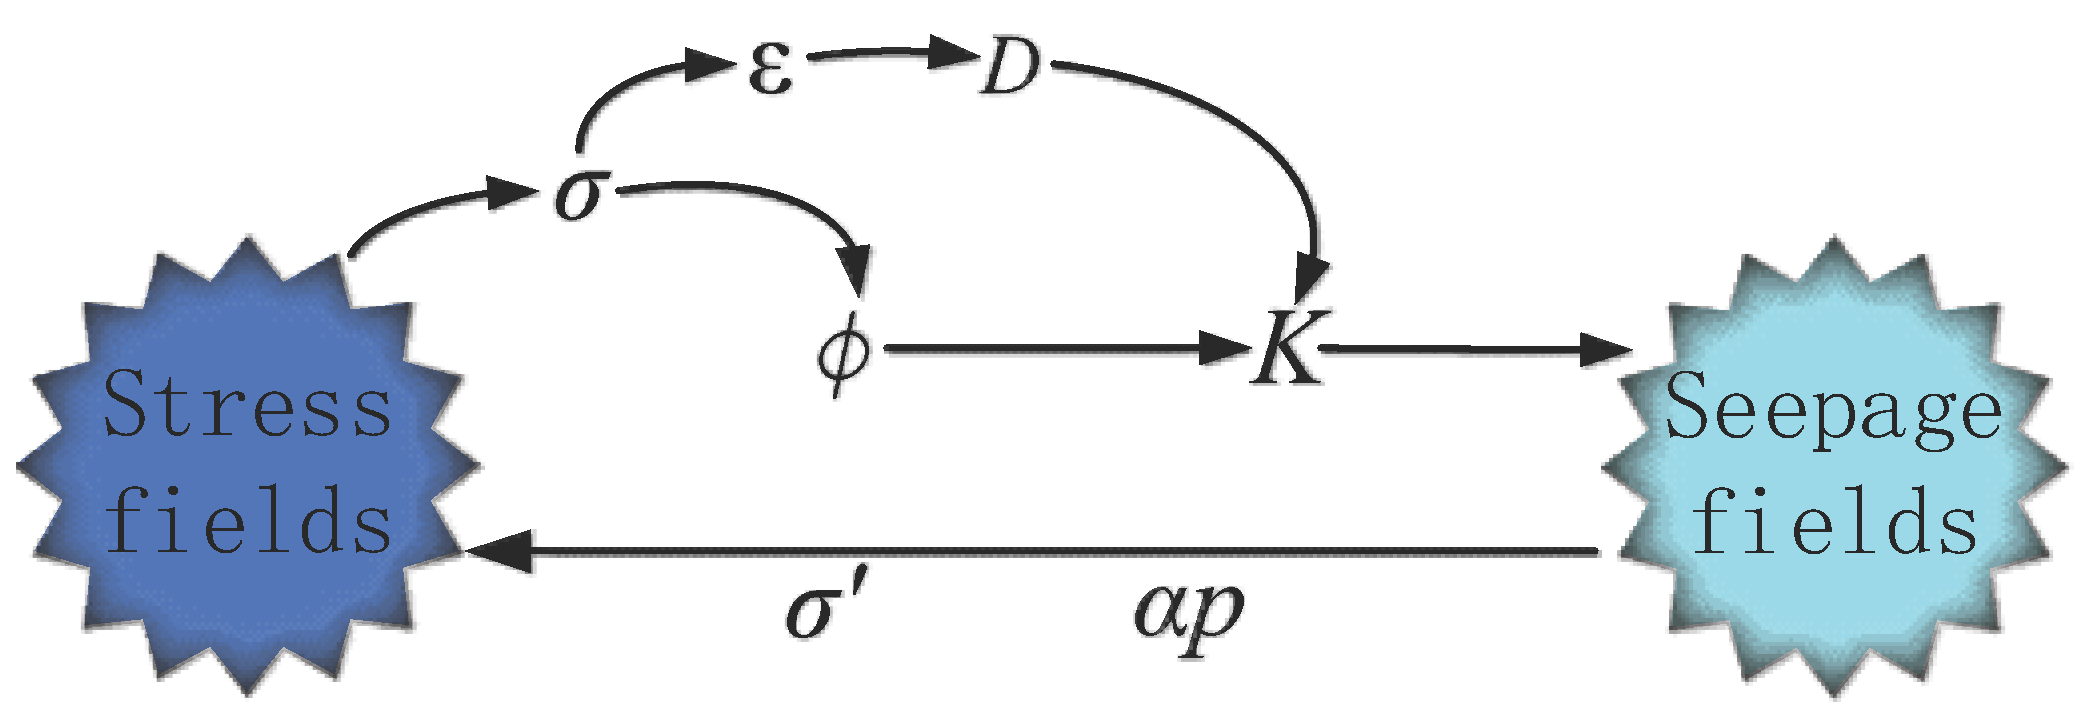
The process of water inrush in coal seams involves the coupling of multiphysics such as mechanical field and seepage field. The excavation of the coal seam destroyed the stress field of the original rock, the in-situ stress was redistributed, the rock mass was deformed when the stress exceeded the bearing capacity of the rock mass, and the change of stress state changed the strength and permeability characteristics of the rock mass. The seepage field acts on the stress field through the principle of effective stress, and the rock mass further induces damage evolution under the action of pore water pressure, which aggravates the damage of the seepage field to the rock mass, which is a two-way coupling process. The bidirectional coupling mechanism is shown in Figure 2.

2.2.1. Controlling Equations for Solid Mechanics

According to the theories of elasticity and porous media, considering the influence of pore water pressure, the control equation of the stress field (taking the tensile stress as a positive value) was obtained by the Biot effective stress principle [32]:
G u i ,   j j + G 1 2 v u j ,   j i α p , i + F i = 0
G = E 2 ( 1 + v )
E is the elastic modulus of the rock mass, GPa; G is the shear modulus, GPa; v is the Poisson’s ratio of the rock mass; ui is the displacement component; Fi is the physical component; α is Biot’s coefficient (0 ≤ α ≤ 1); p is pore water pressure, MPa.

2.2.2. Control Equations for Seepage Mechanics

Based on the mass conservation equation of the fluid and Darcy’s law, the seepage control equation was obtained:
· K γ w ( p + γ w z ) = Q s
where K is the permeability coefficient of the rock, m/s; γw is the gravity of the fluid, N/m3; z is the vertical coordinate; Qs is the mass source term.

2.2.3. Coupling Equations

The rock is damaged when the stress state of the rock reaches its strength limit. Therefore, the Mohr-Coulomb strength criterion with tensile strength is used as the criterion for judging the failure of rock. Moreover, the COMSOL Multiphysics software takes the tensile stress as positive, the tensile strength criterion and Mohr-Coulomb strength criterion are as follows:
F1 = σ1ft0
F2 = −σ1 + σ1[(1 + sinφ)/1 − sinφ] − fco
where ft0 is the uniaxial tensile strength, MPa; fc0 is the uniaxial compressive strength, MPa; φ is the angle of internal friction; σ1 is the maximum principal stress; σ3 is the minimum principal stress.
The damage evolution equation was used based on the principle of strain equivalence [33]:
D 1 = 0 F 1 < 0 , F 2 < 0 1 ε t 0 ε 1 F 1 0 1 ε t 0 ε 3 F 2 0
where D1 is the damage variable, D1 = 1 means complete destruction of the rock mass; εt0 is the maximum tensile strain; εc0 is the maximum compressive strain; ε1 is the maximum principal strain; ε3 is the minimum principal strain; n is the damage evolution coefficient, take n = 2, when F1 < 0, F2 < 0, no damage occurs.
In the actual coal seam mining process, the stress field of the rock mass is more complex, and it is necessary to generalize the evolution equation under the previous stress to three dimensions, and replace ε1 in the above equation with the equivalent principal strain and εc01 with εc0 in the above equation in the multiaxial stress state [34]:
ε _ = ε 1 2 + ε 2 2 + ε 3 2
x = 0 x < 0 x x > 0
ε c 01 = 1 E 0 f c 0 1 + sin φ 1 sin φ σ 1 + ν σ 3 + σ 2
The porosity of the rock layer has a negative exponential relationship with the effective stress, and when the tensile stress is positive, the relationship between the two can be expressed as [35]:
ϕ = ϕ 0 ϕ r exp α ϕ σ ¯ v + ϕ r
σ ¯ v = σ 1 + σ 2 + σ 3 / 3 + α p
where ϕ0 is the porosity of the rock mass under initial stress; ϕr is the limit value of the porosity of rock mass under high-pressure stress; αϕ is the stress sensitivity coefficient, take αϕ = 5.0 × 10⁻⁸ Pa−1; σ ¯ v is the average effective stress.
The permeability coefficient of rock is affected by porosity and damage, and its variation law is more complicated. The relationship between the three can be expressed by the following formula.
K = K0(ϕ/ϕ0)3 exp(αkD)
where K0 is the permeability coefficient under initial stress, m/s; αk is the influence coefficient of damage on the permeability coefficient, take αk = 5.0 [36].

2.3. Control Equations

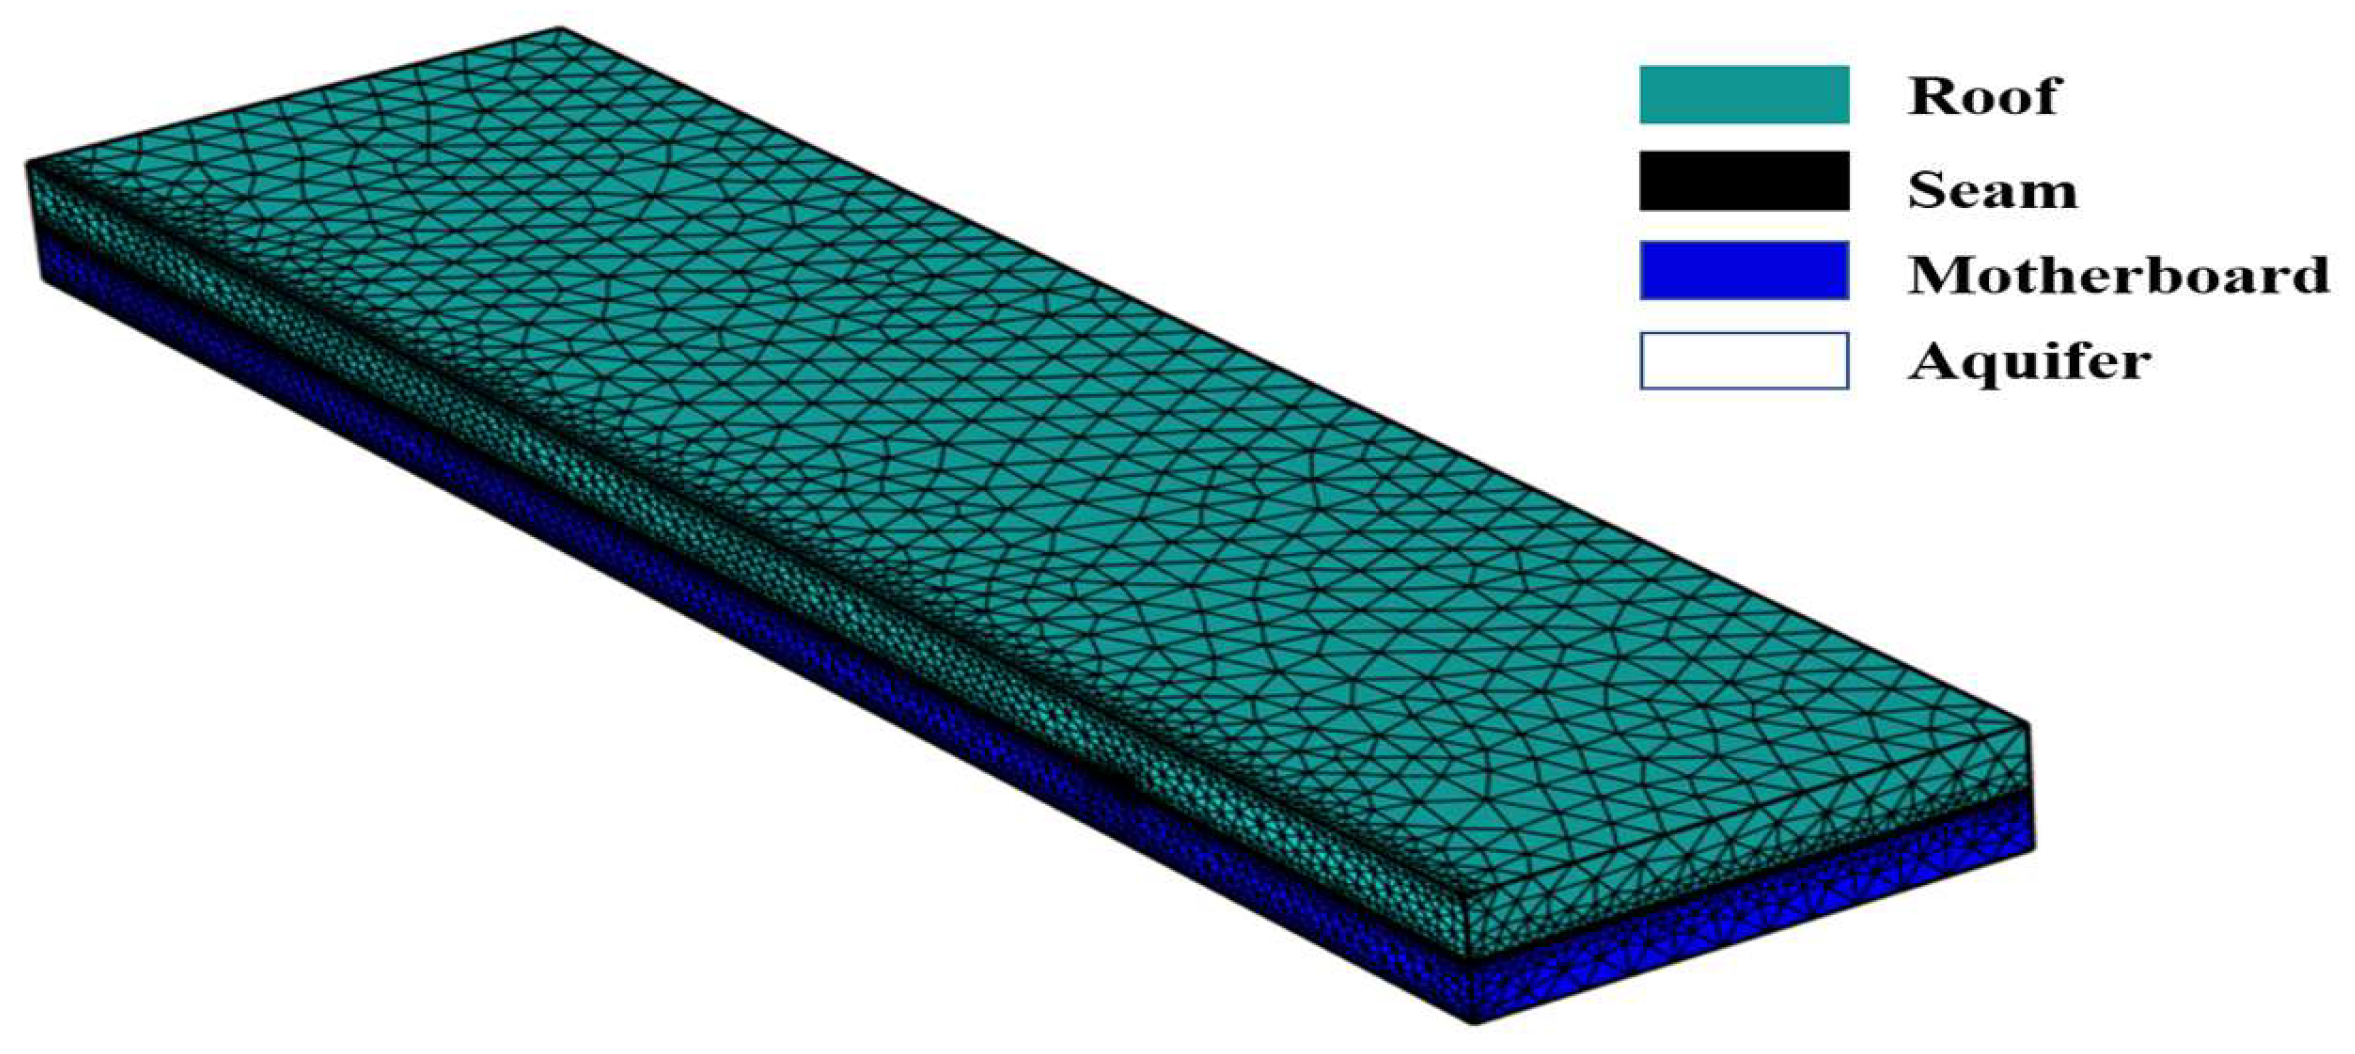
Based on the actual geological data of the 4103 working face in a mining area in Heshan, Guangxi, and according to the mining geological data and rock properties, numerical simulation software COMSOL Multiphysics was used to simulate and construct a flow-solid-damage coupling model for coal seam floor water inrush. The model has a length of 900 m in the y-direction and a width of 250 m, the thickness of the floor is 30 m. with the top of the model 150 m above the ground surface. Because the ratio of the thickness of the water-resisting layer to the width of the bottom plate is less than 1/6, the numerical simulation model conforms to the thin plate mechanics model. For a simulation with a coal seam thickness of 3 m, full mining height, excavation length of 10 m, and excavation steps of 10 m, the mechanical parameters and numerical model of the model are shown in Table 1 and Figure 3.
Mechanical boundary conditions: The front and rear as well as the left and right boundaries of the model are set with roller supports. The top boundary is subjected to the self-weight stress of the overlying strata, while the bottom is constrained with a fixed restriction that limits the normal displacement.
Seepage boundary conditions: The surrounding and bottom boundaries of the model are set as impermeable. During mining, the goaf is connected to the atmosphere, and a linearly increasing water pressure is applied to the top boundary of the aquifer to simulate the non-uniform impact of water pressure on the aquitard. The initial water pressure at the upper end of the aquifer is set to 1 MPa, 2 MPa, and 3 MPa to analyze the influence of water pressure on the damage to the coal floor.

3. Results

3.1. Influence of Mining Distance on Damage to the Bottom Slab

The augmentation of mining step distance precipitates alterations in the distribution of mining pressure, culminating in deleterious effects on the underlying rock layer. To address this issue, the actual operating conditions and coupled equations of the Heshan coal mine were utilized in a simulation study to investigate the impact of a water head pressure of 1 MPa on the damage sustained by the rock layer beneath the coal seam in the working face. The COMSOL Multiphysics software was employed for this purpose, and the resultant findings are exhibited in Figure 4.
In this study, the extent of damage in a coal mine was investigated using elastic-plastic mechanics. The damage was represented by areas with a damage factor greater than 1, which were considered completely damaged areas. A blue-to-red gradient was used to indicate an increasing degree of damage.
Figure 4a shows that, at a mining distance of 100 m, damage occurred in the roof and floor of the goaf, resulting in irreversible damage. Plastic deformation was observed in the underlying rock mass below the floor at the cutting eye and stopping the line. The damage factor was 0.3, with a small area of the floor caving zone experiencing complete plastic deformation, resulting in a damage factor of 0.1.
Figure 4b, the mining distance was increased to 150 m, and a significant change in the uplift of the damaged area below the floor at the cutting eye was observed. The damage factor increased from 0.3 to 0.7, with the plastic deformation zone and the completely plastic deformation zone at the tip both continuing to expand. The underlying rock mass below the goaf was disturbed by mining pressure, resulting in a damage factor of 0.7.
In Figure 4c, at a mining distance of 200 m and under a water head pressure of 1 MPa, the damaged area in the caving zone beneath the floor of the goaf expanded significantly, forming a “bowl-shaped” region of damage. The damage at the cutting eye did not change, and the damage factor at the stopping line reached 0.8 and was partially connected to the damaged area beneath the floor. The minimum damage factor around it was 0.3, and the plastic deformation zone continued to expand.
In Figure 4d, the mining distance was increased to 250 m, and the damage at the floor of the stopping line was more pronounced, with the maximum damage factor around the damaged area reaching 0.9. The damage at the floor of the cutting eye was also evident, with the maximum damage factor reaching 0.8 and the tip remaining relatively stable. The damaged area below the goaf continued to develop and tended to continue damaging towards the center, with the maximum damage factor reaching 0.9.
In Figure 4e, at a mining distance of 300 m, there was significant development of the damaged area below the floor of the stopping line, with the maximum damage factor at its tip reaching 0.8. The damage at the cutting eye remained almost unchanged, while the damaged area below the floor of the working face extended and expanded towards the middle of the aquifer, indicating that the location of water inrush from the floor of the working face is likely to occur at the center of the floor.
The results of this study demonstrate a significant distribution of damage in the floor during coal seam advance from 100 m to 300 m, with a tendency for the damage to concentrate towards the middle. These findings are highly consistent with the theoretical derivation of elastic-plastic mechanics, and the safe distance can be determined according to the formula for the maximum span distance (14).

3.2. The Influence of Water Pressure on the Damage of the Bottom Plate

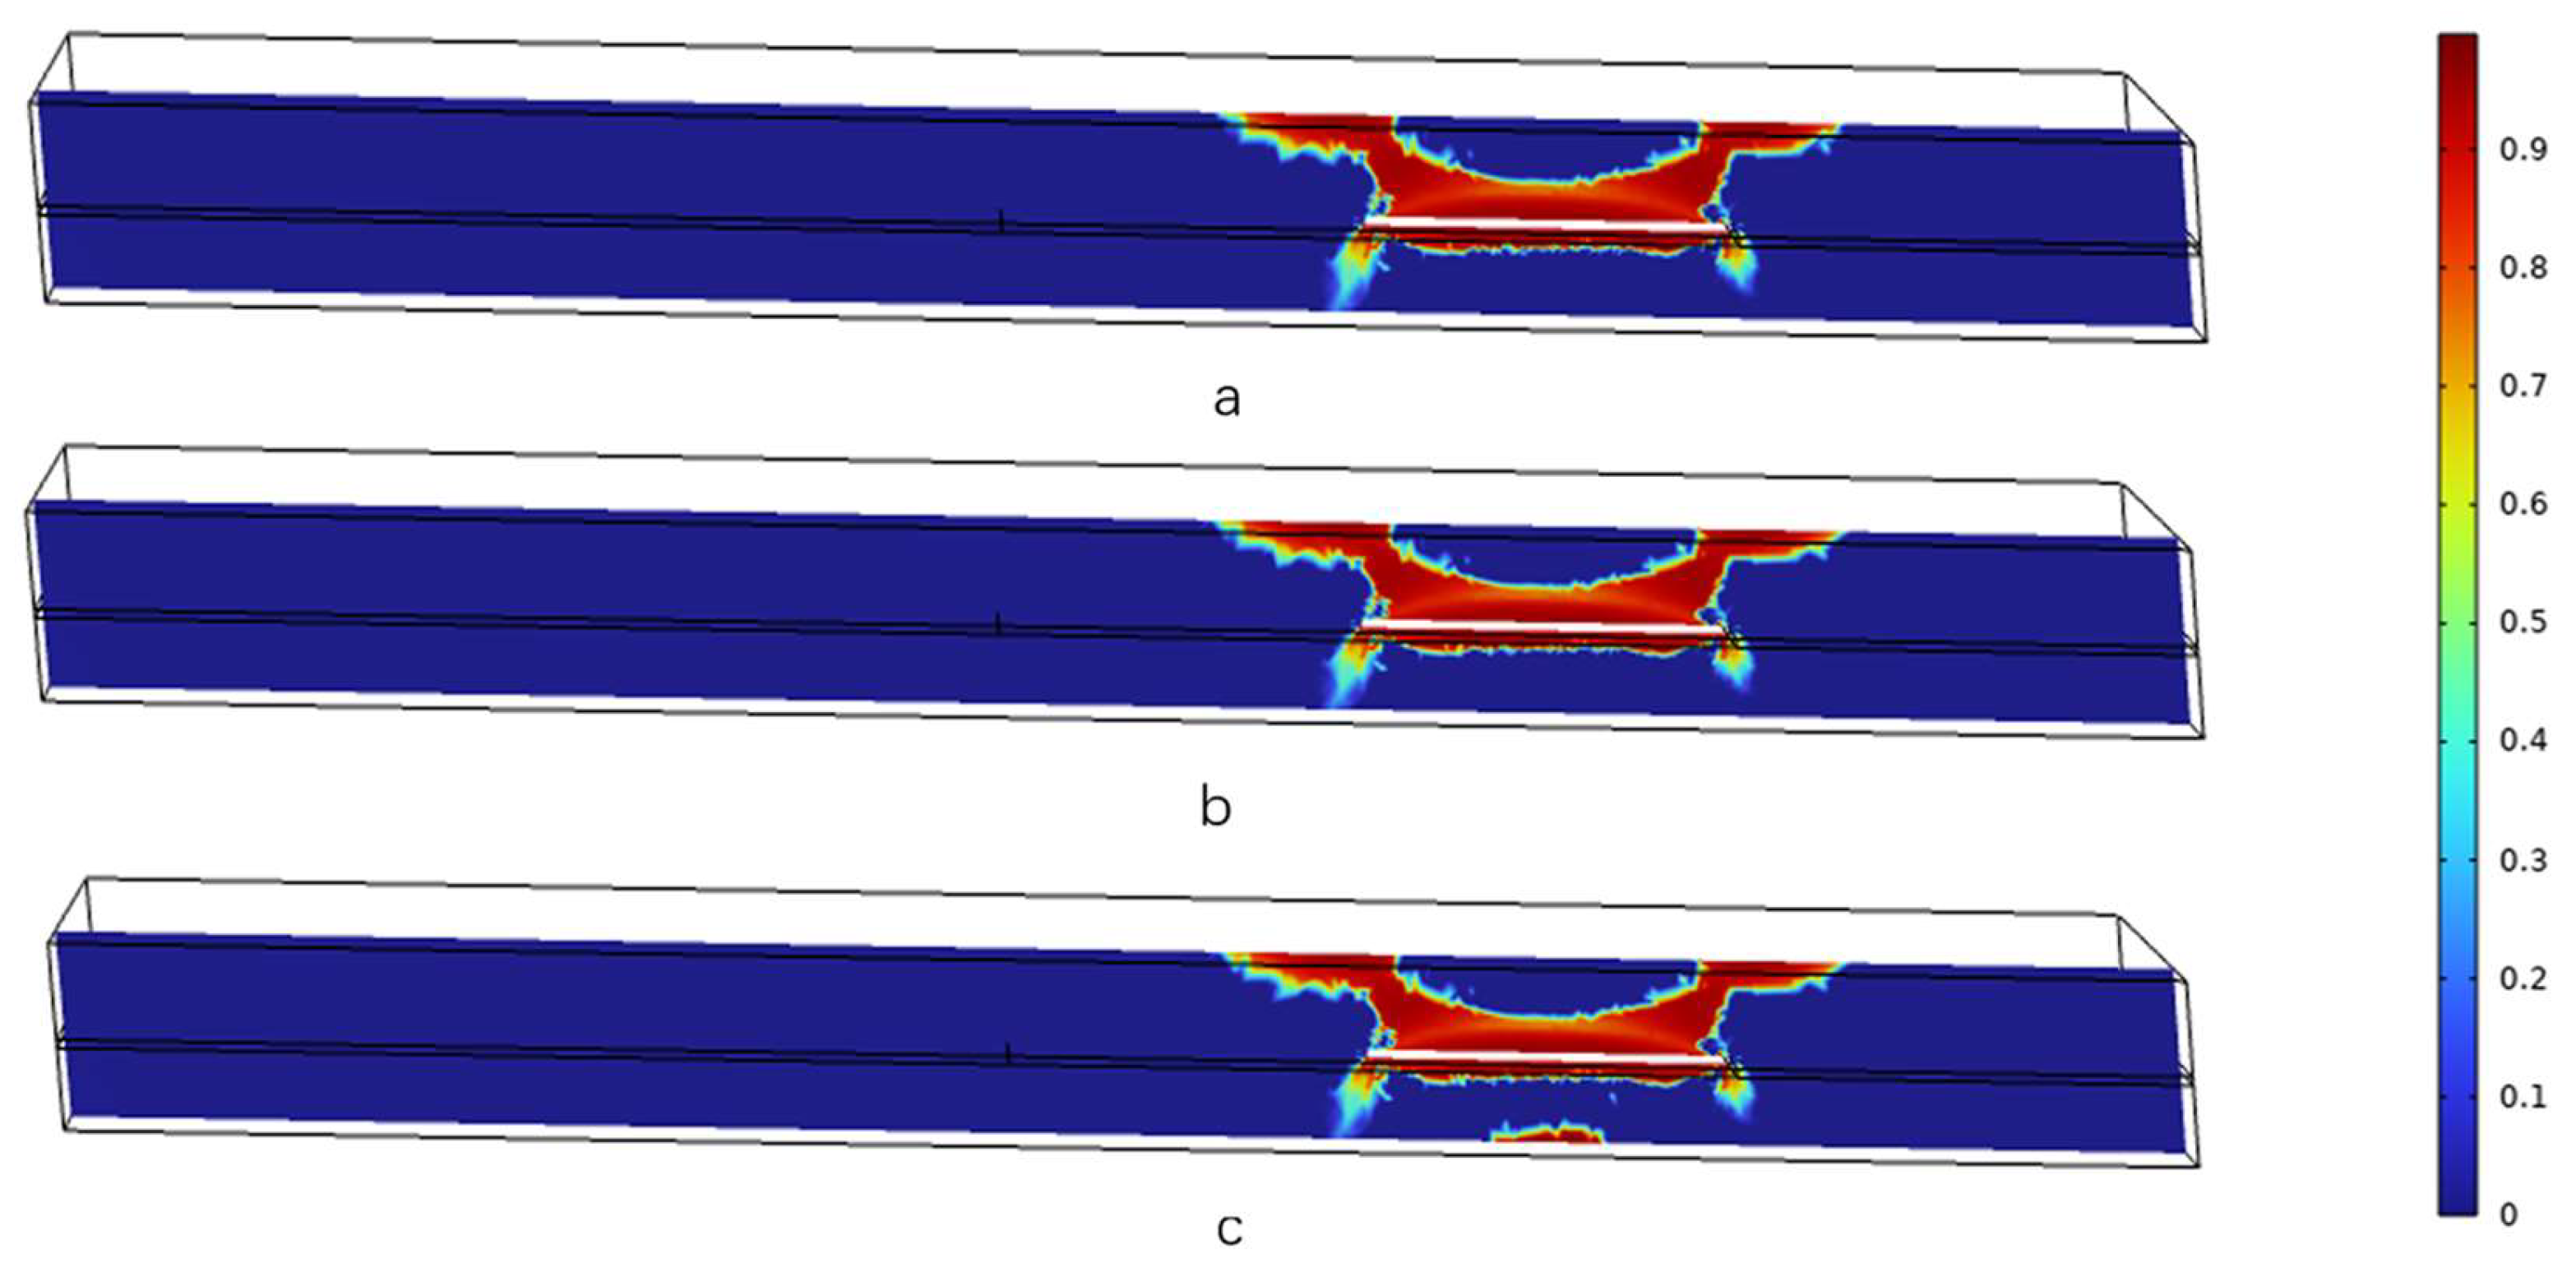
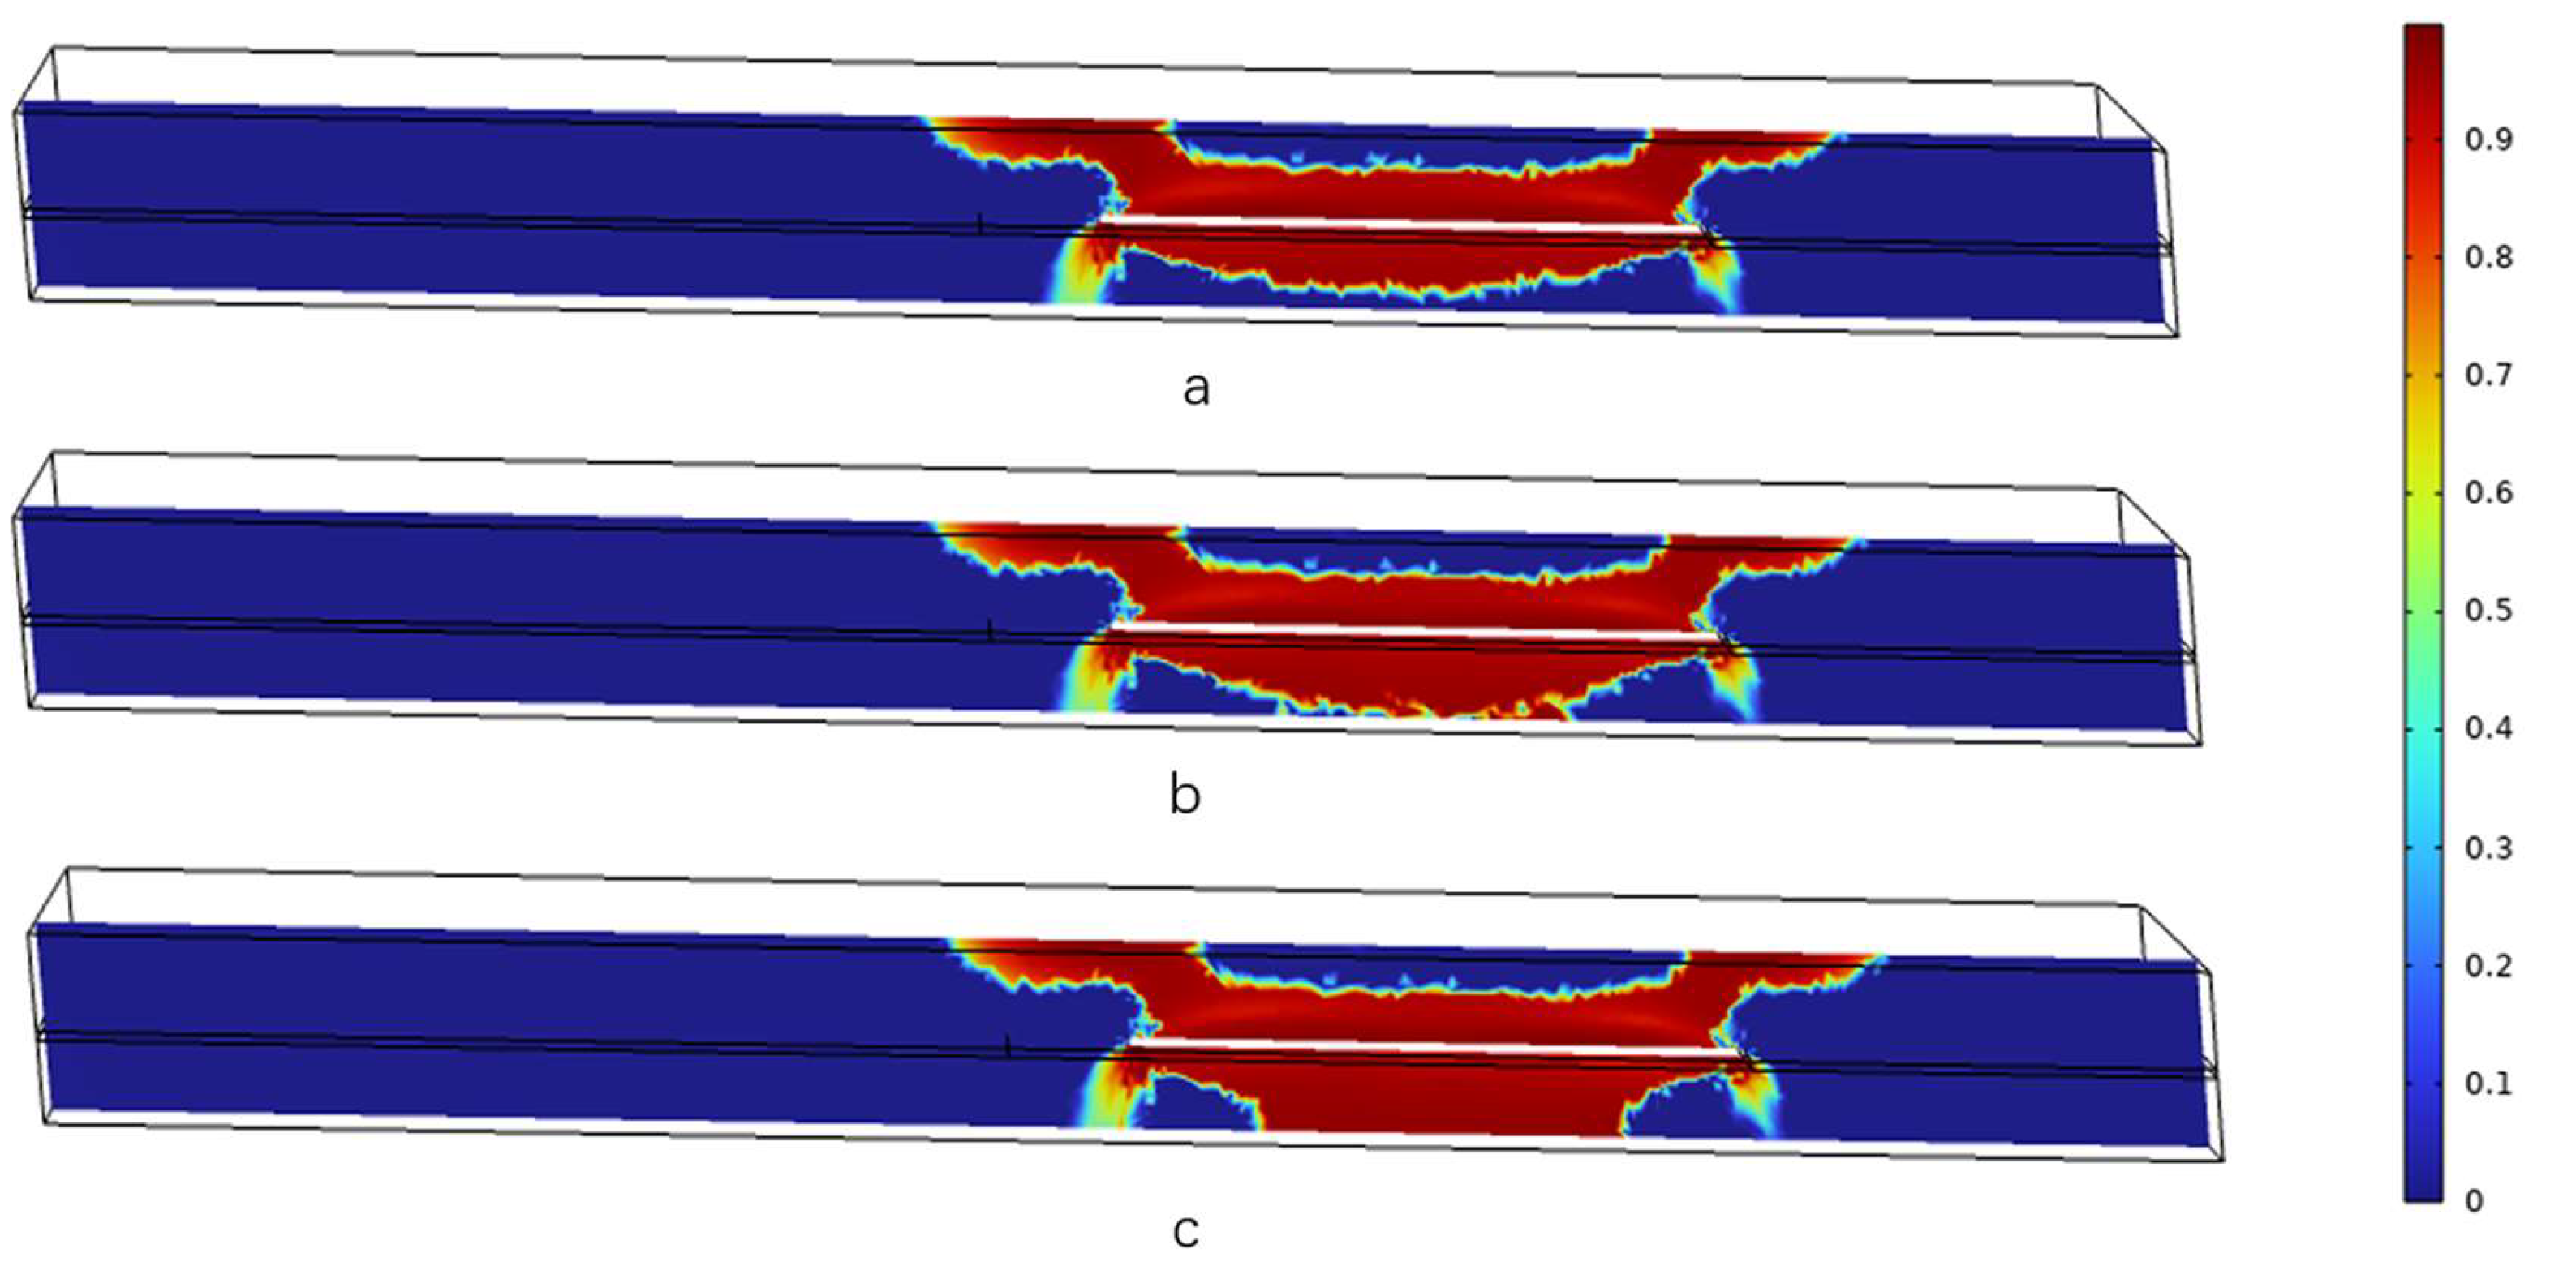
When mining above a confined aquifer, it is crucial to consider changes in water pressure. This study presents numerical simulation results of the damage to the floor under various water head pressures (1 MPa, 2 MPa, and 3 MPa) during coal seam mining at distances of 100 m, 150 m, 200 m, and 250 m, as depicted in Figure 5, Figure 6, Figure 7 and Figure 8.
Figure 5 shows that at a mining distance of 100 m, the increase in water head pressure from 1 MPa to 3 MPa resulted in more pronounced damage to the overlying roof strata. However, there was little change observed in the damage below the floor. Minor damage was only observed at the position of the underlying rock mass below the floor at the stopping line and cutting eye, indicating that the water pressure did not significantly disturb the rock mass below the goaf at this stage.
Figure 6 shows that at a mining distance of 150 m, the development of a damage zone beneath the bottom plate is observed gradually with an increase in hydraulic pressure from 1 MPa to 3 MPa. The stopping line and opening exhibit varying degrees of damage, however, the affected area remains confined with a maximum damage factor of 0.7. It is noteworthy that the rock layer located above the aquifer demonstrates a damaged zone only upon reaching a hydraulic pressure of 3 MPa, as evidenced by a maximum damage factor of 0.8.
Figure 7 shows that at a mining distance of 200 m, there is no communication between the damage zone beneath the goaf bottom plate and the aquifer in the underlying impermeable layer when the hydraulic pressure is at 1 MPa and 2 MPa. However, when the hydraulic pressure increases to 3 MPa, the damage zone in the impermeable layer and the aquifer become connected, which could form a water-conducting channel and trigger water inrush. Nevertheless, as the hydraulic pressure increases, the expansion of the damaged zone in the rock mass beneath the stopping line and the opening is not severe.
Figure 8 shows that at a mining distance of 250 m, the aquitard rock layer beneath the floor did not experience any aquifer penetration at water head pressures of 1 MPa and 2 MPa. However, at a water head pressure of 3 MPa, the damage zone between the aquitard and aquifer was observed to penetrate. At a water head pressure of 1 MPa, the damage below the floor of the stopping line and the cutting eye of the floor layer exhibited slow development, and the rock damage beneath the floor of the working face displayed a bowl-shaped pattern. During this period, the mining and breaking zone’s floor damage did not penetrate the aquifer, and no water inrush channel was formed. Upon increasing the water head pressure to 2 MPa, the damage zone at the stopping line expanded rapidly but did not penetrate the aquifer. However, the damage zone at the cutting eye remained relatively unchanged, suggesting that the secondary stress distribution tended to be stable at this location. The damage to the central rock layer in the mining and breaking zone’s floor intensified, ultimately penetrating the aquifer and assuming a funnel shape. Increasing the water head pressure to 3 MPa resulted in a small expansion area of the damage at the cutting eye below the floor; however, the damage at the stopping line had already penetrated the aquifer with a damage factor of 0.45. The central rock mass’s damage in the mining and breaking zone’s floor developed violently with a damage factor of 0.92, expanding to both sides while penetrating the aquifer. The damage zone manifested as an enlarged “funnel-shaped” water inrush probability.
As the water head pressure increases, the damage area and complete damage area expand, and the connected fractures continue to develop. At water head pressures of 1 MPa and 2 MPa, the changes in the damaged area at the stopping line and cutting eye are not significant, and the damage factor at the tip is relatively small, with a maximum damage factor of 0.5 and a relatively slow penetration rate. However, the fractures beneath the floor of the goaf develop rapidly, forming a damage area. When the water head pressure is increased to 3 MPa, the damage area at the stopping line and cutting eye expands, and the damage factor at the tip is larger than that at water pressures of 1 and 2 MPa, with a maximum damage factor of 0.6. The fractures gradually penetrate. When the water head pressure reaches 3 MPa, at distances of 200 m and 250 m, the damage area of the aquitard layer is connected to the aquifer layer at the center position, which may cause water inrush accidents in this area.

3.3. Distribution Law of Stress

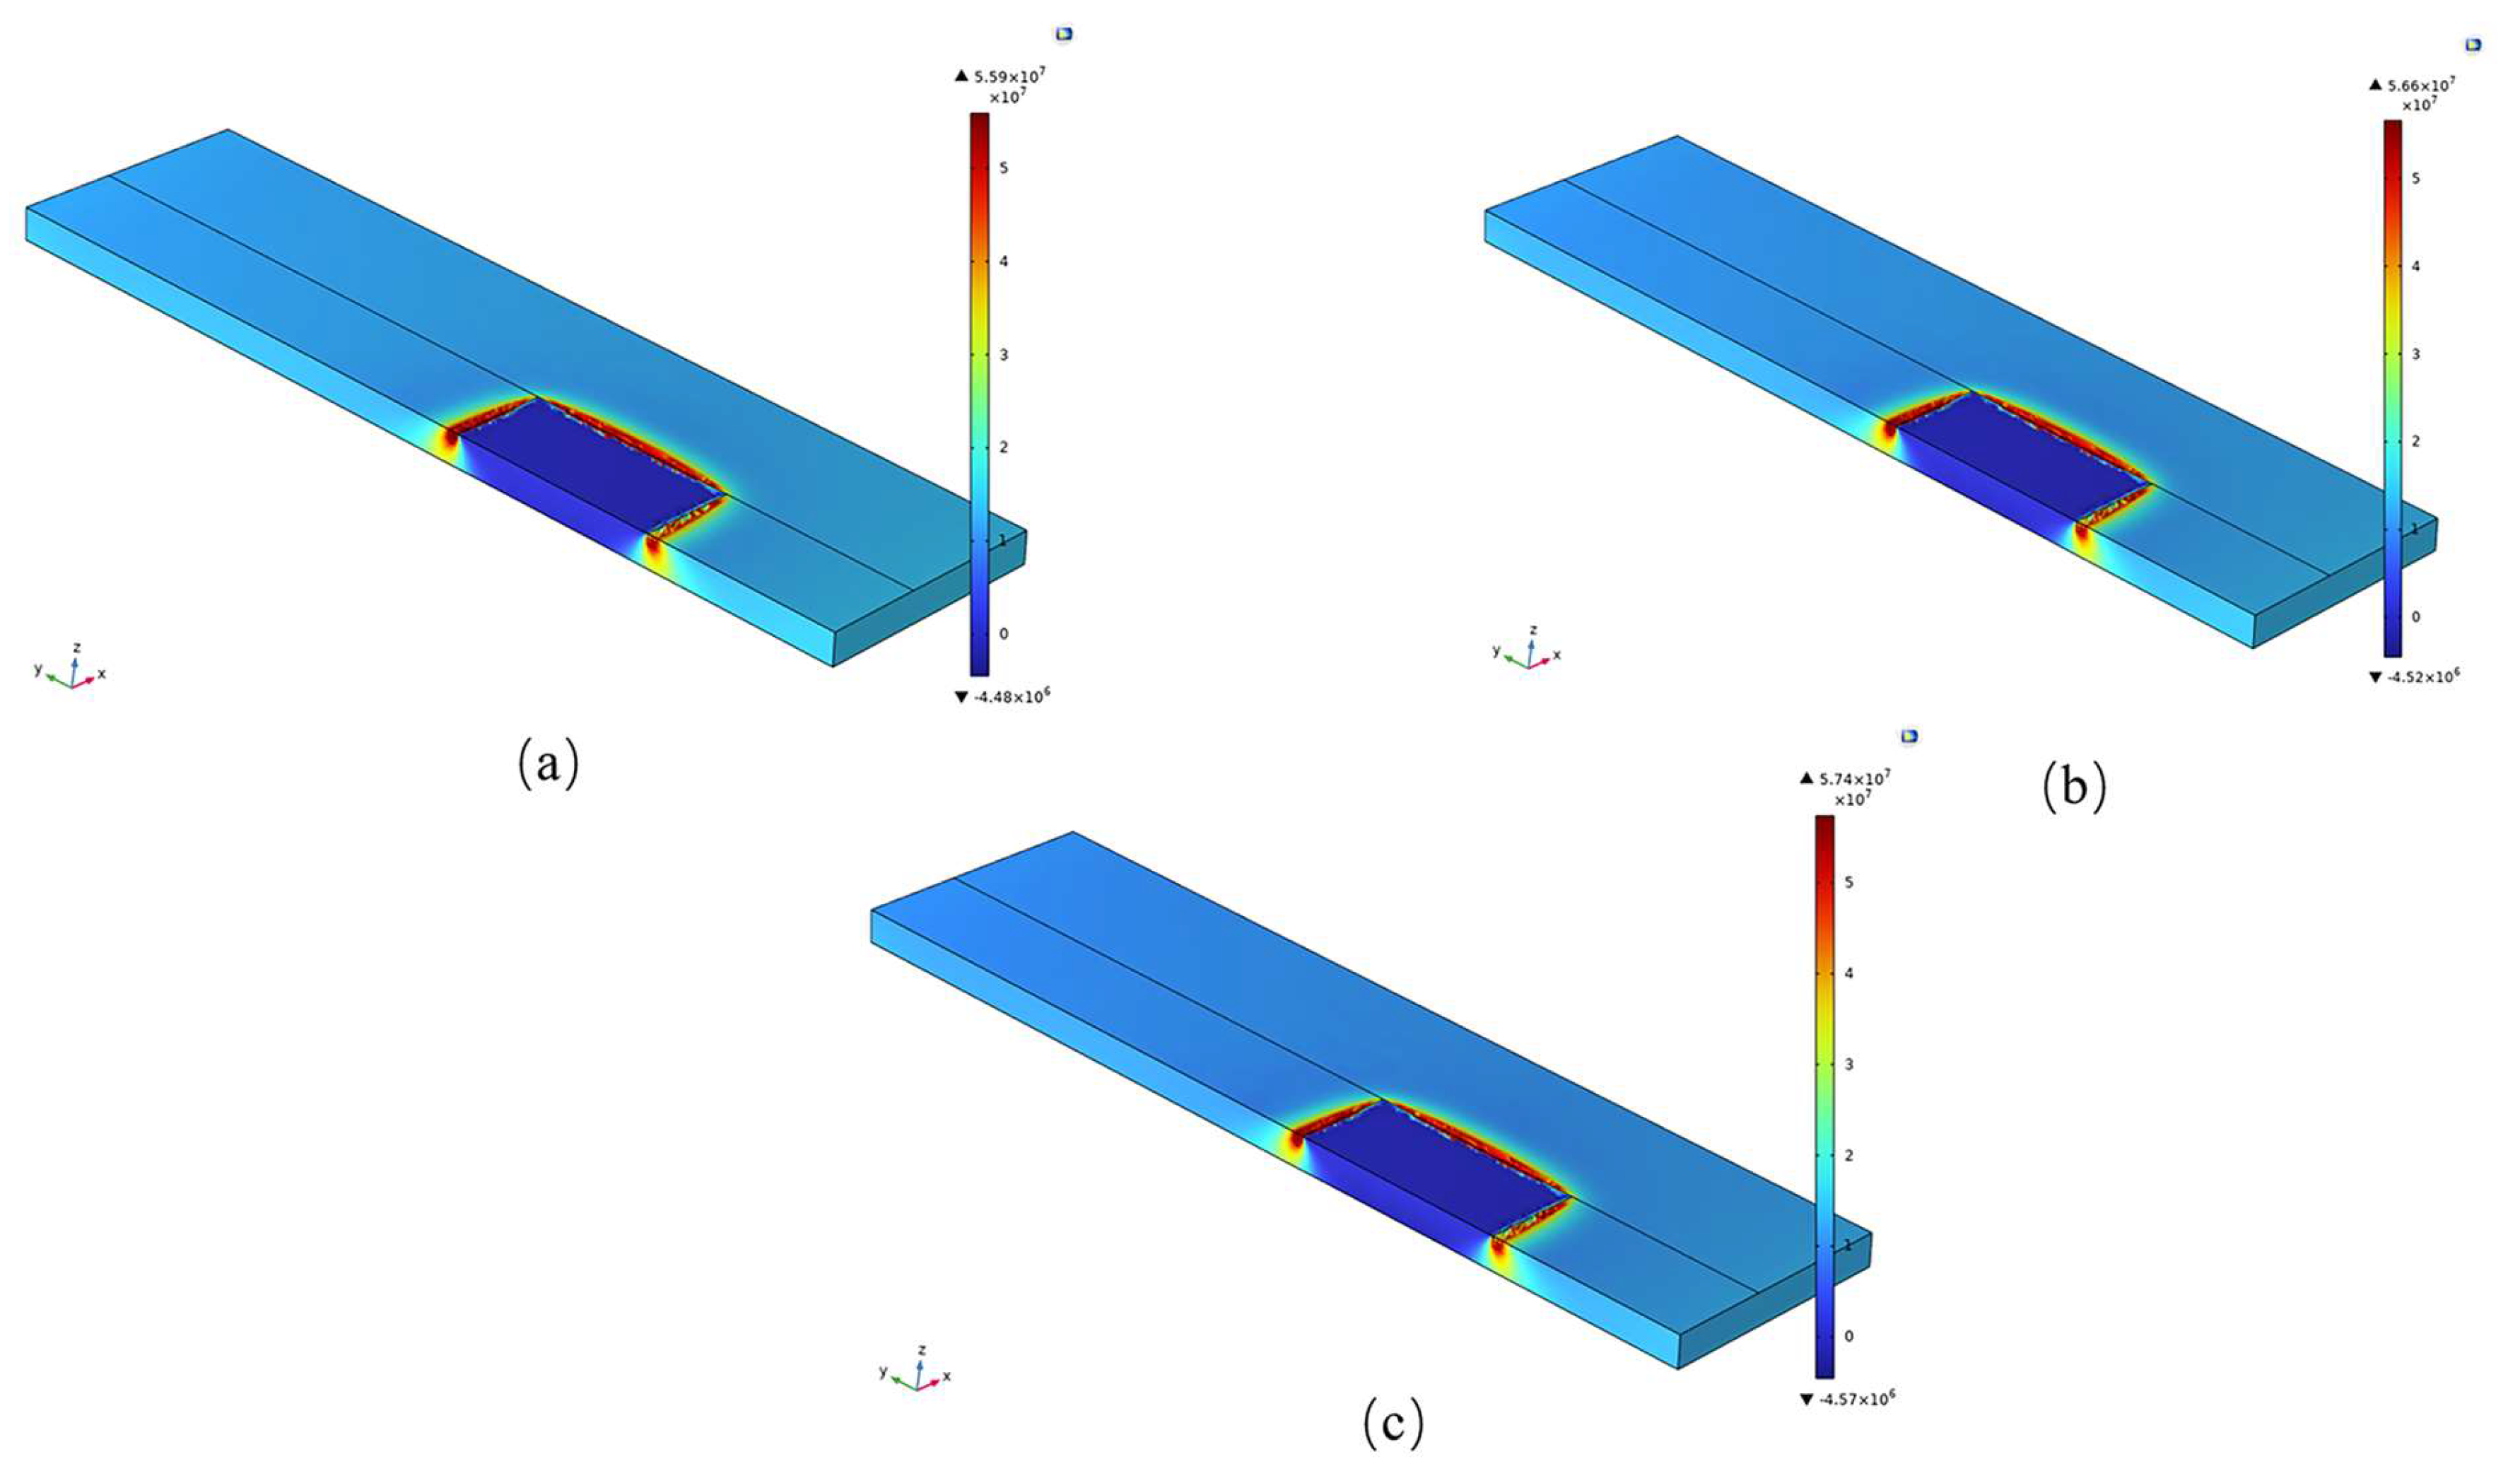
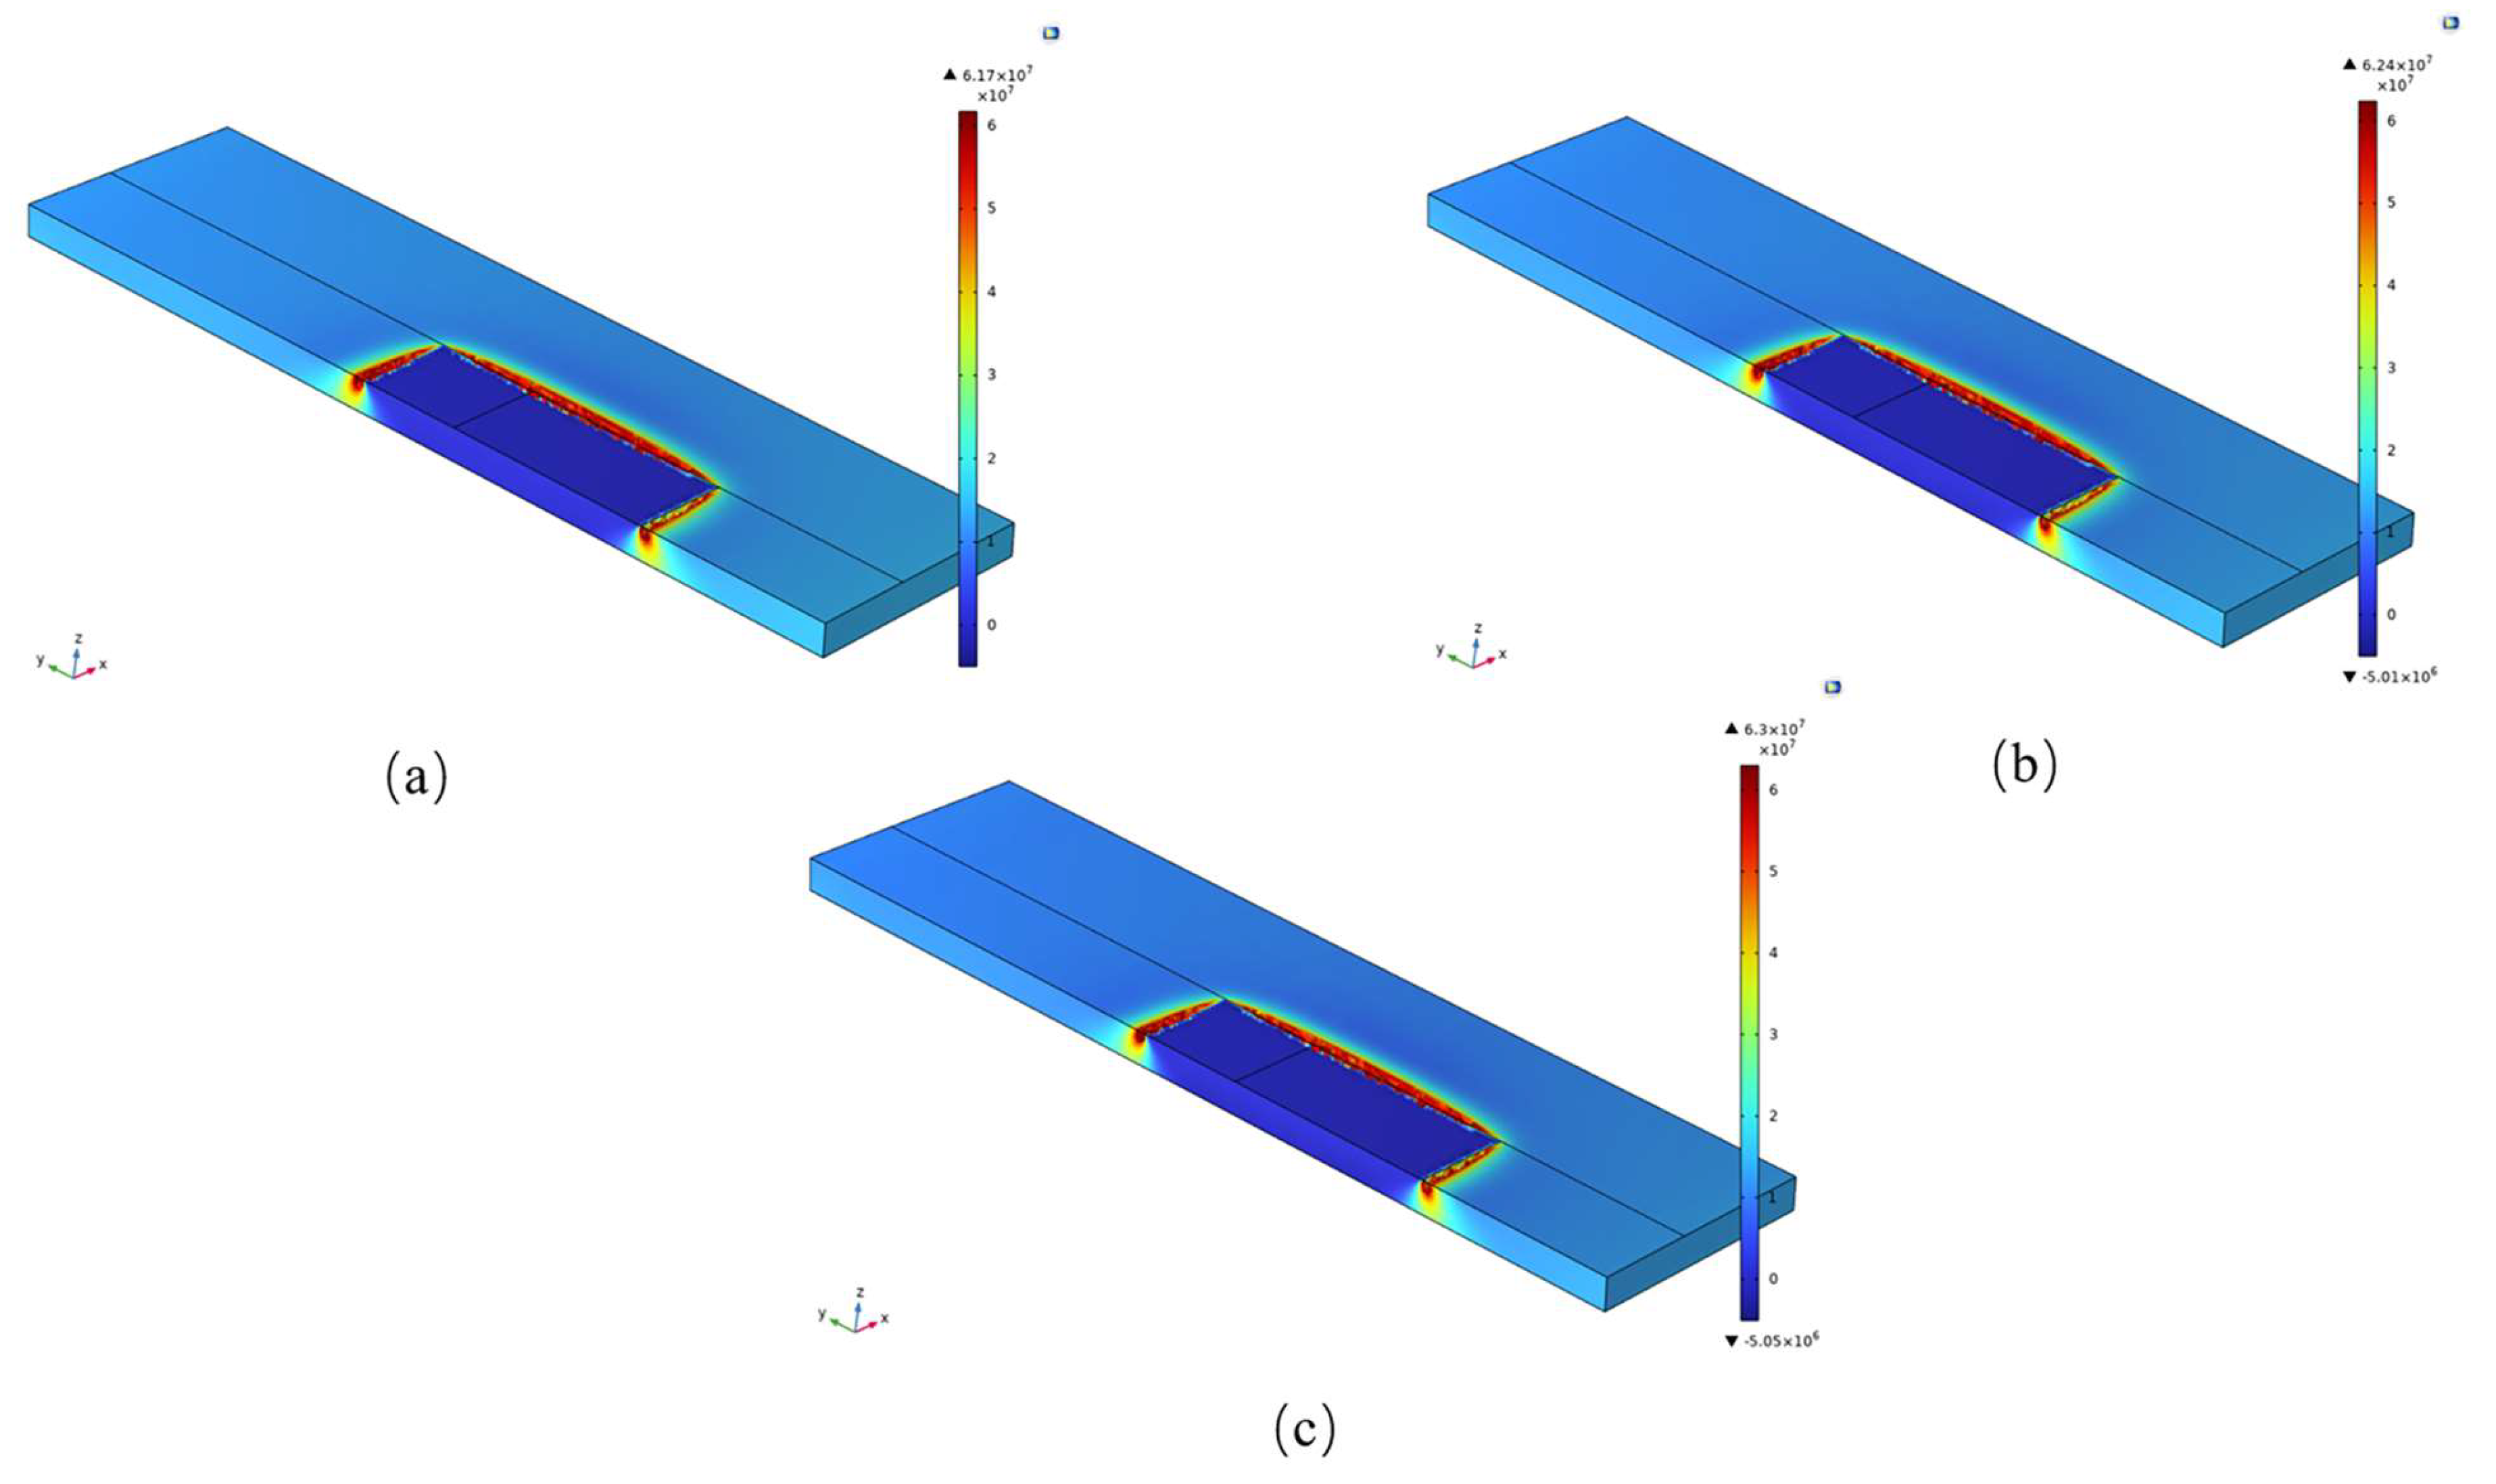
After the coal seam is excavated, the original rock stress field is disrupted, and the stress field in the goaf is redistributed. The magnitude of horizontal and vertical stresses and their affected areas also constantly change. The stress variation of the floor generally goes through four stages: original rock stress, stress concentration, stress release, and gradual compaction. At the same time, the vertical stress of the roof and floor will change, and the vertical stress and damage of the floor will increase continuously. According to the stress distribution obtained by the COMSOL Multiphysics software, the vertical stress distribution of the floor in the goaf under a water pressure of 1, 2, and 3 MPa is shown in Figure 9 and Figure 10 When the mining distance is 200 m, under 1 MPa water pressure, the vertical stress at the center of open-off cut, stop line and coal wall side is 4.39 × 10⁷ MPa, 5.59 × 10⁷ MPa and 5.06 × 10⁷ MPa, respectively. Under 2 MPa water pressure, they are 4.52 × 10⁷ MPa, 5.66 × 10⁷ MPa, and 5.22 × 10⁷ MPa, respectively. Under 3 MPa water pressure, they are 4.86 × 10⁷ MPa, 5.74 × 10⁷ MPa, and 5.54 × 10⁷ MPa, respectively. When the mining distance is 300 m, under 1 MPa water pressure, the vertical stress at the center of the open-off cut, stop line, and coal wall side is 4.67 × 10⁷ MPa, 5.39 × 10⁷ MPa, and 6.17 × 10⁷ MPa, respectively. Under 2 MPa water pressure, they are 4.71 × 10⁷ MPa, 5.49 × 10⁷ MPa, and 6.24 × 10⁷ MPa, respectively. Under 3 MPa water pressure, they are 4.82 × 10⁷ MPa, 5.49 × 10⁷ MPa, and 6.3 × 10⁷ MPa, respectively. It can be seen that the vertical stress concentration phenomenon is more obvious in the opening cut, stopping line, and both sides of the coal wall due to the cumulative effect of strain energy in the goaf. The most significant stress concentration occurs on both sides of the coal wall and the stopping line, which can easily form a large-scale shear failure zone. When the water pressure and mining pressure reach a certain degree, they can lead to the penetration of the aquifer and the impervious layer, forming a water-conducting channel and causing a water inrush accident.
According to the coal seam parameters and thin plate theory, the deflection surface of the thin plate is calculated by MATLAB software. The deflection changes are most significant during the mining at 200 m and 300 m, as shown in Figure 11 and Figure 12.
Figure 11a shows a maximum deflection of 0.083 m under a water head pressure of 1 MPa, while Figure 11b shows a maximum deflection of 0.138 m under a water head pressure of 2 MPa, and Figure 11c shows a maximum deflection of 0.252 m under a water head pressure of 3 MPa. Figure 12a shows a maximum deflection of 0.15 m under a water head pressure of 1 MPa, Figure 12b shows a maximum deflection of 0.3 m under a water head pressure of 2 MPa, and Figure 12c shows a maximum deflection of 0.45 m under a water head pressure of 3 MPa. By analyzing the data, it can be concluded that under a water head pressure of 1 MPa, the deflection difference of the plate between the mining distance of 200 m and 300 m is 0.067 m, while under a water head pressure of 2 MPa, the deflection difference of the plate is 0.162 m, and under a water head pressure of 3 MPa, the deflection difference is 0.198 m. When the mining distance is 200 m, the deflection difference of the plate under a water head pressure of 1 MPa and 2 MPa is 0.055 m and 0.114 m, respectively. When the mining distance is 300 m, the deflection difference of the plate under a water head pressure of 1 MPa, 2 MPa, and 3 MPa is 0.15 m. The data comparison shows that the mining distance has a greater impact on the damage to the floor, and the water head pressure has an exacerbating effect on the damage to the floor rock mass until complete damage.
According to Figure 1b:
q = p γ h 1 + h 2
Therefore, the ultimate water pressure that the center position of the floor can withstand was obtained:
q = 32 a t h 2 2 7 a 4 + 4 a 2 b 2 + 7 b 4 147 a 4 b 2
p m = 32 a t h 2 2 7 a 4 + 4 a 2 b 2 + 7 b 4 147 a 4 b 2 + γ h 1 + h 2
where pm is the ultimate water pressure that the floor can bear, MPa; h1 is the thickness of the mining failure zone, m; h2 is the thickness of the water-resisting belt, m; a is the length of floor aquifuge, m; b is the width of working face, m.
The maximum water pressure that the floor water barrier can withstand is parabolically related to the thickness of the water barrier and is influenced by the ultimate tensile strength of the floor rock layer, the mining distance, and the width of the working face. When the actual water pressure that the floor bears exceeds the maximum water pressure that the floor water barrier can withstand, the floor water barrier is damaged, and the water-bearing layer is penetrated, resulting in a sudden inflow of water. Through numerical simulation, the extent of floor damage was analyzed under different mining distances and different mining water pressures, and it was found that the maximum water pressure that the floor water barrier can withstand is around 2 MPa. Based on the actual mining and geological conditions of the 4103 working face in Heshan Mine, each parameter was plugged into the equation and it was calculated that the floor can withstand a maximum water pressure of approximately 1.34 MPa without experiencing a sudden inflow of water. The numerical simulation results are highly consistent with the theoretical equation calculations, so this research is very meaningful. Considering the suddenness of floor inflow and the risks associated with mining under pressure, preventive measures should be strengthened during the mining process of the 4103 working face, with timely feedback on the maximum water pressure during mining and corresponding measures taken accordingly.

4. Discussion

Analysis of the thin plate mechanics model and numerical simulation results show a relatively good agreement. The theoretical equations indicate that the maximum bending moment occurs at the center of each side of the rectangular thin plate, with the larger bending moment occurring at the longer side. This suggests that when the bending moment of the working face floor reaches its maximum value, the center position near each side of the floor will break, forming a water inrush channel. Based on previous studies [25,26,27], the theoretical formulas for the maximum span Equation (17) and maximum water pressure Equation (31) were derived using thin plate mechanics theory. Regarding numerical simulations, most researchers have simulated the stress and seepage fields and the plastic zone variation during coal mining [20,21,22]. In this study, solid mechanics, fluid mechanics, and damage-coupled theory were used as the basis for simulating the changes in the damage factor of the aquifer rock mass during the dynamic process of coal mining using COMSOL Multiphysics software. The results showed that with the change in mining distance and pore water pressure, the damage zone of the aquifer rock mass in the floor of the aquifer tended to develop towards the center and both sides, which is highly similar to the conclusion of the rectangular thin plate mechanics model. In the stress field changes during the numerical simulations, it was found that the stress was relatively concentrated at the cutting eye, stopping line, and both sides of the coal wall floor, with particularly high-stress concentrations at both sides of the coal wall. With the increase of pore water pressure and mining distance, the critical water inrush state was simulated without considering other factors, as shown in Figure 13. By combining the deflection equation with MATLAB, the maximum deflection before water inrush can be obtained. It was found that the floor heave of the 4103 working faces of Heshan Mine exceeding 15 cm for a prolonged period of time is highly likely to result in water inrush.
Combining the above research results, the safe mining of pressurized aquifers can be ensured to some extent. Safe mining distance and safe water pressure are determined by numerical simulation results and theoretical equations. When the safe mining distance and safe water pressure are exceeded, preventive measures such as pre-setting waterproof coal pillars, timely manual roof caving, water drainage, grouting reconstruction, etc., should be taken.
This study used the combination of elastoplastic theory and numerical simulation, which can serve as a theoretical basis for the study of continuous media rock layers under various mining conditions. However, in practical geological and mining conditions, further research is needed based on different conditions and factors. The conclusions drawn in this study can still provide a certain theoretical foundation for mining in pressurized aquifers. The future direction of this research could incorporate Weber distribution to study the damage condition of roofs and floors under non-continuous media rock conditions and predict the risk of water inrush in mining faces.

5. Conclusions

(1)
Simplifying the water-resistant layer beneath the bottom plate as a rectangular thin plate with four-side fixed support is feasible for study as reported in references [23,24,25,26,27,28,29,30,31]. Supported by the actual working conditions of the 4103 working face in the Heshan coal mine, the theoretical formulae for the maximum span, maximum water pressure, and peak position of the bending moment were derived through thin plate mechanics. The results of the fluid-solid coupling analysis in the COMSOL Multiphysics software showed that the bottom plate rock mass exhibited different degrees of damage and that the damage tended to occur at the center of the bottom plate under different water head pressures and mining distances. During the dynamic mining process of coal seam, the vertical stress was concentrated in the center positions of the cutting eye, stop line, and coal wall. The results of the two methods were highly consistent, and further accurately predicted the risk of water inrush from the bottom plate in the coal mining face
(2)
Combining the relationship between stress and deflection function in the theory of elasticity, the deflection surface of the four-sided fixed thin plate under the influence of mining distance of 200 m, 300 m, and water pressure of 1 MPa, 2 MPa, 3 MPa is plotted using Matlab software. By analyzing the results, it is found that when the deflection of the four-sided fixed plate exceeds 0.15 m, the central position of the bottom plate, the stopping line, and the center of both sides of the coal wall are prone to water inrush. Under the same water pressure, the increase in mining distance has a greater impact on the maximum deflection of the fixed plate, indicating that under the same conditions, the increase in mining distance causes more damage to the bottom plate.
(3)
Based on the actual production situation of the 4103 working faces in Heshan mine, the method of using the elastic-plastic theory to simplify the waterproof layer of its bottom plate as a thin plate subjected to uniformly distributed loads on all sides for mechanical analysis and numerical simulation is feasible and can effectively predict the danger of bottom water inrush of the coal mining face, which provides great safety assurance for coal mine operation.

Author Contributions

Conceptualization, X.L. (Xiaoquan Li); Methodology X.L. (Xiaoquan Li); Investigation, H.L. and X.L. (Xiaoquan Li); Data curation, H.L. and X.L. (Xiaoyan Liu); Visualization, H.L., Z.Y., Y.Z. and Y.S.; Writing—original draft preparation, H.L.; Writing—review and editing, H.L. and X.L. (Xiaoyan Liu). All authors have read and agreed to the published version of the manuscript.

Funding

This research was funded by the Natural Science Foundation of China (Grant No. 52264014) and the Guangxi Natural Science Foundation Project (Grant No. 2020GXNSFAA297037).

Institutional Review Board Statement

Not applicable.

Informed Consent Statement

Not applicable.

Data Availability Statement

The data used to support the finding of this study are available from the corresponding author upon request.

Conflicts of Interest

The authors declare no conflict of interest.

Nomenclature

ωdeflection
athe long side length of the plate
bthe length of the short side of the plate
Cmundetermined coefficient
mpositive integer
4laplacian
Mx, Mybending moment
h2the thickness of the water barrier layer
αtultimate tensile strength
Dflexural rigidity
qtheoretical load
Erock elastic modulus
νpoisson ratio
Gshear modulus
uioffset component
Fibody force component
αBiot’s coefficient
ppore water pressure
Kthe permeability coefficient of rock mass
γwthe gravity of the fluid
zvertical direction coordinates
Qsquality source items
fc0single axis compressive strength
φthe angle of internal friction
σ1maximum principal stress
σ3minimum principal stress
D1damage variable
εt0maximum circumferential strain
εc0maximum compressive strain
ε1maximum principal strain
ε3Minimum principal strain
ndamage evolution coefficient
ϕ0the porosity of rock mass under the initial stress state
ϕrthe limit value of rock porosity under high-pressure stress
αϕstress sensitivity coefficient.
σ ¯ v mean effective stress
K0permeability coefficient under the initial stress state
αkinfluence coefficient of damage on the permeability coefficient

References

  1. Brücker, C.; Preuße, A. The future of underground spatial planning and the resulting potential risks from the point of view of mining subsidence engineering. Int. J. Min. Sci. Technol. 2020, 30, 93–98. [Google Scholar] [CrossRef]
  2. Su, F.-q.; Itakura, K.-i.; Deguchi, G.; Ohga, K. Monitoring of coal fracturing in underground coal gasification by acoustic emission techniques. Appl. Energy 2017, 189, 142–156. [Google Scholar] [CrossRef]
  3. Wang, J.; Dong, Y.; Wu, J.; Mu, R.; Jiang, H. Coal production forecast and low carbon policies in China. Energy Policy 2011, 39, 5970–5979. [Google Scholar] [CrossRef]
  4. Guo, F.; Jiang, G.; Yuan, D.; Polk, J.S. Evolution of major environmental geological problems in karst areas of Southwestern China. Environ. Earth Sci. 2013, 69, 2427–2435. [Google Scholar] [CrossRef]
  5. Fan, K.; Li, W.; Wang, Q.; Liu, S.; Xue, S.; Xie, C.; Wang, Z. Formation mechanism and prediction method of water inrush from separated layers within coal seam mining: A case study in the Shilawusu mining area, China. Eng. Fail. Anal. 2019, 103, 158–172. [Google Scholar] [CrossRef]
  6. Hebblewhite, B. Fracturing, caving propagation and influence of mining on groundwater above longwall panels–a review of predictive models. Int. J. Min. Sci. Technol. 2020, 30, 49–54. [Google Scholar] [CrossRef]
  7. Hou, X.; Shi, W.; Yang, T. A non-linear flow model for the flow behavior of water inrush induced by the karst collapse column. RSC Adv. 2018, 8, 1656–1665. [Google Scholar] [CrossRef]
  8. Huang, Z.; Zeng, W.; Zhao, K. Experimental investigation of the variations in hydraulic properties of a fault zone in Western Shandong, China. J. Hydrol. 2019, 574, 822–835. [Google Scholar] [CrossRef]
  9. Li, P. Mine Water Problems and Solutions in China. Mine Water Environ. 2018, 37, 217–221. [Google Scholar] [CrossRef]
  10. Li, S.; Ma, C.; Liu, R.; Chen, M.; Yan, J.; Wang, Z.; Duan, S.; Zhang, H. Super-absorbent swellable polymer as grouting material for treatment of karst water inrush. Int. J. Min. Sci. Technol. 2021, 31, 753–763. [Google Scholar] [CrossRef]
  11. Ma, D.; Duan, H.; Zhang, J.; Bai, H. A state-of-the-art review on rock seepage mechanism of water inrush disaster in coal mines. Int. J. Coal Sci. Technol. 2022, 9, 50. [Google Scholar] [CrossRef]
  12. Ma, D.; Wang, J.; Li, Z. Effect of particle erosion on mining-induced water inrush hazard of karst collapse pillar. Environ. Sci. Pollut. Res. 2019, 26, 19719–19728. [Google Scholar] [CrossRef] [PubMed]
  13. Sun, W.; Zhou, W.; Jiao, J. Hydrogeological Classification and Water Inrush Accidents in China’s Coal Mines. Mine Water Environ. 2016, 35, 214–220. [Google Scholar] [CrossRef]
  14. Xing, M.; Li, W.; Wang, Q.; Yang, D. Risk prediction of roof bed-separation water inrush in a coal mine. China. Electron. J. Geotech. Eng. 2015, 20, 301–312. [Google Scholar]
  15. Bi, Y.; Wu, J.; Zhai, X. Quantitative prediction model of water inrush quantities from coal mine roofs based on multi-factor analysis. Environ. Earth Sci. 2022, 81, 314. [Google Scholar] [CrossRef]
  16. Dong, S.; Wang, H.; Guo, X.; Zhou, Z. Characteristics of Water Hazards in China’s Coal Mines: A Review. Mine Water Environ. 2021, 40, 325–333. [Google Scholar] [CrossRef]
  17. Sun, W.; Liu, H.; Cao, Z.; Yang, H.; Li, J. Mechanism Analysis of Floor Water Inrush Based on Criteria Importance though Intercrieria Correlation. Water 2023, 15, 232. [Google Scholar] [CrossRef]
  18. Yin, H.; Zhou, W.; LaMoreaux, J.W. Water inrush conceptual site models for coal mines of China. Environ. Earth Sci. 2018, 77, 746. [Google Scholar] [CrossRef]
  19. Zhou, X.-P.; Wang, Y.-T.; Shou, Y.-D. Hydromechanical bond-based peridynamic model for pressurized and fluid-driven fracturing processes in fissured porous rocks. Int. J. Rock Mech. Min. Sci. 2020, 132, 104383. [Google Scholar] [CrossRef]
  20. Huang, C.; Dong, W.; Cao, Z.; Wang, Y.; An, G.; Chen, H.; Jia, Y.; Pan, Q. Water Inrush Mechanism of Fault Zone in Karst Tunnel under Fluid-Solid Coupling Field considering Effective Stress. Geofluids 2022, 2022, 4205174. [Google Scholar] [CrossRef]
  21. Song, W.; Liang, Z. Theoretical and numerical investigations on mining-induced fault activation and groundwater outburst of coal seam floor. Bull. Eng. Geol. Environ. 2021, 80, 5757–5768. [Google Scholar] [CrossRef]
  22. Zhang, S.; Guo, W.; Li, Y.; Sun, W.; Yin, D. Experimental simulation of fault water inrush channel evolution in a coal mine floor. Mine Water Environ. 2017, 36, 443–451. [Google Scholar] [CrossRef]
  23. Li, Q.; Meng, X.; Liu, Y. Sensitivity analysis of water inrush evaluation model based on the theory of water resistant key strata: A case study in a coal mine, China. Earth Sci. Inform. 2022, 15, 2481–2494. [Google Scholar] [CrossRef]
  24. Liu, S.; Liu, W.; Huo, Z.; Song, W. Early warning information evolution characteristics of water inrush from floor in underground coal mining. Arab. J. Geosci. 2019, 12, 30. [Google Scholar] [CrossRef]
  25. Sun, J.; Hu, Y.; Zhao, G. Relationship between water inrush from coal seam floors and main roof weighting. Int. J. Min. Sci. Technol. 2017, 27, 873–881. [Google Scholar] [CrossRef]
  26. Hu, Y.; Liu, W.; Ma, T.; Yang, R.; Liang, D. Analysis on the Stability of the Inclined Water-Resisting Roof Layer While Mining under the Confined Aquifer. Geotech. Geol. Eng. 2019, 37, 995–1006. [Google Scholar] [CrossRef]
  27. Wang, J.; Xue, Y.; Zhou, M.; Lv, B.; Li, P. Study on Water/mud Inrush of Tunnel Inclined Shaft Based on Material Point Method. IOP Conf. Ser. Earth Environ. Sci. 2020, 570, 022062. [Google Scholar] [CrossRef]
  28. Wu, L.; Zhang, J.; Wang, Z.; Ma, D.; Wang, G. Research on formation mechanism of the mining-induced horizontal fractures in rock strata separation in the Jurassic coalfield, Huang long, Shaanxi, China. Energy Rep. 2022, 8, 9711–9723. [Google Scholar] [CrossRef]
  29. Wu, L.; Bai, H.; Ma, D. Prediction and Prevention of Water Inrush Hazards from Bed Separation Space. Mine Water Environ. 2021, 40, 657–670. [Google Scholar] [CrossRef]
  30. Tang, J.; Bai, H.; Yao, B.; Wu, Y. Theoretical analysis on water-inrush mechanism of concealed collapse pillars in floor. Min. Sci. Technol. 2011, 21, 57–60. [Google Scholar] [CrossRef]
  31. Sun, J.; Wang, L.G.; Hou, H.Q. Research on water-isolating capacity of the compound water-resisting key strata in coal seam floor. Zhongguo Kuangye Daxue Xuebao/J. China Univ. Min. Technol. 2013, 42, 560–566. [Google Scholar]
  32. Sun, G.; Zhang, R.; Tian, K. Experimental study of the evolution of permeability in coal containing gas during short-term creep under multi-stage loading. J. Mines Met. Fuels 2018, 66, 414–422. [Google Scholar]
  33. Zhu, W.C.; Wei, C.H. Numerical simulation on mining-induced water inrushes related to geologic structures using a damage-based hydromechanical model. Environ. Earth Sci. 2011, 62, 43–54. [Google Scholar] [CrossRef]
  34. Zhu, W.C.; Tang, C.A. Micromechanical Model for Simulating the Fracture Process of Rock. Rock Mech. Rock Eng. 2004, 37, 25–56. [Google Scholar] [CrossRef]
  35. Rutqvist, J.; Tsang, C.-F. A study of caprock hydromechanical changes associated with CO2-injection into a brine formation. Environ. Geol. 2002, 42, 296–305. [Google Scholar] [CrossRef]
  36. Li, L.; Yang, T.; Liang, Z.; Zhu, W.; Tang, C. Numerical investigation of groundwater outbursts near faults in underground coal mines. Int. J. Coal Geol. 2011, 85, 276–288. [Google Scholar] [CrossRef]
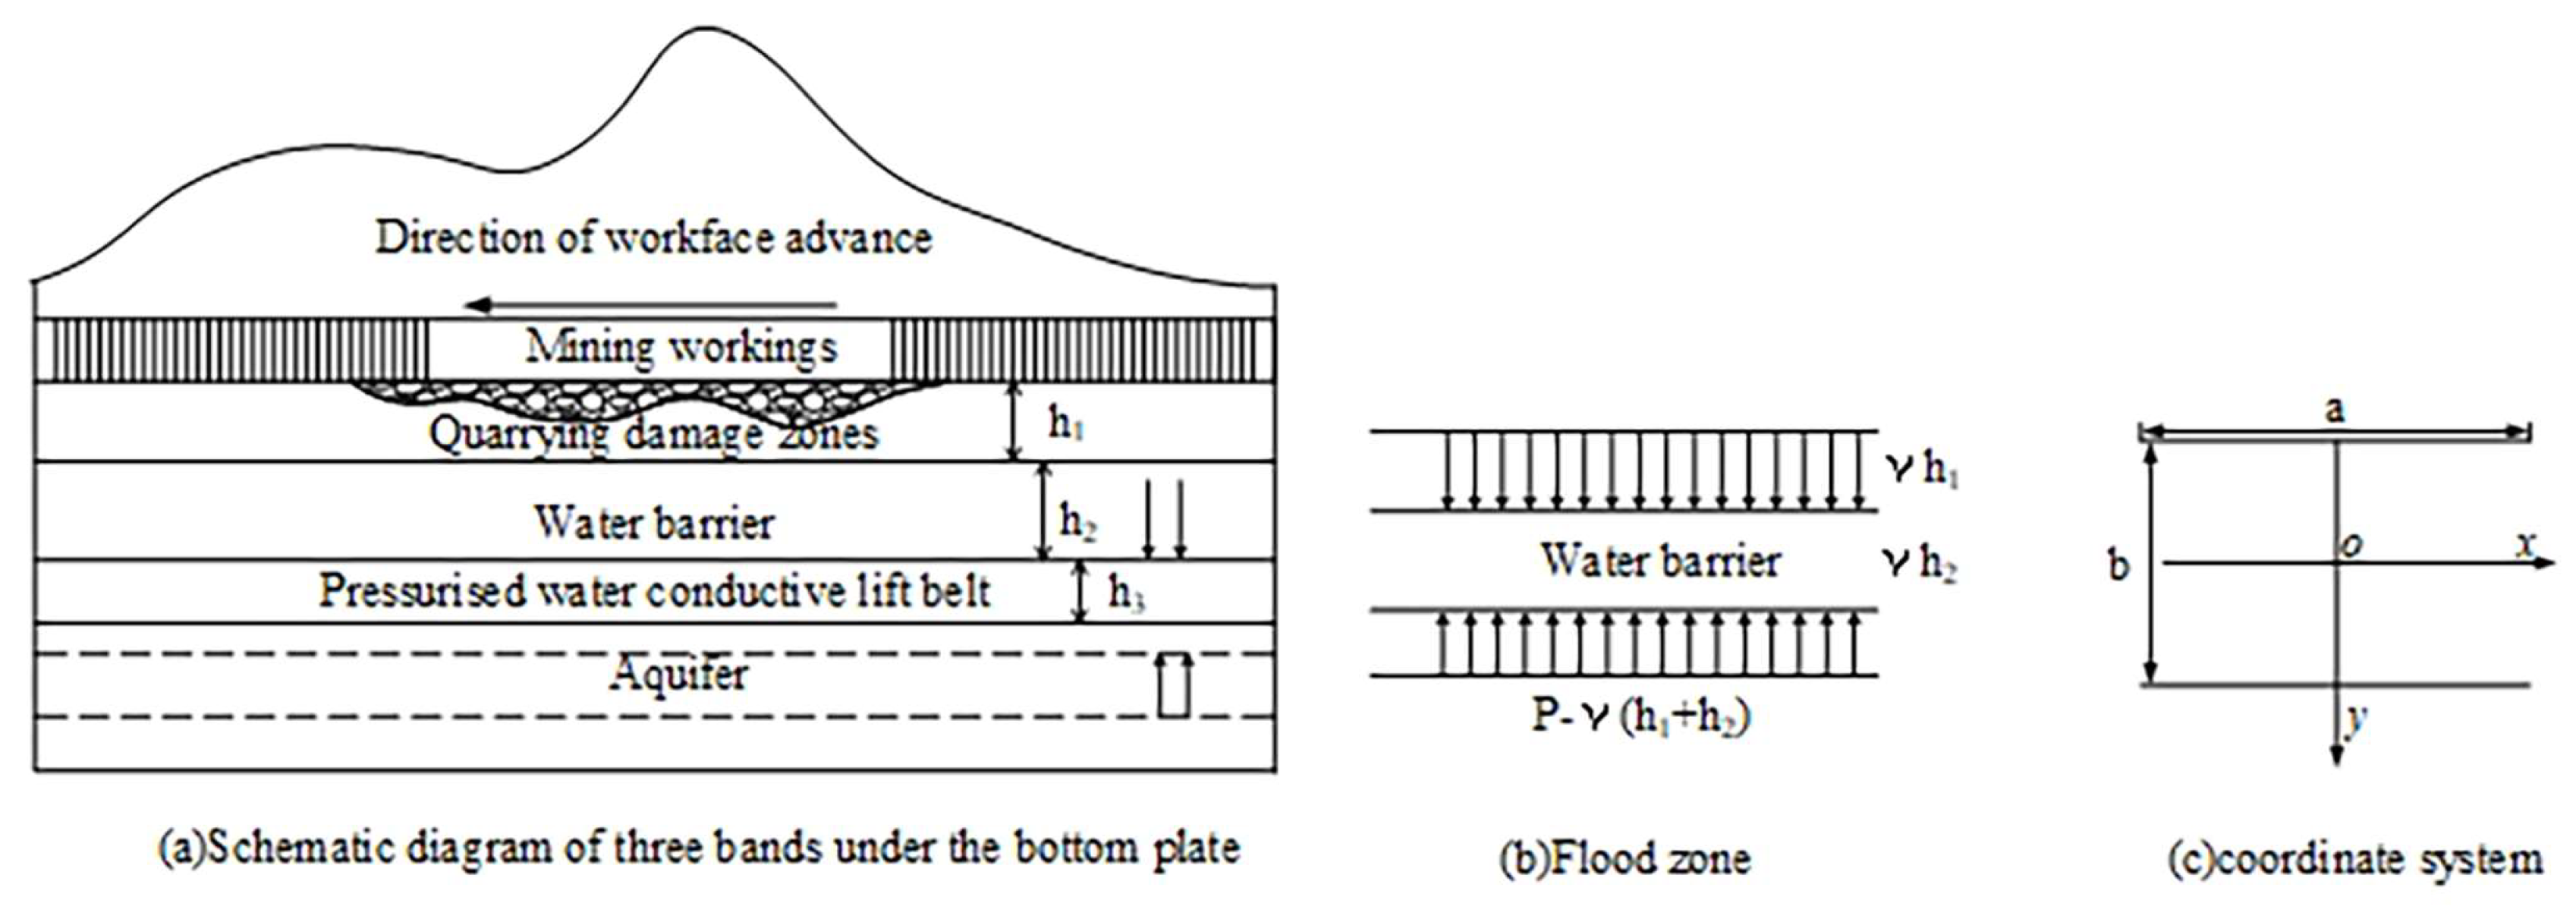
Figure 1. Plate model theoretical analysis chart.
Sustainability 15 07844 g001
Figure 2. Flow-solid-damage coupling mechanism.
Sustainability 15 07844 g002
Figure 3. Flow-solid-damage coupling model.
Sustainability 15 07844 g003
Figure 4. Coal seam propulsion damage under 1 MPa water pressure. (a) Mining distance 100 m; (b) Mining distance 150 m; (c) Mining distance 200 m; (d) Mining distance 250 m; (e) Mining distance 300 m.
Sustainability 15 07844 g004
Figure 5. Mining distance 100 m with water pressure of the floor damage. (a) Water pressure 1 MPa; (b) Water pressure 2 MPa; (c) Water pressure 3 MPa.
Sustainability 15 07844 g005
Figure 6. Mining distance 150 m with water pressure of the floor damage. (a) Water pressure 1 MPa; (b) Water pressure 2 MPa; (c) Water pressure 3 MPa.
Sustainability 15 07844 g006
Figure 7. Mining distance 200 m with water pressure change of floor damage. (a) water pressure 1 MPa; (b) water pressure 2 MPa; (c) Water pressure 3 MPa.
Sustainability 15 07844 g007
Figure 8. Mining distance 250 m with water pressure change of floor damage. (a) Water pressure 1 MPa; (b) Water pressure 2 MPa; (c) Water pressure 3 MPa.
Sustainability 15 07844 g008
Figure 9. Mining 200 m of vertical stress distribution. (a) 1 MPa, 200 m; (b) 2 MPa, 200 m; (c) 3 MPa, 200 m.
Sustainability 15 07844 g009
Figure 10. Mining 300 m of vertical stress distribution. (a) 1 MPa, 300 m; (b) 2 MPa, 300 m; (c) 3 MPa, 300 m.
Sustainability 15 07844 g010
Figure 11. Mining 200 m deflection at water pressure. (a) 1 MPa, 200 m; (b) 2 MPa, 200 m; (c) 3 MPa, 200 m.
Sustainability 15 07844 g011
Figure 12. Mining 300 m deflection at water pressure. (a) 1 MPa, 300 m; (b) 2 MPa, 300 m; (c) 3 MPa, 300 m.
Sustainability 15 07844 g012
Figure 13. Critical water inrush damage condition. (a) 1 MPa, 300 m; (b) 2 MPa, 230 m; (c) 3 MPa, 180 m.
Sustainability 15 07844 g013
Table 1. Physical and mechanical parameters of rock formations.
Rock
Formation
Density
/(kg/m3)
Elastic
Modulus
/GPa
Poisson’s
Ratio
Cohesion
/MPa
Internal Friction Angle
/(°)
Tensile Strength
/MPa
Permeability Coefficient
/(10−8 m/s)
Porosity
Roof 2700240.328.9281.90.890.009
Coal seam150040.351.7360.21.90.12
Bottom plate2710230.2615402.10.820.008
Disclaimer/Publisher’s Note: The statements, opinions and data contained in all publications are solely those of the individual author(s) and contributor(s) and not of MDPI and/or the editor(s). MDPI and/or the editor(s) disclaim responsibility for any injury to people or property resulting from any ideas, methods, instructions or products referred to in the content.